housing recovery on the gulf coast - phase ii (results - hud user
TRANSCRIPT

HOUSING RECOVERYON THE GULF COAST
PHASE IIResults of Property Owner Survey in Louisiana, Mississippi, and Texas
U.S. Department of Housing and Urban Development | Office of Policy Development and Research

Visit PD&R’s website
www.hud.gov/policy or www.huduser.org to find this report and others sponsored by HUD’s Office of Policy Development and Research (PD&R). Other
services of HUD USER, PD&R’s Research and Information Service include listservs, special interest and
bimonthly publications (best practices, significant studies from other sources), access to public use databases,
and a hotline (1-800-245-2691) for help with accessing the information you need.

Housing Recovery on the Gulf Coast, Phase IIResults of Property Owner Survey in Louisiana, Mississippi, and Texas
Prepared for
U.S. Department of Housing and Urban Development Office of Policy Development and Research
Prepared by Jennifer Turnham Kimberly Burnett Carlos Martín Tom McCall Randall Juras Jonathan Spader
August 2011

Iam pleased to share this report from the U.S. Department of Housing and Urban Development (HUD), Housing Recovery on the Gulf Coast, Phase II: Results of Property Owner Survey in Louisiana, Mississippi, and Texas. The report presents findings from a survey of 722 owners of owner-occupied and small rental residential properties that suffered major
or severe damage from Hurricanes Katrina and Rita in 2005. This report, along with the Phase I report HUD published in December 2010, provides insight into how HUD programs can help communities more effectively recover from disasters.
This report is particularly significant in light of recent flood damage up and down the East Coast. Congress frequently provides supplemental appropriations through HUD’s Community Development Block Grant (CDBG) program to help communities recover from natural and manmade disasters. These Disaster Recovery Grants have been used to help New York City recover from the attack on the World Trade Center on September 11, 2001; to help towns in the upper Midwest recover from severe flooding in 1993, 1997, and 2008; and to help the Gulf Coast in the wake of the devastating hurricanes of 2005 and 2008.
The research reports on the experiences of households directly affected by Hurricanes Katrina and Rita, with the goal of drawing lessons from those trying to rebuild their homes and lives. For these families, three factors were most important in determining whether to rebuild their home: (1) whether they were covered by insurance, (2) the extent of storm damage, and (3) if there was extensive flood damage (as opposed to wind damage). These responses highlight the importance of homeowners and flood insurance, particularly for households in disaster-prone areas.
This study also examines two different models for providing homeowner assistance. Texas implemented a traditional home repair and rehabilitation model, in which housing assistance was directly tied to the home for the exclusive purpose of rebuilding. This program served roughly 1,000 households. In contrast, Mississippi and Louisiana were forced to operate at much larger scales, serving approximately 28,000 and 129,000 households, respectively. As a result, these states received a waiver enabling them to provide homeowner assistance in the form of a “compensation” grant, which did not have to be used for rebuilding.
The rehab model employed by Texas appears to have resulted in more complete application of funds to rebuilding, in keeping with the program’s design. However, households in Louisiana and Mississippi that moved instead of rebuilding their home report being more satisfied with their neighborhood than those that stayed in their previous neighborhood. A housing assistance model that allows or encourages households to move rather than rebuild in high-risk areas could
FOREWORD
Foreword

both improve the quality of life for affected households and mitigate future risks. This study suggests that both approaches may be appropriate, depending on the scope of the damage and the community’s plan for recovery.
The federal government plays an important role in response to, and recovery from, natural disasters. HUD hopes that this research helps to inform that role and to help disaster-affected communities recover faster and more fully.
Raphael W. Bostic, Ph.D. Assistant Secretary for Policy Development and Research
Foreword

i
HOUSING RECOVERY ON THE GULF COAST, PHASE IIResults of Property Owner Survey in Louisiana, Mississippi, and Texas
Table of Contents
Contents
Acknowledgments ������������������������������������������������������������������������������������������������������������� vii
Executive Summary ����������������������������������������������������������������������������������������������������������viii
1� Introduction �����������������������������������������������������������������������������������������������������������������1
1.1 Background ................................................................................................................ 2
1.2 Key Findings from the Phase I Report .......................................................................... 5
1.3 Purpose of the Phase II Report .................................................................................... 6
1.4 Phase II Research Questions ........................................................................................ 7
1.5 Organization of the Phase II Report ............................................................................ 7
2� Data Collection and Analysis Methodology ��������������������������������������������������������������������9
2.1 Study Data Sources ..................................................................................................... 9
2.2 Selecting the Owner Survey Sample ........................................................................... 11
2.3 Approach to Conducting the Property Owner Survey ................................................. 14
2.4 Survey Response Rates .............................................................................................. 17
2.5 Response Bias ........................................................................................................... 19
2.6 Sampling Weights ..................................................................................................... 19
2.7 Final Sample Characteristics ...................................................................................... 20
3� Repair Needs and Rebuilding ��������������������������������������������������������������������������������������� 22
3.1 Pre-Hurricane Conditions and Hurricane Damage ..................................................... 22
3.2 Property Ownership in 2011 ..................................................................................... 28
3.3 Housing Conditions in 2011 ..................................................................................... 32
3.4 Rebuilding Activity Since 2005 ................................................................................. 36
3.5 Reasons for Not Rebuilding ...................................................................................... 45
3.6 Summary of Chapter Findings ................................................................................... 46
4� Owner and Property Factors Affecting Rates of Rebuilding ������������������������������������������� 49
4.1 Definition of Rebuilding ........................................................................................... 49
4.2 Property-Level Characteristics ................................................................................... 51

ii
4.3 Owner Characteristics ............................................................................................... 53
4.4 Multivariate Analysis................................................................................................. 55
4.5 Summary of Chapter Findings ................................................................................... 58
5� Funding for Rebuilding and CDBG Programs �������������������������������������������������������������� 60
5.1 Rates of CDBG Receipt ............................................................................................ 60
5.2 Use of CDBG Funds ................................................................................................. 65
5.3 Resources for Rebuilding ........................................................................................... 67
5.4 Resource Gaps and Use of Personal Funds .................................................................. 70
5.5 Resources and Rebuilding ......................................................................................... 75
5.6 Owner Experiences with the Different Program Models .............................................. 85
5.7 Summary of Chapter Findings ................................................................................... 88
Appendix A� State CDBG Program Descriptions ���������������������������������������������������������������� 90
Appendix B� Overview of the Property Owner Survey ��������������������������������������������������������� 94
Appendix C� Property Owner Survey Nonresponse Bias Analysis and Adjustment �������������� 102
Appendix D� Rates of Application to the CDBG Program ������������������������������������������������� 108
Table of Contents (Continued)
Contents (Continued)

iiiList of Exhibits
List of Exhibits
Exhibit 1-1. Housing Unit Damage Estimates by State ...............................................................3
Exhibit 1-2. Summary of CDBG-Funded Homeowner Programs ................................................4
Exhibit 2-1. Initial Allocation of Telephone Survey Sample ....................................................... 13
Exhibit 2-2. Survey Response Rates by Subgroups of Interest .................................................... 17
Exhibit 2-3. Characteristics of the Survey Sample: State and Owner Status at Time of Survey ............................................................................................................. 18
Exhibit 2-4. Characteristics of the Survey Sample: Occupancy at Time of Hurricanes ................ 21
Exhibit 2-5. Characteristics of the Survey Sample: CDBG Receipt ............................................ 21
Exhibit 3-1. Pre-Hurricane Property Condition by State and Overall ........................................ 23
Exhibit 3-2. Pre-Storm Home Values by State .......................................................................... 23
Exhibit 3-3. Owner-Reported Assessed Damage Amount by State—Median and by Percentile ....................................................................................................... 24
Exhibit 3-4. Share of Properties Leveled, Condemned, or Demolished ...................................... 25
Exhibit 3-5. Parts of Homes that Sustained Damage: Proportion with Damage .......................... 26
Exhibit 3-6. Type of Storm Damage Reported by State ............................................................. 26
Exhibit 3-7. Current Condition by Type of Hurricane Damage Reported .................................. 27
Exhibit 3-8. Ownership of Hurricane-Affected Properties in 2011 ............................................ 28
Exhibit 3-9. Buyers for Properties Sold after the Hurricanes ..................................................... 28
Exhibit 3-10. Year that 2005 Owners Ceased Owning Hurricane-Damaged Property ................... 29
Exhibit 3-11. Association Between Pre-Storm Property Characteristics and Change in Ownership .......................................................................................................... 30
Exhibit 3-12. Total Dollar Amount of Assessed Damage as Reported by Owners.......................... 31
Exhibit 3-13. Association Between Damage Extent and Change in Ownership** ......................... 32
Exhibit 3-14. Owner-Reported Condition of Properties in Early 2011 by State and Overall ......... 33
Exhibit 3-15. Current Housing of 2005 Owner-Occupiers Living Elsewhere in Early 2011 .......... 34
Exhibit 3-16. Owner-Reported Condition of Current Housing Occupied by Movers and Stayers ................................................................................................................ 34
Exhibit 3-17. Satisfaction with Current Neighborhood for Movers and Stayers ............................ 35
Exhibit 3-18. Reasons for Not Returning to Pre-Hurricane Neighborhood .................................. 35

ivList of Exhibits (Continued)
Exhibit 3-19. Extent of Rebuilding Activities ............................................................................. 36
Exhibit 3-20. Extent of Rebuilding Activities by State ................................................................ 37
Exhibit 3-21. Rebuilding by Continuing and Former Owners ..................................................... 37
Exhibit 3-22. Year Repair or Rebuilding Work Started ................................................................ 38
Exhibit 3-23. Year Repair or Rebuilding Work Was Completed ................................................... 39
Exhibit 3-24. Year Repair or Rebuilding Work Was Completed by State, Cumulative ................... 39
Exhibit 3-25. Pre-Hurricane Elevation Status ............................................................................. 40
Exhibit 3-26. Elevation Activity ................................................................................................ 41
Exhibit 3-27. Completed Elevation Activity by CDBG Receipt ................................................... 41
Exhibit 3-28. Type of Rebuilding .............................................................................................. 42
Exhibit 3-29. Estimated Cost of Repairs or Rebuilding to Address Hurricane Damage ................. 42
Exhibit 3-30. Estimated Cost of Repairs or Rebuilding to Address Hurricane Damage by State ............................................................................................................... 43
Exhibit 3-31. Association Between Rate of Rebuilding and Blocks with Concentrated Damage .............................................................................................................. 44
Exhibit 3-32. Association Between Pre-Storm and Post-Storm Neighborhood Satisfaction and Blocks with Concentrated Damage ................................................................ 44
Exhibit 3-33. Big Reasons for Not Rebuilding Among Owners Who Undertook No Repair/Rebuilding .......................................................................................................... 45
Exhibit 4-1. Alternative Owner-Reported Measures of Rebuilding (Continuing Owners Only) .................................................................................. 50
Exhibit 4-2. Rebuilding Status by State and Tenure .................................................................. 51
Exhibit 4-3. Association Between Property Characteristics and Rebuilding Status: Mortgage and Insurance Presence, Insurance Coverage, and Home Value ............... 52
Exhibit 4-4. Association Between Property Characteristics and Rebuilding Status: Type, Extent, and Value Relative to Property Value of Damage and Cost of Repairs ............................................................................................................ 53
Exhibit 4-5. Association Between Owner Characteristics and Rebuilding Status ......................... 54
Exhibit 4-6. Association Between Mortgage Presence and Property Insurance ............................ 55
Exhibit 4-7. Regression Analysis Results .................................................................................. 56
Exhibit 5-1. CDBG Receipt Among Properties in the Owner Survey Sample by State ................ 61
List of Exhibits (Continued)

v
Exhibit 5-2. CDBG Receipt by Option in Louisiana ................................................................ 62
Exhibit 5-3. Distribution of CDBG Award Amounts, Homeowners Only .................................. 62
Exhibit 5-4. Owner Characteristics of CDBG Recipients and Nonrecipients, Homeowners Only .............................................................................................. 63
Exhibit 5-5. Characteristics of CDBG Recipient and Nonrecipient Properties, Homeowners Only .............................................................................................. 64
Exhibit 5-6. Share of CDBG Homeowner Grant Funds Used for Repair/Rebuilding, Louisiana and Mississippi Homeowners Only ....................................................... 66
Exhibit 5-7. Common Uses of CDBG Homeowner Grants for Activities Other than Repair/Rebuilding, Louisiana and Mississippi Homeowners Only ..................................... 67
Exhibit 5-8. Total Amount of Resources (Including CDBG and Other Sources) Among CDBG Recipients and Nonrecipients, Homeowners Only ................................................. 68
Exhibit 5-9. CDBG Grant Relative to Total Amount of Resources of CDBG Recipients by State, Homeowners Only .............................................................................................. 69
Exhibit 5-10. Percentage of Owners Reporting Other Sources of Funding (Other than CDBG) and Median Amount Reported from Each Other Source, Homeowners Only .......... 70
Exhibit 5-11. Owners Reports on the Sufficiency of Total Funding by CDBG and Non-CDBG Receipt, Homeowners Only ................................................................................. 71
Exhibit 5-12. Total Resources Relative to Owner-Reported Damage Assessments, Homeowners Only ................................................................................................................... 71
Exhibit 5-13. Use of Personal Funds to Cover Rebuilding Expenses, Homeowners Only .............. 72
Exhibit 5-14. Sources of Personal Funds Used for Rebuilding, Homeowners Only ....................... 73
Exhibit 5-15. Median Assessed Damage, Total Funding Assistance, and Repair Costs for All Owners, by State ................................................................................................. 73
Exhibit 5-16. Median Assessed Damage, Total Funding Assistance, and Repair Costs Among CDBG Recipients Only by State ...................................................................................... 74
Exhibit 5-17. Median Assessed Damage, Total Funding Assistance, and Repair Costs Among Non-CDBG Recipients by State ........................................................................... 74
Exhibit 5-18. Funding Gaps and Rebuilding by CDBG Receipt and Application Status, Homeowners Only .............................................................................................. 76
Exhibit 5-19. Funding Gaps and Rebuilding by Funding Sufficiency and Use of Personal Funds, Homeowners Only .............................................................................................. 76
List of Exhibits (Continued)
List of Exhibits (Continued)

vi
Exhibit 5-20. Property and Owner Characteristics by CDBG Receipt and Application Status, Homeowners Only .............................................................................................. 78
Exhibit 5-21. Property and Owner Characteristics by Funding Sufficiency and Use of Personal Funds, Homeowners Only ................................................................................... 80
Exhibit 5-22. Association of Presence of Funding Gap with Property Having Substantial Damage in 2010, Based on Windshield Observation (Logit Estimation) .............................. 82
Exhibit 5-23. Association of Funding Gap Amount with Property Having Substantial Damage in 2010, Based on Windshield Observation (Logit Estimation) .............................. 83
Exhibit 5-24. Association of Presence of a Funding Cap with Property Having Substantial Damage in 2010, Based on Windshield Observation (Logit Estimation) .............................. 84
Exhibit 5-25. Reported Satisfaction with the CDBG Program in Texas Among CDBG Recipients 85
Exhibit 5-26. Months to Complete Repair/Rebuilding Activities (from Repair Start to Completion) by State ............................................................................................................... 86
Exhibit 5-27. Percent of CDBG Recipients Completing Repairs by State ..................................... 87
Exhibit B-1. Respondents, Content, and Reason for Inclusion by Survey Section and Subsection 94
Exhibit C-1. Comparison of Response Rates by Geographical County/Parish ........................... 105
Exhibit C-2. Comparison of Property Characteristics Between Respondents and Nonrespondents ................................................................................................ 106
Exhibit D-1. Rates of Application to Homeowner Assistance Programs..................................... 109
Exhibit D-2. Reasons for Not Applying for a CDBG Award ..................................................... 109
List of Exhibits (Continued)
List of Exhibits (Continued)

viiAcknowledgments
The authors acknowledge the many individuals at Abt Associates and Abt SRBI who contributed to this report. Within Abt Associates, Judith Feins advised on numerous methodological and analytical questions and provided expert technical review, Nancy McGarry supported the analysis with programming and data documentation, and Missy Robinson provided desktop publishing and production support. Abt SRBI was responsible for the survey data collection, including interviewing more than 700 individuals across the country who in 2005 owned properties damaged by Hurricanes Katrina or Rita. Locating these individuals, many of whom had moved several times since the storms, was extremely challenging, and Abt SRBI made tireless efforts to achieve the highest response rate possible for the survey. The Abt SRBI team was led by Jodi Walton, with support from Ricki Jarmon and Jon Schmalz and a large team of skilled telephone and field interviewers.
The authors also thank several U.S. Department of Housing and Urban Development (HUD) staff. Paul Joice of HUD’s Office of Policy Development and Research (PD&R) served as Government Technical Monitor, assisting and supporting the Abt team at all stages of the project. In addition, several PD&R staff provided critical review and assistance over the life of the project: Todd Richardson, Dana Bres, Carol Star, Mark Shroder, Kevin Neary, and Rob Renner. HUD’s Office of Community Planning and Development (CPD) also played an important role in supporting the project and offered key programmatic insights. The CPD staff who provided comments and input for this report include Jessie Kome, Scott Davis, Jan Opper, and Mark Mitchell.
The study would not have been possible without assistance from the state agencies administering the Community Development Block Grant (CDBG) disaster assistance programs in Louisiana, Mississippi, and Texas. Staff from these agencies provided background information on their CDBG-funded programs at the start of the project and made property-level data on CDBG recipients available to HUD for use in this study. Particular thanks is due to David Bowman of the Louisiana Recovery Authority, Daron Wilson of the Mississippi Development Authority, and Kelly Crawford of the Texas Department of Housing and Community Affairs.
Finally, the authors thank the 722 hurricane survivors who shared their time to explain their experiences with rebuilding in the wake of Hurricanes Katrina and Rita. Their generosity and willingness to revisit a very difficult time in their lives made possible the findings of this report. Their insights will play an important role in informing future research and policy on disaster assistance.
ACKNOWLEDGMENTS

viiiExecutive Summary
EXECUTIVE SUMMARYABSTRACT OF FINDINGSThis report is the second of two prepared for a study of the uses of Community Development Block Grant (CDBG) disaster assistance funds for housing recovery after Hurricanes Katrina and Rita in Louisiana, Mississippi, and Texas. The report presents the findings of a survey of 722 owners of owner-occupied and small rental residential properties that suffered major or severe damage from the 2005 hurricanes and were located on blocks significantly affected by the hurricanes. The survey sample includes 345 owners who received CDBG funds for rebuilding or as compensation for hurricane damage and 377 owners who did not receive CDBG funds. The survey provides owner-reported information on the condition of these properties prior to the hurricanes and as of early 2011, on the type and extent of damage caused by the hurricanes, on changes in ownership since 2005, and on the reasons why some owners rebuilt and others did not. The information presented in this report supplements information provided in the Phase I report, which analyzed the effects of CDBG receipt on rebuilding for a much larger sample of properties but did not include the information on owner characteristics, property characteristics, and sources of funding (other than CDBG).1
INTRODUCTION TO THE STUDYBetween August 29 and October 24, 2005, Hurricanes Katrina, Rita, and Wilma caused massive devastation in the Gulf Coast region, damaging more than 1 million housing units across five states. In response to
1 Turnham, et al., Housing Recovery on the Gulf Coast, Phase I: Results of Windshield Observations in Louisiana, Mississippi, and Texas (HUD, 2010): http://www.hu-duser.org/portal/publications/commdevl/hsgrec_gulfcoast1.html. This document is referred to as the Phase I report from this point on.
the widespread destruction caused by the hurricanes, Congress appropriated $19.7 billion in supplemental Community Development Block Grant (CDBG) program funds for Gulf Coast disaster recovery. Three states—Louisiana, Mississippi, and Texas—received 99 percent of the supplemental CDBG funds. The states used the funds, in large part, to compensate property owners for their losses and to assist with rebuilding through such programs as Road Home in Louisiana, the Mississippi Development Authority (MDA) Homeowner Assistance Program in Mississippi, and the Homeowner Assistance Program in Texas.
In Texas, the CDBG program model was a rehabilitation model, in which the state made payments to contractors to rebuild the homes rather than making direct awards to individual property owners. Louisiana and Mississippi implemented compensation models, in which the state made grants to owners directly and owners were responsible for paying for and managing their own rebuilding work. There were also provisions in Louisiana and Mississippi for compensating owners who chose to sell their homes rather than try to rebuild.
The purpose of this study, Housing Recovery on the Gulf Coast, Phase II, is to assess the state of housing recovery in the states hardest hit by Hurricanes Katrina and Rita—Louisiana, Mississippi, and Texas—and to examine the role of supplemental CDBG funds in supporting that recovery. The study’s main research questions are these:
1. What is the overall state of housing recovery in areas most affected by Hurricanes Katrina and Rita?
2. What factors have affected the extent of housing recovery?

ix
3. What role have the CDBG-funded programs played in housing recovery?
4. How do housing outcomes and owner experiences differ by state and CDBG program model?
The study has three main data collection components:
Windshield observations of a sample of hurricane-damaged homes in Louisiana, Mississippi, and Texas to provide estimates of housing recovery.
•Collection of administrative data from the CDBG programs in each of the three states.
•A telephone survey of owners of hurricane-damaged homes to discuss their decisions about whether to rebuild after the storms.
This report is the second of two reports prepared for the study. It focuses on the efforts of owners of damaged housing to rebuild after the hurricanes, drawing primarily on information gathered through the telephone survey. The report presents new information on the rebuilding status of properties as of early 2011 and analyzes the factors affecting owners’ decisions about whether to sell their storm-damaged homes or to stay and rebuild.
SAMPLING AND DATA COLLECTION APPROACHThe findings in this report are based primarily on analysis of data from the property owner survey with a sample of 722 owners of residential properties damaged by Hurricanes Katrina and Rita. The survey was conducted by telephone between late September 2010 and early May 2011 by trained interviewers from Abt SRBI Inc., a national survey firm that is a subsidiary of Abt Associates Inc. The survey took about 30 minutes to complete and collected detailed information from owners on: the pre-hurricane characteristics of their properties, including tenure, condition, and estimated value; the damage caused by the hurricanes; financial assistance and other funding used for repair and rebuilding activities; uses of CDBG assistance;
reasons for not rebuilding; and current housing and neighborhood conditions.
The survey focused on the 2005 owners of hurricane-damaged properties, about one-fifth of whom no longer owned the property at the time of the survey. The starting point for the survey was a sample of 1,400 properties that had suffered major or severe damage from Hurricanes Katrina and Rita as assessed by the Federal Emergency Management Agency (FEMA) and that were located on census blocks where at least three properties had suffered major or severe storm damage (known as significantly affected blocks or [SABs]).2 Nearly all the properties selected for the survey sample were part of the 2010 windshield observation sample that was the focus of the first phase of this study.3 The owner survey sample was designed to provide unbiased estimates for the population of 2005 owners of residential properties that were located on significantly affected blocks in Louisiana, Mississippi, and Texas that had suffered major or severe storm damage.
The survey sample was also selected to produce a sufficient number of responses from key subgroups of interest—such as owners of rental properties and homeowners, owners who received CDBG assistance and those who did not, and owners of properties that were rebuilt and not rebuilt—to permit nuanced analysis of rebuilding efforts and the effects of CDBG funding in each state. Unlike the windshield observation sample, the owner survey sample was not intended to produce accurate estimates for lower levels of geography because the sample size was not sufficiently large.
The survey team faced a number of hurdles to identifying, locating, and interviewing the 2005 owners of storm-damaged properties 5 years after the hurricanes. Many 2005 owners could not be
2 Properties were assessed for damage by FEMA following a request by the owner for FEMA assistance. Based on the FEMA assessments, the properties were determined to have severe, major, minor, or no damage. In this report, we assume that all properties assessed by FEMA were affected by the hurricanes, even if they received an assessment of no damage.
3 To increase the owner survey sample size in Texas we included some properties that were not included in windshield observations in 2010.
Executive Summary (Continued)

x
located through local tax assessor data or databases maintained by private vendors; others were reluctant to participate in the survey, citing fatigue with discussing the hurricanes and continuing hardship and disappointment in their rebuilding efforts. The survey team took many months to identify and locate owners and tried a number of ways to gain the owners’ cooperation. In the end, the survey completed interviews with 722 of 1,400 potential respondents (a 52 percent response rate).
To ensure that this unusually low response rate did not affect the survey findings, we created statistical weights to adjust for bias in the sample. We also weighted the survey data to provide more accurate representation of the owner population, by state. The findings presented in this report represent unbiased estimates for the 2005 owners of residential properties assessed by FEMA following the 2005 hurricanes as having major or severe storm damage and located on significantly affected blocks in Louisiana, Mississippi, and Texas. The estimates are not representative of all owners of properties on significantly affected blocks or all owners of hurricane-damaged properties in general.
STUDY FINDINGSThis report builds on the 2010 analysis of windshield observations of hurricane-damaged properties, using a survey of a sample of people who owned these properties at the time of the storms. The survey responses provide information on rebuilding work to date and remaining repair needs, the reasons why owners chose to rebuild or not, and the sources of funding they used to repair or rebuild their homes.
Repair Needs and RebuildingIn 2011, more than 5 years after the storms, the housing stock has not fully recovered from the effects of Hurricanes Katrina and Rita, according to owners of storm-damaged properties on significantly affected blocks. While most of these owners thought their properties were in good condition before the 2005 hurricanes, ratings of property conditions were
substantially lower as of early 2011. More than 90 percent of owners in Louisiana and Mississippi and 85 percent of owners in Texas rated their homes as having been in excellent or good condition before the hurricanes. Nearly 6 years later, among owners who still owned their properties, the proportion who rated their properties to be in excellent or good condition ranged from 75 percent in Louisiana to 71 percent in Texas.4
The deterioration in the condition of the housing stock between late summer 2005 and early 2011 is the result of a combination of factors, including the pre-storm construction quality of affected properties, the severity of storm damage, and the progress of rebuilding efforts to date. The decisions and actions related to rebuilding efforts are complex. Among all owners, including those who had sold their properties after the hurricanes, 77 percent reported that they had done some rebuilding work to address hurricane damage. In most cases, the rebuilding consisted of repairs to an existing structure rather than construction of a completely new home. Relatively little of the repair and rebuilding work involved elevating the property. Across the three states, less than 10 percent of owners of properties with major or severe storm damage on SABs had completed elevation work on their properties as of early 2011, a finding that is consistent with the windshield observations from 2010.
Rebuilding efforts are also related to owners’ decisions about whether to sell their properties after the hurricanes or to stay and rebuild. Most owners (82 percent) retained ownership of their homes, and 86 percent of this group reported rebuilding. The remaining 18 percent of the owners sold the property or ceased owning for other reasons (usually within 2 years of the hurricanes), and only 34 percent of this group reported doing any rebuilding.
4 Although the owner survey did not collect information on the 2011 condition of properties that had changed hands since the hurricanes, evidence from the windshield observations conducted for the first phase of the study suggests that properties that changed ownership were less likely to be in good condition in 2011 than those retained by the same owner. See Turnham, et al., 2010.
Executive Summary (Continued)

xi
The survey findings suggest that, as of early 2011, little additional repair and rebuilding work was actively under way or still planned for the future. Most owners who did any rebuilding began the work in 2005 and 2006 and, if they completed rebuilding, finished it by 2008. As of early 2011, not many 2005 owners reported that they were still actively rebuilding their properties, although properties that were sold may be undergoing repairs or rebuilding by their new owners. Among continuing owners who had not done any rebuilding as of 2011, about two-thirds (63 percent) reported that they did not intend to rebuild or did not know if they planned to rebuild.
For owners who did not rebuild, the most commonly cited reason was not having sufficient funds to pay for the work, including: not having enough money on hand to do the work, not being able to get a loan to do the work, or waiting for a grant or other kind of financial assistance to get the work done. More than one-third of owners who did not rebuild cited the inability to obtain flood insurance as an important reason for not rebuilding. Among those who did not cite funding gaps as a reason for not rebuilding, nearly one-half stated that their lack of rebuilding was delayed because they were considering selling.
A significant proportion of the owner survey sample had relocated to a new neighborhood since the hurricanes and had not returned to their old neighborhood. About one-fourth of the owner survey sample reported that as of 2011 they were no longer living in the house that was damaged in the storm. This group includes owners who sold their properties as well as people who retained ownership of the damaged property but were living elsewhere. About 60 percent, or two-thirds, of those who had relocated lived in a different house than they owned, but the rest were renting (18 percent), living with family or friends (18 percent), or in some other type of housing situation (3 percent).
Despite this displacement, the evidence suggests that those who moved may be better off in terms of
neighborhood satisfaction than those who stayed. Survey respondents who had moved were significantly more likely to report being very satisfied with their new neighborhood, compared with those who had stayed where they were in 2005. Owners in new neighborhoods were also significantly more likely to describe those neighborhoods as very safe during the day and at night. Given these views, it is not surprising that two-thirds of owners in new neighborhoods had no plans to move back.
Among owners who stayed where they lived in 2005, the people living on blocks that suffered more extensive hurricane damage in 2005 were significantly less likely to be satisfied with the neighborhood in early 2011 than people living on blocks where the hurricane damage was less extensive.
Owner and Property Factors Affecting Rates of RebuildingWe analyzed the factors affecting rebuilding using a measure of rebuilding that was based on the owner ratings of the condition of their properties as of early 2011. A property was considered rebuilt as of 2011 if the owner rated its condition as excellent or good. Because all properties in the survey sample were assumed to have had hurricane damage in 2005, a property in excellent or good condition as of 2011 is assumed to have been substantially repaired or rebuilt.
This measure of rebuilding is similar to the one used in the Phase I report, which was based on windshield observations made in 2010, but uses more recent information and takes advantage of the owners’ more detailed knowledge of the condition and repair needs of the property. However, the owner-based rebuilding measure is available only for those properties that had the same owner in both 2011 and 2005, which is 82 percent of the survey sample.
Overall, three-fourths of properties still owned by the 2005 owner have been substantially rebuilt. Only 64 percent of continuing owners reported that their repair or rebuilding work was complete, however. This
Executive Summary (Continued)

xii
inconsistency suggests that although some owners had returned their properties to a habitable standard, the owners still thought that more work needed to be done. Rates of rebuilding were not significantly different across the three states in the study.
We used cross-tabulation and multivariate analysis to explore the relationships between rates of rebuilding and (1) pre-storm property characteristics (tenure, presence of a mortgage, presence of insurance, and owner-reported property value), (2) type and extent of hurricane damage, and (3) owner and neighborhood characteristics.
The multivariate analysis did not find any statistically significant relationship between individual owner characteristics and rebuilding. However, it did identify significant associations between property and neighborhood characteristics and rebuilding. The presence of property insurance and the extent of hurricane damage are the strongest predictors of rebuilding. The specific findings follow:
•Properties that had been insured before the hurricanes were 37 percent more likely to have been rebuilt than uninsured properties.
•Properties that had had mortgages at the time of the hurricanes were 13 percent less likely to have been rebuilt, on average, holding insurance constant.
•Properties that had experienced flood damage were 16 percent less likely to have been rebuilt as of 2011 than properties that had not experienced flood damage.
•Properties whose hurricane damage had been so extensive that the property had been leveled or demolished, or had had to be condemned, were 39 percent less likely to have been rebuilt than properties with less extensive damage.
•A 10 percent increase in the proportion of neighborhood residents with a high school
education is associated with a 7 percent increase in the probability of rebuilding.
•A 10 percent increase in the neighborhood owner-occupancy rate is associated with a 4 percent increase in the likelihood of rebuilding.
This analysis reinforces the finding from the Phase I report that the severity of damage is a strong negative predictor of rebuilding. At the same time, it shows that the presence of insurance before the hurricanes was also an important factor in rebuilding. (The Phase I report did not collect information on insurance.) Unlike the Phase I report, this analysis finds that most neighborhood characteristics are not significant factors in rebuilding. Taking into account individual factors available for this analysis, such as the presence of insurance, reduces the significance of neighborhood factors, such as the median house value, as a predictor of rebuilding.
The analysis suggests that to the people making rebuilding decisions, the average neighborhood characteristics are not as important as their own individual situations—in particular whether they had insurance, whether their mortgage was paid off, and whether their house was destroyed. Many of these individual and property characteristics are correlated with neighborhood characteristics, which is why neighborhood characteristics were significant in the model presented in the Phase I report.
Funding for Rebuilding and CDBG ProgramsA critical focus of the owner survey was the exploration of CDBG funding, its implementation, and its possible effects on rebuilding rates when compared with other funding sources. We found that slightly more than one-half of the homeowners in the owner survey sample, across all three states, had received CDBG homeowner assistance. Several significant differences in owner and property characteristics were found between CDBG recipients and non-CDBG homeowners, including many findings that are consistent with the intent of the original program:
Executive Summary (Continued)

xiii
•Properties valued at $300,000 or more by their owners before the hurricanes were less likely to have received CDBG.
•Properties that had experienced flood damage were more likely to have received CDBG.
•Owners of properties who had received CDBG assistance were more likely to be African American and more likely to be of Hispanic or Latino origin.
•Properties with higher levels of assessed damage—as reported by owners—were more likely to have received CDBG awards than properties with lower levels of assessed damage.
CDBG recipients in Texas used their funding exclusively for rebuilding, because the Texas program design required them to. Among homeowners in Louisiana and Mississippi who had received CDBG rebuilding grants, most (87 percent in Louisiana and 64 percent in Mississippi) reported using all or part of their grants for rebuilding. However, 13 percent of Louisiana recipients and 36 percent of Mississippi recipients used all or a portion of their grants for something other than rebuilding, most commonly to purchase furniture, pay for everyday expenses, and pay off a mortgage or loan.
CDBG funds were meant to fill gaps in funding from other possible sources, including homeowners insurance, flood insurance, elevation grants, FEMA’s individual assistance program, Small Business Administration (SBA) loans, state programs, churches or charities, and friends and family. CDBG recipients reported receiving about $50,000 more on average in total financial assistance (including CDBG) than owners who did not receive CDBG funds. CDBG recipients generally reported receiving other sources of funding in addition to CDBG, especially in Louisiana and Mississippi, although in many cases recipients received lower amounts from non-CDBG sources than owners who did not receive CDBG funds. This finding documents the program’s intent to fill funding gaps. More than one-third of owners overall (including both
CDBG recipients and nonrecipients) reported that the total of their funding sources was insufficient to meet their rebuilding needs. Slightly more than one-half of those reporting insufficient funding were able and willing to draw on personal funds for rebuilding work.
Rates of rebuilding varied across owners based on their access to financial assistance. Two groups of homeowners in particular showed notable lags in rebuilding: those who had applied for CDBG assistance and not received it, and those who reported that they had not received sufficient total resources to rebuild, and had been either unwilling or unable to use personal funds to supplement any assistance received. Among homeowners who applied for CDBG assistance but did not receive funds, 56 percent of properties were rebuilt compared with almost 75 percent of nonapplicants and 81 percent of CDBG recipients. The estimated rate of rebuilding was 46 percent among homeowners who reported insufficient funding and who did not, or could not, put any of their own funds into rebuilding.
The different CDBG program models within and between states were also studied in relation to the timeliness of the rebuilding and owner satisfaction with the programs. We found that CDBG recipients in Texas (rehabilitation model) reported higher rates of rebuilding completion than in the other two states (compensation model), albeit for far fewer properties. The survey data also suggests that the physical rebuilding process (as measured by the number of months between the start and completion of rebuilding) was quicker in Texas under the rehabilitation model than under the compensation model. Variations in states’ receipt of federal funds and their respective grant administration, however, led to different overall durations to complete rebuilding from time of the storm events. Finally, most survey respondents in both Louisiana and Texas were satisfied with the program processes, with insufficient sample size in Mississippi to analyze for that state.
Executive Summary (Continued)

xiv
Overall Conclusions and Policy ImplicationsThe need for rebuilding assistance after disasters will always exist. The supplemental CDBG disaster assistance program, mobilized after Hurricanes Katrina and Rita, was one of the largest efforts in U.S. history to provide property owners with direct rebuilding assistance. The findings presented in this report, along with the findings from the first phase of the study, provide preliminary lessons and policy insights of potential use in planning for, and responding to, future disasters.
The Purpose of CDBG Disaster Assistance FundsThe most critical policy question with regard to CDBG funds and future disaster assistance grants is whether these programs work. To the extent that the CDBG disaster assistance funds were intended to provide supplemental assistance for the repair and rebuilding of affected properties, they were successful. The funds largely did help owners repair and rebuild their properties. As documented in this report, 87 percent of recipients in Louisiana and 64 percent of recipients in Mississippi reported using the entire grant to repair or rebuild the hurricane-damaged property. All recipients in Texas used the entire grant for rebuilding, by definition of that state’s program model. Even when recipients were given options for the grant’s use, as was the case in Louisiana and Mississippi, most owners still chose to rebuild.
Whether CDBG receipt actually increased the rate of rebuilding among recipients as compared with nonrecipients is another question. Those recipients who opted to sell their homes either to the state or to another type of buyer left properties that were observed in 2010 to have notably lower levels of rebuilding, habitability, and occupancy. In these cases, CDBG funds did not increase repair and rebuilding, although they may have provided needed financial assistance for the recipients to reestablish themselves in new homes. The increased housing and neighborhood satisfaction reported by this group of movers is a positive outcome, although not related to rebuilding.
Excluding these sold properties, the Phase I report found that CDBG-recipient properties were nearly twice as likely to be rebuilt and about twice as likely to be reoccupied as properties without CDBG assistance. Although not as conclusive, this report, based on owner-reported information, corroborates that finding. It also suggests that a subset of the non-CDBG recipients (specifically, those who applied for CDBG funds and were not awarded) reported rebuilding at even lower rates than owners who never applied (presumably because they had other resources). In sum, additional funding helps, and CDBG funding appears to have helped in many ways.
The Amount of CDBG Disaster Assistance Awards and Incremental RebuildingAlthough the availability of CDBG awards may have played a role in many owners’ decision and ability to rebuild, they were certainly not the only source of funds used—nor were they intended to be. Numerous other sources of funds were used, including other federal grants, loans, and insurance. Yet the amount of funds coming from a CDBG award to supplement these other sources is an important policy issue. Several issues related to other sources of funds (public and private), their estimated dollar value payouts, and the constraints on individual CDBG awards must be considered.
First, combining different types of public funds was often not permitted (for example, CDBG receipt counted against SBA loans). However, most owners, including CDBG recipients, reported needing additional funds beyond their financial assistance sources to meet their repair needs. The interrelationship of multiple public funding sources could be explored and clarified—or changed—in future disaster assistance.
The effect of combining funding sources for rebuilding is another finding of interest. The Phase I report published in December 2010 did not find conclusive evidence of a relationship between the total amount of assistance (including CDBG) relative to the assessed damage and rebuilding activity: properties, for which the total amount of assistance covered
Executive Summary (Continued)

xv
100 percent of the damage estimate, showed higher levels of rebuilding, habitability, and occupancy, but only occasionally were these differences statistically significant. The current Phase II report finds that CDBG recipients were more likely to self-report financial assistance that matched or exceeded their (owner-reported) assessed damage than nonrecipients, suggesting that the CDBG program did help address the funding gap for many owners. Owner-reported damage assessments did not necessarily match FEMA assessments, because owners often relied on other assessment sources (especially homeowner’s insurance assessments) or did not readily know their properties’ FEMA-assessed values. To better understand the funding gap facing households, reliable damage assessments and a full accounting of grantees’ funding sources could be more clearly detailed as requirements in future assistance.
A third notable issue is the establishment of a maximum grant value. In both Louisiana and Mississippi, CDBG grants were capped at $150,000. In Texas, the individual program awards ranged from $40,000 to $100,000. The CDBG grants were designed to fill the gaps between other financial assistance and repair costs as defined by damage assessments. Yet there are many reasons why the maximum grant value could be insufficient; for example, damage assessments might exceed the cap, or actual repair costs might change after the assessments because of swings in local construction costs. An understanding of actual damages and repair costs may provide some context to policymakers on how to set those caps.
Other restrictions on the maximum grant values were also noted and should be considered in future recovery funding. In particular, the reduction in CDBG grant amounts to owners without homeowner’s insurance (as happened in one program) penalized specific households and added barriers to the overall goal of rebuilding. In all cases, maximum grant values are determined based on the desire to maximize the number of grantees while providing adequate resources for each grantee. Careful modeling of how this is implemented should play a role in recovery funding.
CDBG Program Models and ImplementationThe different models in each state for CDBG program administration provide an opportunity to observe the relative efficiency and effectiveness of each program. However, the regional differences in damage types, housing stocks, and numbers of grant awards makes comparison across the states very difficult. The survey findings presented in this report, based on a very small sample of homeowners in each state, suggest that Texas’s rehabilitation model (payment to contractors rather than direct awards to individual property owners) resulted in a more complete application of funds to rebuilding uses and no significant difference in the amount of time to complete rebuilding—an ideal outcome for a policy initiative intended only to repair or rebuild damaged properties. The effectiveness of Texas’s program model, however, may be predicated on its small program size and may not be easily brought to scale.
The compensation models in Louisiana and Mississippi allowed owners to sell properties and not rebuild, as well as to use the funds for other needs—a positive outcome for a policy intended to assist disaster victims and to allow some amount of autonomy in decisionmaking. This flexibility was conveyed through the different explicit program options in the two states. Owners who chose not to rebuild and instead to move away reported high levels of satisfaction with their current neighborhoods, an important outcome, even though it does not contribute to local rebuilding efforts.
Among those who chose to keep their homes, some owners took advantage of the local flexibility to use their CDBG funds for activities other than the rebuilding of their properties. States could integrate clearer communication and enforcement of penalties for noncompliance into program designs, if rebuilding is the sole or foremost desired outcome. To the extent possible, federal agencies might also provide guidance to states on the requirement terms and enforcement strategies for these flexible options.
Executive Summary (Continued)

Chapter 1: Introduction 1
Between August 29 and October 24, 2005, Hurricanes Katrina, Rita, and Wilma caused massive devastation in the Gulf Coast region, damaging more than 1 million housing
units across five states. The first storm was Hurricane Katrina, which hit New Orleans on August 29, 2005 and was the costliest natural disaster in U.S. history, inflicting most of its damage in Louisiana, Mississippi, and Alabama. Less than 1 month later, on September 24, Hurricane Rita made landfall. Its accompanying storm surge caused extensive damage mainly in east Texas and western Louisiana, although it also reflooded portions of already devastated New Orleans. The last storm of that record-breaking hurricane season, Hurricane Wilma, hit the United States on October 24, 2005.
In response to the widespread destruction caused by the hurricanes, Congress appropriated $19.7 billion in supplemental Community Development Block Grant (CDBG) program funds for Gulf Coast disaster recovery.5 The three states hardest hit by Hurricanes Katrina and Rita—Louisiana, Mississippi, and Texas—received 99 percent of the supplemental CDBG funds ($19.4 billion). The remaining funds were allocated to Florida and Alabama. Allocations were based primarily on the number of housing units in the state that sustained major or severe damage, as assessed by the Federal Emergency Management Agency (FEMA). Louisiana received about 68 percent of total supplemental CDBG funds ($13.4 billion), Mississippi received 28 percent ($5.5 billion), and Texas received 3 percent ($503 million). In comparison, the regular
5 Created in 1974, CDBG is one of the oldest programs administered by the Department of Housing and Urban Development (HUD), providing funding to states, cities, and counties nationwide to support neighborhood revitalization, housing rehabilitation, and economic development. With its network of state and municipal grantees and subgrantees, CDBG offers a convenient way for the federal government to disburse large amounts of funds to local areas in the wake of large-scale disasters.
1. INTRODUCTIONCDBG allocations for fiscal year 2005 were $69.5 million for Louisiana, $39.2 million for Mississippi, and $286.4 million for Texas.
The purpose of this study is to assess the state of housing recovery in Louisiana, Mississippi, and Texas, to evaluate the role that CDBG funding has played in the housing recovery in those states, and to identify the factors affecting owners’ willingness and ability to rebuild or repair their storm-damaged properties with and without CDBG funding. The study focuses on recovery from Hurricanes Katrina and Rita, while recognizing that other hurricanes—especially Hurricane Ike in Texas—later created substantial further housing damage. The study focuses on a sample of owner-occupied and small rental residential properties (most of which suffered major or severe damage from the hurricanes) on significantly affected blocks. The study findings are intended to help the federal government understand and design effective recovery assistance programs for future disasters.
The study has three main data collection components: windshield observations of a sample of storm-damaged properties in Louisiana, Mississippi, and Texas to assess their current condition, administrative data from the CDBG disaster recovery programs in each of the three states to understand the relationship between assistance and rebuilding, and telephone interviews with a sample of the people whose properties were damaged by the 2005 hurricanes to discuss their decisions about whether to rebuild.
This report, Phase II, is the second of two reports prepared for the study. It details the results of the telephone interviews with property owners and draws on the prior analysis of windshield observation findings and administrative data.6
6 See the Phase I report: Turnham, et al., 2010.

Chapter 1: Introduction 2
This chapter provides background on the use of the supplemental CDBG disaster recovery funds in Louisiana, Mississippi, and Texas. It also summarizes the key findings of the study’s first phase, restates the research questions addressed in each phase of the study, and describes the content and organization of the current report.
1.1 BACKGROUNDThe purpose of the supplemental CDBG funding was to support disaster relief, long-term recovery, and restoration of infrastructure in the areas most affected by the 2005 hurricanes.7 Within this broad mandate, the states were given considerable flexibility in determining how to use the funds. All three states in the study designated most of their supplemental CDBG funds to housing recovery (directly and indirectly), mostly to help homeowners rebuild or repair their homes. For homeowners, CDBG funds were generally intended to fill the gap between the cost of repairing or rebuilding the damaged unit and the funds available to the owner from private or hazard insurance, FEMA grants, and Small Business Administration (SBA) loans.
From August 2005 to February 2006, FEMA conducted damage assessments of residential properties affected by Hurricanes Katrina, Rita, and Wilma.8 The U.S. Department of Housing and Urban Development (HUD) used the results of the FEMA assessments, largely based on direct inspection by FEMA contract inspectors, to create four categories of hurricane damage: no damage, minor, major, and severe. Although the criteria for categorization are somewhat complex, minor implies assessed damage of less than $5,200, major implies assessed damage of at least $5,200 but less than $30,000, and severe implies assessed damage of $30,000 or more.9
7 The first appropriation was made on December 30, 2005, when President Bush signed the FY 2006 Defense Appropriation Act providing $11.5 billion in CDBG disaster supplemental funding to the areas impacted by Hurricanes Katrina, Rita, and Wilma. A second supplemental appropriation of $5.2 billion in CDBG funds was made in June 2006. A third appropriation was for $3 billion.
8 FEMA conducted damage assessments on all housing units whose occupants registered for FEMA housing assistance after the hurricanes.
9 For more detail on damage categories, see Richardson, Todd and Robert Renner, “Geographic Information Systems Supporting Disaster and Recovery,” Cityscape: A Journal of Policy Development and Research, 9:1, 2007.
Louisiana had both the largest number of units affected by the storms and the most severe damage. As shown in exhibit 1-1, 40 percent of the damaged units in Louisiana were in the major or severe damage categories, compared with 28 percent in Mississippi and 9 percent in Texas. Within the three states, damage from the storms was concentrated geographically. In Louisiana, 89 percent of the homes that suffered major or severe damage were located in Orleans Parish (which includes New Orleans) or in one of the four parishes that border Orleans Parish. In Mississippi, damage was most extensive in the three coastal counties: Jackson, Harrison, and Hancock. Damage in Texas was concentrated in the eastern part of the state, with 90 percent of the units with major or severe damage located in eight counties near the Louisiana border.
Within the universe of storm-damaged housing units in Louisiana, Mississippi, and Texas, this study focuses on particular geographic areas and housing types. First, the study focuses on those parts of the states with high concentrations of residential damage from the 2005 hurricanes. As a way of identifying areas with high levels of housing damage, HUD developed the concept of the significantly affected block (SAB). An SAB is a U.S. Census-defined block (which often, but not always, corresponds to a standard city block) on which three or more housing units suffered major or severe hurricane damage as assessed by FEMA. This study focuses on a sample of 230 SABs in Louisiana, Mississippi, and Texas, selected to be representative of all SABs across the three states. The study also primarily targets properties with major and severe damage, with a few exceptions as noted in section 2.2.
In addition to focusing on areas with high levels of housing damage, this study limits its focus to two types of housing: housing that was owner occupied at the time of the hurricanes, including single-family and multifamily owner-occupied properties, and housing that had one to four rental units at the time of the hurricanes, also known as small rental properties. Rental properties with five or more units are not part of this study.

Chapter 1: Introduction 3
Exhibit 1-1. Housing Unit Damage Estimates by State
Level of Damage Louisiana Mississippi Texas Overall
Minor 310,512 (60%) 158,998 (72%) 127,807 (91%) 597,317 (68%)
Major 98,086 (19%) 45,776 (21%) 10,523 (8%) 154,385 (18%)
Severe 106,651 (21%) 15,610 (7%) 1,580 (1%) 123,841 (14%)
Total assessed units 515,249 220,384 139,910 875,543
Sources: U.S. Department of Housing and Urban Development, Current Housing Unit Damage Estimates, February 12, 2006
The study’s focus on owner-occupied properties and small rental properties reflects how the states chose to use most of their CDBG disaster assistance funds. All three states in the study funded large disaster assistance programs for homeowners. In addition, Louisiana and Mississippi created separate programs for owners of small rental properties, although, with roughly $700 million in awards across the two states, the small rental programs are dwarfed by the homeowner assistance programs in those states, which have made awards of about $10.7 billion.10 Support for multifamily housing redevelopment generally came from different funding sources, and this housing type is not included in this study.
Exhibit 1-2 summarizes the key program elements of the CDBG-funded homeowner programs in Louisiana, Mississippi, and Texas and the small rental programs in Louisiana and Mississippi. (Texas did not create a program specific to owners of small rental properties.) At the time of this report, none of the programs are accepting new applications, but they continue to process applications and appeals and distribute funds.
States applied similar formulae to calculate the amount of assistance the homeowner was entitled to, although, as shown in the exhibit, the maximum grant amount varied. The states also differed in how they provided the assistance to homeowners. In Louisiana and Missis-sippi, homeowners received CDBG grants directly as a lump sum, for use either in rebuilding their homes or
10 CDBG administrative data, April 2011.
to cover uncompensated losses. This method of provid-ing assistance is known as the compensation model.11
Applicants to Louisiana’s The Road Home Homeowner Program were required to choose one of three options, which affected the calculation and amount of the compensation as well as whether they were required to rebuild:
•Option 1: Remain in the home.
•Option 2: Sell to the state and purchase another home in the state.
•Option 3: Sell to the state and become a renter in Louisiana or move out of state.
As a condition of accepting the grant, owners who chose Option 1 agreed to covenants on the property. These covenants require the property owner to use the house as a primary residence within 3 years from the date of closing, to maintain hazard insurance on the home (as well as flood insurance if the home was located in a flood plain), to comply with base flood elevations adopted by local government, and to conform with local building codes in conducting rebuilding or repair. Owners who do not meet these requirements within the 3-year period of the covenants can apply for up to two 1-year extensions. Grant recipients who do not meet the terms of the covenants may be required to repay the entire amount of the grant.
11 Louisiana initially paid homeowners in increments as they produced evidence of rebuilding, but this aspect of the program was dropped and the majority of CDBG recipients have been awarded a lump sum payment.

Chapter 1: Introduction 4
Exhibit 1-2. Summary of CDBG-Funded Homeowner Programs
Program Model
Eligibility CriteriaForm of
AssistanceMaximum Amount of
AssistanceClosings to Date
Co
mp
en
sati
on
Re
hab
ilit
ati
on
Ow
ne
r-o
ccu
pan
t at
tim
e o
f h
urr
ican
e
Ow
ne
r in
co
me
Sp
ecifi
c c
ou
nti
es
Majo
r o
r se
ve
re
dam
ag
e
Flo
od
dam
ag
e o
nly
Gra
nt
Lo
an
Homeowner Programs
Louisiana The Road Home Homeowner Program
√ √ √ √
Up to $150k total; basic compensation grant, $50k for additional compensation grant (low-income homeowners), $20–30k for elevation incentive
128,255
Mississippi Homeowner Assistance Program
√ √ √ √ √ √ √
Up to $150k for Phase I plus $30k for elevation, $100k for Phase II plus $30k for eleva-tion, $50–$100k for Phase III
27,751
Texas COG Programs
√ √ √ √ √ √ √$65k–$100k, varies by COG 358
Texas Homeowner Assistance Program
√ √ √ √ √ √ √
$60k–$75k 1,850
Texas Sabine Pass Restoration Program
√ √ √ √ √ √
Up to $40k for rebuilding, plus $30k for elevation and $15k for accessibility
61
Rental Property Programs
Louisiana Small Rental Property Program
√ √ √ √
Varies, up to 100% of repair cost
4,718
Mississippi Small Rental Assistance Program
√ √ √ √ √
Up to $30k per unit for a 4BR unit, up to $120k total
3,907a
CDBG = Community Development Block Grant. COG = Council of Government.a Units under construction or completed construction, not closings.
Sources: Louisiana—The Road Home Small Rental Property Program Incentive Operations Status Report April 25, 2011 (based on commitment letters and amount committed and obligated to applicants active in the Constructive Management Initiative Option), CDBG administrative data, April 2011; Mississippi—CDBG administrative data, May 2, 2011; Texas—CDBG administrative data, March 2010 and April 2011

Chapter 1: Introduction 5
Mississippi’s Homeowner Assistance Program (HAP) for homeowners had three phases:
•Phase 1 targeted homeowners living outside the established flood zones who had homeowners insurance at the time of the storm.
•Phase 2 was designed for homeowners not eligible for Phase 1. Applicants were not required to have carried homeowners insurance, and their homes could have been located inside or outside the 100-year flood plain.12
•Phase 3 was designed for Phase 1 and Phase 2 grant applicants who no longer own their damaged residence, have an uncompensated loss, and who have not been able to attach the required covenants to the damaged property.
Properties that sustained only wind damage from the hurricane (no flood damage) were not eligible for assistance under any phase of Mississippi’s Homeowner Assistance Program.
In contrast to Mississippi and Louisiana, Texas followed a rehabilitation model, in which CDBG funds were explicitly for repairs or reconstruction projects and were not provided directly to homeowners. Instead, the state agency subcontracted with contractors to repair or rebuild owners’ homes on the owners’ behalf and paid the contractors using the CDBG grant funds. The Texas Department of Housing and Community Affairs (TDHCA) used CDBG disaster recovery funding for three separate homeowner programs: the Council of Government (COG) Programs, HAP, and the Sabine Pass Restoration Program.
More detailed descriptions of each state’s CDBG-funded disaster assistance programs can be found in appendix A.
12 The 100-year flood plain is the area expected to be inundated only in very extreme floods (happening approximately once every 100 years, or with a prob-ability of 1 percent in any year).
1.2 KEY FINDINGS FROM THE PHASE I REPORTGiven that this report builds on the previous research conducted under this study, it is useful to highlight the main findings of the Phase I report as well as introduce the key terminology developed for the study. The Phase I report provided estimates (as of 2010) of the repair needs and occupancy of hurricane-affected properties, estimates of the extent of rebuilding that had taken place, and a preliminary analysis of the role of neighborhood characteristics and CDBG assistance in rates of rebuilding. The estimates presented in this summary are based on rigorous statistical analysis of windshield observation data, FEMA damage assessment data, and CDBG administrative data conducted for the Phase I report.
Estimates of Current Repair Needs and Occupancy of Hurricane-Affected PropertiesBased on windshield observations of 3,511 residential properties on 230 significantly affected blocks, we estimate that as of early 2010, approximately 11 percent of properties no longer contained a residential structure, 15 percent of properties contained a residential structure with substantial repair needs, and 75 percent of properties contained a residential structure with no substantial repair needs. Substantial repair needs means the property had at least one repair need observable from the outside and was not rated by the windshield observers as being in either excellent or good condition.
While about three-fourths of all properties did not have substantial repair needs, this varied by the level of assessed damage from the hurricanes, by the tenure of the property at the time of the hurricanes, and by the location of the property. Properties assessed by FEMA to have experienced severe damage in 2005 were less likely to have been substantially rebuilt as of early 2010, as were properties occupied by renters at the time of the hurricanes, and properties located in some of the hardest hit areas: St. Bernard Parish and the Lower

Chapter 1: Introduction 6
Ninth Ward in New Orleans, and Hancock County, Biloxi, and Waveland and Bay St. Louis in Mississippi.
Using data from the U.S. Postal Service (USPS), we estimate that 82 to 89 percent of hurricane-affected properties on SABs were occupied as of early 2010.13 Properties that were owner occupied at the time of the hurricanes and properties with no substantial repair needs (as assessed by FEMA) were most likely to be occupied. However, the data suggest that a nontrivial number of households may have been living in housing with substantial repair needs.
Estimates of Rebuilding of Hurricane-Affected PropertiesWe developed two measures to analyze rebuilding among hurricane-affected properties:
•Observed rebuilding, which captures ongoing construction visible in early 2010, and
• Inferred rebuilding, which captures the percentage of properties that had major or severe hurricane damage but as of 2010 had no substantial repair needs.
We found that less than 5 percent of properties were actively under construction as of early 2010, but that approximately 70 percent of properties had been rebuilt since the hurricanes. On some blocks and in some neighborhoods, however, less than one-half of the properties had been rebuilt.
Role of Neighborhood Factors and CDBG Assistance in RebuildingAnalysis of neighborhood-level census data showed that neighborhoods with the lowest rates of rebuilding as of early 2010 tended to be those with less resources before the hurricanes, as indicated by lower house values, lower household incomes, and lower rates of homeownership.
13 USPS data from December 2009 were used to estimate occupancy rates among the properties in the windshield sample. Documentation for the USPS vacancy data is available on the HUD User website [http://www.huduser.org/portal/data-sets/usps.html]. Users can also download quarterly occupancy data for aggregated geographies. USPS vacancy data was available for 3,414 of the 3,511 addresses in our analysis sample. The 97 addresses with missing USPS data were dropped from analyses using the USPS measure of occupancy.
Analysis of property-level CDBG data found that, after adjusting for neighborhood characteristics, properties that received CDBG assistance were more likely to be rebuilt and reoccupied than properties that did not receive CDBG assistance. The exception is the set of properties that received grant awards through Options 2 and 3 of The Road Home program in Louisiana. These properties—which were sold by their owners to the Louisiana Land Trust—show notably lower levels of rebuilding, habitability, and occupancy.
The current report picks up where the Phase I findings left off—in particular, learning more about the 2011 condition of hurricane-affected properties, analyzing further repair needs and rebuilding, and understanding how the availability and amount of CDBG assistance affected property owners’ rebuilding and reoccupancy decisions.
1.3 PURPOSE OF THE PHASE II REPORTIn contrast to the Phase I report, which documented the findings from the windshield observations as well as updated administrative data, the Phase II report presents the findings from the owner survey.
A limited number of additional findings, with regard to the physical condition of the affected homes (specifically with regard to interior damage that could not be detected in the windshield observations), are also provided in this report to supplement the Phase I report findings. These findings are based on owner reports rather than physical observations. The Phase II report primarily provides a richer description of the range of possible factors that affected individual rebuilding decisions, including the influence of the availability and form of CDBG assistance.

Chapter 1: Introduction 7
1.4 PHASE II RESEARCH QUESTIONSThe overall study seeks to answer four main research questions related to the housing recovery from the 2005 hurricanes:
1. What is the overall state of housing recovery in areas most affected by Hurricanes Katrina and Rita?
2. What factors have affected the extent of housing recovery?
3. What role have the CDBG-funded homeowner and small rental property programs played in housing recovery?
4. How do housing outcomes and owner experiences differ by state and CDBG program model?
Phase I of the study focused on research questions 1 and 2, and to a lesser extent research question 3.
This current phase of the study primarily seeks to answer research questions 3 and 4, using detailed information collected directly from owners of hurricane-damaged properties using a telephone survey. We surveyed 722 individuals who, at the time of the 2005 hurricanes, owned properties that were located on significantly affected blocks and that suffered major storm damage. Three-fourths of the survey respondents were homeowners at the time of the hurricanes, and one-fourth were owners of small rental properties. The survey collected information on the level of interior damage from the hurricanes (damage not observable through the windshield observations), on the characteristics and value of the properties before the hurricanes, and on owner demographic characteristics for use in analyzing further the property and owner characteristics associated with rebuilding. The survey also collected detailed information on the experiences of owners applying for and using CDBG assistance, the other types of financial assistance used for rebuilding, the extent to which they were able
to complete rebuilding, and the myriad factors that affected decisions about whether to rebuild. Using data collected through the windshield observations, the survey included owners who had and had not rebuilt, as well as owners who had and had not received CDBG assistance.
The survey data, combined with the windshield observations and CDBG administrative data that were analyzed for Phase I, are the main basis for the Phase II report. (Chapter 2 describes the data sources in some detail.) These data enable us to analyze more closely the financial and human factors that affect homeowners’ decisions about whether to rebuild, as well as how the availability of CDBG assistance plays into those factors. With survey data from CDBG recipients in all three states, we are also able to compare outcomes and owner experiences across the different CDBG programs.
1.5 ORGANIZATION OF THE PHASE II REPORTThe remainder of this report is organized as follows:
•Chapter 2 reviews the data sources and collection methods, focusing on the sampling approach, survey instrument, and survey implementation strategies related to the owner survey. It also describes nonresponse bias in the telephone survey and the approach taken for correcting and minimizing this bias.
•Chapter 3 presents the findings of the owner survey with regard to the state of repair needs and activity. Although property conditions were largely addressed in the Phase I report, answers to the research questions about the physical conditions of the affected housing stock are supplemented with additional findings presented here.
•Chapter 4 analyses the property and owner characteristics that may be associated with repair and rebuilding.

Chapter 1: Introduction 8
•Chapter 5 discusses the role that CDBG grants and other sources of funding have played in the housing recovery process, as well as differences between the program models in terms of the use of CDBG funds and owner satisfaction with the program.
The report has four appendices. Appendix A provides descriptions of the CDBG disaster assistance programs for homeowners and owners of small rental properties in Louisiana, Mississippi, and Texas. Appendix B provides a summary of the property owner survey. Appendix C provides details of the nonresponse bias analysis conducted for the property owner survey to create sampling weights for the analysis. Appendix D presents survey findings regarding rates of application to the CDBG program and reasons for not applying among owners of hurricane-damaged properties.

Chapter 2: Data Collection and Analysis Methodology 9
2. DATA COLLECTION AND ANALYSIS METHODOLOGY
This report focuses on telephone survey findings from 722 individuals who, in 2005, owned owner-occupied and small rental properties in Louisiana, Mississippi,
and Texas that suffered significant (primarily, major or severe) damage from Hurricanes Katrina or Rita and were located on significantly affected blocks. The telephone survey findings build on those from the windshield observations conducted in early 2010 and summarized in the Phase I report.
The main objective of the property owner survey was to understand the rebuilding process for owners of properties damaged by the hurricanes and the role of federal CDBG disaster recovery assistance in owners’ rebuilding decisions. The survey was designed to provide unbiased information on the experiences of property owners affected by the storms, including owners who received disaster assistance through the CDBG program and those who did not, and owners of properties that were rebuilt following the storms and owners of properties that continue to have substantial repair needs or are no longer standing.
In this chapter, we describe the data collection and analytic methodology for this report. First, we provide an overview of all the data sources used in the analysis and a more detailed description of the property owner survey. Next, we describe the sampling approach for the owner survey, which takes as its starting point the windshield observation sample. Following that, we discuss our approach to locating survey respondents, conducting the survey, and maximizing response rates. Finally, we discuss the nonresponse bias analysis and sampling weights applied to the survey findings.
2.1 STUDY DATA SOURCESThe overall study draws upon three main sources of data: windshield observations, a variety of administrative and public data sources, and a property owner survey. The windshield observations are described in full—with findings—in the Phase I report, chapter 2. A variety of administrative data was also utilized, primarily for the Phase I report. The administrative data sources that were used for the current report include the following:
• FederalEmergencyManagementAgency(FEMA)DamageAssessmentDataSet. This data set contains basic household information for all FEMA assessed properties located on the sampled significantly affected blocks (SABs).14 This information includes the address, number of units, tenure, and property type. Most importantly, this data set also includes the level of damage from the 2005 hurricanes under the following nomenclature: minor, major, and severe. The damage assessments are used for analysis of subsequent housing recovery.15 This data set also includes contact information for the person who requested the FEMA assessment, but this was generally for the occupant rather than the owner of the unit, and was therefore of limited use in identifying survey respondents.
14 A SAB is a census block on which three or more housing units sustained major or severe damage according to the FEMA damage assessments.
15 FEMA Flood Insurance Rate Maps (FIRMs) and Advisory Base Flood Eleva-tion (ABFE) Maps, and the U.S. Geological Survey (USGS) National Eleva-tion Dataset, were also collected to analyze the observed and owner-reported elevations for each rebuilt property against the recommended elevations for those properties. The share of property owners reporting elevation work in the owner survey sample, however, was only approximately 10 percent. Because of the weak statistical value of this subsample, an analysis of the reported versus recommend-ed elevations is not included in this report.

Chapter 2: Data Collection and Analysis Methodology 10
• CDBGAdministrativeData. Property-level data from each state’s CDBG program from March 2010 provides information on which properties in the sample received CDBG awards, the type of award received (homeowner or small rental) and the amount the award, as well as select information on other sources of funding used for calculating the CDBG award amount.
The primary data source for this report, however, is the property owner survey. While the study is not intended to infer causality from receiving and not receiving CDBG funds on repair or rebuilding decisions, the owner survey provides data for describing the processes of applying for and using CDBG funds across the different state programs, other funding sources and their role in comparison to CDBG, barriers to rebuilding, other concerns related to the owners’ use of CDBG funds and the associations between CDBG funds of different program models and housing recovery. The owner survey instrument addressed these varied concerns in the following specific categories:
•BaselinePropertyCharacteristicsandConditions. The instrument sought to uncover the pre-storm tenure, quality, and value of the property, and neighborhood characteristics, to form a baseline for comparison. All owners were asked these questions, but owners who purchased the property after 2005 were asked about the property at the time of purchase.
•CurrentOwnership. All 2005 owners, regardless of current (2011) ownership status, were asked about the properties’ current ownership status (including foreclosure) and, if sold by the owner respondent, the value at the time of sale.
•CurrentOccupancyandPropertyCondition. Only current property owners (including those not living on the property itself ) were asked about the current characteristics and condition of the home (or rebuilt home, if applicable) and neighborhood characteristics. Included in this series of questions
were ones about the current interior condition of homes—information not available from the windshield observations.
• FormerOccupants’Status. Respondents who no longer occupy the property in question were asked about their current housing status and conditions—that is, the status of the location to which they moved.
•Damage. All owners were asked about the source and extent of damage by the 2005 storms, as well as the entity that performed a damage assessment, and the amount of assessed damage. The survey also asked about the specific parts of the structure damaged by the hurricanes.
•RepairandRebuilding. All 2005 owners, regardless of current ownership, were asked about repair and rebuilding activities undertaken in response to the 2005 storm damage. This series of questions probed the kind of repair or rebuilding (both in general and with regard to specific interventions such as structural elevations), its timing and costs, its level of completion, reasons for incompletion, and the materials and contractors used. Owners who purchased the property after 2005 were also asked whether repairs or rebuilding had been performed before the purchase. This information was designed to supplement the repair and rebuilding information provided in the Phase I report based on exterior windshield observation.
•ReasonsforNotRebuilding. All 2005 owners who did not perform any repair or rebuilding were asked if they intended to rebuild (if they still owned the property) and the reasons why they did not rebuild.
• FundingSources. All 2005 owners were asked about the sources of the funding that they might have received after the storms, such as insurance payouts, charity assistance, personal funds, and public assistance grants, the amount of the funding, and whether all of the sources totaled were sufficient to cover repair or rebuilding costs. For

Chapter 2: Data Collection and Analysis Methodology 11
public assistance grants in particular, owners who did not receive CDBG funds were asked whether they applied, why they did not apply, why they withdrew their application (if applicable), and why they were rejected if they applied but did not receive assistance. For owners who did receive CDBG-related program funds, the survey posed a series of questions about the specific program options that they selected, their use of the funds, and the process of applying. The questions were tailored to address the nomenclature and the program requirements of the program models in each of the three states—for example, Texas owners were asked about construction completion in addition to applying for and receiving assistance. The information provided from this series of questions directly responds to the broader area of inquiry regarding the access, use, and role of CDBG funds in housing recovery.
•OwnerDemographics. All survey respondents were asked basic demographic information, such as marital status, employment, household income and finances, household size, race, and ethnicity.
Appendix B provides further detail on the content and structure of the property owner survey.
2.2 SELECTING THE OWNER SURVEY SAMPLEThe starting point for selecting the owner survey sample was the set of windshield observations completed in the Phase I report. We selected the owner survey sample from among those properties for which we had completed windshield observations because we needed to use the results of the windshield observations to ensure that the survey sample included a mix of properties with substantial rebuilding, partial rebuilding, or no rebuilding at all. The windshield sample consists of 3,511 properties across the three states. Among the 3,511 properties, 2,833 were
designated by FEMA as having suffered severe or major hurricane damage in 2005, and 678 were designated as having minor damage.16
The owner survey was designed to focus on owners of damaged properties who, in the aftermath of Hurricanes Katrina and Rita, could potentially receive CDBG disaster assistance funds. Because the state CDBG disaster assistance programs were generally limited to owners of properties with “major” or severe assessed damage, we elected to select the owner survey sample primarily from among the 2,833 severe or major damage properties. (As discussed in a following section, in Texas we included in the sample some properties assessed by FEMA as having minor damage but that received CDBG disaster assistance awards.) Given project resource limitations, it was not possible to interview all owners of residential properties that experienced major or severe damage in the windshield sample. Instead, we planned to survey a total of 1,400 owners across the three states.
The windshield observation sample was selected to be a representative sample of all properties located on SABs across the three states and 17 subgeographies to provide statistically reliable estimates of housing recovery. In contrast, the most important criterion for the owner survey sample was to have sufficient numbers of respondents of each owner type—homeowners and owners of rental properties, CDBG recipients and nonrecipients, and owners of properties that were ultimately rebuilt as of early 2010 and those that were not—to analyze the factors that affect rebuilding decisions. Our allocation of the survey sample focused on the power for detecting differences between the groups of interest in the overall population, not for specific geographies. Whereas the windshield observations oversampled properties from 8 of the 17 geographies requested by HUD, our telephone survey sample eliminated this oversampling. We also adjusted
16 As described in chapter 1, minor implies assessed damage of less than $5,200, major implies assessed damage of at least $5,200 but less than $30,000, and severe implies assessed damage of $30,000 or more.

Chapter 2: Data Collection and Analysis Methodology 12
the sample based on proportional allocation, with an oversample of properties with partial or no rebuilding activity. Because properties with partial or no rebuilding activity are a primary focus of the study, this oversample was intended to ensure an adequate sample size for this subset of properties.
For Louisiana and Mississippi, where the sampling universe contained a sufficient number of properties, we allocated the total sample for the telephone survey across the geographic strata used for the windshield observations in approximate proportion to the number in the sampling frame in each stratum, but also to ensure that the sample was not unbalanced across the three dimensions of interest: pre-hurricane tenure, CDBG receipt, and 2010 rebuilding status.
In Texas, the sampling universe for the owner survey contained fewer properties than anticipated. Of the 2,833 properties with major or severe damage in the windshield sample, only 57 were in Texas; of those 57, only 1 had received CDBG assistance. Texas had a much higher proportion of properties designated by FEMA as having minor damage than the other two states. In addition, local officials report that substantial damage occurred to Texas properties in fall 2005, after the FEMA assessments were conducted, as a result of damaged roofs and heavy rainfall. By the time the properties in Texas were evaluated for CDBG assistance the overall damage was assessed to be greater than what FEMA had found earlier.
To increase the owner survey sample size in Texas, and to include some properties that had received CDBG awards, we had to sample additional SABs in Texas beyond the 10 blocks in that state included in the windshield observations. We sampled an additional 83 SABs in Texas to reach the desired sample size of 120 for the owner survey in Texas. The survey sample of 120 included 45 homeowners who received CDBG grants, 45 homeowners who did not receive CDBG grants, and 30 rental properties. To reach the sample size of 45 homeowners who received CDBG grants, we sampled all homeowners on the 83 blocks who received
CDBG awards for properties assessed by FEMA as having major or severe damage, and a portion of homeowners who received CDBG awards for properties assessed by FEMA as having minor damage.
Exhibit 2-1 shows the initial sample for the telephone survey sample by geography (state and county/parish level only), pre-hurricane tenure, CDBG receipt, and 2010 rebuilding status.

Chapter 2: Data Collection and Analysis Methodology 13
Exhibit 2-1. Initial Allocation of Telephone Survey Sample
Homeowner Properties Rental Properties
TotalSubstantially
RebuiltPartial and
No RebuildingSubstantially
RebuiltPartial and
No Rebuilding
CDBGNo
CDBGCDBG
No CDBG
CDBGNo
CDBGCDBG
No CDBG
Louisiana 210 155 205 95 17 119 28 161 990
Calcasieu and Cameron Parishes
6 3 3 5 0 2 0 4 23
Jefferson Parish 26 41 4 4 2 36 0 5 118
Orleans Parish 122 61 126 52 15 70 26 134 606
St. Bernard Parish 34 28 59 22 0 5 2 12 162
St. Tammany Parish 6 17 4 4 0 3 0 1 35
Other Louisiana Parishes
16 5 9 8 0 3 0 5 46
Mississippi 73 54 47 45 0 22 0 49 290
Hancock County 13 4 17 16 0 1 0 6 57
Harrison County 10 24 10 13 0 8 0 26 91
Jackson County 50 22 20 14 0 13 0 16 135
Other Mississippi Counties
0 4 0 2 0 0 0 1 7
Texasa 35 20 10 25 0 10 0 20 120
Total for all states 318 229 262 165 17 151 28 230 1,400
CDBG = Community Development Block Grant.a The rebuilding status of properties in Texas is not known because most of the owner survey sample was not part of the windshield sample. The allocation of the Texas sample across the rebuilding categories is an estimate.

Chapter 2: Data Collection and Analysis Methodology 14
2.3 APPROACH TO CONDUCTING THE PROPERTY OWNER SURVEYAbt SRBI, a national survey firm and an Abt Associates subsidiary, conducted the property owner survey between late September 2010 and early May 2011. The survey’s first significant challenge came in locating the 2005 owners of properties damaged by Hurricanes Katrina and Rita. As described in the Phase I report, the windshield observations found that as of early 2010, about 11 percent of storm-damaged properties on significantly affected blocks, across the three states, no longer contained a residential structure, and almost 15 percent either contained no residential structure or contained a residential structure that was not habitable.17 Furthermore, as shown in exhibit 2-1 previously, nearly one-half of the survey sample (49 percent) participants were owners of properties that, as of early 2010, were either not rebuilt at all or only partially rebuilt. With such a large share of the properties uninhabitable or under construction, and with many properties having changed ownership since the 2005 hurricanes, additional steps were required for identifying and locating the 2005 owners, as well as soliciting their responses to the survey. The pilot test of the survey was conducted in October and November of 2011, and the survey was implemented through mid-May 2011. The bulk of survey responses were provided from February to May 2011 and were due to the increased use of field efforts described in a following section.
Identifying and Locating the 2005 Owners of Hurricane-Damaged PropertiesThe survey team used a variety of means to accurately identify and then locate the owners in the survey sample. Starting with a list of 1,400 property addresses, the first task was to identify the owners of those properties as of August 2005. Pilot testing of the phone survey instrument in October and November of 2010 resulted in 207 completes, but left the remaining bulk
17 See Turnham, et al. (2010), p. 31 and p. 39.
of the owner sample to be determined. For each address in the sample, we used a combination of data sources to identify the 2005 owner:
• TheFEMADamageAssessmentDataSet. We used the FEMA data set to develop the survey sample, because it provided (in most cases) the name of the occupant of the property at the time a FEMA claim had been made for hurricane damage. The FEMA data set was a useful starting point for identifying the owners of properties believed to be owner occupied at the time of the hurricanes, approximately 70 percent of the survey sample. This data set was particularly useful for Mississippi and parts of Louisiana. However, because it included only the names of occupants, not owners, the FEMA data set was not helpful for identifying the 2005 owners of those properties that were renter occupied at the time of the hurricanes.
• StateCDBGAdministrativeData. In March 2010, we obtained administrative data from the state administrators of the CDBG disaster assistance programs in the three states. We used these data to help identify and locate owners of properties who received CDBG assistance. These data were helpful for the approximately 45 percent of the survey sample who had received CDBG assistance, but the level of information available for individual CDBG recipients that could be useful for locating these owners varied within and across the three data sets.
• Parcel-LevelDatafromCounty/ParishTaxAssessor’sOffices. We attempted to obtain parcel-level data on the 2005 ownership of each property in the survey sample using three sources: data maintained by HUD, data maintained by private vendors and available for purchase, and data available online from county/parish tax assessors. Using these three sources, we were able to find a tax assessor record for about three-fourths of the properties in the survey sample. The remaining properties, slightly more than one-half of which were identified in the FEMA data set as being

Chapter 2: Data Collection and Analysis Methodology 15
renter occupied at the time of the hurricanes, could not be located in the available assessor data. For the properties that were found in the assessor records, the information available on owners varied. In many cases, we were able to use the assessor data to corroborate the owner information in the FEMA data set for owner-occupied properties, or to identify clearly a different owner as of 2005. This process was helpful in all three states. However, many of the records available through our three sources did not go back as far as 2005, and in other cases the ownership of the property as of 2005 was unclear. Ultimately, reliable owner names were not available for 30 percent of the properties in the survey sample.
• In-PersonEffortstoIdentifyOwners. For those cases in which we were not able to obtain an owner name, we sent interviewers to the property address to ask the property’s current inhabitants and neighbors about the identity of the 2005 owner and his or her current location. Local tax assessor’s records were also mined in the field in cases of incomplete owner identification. This tactic was particularly useful in Orleans Parish, Louisiana. We also sent mailings to all addresses in the survey sample, informing the occupants of the survey activities and encouraging 2005 owners to call in to a toll-free number to complete the survey.
By early February 2011, the ownership identification for approximately 79 percent of the sample had been confirmed. The procedures described previously for identifying the owners overlapped with procedures for locating the owners, because in-person field efforts were increasingly required. These procedures for locating the 2005 owner can be categorized in the following order:
• FindingCurrentContactInformation. After we had an owner name for the property, we used several means of locating the owner and encouraging him or her to complete the survey. First, we ran all the owner names (and any other information available) through the United States
Postal Service National Change of Address (NCOA) Database to obtain an updated address. We then used Accurint, a private database vendor used by credit companies to locate individuals, to obtain further address updates and telephone numbers for owners in the sample. In most cases, the Accurint data provided at least one telephone number for the owner, and in many cases it provided multiple telephone numbers. Ultimately, 359 records with contact phone information were available and sent to the phone center at this phase. Another 536 records with no contact phone information for identified owners were sent directly to the field for additional locating, along with 273 records that still required owner identification.
• PhoneCenterInitiation. This contact information was used by the survey’s phone center to initiate the survey response when available. Letters were sent to the owners’ last known addresses informing the owners of the survey, confirming the owners’ contact information, and included invitations to complete the survey. The phone center would repeat initiation steps for a period of 3 weeks before releasing the owner information to the field for additional locating. A total of 299 records were released to the field during this process, including preliminary refusals along with unsuccessful initiations.
• FieldInitiation. Cases involving identified owners for whom no phone contact information was available were sent immediately to the field for in-person contact similar to the identification efforts. Many of the procedures described previously for owner identification in the field were implemented, including conducting additional searches in local public records, visiting the property address, and inquiring with current residents or neighbors. In-depth individual Accurint search updates were also employed, with findings used directly in the field.

Chapter 2: Data Collection and Analysis Methodology 16
The challenges described previously in identifying and locating the 2005 owners of hurricane-damaged properties, approximately 5 years after the hurricanes, necessitated an intensive field effort over many months. Ultimately, more than one-half of the completed interviews originated with an infield locating effort rather than simple telephone locating efforts. Overall, through all the efforts, the survey team was able to locate the 2005 owners for 70 percent of the properties in the survey sample (977 of 1,400).
Increasing the Response RateAfter identifying and locating owners, the third challenge involved successful completion of the survey by the sample respondents—that is, increasing the response rate. This effort overlapped somewhat with the location efforts, because the field staff attempted to both confirm the 2005 owners and to have them complete the survey—either by appointment with the phone center or at the point of field contact. A series of additional steps were employed for this activity:
• LocalContactInformation. Local phone numbers (with local area codes that would appear in caller-ID screens) were employed to reach out to the identified owners who might not be willing to speak to a more distant phone center.
• LocalMailings. Additional mailings using local postmarks and identifying a local phone for initiating the survey were provided to increase responses.
• In-PersonAttempts. Visits to properties both during locating efforts and after confirming locations were employed. When no occupant answered, cards with local numbers were left.
• In-PersonContact.Personal contact, when possible, was employed to convert previous refusals at the phone center.
• FinancialIncentives. All respondents who completed all or part of the interview were paid $25 for their time in the form of a money order.
The $25 was intended to provide respondents with further incentive to complete the interview, beyond the opportunity to share their experiences with the challenges of rebuilding after the hurricanes and provide feedback on the CDBG-funded disaster assistance programs. At the very end of the survey period, when the research team encountered increased resistance to completing the interview, the team increased the respondent incentive payment to $50.18 When successfully reached, respondents took an average of 30 minutes to complete the interviews. Respondents were allowed to skip questions they did not feel comfortable answering and to stop the interview at any time. The results of these efforts to increase response rates, as well as a fuller explanation of response concerns, are described in a following section.
18 This change was approved by Abt Associates’ Institutional Review Board in April 2011. 120 of the 722 survey respondents received the higher incentive payment.

Chapter 2: Data Collection and Analysis Methodology 17
2.4 SURVEY RESPONSE RATESA total of 722 individuals completed the property owner survey, for an overall response rate of 52 percent. As shown in exhibit 2-2, the survey response rates were highest in Texas and among owner-occupied properties, recipients of CDBG assistance, and for owners of properties that as of early 2010 were substantially rebuilt.
Exhibit 2-2. Survey Response Rates by Subgroups of Interest
Survey Sample Size Total Respondents Response Rate
State
Louisiana 990 467 47%
Mississippi 290 171 59%
Texas 120 84 70%
Occupancy (Fall 2005, based on FEMA data)
Owner occupied 974 544 56%
Renter occupied 426 178 42%
CDBG Receipt (March 2010, based on CDBG administrative data)
Received CDBG 625 362 58%
Did not receive CDBG 775 360 46%
Rebuilding Status (February 2010, based on windshield observation)a
Substantially rebuilt 650 369 57%
Partial rebuilding or no rebuilding 630 269 43%
Overall: all subgroups 1,400 722 52%
CDBG = Community Development Block Grant. FEMA = Federal Emergency Management Agency.a The Texas sample is excluded from this part of the exhibit because the 2010 rebuilding status is not known for most of the survey sample.
Sources: FEMA data set (for occupancy); CDBG administrative data (for CDBG receipt); 2010 windshield observations (for rebuilding status)

Chapter 2: Data Collection and Analysis Methodology 18
Exhibit 2-3 summarizes the reasons for survey nonresponse. Almost two-thirds (62 percent) of the 678 potential respondents who did not complete an interview simply could not be located by the interview team. This group includes cases, as described previously, in which the 2005 owner of the property could not be identified, as well as cases in which the owner was identified but could not be located, or an owner who ignored all efforts by the survey team to get in touch. Some of these owners could also have been deceased, but the survey team could not confirm that this was the case.
The second biggest reason for survey nonresponse was respondent refusal. Despite efforts by the survey team to try to address their concerns and to encourage them to do so, 134 people refused to do the interview. The survey field staff reported that most people who refused to complete the survey provided one of the following reasons:
•HurricaneKatrinaFatigue.About five and a half years after the hurricanes, people said they were simply “tired of talking about Katrina.” For many
people, talking about their experiences in the aftermath of the hurricanes continues to bring up very painful memories.
• AntigovernmentSentiment. Some people expressed antigovernment, anti-HUD, and anti-FEMA sentiments. As several put it, “the government was not there for me [at the time of the hurricanes], so I will not help them now.” Frustration at the slow pace of assistance and recovery has been well documented and persists to this day.
• FearofAnother“Scam.” People were skeptical of the legitimacy of the survey and were concerned that the interviewers might be out to take advantage of them in some way.
The survey team observed that the rate of refusal was high regardless of the age of the respondent. Typically, survey response rates are higher among older people, who often have more time and interest in talking about their experiences, but this was not the case with this survey.
Exhibit 2-3. Characteristics of the Survey Sample: State and Owner Status at Time of Survey
NumberWeighted Number
Percent
State (N = 202,102)
Louisiana 467 145,518 72.0
Mississippi 171 47,626 23.6
Texas 84 8,958 4.4
Owner Status (N = 202,102)
Owned property in 2005 and currently owns property
574 160,797 79.6
Owned property in 2005 and no longer owns property 128 35,158 17.4
Purchased property after 2005 as a rental property and currently owns property
19 5,638 2.8
Purchased property after 2005 as a rental property and no longer owns property
1 508 0.3
Source: 2011 Property Owner Survey

Chapter 2: Data Collection and Analysis Methodology 19
2.5 RESPONSE BIASIn addition to the high refusal rates noted during the owner survey, a variety of cognitive biases may have influenced owner responses; several studies have noted the possibility of these biases in populations affected by natural disasters.19 In particular, researchers are concerned with how respondents may have described the pre-storm era more positively than realistically, how the trauma of the events may have psychologically influenced responses, and how the length of time since the storm may have biased their responses. Some of these biases may be the result of psychological and sociological behaviors similar to those that resulted in nonresponse. For example, several studies note that hurricane victims suffered from mental illnesses typical of other natural disaster survivors, although local factors affected individuals’ experiences and symptoms.20 The magnitude of post-traumatic distress among victims of this specific event, however, was unique: both severe and moderate mental illness almost doubled after Hurricane Katrina.21
Several cognitive biases that are products of these psychological conditions may have played a role in the responses, in addition to more mundane biases that are present in similar surveys that demand recall of an event or set of facts in the distant past. Memory biases are perhaps the most likely biases associated with responses to the owner survey; in particular, rosy retrospection, in which subjects rate their circumstances before the disaster more positively than they would have rated them before the event occurred. This bias may have shaped the owners responses to questions on pre-storm neighborhood conditions and property
19 For example: Ashley and Sheuren, “Considerations In The Study Design of a Mobile Phone Survey of the Haitian Population” and Fisher, “Survey Administra-tion in the Wake of a Natural Disaster” presented at the Joint Statistical Meet-ings of the American Sociological Association, Vancouver, Canada. August 2010; and Kessler et al., “Sample and Design Considerations in Post-Disaster Mental Health Needs Assessment Tracking Surveys,” International Journal of Methods in Psychiatric Research 17(S2): S6–S20 (2008).
20 Weems et al. “The psychosocial impact of Hurricane Katrina: contextual differ-ences in psychological symptoms, social support, and discrimination.” Behaviour Research and Therapy: October 2007, Vol. 45 (10), pp. 2295–306.
21 Kessler et al. “Mental illness and suicidality after Hurricane Katrina.” Bulletin of the World Health Organization 2006; Vol. 84, pp. 930–939.
conditions. Because respondents were asked to describe events leading up to their current rate of rebuilding (and lack of rebuilding, in some cases), hindsight bias—or the inclination to describe past events in ways that predict or justify current conditions—may also play a role. These biases are likely combined with more typical memory distortions; the owner survey took place in early 2011, more than 5 years after the hurricanes.
Neither the presence of these biases, nor their magnitude or direction, is obvious. The study did not attempt to overcome these biases, although the survey was designed to compensate for owner recall issues by allowing owners to report ranges rather than specific dollar amounts for things like home sales values, damage assessments, funding amounts, and repair costs. Issues related to the effect of a traumatic event like the 2005 hurricanes on owners’ perceptions of their living conditions before the event and on owners’ ability to remember important information (such as the amount of damage assessed to their property) that would have been received in the midst of the traumatic event, should be the subject of future research.
2.6 SAMPLING WEIGHTSTo produce population-based estimates from the property owner survey, each sample property was assigned a sampling weight that consists of two parts: the base weight and the nonresponse adjustment factor. The base sampling weight is simply the reciprocal of the probability of selecting the property into the sample. If all sample property owners had responded to the survey, these weights would ensure that the sample included in the evaluation was representative of the population of properties with major or severe damage in the geographical areas from which they were selected.
The subset of sample property owners who responded to the surveys may not be representative of this population, however, if certain types of property owners, or property owners in certain geographical areas, were more likely to respond to the survey than

Chapter 2: Data Collection and Analysis Methodology 20
other owners, as suggested previously in exhibit 2-2. For that reason, we adjusted our sampling weights for nonresponse to account for differential response rates for different subgroups of property owners. The nonresponse adjustment factor adjusts for characteristics available for all sample members who were determined to be correlated with the probability of responding to the survey, including CDBG receipt, occupancy type, type of damage, and whether the property was substantially rebuilt according to the windshield survey. To compute the nonresponse adjustment factor for each property, we first estimated a logistic regression model of nonresponse and used the fitted model to find the response probability (also known as a propensity score) for each property. The inverse of the propensity score was then used to adjust the base weight. Appendix C provides further detail on the nonresponse bias analysis conducted for the property owner survey.
2.7 FINAL SAMPLE CHARACTERISTICSThe weighted survey data presented in this report provide estimates for a population of 202,102 owners whose properties in Louisiana, Mississippi, and Texas were located on blocks that sustained significant damage from Hurricanes Katrina or Rita, and that suffered major or severe storm damage.
Exhibits 2-3 through 2-5 show the characteristics of the weighted survey sample of 202,102 property owners. Slightly less than three-fourths of the sample (72.0 percent) owned a property in Louisiana at the time of the hurricanes, about one-fourth (23.6 percent) owned a property in Mississippi, and the remainder (4.4 percent) owned a property in Texas.
More than three-fourths of the owners in the survey sample (79.6 percent) owned the property at the time of the hurricanes and still owned the property in early 2011, 17.4 percent owned the property at the time of the hurricanes but no longer owned it in early 2011, and 3.1 percent purchased the property after the
hurricanes as a rental property (most of these owners still owned the property in 2011).
Although the vast majority of survey respondents (96.9 percent) are people who owned a property in 2005 that was damaged by the hurricanes, we permitted owners who purchased the property after 2005 to complete the property owner survey provided they purchased the property as a rental property. This group was included because these owners were eligible to apply for the CDBG-funded small rental property assistance programs in Louisiana and Mississippi, and the study was interested in the population of owners eligible to apply for CDBG. The CDBG homeowner programs were available only to people who owned at the time of the hurricanes; thus, the survey was not open to people who purchased a damaged property after the hurricanes for use as a homeowner property.
As shown in exhibit 2-4, more than three-fourths of properties were owner occupied at the time of the hurricanes, most without rental units (69.7 percent), but some with rental units (8.5 percent). Of all the properties, 18.4 percent were rental (or investment) properties at the time of the hurricanes, and less than 1 percent were vacation homes. About 3 percent of properties were not identified by the owner as an owner-occupied house, a rental property, or a vacation home; most likely these properties were some other type of housing not occupied at the time of the hurricanes. (Owners of nonresidential properties were screened out at the start of the survey.)
Less than one-half of the weighted survey sample received a CDBG award (exhibit 2-5). We used the CDBG administrative data provided by each of the states in March 2010 to determine rates of CDBG receipt. Most were recipients of CDBG homeowner grants (42.5 percent), but a small number received assistance through the CDBG small rental program (2.0 percent). The small number of small rental grant recipients in the sample is not surprising, given that, in the larger windshield observation sample, we found that only 2.6 percent of all properties in Louisiana

Chapter 2: Data Collection and Analysis Methodology 21
and Mississippi (8.8 percent of rental properties) had received a CDBG small rental grant.22 The CDBG small rental grant programs provided less funding than
22 Percentages for all properties were derived from exhibit 5-1 in Turnham, et al. (2010), summing the raw numbers columns.
the CDBG homeowner programs. Given the very small number of survey respondents who received CDBG small rental grants, we focus our analysis in chapter 5 on homeowners and recipients of CDBG homeowner grants.
Exhibit 2-4. Characteristics of the Survey Sample: Occupancy at Time of Hurricanes
NumberWeighted Number
Percent
Occupancy and Use of Property at Time of Hurricanes (N = 195,955)
Owner occupied, no rental units 505 136,672 69.7
Owner occupied, with rental units 55 16,619 8.5
Rental property (not owner occupied)
114 36,021 18.4
Vacation home 2 402 0.2
None of the above 23 5,432 2.8
Don’t know or refused 3 808 0.4
Note: Does not include properties purchased after 2005.
Sources: 2011 Property Owner Survey; 2010 windshield observations
Exhibit 2-5. Characteristics of the Survey Sample: CDBG Receipt
NumberWeighted Number
Percent
CDBG Receipt (N = 202,102)
Received a CDBG homeowner grant 343 85,867 42.5
Received a CDBG small rental program grant
19 4,069 2.0
Did not receive a CDBG grant 360 112,165 55.5
CDBG = Community Development Block Grant.
Source: Property Owner Survey matched to CDBG administrative data from March 2010.

Chapter 3: Repair Needs and Rebuilding 22
3. REPAIR NEEDS AND REBUILDING
This chapter presents the information gathered in the owner survey on the overall state of physical recovery among the population of homes that were located on
significantly affected blocks and that suffered major or severe damage in the hurricanes. This chapter supplements what is known from the earlier windshield observations, the findings of which are described in the Phase I report. While the windshield observations provided direct field reports of the exterior physical conditions of a wider sample of properties, the owner survey responses provide additional detail and nuance, particularly with regard to the pre-hurricane condition of the properties as well as the specific systems damaged by the hurricanes—although for a smaller sample of properties. In addition to focusing primarily on repair needs and rebuilding status, we pay particular attention in this chapter to two overlapping special populations: former owners (and the disposition of their properties) and movers (and their new housing and neighborhood conditions). This information is presented in this report because of the connection between the level of damage and consequent repair need and the decision to leave the property.
The first section of the chapter discusses the survey findings on the pre-hurricane condition of properties and the severity and type of hurricane damage. The second section then discusses the ownership status of the sampled properties as of 2011, because many properties have changed owners since the hurricanes, to determine any association between pre-hurricane condition and damage with ownership changes. The third section presents the survey findings on the condition of the hurricane-damaged properties as of early 2011, and the fourth section discusses the repair and rebuilding that owners report undertaking since
the storms. The chapter concludes with a discussion of the reasons for not rebuilding among owners who reported they did no repair or rebuilding work on their hurricane-damaged properties.
3.1 PRE-HURRICANE CONDITIONS AND HURRICANE DAMAGEThe property owner survey asked owners about the overall condition of their properties in August 2005, immediately before the hurricanes struck. Owners were asked to rate the condition of their properties as excellent or good, fair, or poor. Based on the survey findings, we estimate that most of these properties (among the study population of owned properties that suffered major or severe storm damage and were located on significantly affected blocks) were in excellent or good condition before the arrival of Hurricanes Katrina, Rita, and Wilma in August 2005.
As shown in exhibit 3-1, 94.8 percent of owners in Texas, Louisiana, and Mississippi considered their homes to have been in excellent or good condition before the storms based on their own subjective assessment. Comparing the three states, owners in Texas were significantly less likely to have considered their homes to be in excellent or good condition before the hurricane (85.4 percent), and significantly more likely to rate their homes as having been in fair condition (13.0 percent). By contrast, about 95 percent of property owners in Louisiana and Mississippi rated their properties as having been in excellent or good condition before the hurricanes, and 5 percent said they had been in fair or poor condition. Differences in responses between owners in Louisiana and Mississippi were not statistically significant.

23Chapter 3: Repair Needs and Rebuilding
Exhibit 3-1. Pre-Hurricane Property Condition by State and Overall
Note: Weighted population estimates based on 702 survey responses.
Source: 2011 Property Owner Survey
Exhibit 3-2. Pre-Storm Home Values by State
Louisiana Mississippi Texas
Percentile CI Percentile CI Percentile CI
Less than $80,000 15.3 11.4–19.1 13.9 7.9–20.0 34.4 22.6–46.2
At least $80,000 but less than $175,000
48.8 43.1–54.4 50.1 41.0–59.2 53.1 40.1–66.0
At least $175,000 but less than $300,000
22.6 18.6–26.6 20.4 12.6–28.3 3.0 0.0–7.5
$300,000 or more 9.6 6.4–12.8 8.0 1.2–14.8 0.2 0.0–0.5
Don’t know/refused 3.8 2.4–5.1 7.5 3.8–11.2 9.3 1.7–16.9
CI = 90 percent confidence interval.
Note: Weighted population estimates based on 702 property owners who owned the property in 2005 before the hurricane.
Source: 2011 Property Owner Survey
This finding is consistent with the Texas program’s emphasis on income and geographic targets, and is further supported by an analysis of the differences in pre-storm home values by state, as shown in exhibit 3-2. Texas had a larger share of properties with home
values less than $175,000 than either Mississippi or Texas. There was a significant difference in pre-storm value at the 1 percent level between properties in Texas and Louisiana and between properties in Texas and Mississippi.
100%
95%
90%
85%
80%
75%
Louisiana
Poor condition
Fair condition
Excellent or good condition
Mississippi Texas Overall
95.8
4.1
0.1 0.6 0.31.5
93.8
5.6
85.4
13
4.8
94.8

24Chapter 3: Repair Needs and Rebuilding
Severity of Hurricane DamageAs described in chapter 2, the property owner survey was designed to focus on owners of properties that experienced major or severe damage from the 2005 hurricanes. The survey asked owners about the damage assessments they had received or commissioned and the amount of damage assessed. About 75 percent of 2005 owners reported receiving a damage assessment for their property.23 The damage assessments came from several sources, and about 47 percent of owners reported that more than one damage assessment was done. Most commonly, damage assessments were from an insurance company (77.4 percent), followed by FEMA (9.7 percent) or The Road Home program in Louisiana (3.2 percent).
Not surprisingly, owners reported substantial levels of damage to their properties based on these assessments. Exhibit 3-3 presents the distribution of reported damage amounts by state, based on the highest assessed amount reported for owners who reported having
23 In the property owner survey, 144 respondents reported not having an as-sessment done, 2 refused to have an assessment done, and 28 did not know if they had had an assessment done, though the early FEMA assessments were performed for most houses in our database. See the analysis by the U.S. Depart-ment of Housing and Urban Development’s Office of Policy Development and Research titled “Current Housing Unit Damage Estimates: Hurricanes Katrina, Rita, and Wilma” of February 12, 2006.
received multiple assessments.24 The assessed damage amounts were highest in Louisiana, with a median amount of $89,523, and lowest in Texas, with a median amount of $35,124. Both the median and the 75th percentile assessed damage amounts were substantially lower in Texas than in the other two states. In all three states, however, the 25th percentile damage amount is substantially higher than the FEMA threshold for major damage, which is $5,200 (see discussion in chapter 1). This is true even in Texas, where (as described in chapter 2) the owner survey sample included some properties assessed by FEMA as having minor damage but which nonetheless received CDBG assistance. The owner damage assessments suggest that these properties indeed sustained greater damage than was captured by the FEMA assessment.
24 Survey respondents were encouraged to report damage assessments in the fol-lowing specific priority: assessments by (1) insurance providers, (2) FEMA, (3) the CDBG programs, (4) any other type. However, in many cases in which the owner cited multiple assessments, the dollars amounts provided were substan-tially different, making interpretation difficult. The highest assessment amount may exaggerate the amount of damage somewhat, but it provides a consistent rule for handling cases in which the same property has multiple assessments that are different in amount.
Exhibit 3-3. Owner-Reported Assessed Damage Amount by State—Median and by Percentile
Louisiana Mississippi Texas
Percentile CI Percentile CI Percentile CI
25th percentile $44,700 $32,029–$57,369 $24,328 $13,717–
$34,939 $23,772 $10,859–$36,684
Median $89,523 $77,704– $101,342 $74,227 $58,957–
$89,495 $35,124 $18,756–$51,492
75th percentile $145,535 $133,008– $158,061 $125,639 $81,182–
$170,094 $66,084 $29,084– $104,026
CI = 90 percent confidence interval.
Note: Weighted population estimates based on 340 survey responses. For owners who reported receiving more than one damage assessment, we used the highest damage assessment reported.
Source: 2011 Property Owner Survey

25Chapter 3: Repair Needs and Rebuilding
In general, however, the owner-reported damage assessment amounts should be treated with caution. In comparing the owner-reported assessed damage amount to the assessed damage amount contained in the CDBG administrative data for CDBG recipient properties, we found a weak correlation between the owner-reported amounts and the amounts in the administrative data for the same properties. Assuming the information in the CDBG administrative data is relatively accurate, this suggests that owners either had difficulty recalling with accuracy their assessed damage amounts or misinterpreted the findings of their assessment. Nevertheless, the owner-reported damage amounts are the best source available for the full survey sample and provide useful descriptive information. We do not use the owner-reported damage amounts in any multivariate analysis, given the uncertainty about the data quality.
In addition to asking about assessed damage amounts, the survey asked owners about the type and extent of damage. One measure is whether the damage was such that the structure was condemned or had to be leveled or demolished. Overall, 23.2 percent of owners reported that their structures had been leveled, condemned, or demolished (exhibit 3-4). Owners in Texas were more likely to report this type of damage (31.6 percent) than owners in Louisiana (22.2 percent) or Mississippi (24.5 percent), a finding that may be partially explained by the lower pre-storm home values in that state.
Exhibit 3-4. Share of Properties Leveled, Condemned, or Demolished
Percent CI
Louisiana 22.2 16.7 – 27.8
Mississippi 24.5 13.8–35.1
Texas 31.6 19.6–43.6
All states 23.2 18.5 –27.8CI = 90 percent confidence interval.
Note: Weighted population estimates based on 702 survey responses.
Source: 2011 Property Owner Survey
Types of Hurricane DamageThe parts of homes that sustained damage also varied across states. Overall, damage to the roof was the most common type of exterior damage (85.4 percent of properties), and damage to the paneling, ceiling, and drywall was the most common type of damage to the property’s interior (90.6 percent of properties). Damage to doors or windows (74.6 percent), electrical system (76.3 percent), and air conditioning or heating system (77.6 percent), and interior mold damage (75.4 percent), were also very common. The least common type of damage was to foundations or to septic tanks (for properties with septic tanks).
As shown in exhibit 3-5, nearly all Texas owners reported roof damage (96.9 percent); damage to siding or exterior walls was also more likely to be reported in Texas than in Mississippi or Louisiana, as was damage to porches, stairs, and foundations. A larger share of owners reported damage to electrical systems (79.6 percent) and air conditioning or heating systems (81.1 percent) in Louisiana than in other states; interior mold damage was also most common in Louisiana (81.9 percent).

26Chapter 3: Repair Needs and Rebuilding
Exhibit 3-5. Parts of Homes that Sustained Damage: Proportion with Damage
Percent of Owners Reporting Each Type of Damage:
Texas Mississippi Louisiana Overall
Paneling, ceiling, or drywall 86.6 90.0 91.0 90.6
Roof 96.9 87.7 84.0 85.4
Air conditioning or heating system
54.0 70.6 81.1 77.6
Electrical system 65.3 67.6 79.6 76.3
Interior mold damage 59.3 57.3 81.9 75.4
Doors or windows 73.1 65.7 77.4 74.6
Siding or exterior walls 75.0 50.1 58.3 57.2
Plumbing 46.3 37.1 55.6 51.1
Garage 45.6 49.9 47.5 47.9
Other 34.0 38.7 44.1 42.4
Porch or stairs 54.0 41.6 40.6 41.4
Foundation 37.2 22.1 24.9 24.8
Septic tank 9.6 5.8 7.3 7.0
Note: Weighted population estimates based on 702 survey responses.
Source: 2011 Property Owner Survey
Differences between the specific parts of homes that were damaged are related to the type of storm damage suffered in the state. As shown in exhibit 3-6, the likelihood of flooding was significantly higher in Louisiana and Mississippi than in Texas, where only 32.6 percent of owners reported flood damage. In comparison, 89.1 percent of owners in Louisiana
reported flood damage—consistent with the high shares of owners reporting interior mold damage in Louisiana described previously. In Texas, other types of storm damage—most often wind—were the most common, which corresponds with the high share of owners reporting roof damage in Texas.
Exhibit 3-6. Type of Storm Damage Reported by State
Louisiana Mississippi Texas
Number % CI Number % CI Number % CI
Flood damage 125,087 89.1 85.6–92.5 38,110 80.6 72.4–88.8 2,717 32.6 20.6–44.7
No flood damage (typically wind)
14,976 10.7 7.4–14.0 8,945 18.9 10.9–27.0 5,612 67.4 55.3–79.4
Don’t know/ refused
274 0.2 0.0–0.5 236 0.5 0.0–1.3 0 0 N/A
Total 140,337 100 47,291 100 8,329 100
CI = 90 percent confidence interval.
Note: Weighted population estimates based on 702 survey responses.
Source: 2011 Property Owner Survey

27Chapter 3: Repair Needs and Rebuilding
The survey investigated the specific home systems damaged in the 2005 hurricanes to determine an association between that damage and the current owner-reported condition of the home. Looking at the array of 2005 damaged systems (exhibit 3-7), homes that incurred foundation and septic tank damage were in poorer condition than other homes as of the time of the 2011 owner survey, although (as noted) foundation and septic tank damage was reported with less frequency than other damaged systems.
Exhibit 3-7 further suggests that while 69.4 percent of homes were generally rated by their owners as being in excellent or good condition,25 only 46.7 percent of properties that sustained damage to the foundation and
25 Note that this percentage increases to 70.3 percent when respondents who did not answer the question, or said they did not know, are excluded, as is shown in exhibit 3-13.
58.2 percent of properties that sustained damage to the septic tank were given this rating. Likewise, while 13.8 percent of homes overall were characterized as being totally destroyed, this was true for 25.0 percent of homes with damage to the foundation and 20.0 percent of homes with damage to the septic tank. Given the importance of these systems to the structural integrity and habitability of the properties, persistent inhabitability because of their being damaged is not surprising. This does pose the possibility that other barriers to their repair may have been present, however, such as lack of sufficient funding to cover the costs of these primary systems, a lack of specialized contractors, or a poorer original construction quality. Further, many of these barriers are likely present for rural households, mirroring the fact that septic systems tend to be located in rural properties without infrastructure.
Exhibit 3-7. Current Condition by Type of Hurricane Damage Reported
Current Condition
Percentage of Respondents Reporting by Damage Type
Ro
of
Sid
ing
/Exte
rio
r W
alls
Do
ors
or
Win
do
w
Po
rch
/Sta
irs
Fo
un
dati
on
Plu
mb
ing
Se
pti
c T
an
k
Ele
ctr
ical S
yst
em
Air
Co
nd
itio
nin
g
Mo
ld
Pan
elin
g
Gara
ge
Oth
er
Ove
rall
Excellent or good
71.8 61.7 68.9 62.0 46.7 65.5 58.2 70.1 70.7 69.1 72.4 73.7 64.4 69.4
Fair 13.1 15.3 11.7 13.4 13.6 10.1 15.1 12.2 11.9 12.8 12.1 15.4 17.0 10.7
Poor but people could live there
1.7 2.2 2.0 2.6 3.6 1.9 — 1.1 0.9 1.6 1.7 0.8 1.9
10.7Poor and people couldn’t live there
2.7 5.0 4.7 4.5 8.9 6.1 6.7 4.4 4.6 4.4 3.8 2.1 3.3
Totally destroyed
9.2 14.1 11.0 14.3 25.0 14.4 20.0 10.3 10.1 10.3 8.8 6.2 11.3 13.8
Don’t know/refused
1.5 1.8 1.4 3.2 2.2 1.8 — 1.7 1.7 1.6 1.2 1.7 2.2 1.2
Note: Weighted population estimates based on 594 survey responses.
Source: 2011 Property Owner Survey

28Chapter 3: Repair Needs and Rebuilding
3.2 PROPERTY OWNERSHIP IN 2011At the time of the property owner survey in early 2011, about 82 percent of owners continued to own the property that was damaged in the storm, while the remaining 18 percent had sold or otherwise relinquished ownership of the property.
Exhibit 3-8 shows the ownership of properties in 2011 in the sample overall and by state. Properties in Louisiana were significantly more likely to have changed ownership than properties in the other two states. In Louisiana, 20.5 percent of hurricane-damaged properties had a new owner as of 2011 compared with 10.0 percent of properties in Mississippi and 12.3 percent in Texas.
In most cases in which the property changed ownership, the property was sold. Among the group of
former owners, 84.4 percent reported having sold the property and 5.4 percent said they had lost the home to foreclosure. The remaining 10.2 percent ceased owning the property for some other reason.
In Louisiana, 17.5 percent of 2005 owners sold their properties between 2005 and 2011, compared with 8.8 percent in Mississippi and 5.0 percent in Texas. The higher share of sellers in Louisiana is partially explained by the option for that states’ residents of selling to the state through the CDBG program; 21 percent of sellers in Louisiana reported selling to the Louisiana Land Trust or to The Road Home program (exhibit 3-9). The higher proportion of sellers in Louisiana may also reflect the greater severity of hurricane damage in that state, making it less likely that owners would think it worthwhile to stay and invest in their properties and neighborhoods.
Exhibit 3-8. Ownership of Hurricane-Affected Properties in 2011
Louisiana(N = 145,518)
Mississippi(N = 47,626)
Texas(N = 8,958)
All(N = 202,102)
N % CI N % CI N % CI N % CI
Continuing owner
115,716 79.5 73.1– 86.0 42,862 90.0 86.3–
93.7 7,857 87.7 79.3– 96.1 166,242 82.4 77.4–
87.3
Former owner
29,801 20.5 14.0– 26.9 4,763 10.0 6.3–
13.7 1,102 12.3 3.9– 20.7 35,666 17.6 12.7–
22.6
CI = 90 percent confidence interval.
Note: Weighted population estimates based on 722 survey responses.
Source: 2011 Property Owner Survey
Exhibit 3-9. Buyers for Properties Sold After the Hurricanes
N %
An individual person 21,679 72.0
Louisiana Land Trust/Road Home Program 5,287 17.6
Another type of buyer 1,073 3.6
A real estate company 860 2.9
A nonprofit organization 609 2.0
A bank or financial institution 604 2.0
Total 30,112 100.0
Note: Weighted population estimates based on 105 survey responses.
Source: 2011 Property Owner Survey
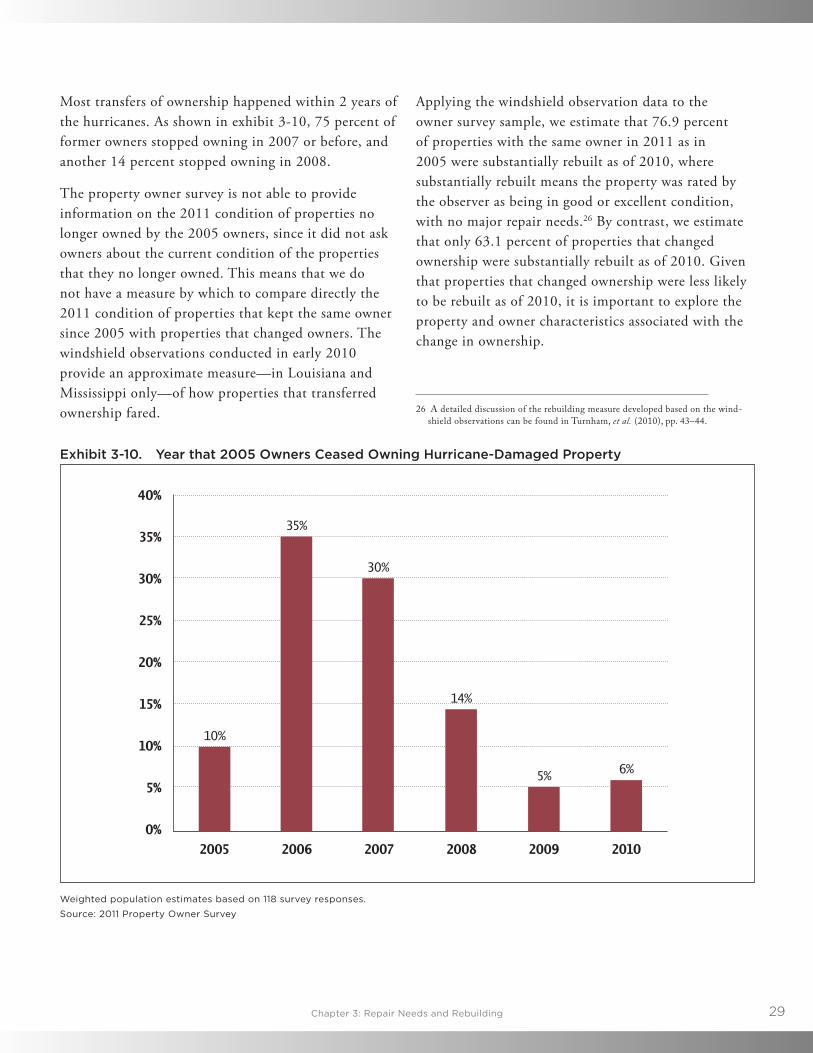
29Chapter 3: Repair Needs and Rebuilding
Most transfers of ownership happened within 2 years of the hurricanes. As shown in exhibit 3-10, 75 percent of former owners stopped owning in 2007 or before, and another 14 percent stopped owning in 2008.
The property owner survey is not able to provide information on the 2011 condition of properties no longer owned by the 2005 owners, since it did not ask owners about the current condition of the properties that they no longer owned. This means that we do not have a measure by which to compare directly the 2011 condition of properties that kept the same owner since 2005 with properties that changed owners. The windshield observations conducted in early 2010 provide an approximate measure—in Louisiana and Mississippi only—of how properties that transferred ownership fared.
Applying the windshield observation data to the owner survey sample, we estimate that 76.9 percent of properties with the same owner in 2011 as in 2005 were substantially rebuilt as of 2010, where substantially rebuilt means the property was rated by the observer as being in good or excellent condition, with no major repair needs.26 By contrast, we estimate that only 63.1 percent of properties that changed ownership were substantially rebuilt as of 2010. Given that properties that changed ownership were less likely to be rebuilt as of 2010, it is important to explore the property and owner characteristics associated with the change in ownership.
26 A detailed discussion of the rebuilding measure developed based on the wind-shield observations can be found in Turnham, et al. (2010), pp. 43–44.
Exhibit 3-10. Year that 2005 Owners Ceased Owning Hurricane-Damaged Property
Weighted population estimates based on 118 survey responses.
Source: 2011 Property Owner Survey
30%
40%
20%
35%
15%
25%
10%
5%
0%
2005 2006 2007 20092008 2010
10%
35%
30%
14%
5% 6%

30Chapter 3: Repair Needs and Rebuilding
Property Characteristics Associated with Change in OwnershipThere are several property-level characteristics that could be associated with the likelihood that a property damaged in the hurricanes would be sold (or otherwise change ownership) at some point afterwards. These characteristics include pre-storm attributes of the properties, such as tenure and house value in 2005, as well as the type and level of damage experienced during the hurricane.
Exhibit 3-11 examines four pre-storm property characteristics that could be associated with an owner’s decision to get rid of the property: tenure, presence of a mortgage, presence of insurance, and owner-reported
home value. Properties that changed ownership after the hurricanes were more likely to be owner occupied at the time of the storms than properties that did not change ownership, and this difference is statistically significant at the 5 percent level. This result is interesting and somewhat surprising, given that one might hypothesize that homeowners are more attached to their properties than owners of rental properties. However, it may be that owners of rental properties were more able to hold on to a damaged property as an investment while homeowners needed either to rebuild the property or to sell it quickly in order to have a place to live.
Exhibit 3-11. Association Between Pre-Storm Property Characteristics and Change in Ownership
Property Changed Ownership
Property Did NotChange Ownership
Percent CI Percent CI
Tenure*
Owner occupied 88.1 82.1–94.2 76.1 71.9–80.3
Renter occupied 8.5 2.9–14.1 20.5 16.3–24.8
Vacation/other 2.6 1.0–4.2 3.1 1.8–4.3
Don’t know/refused 0.8 0.0–2.1 0.3 0.0–0.8
Mortgage Presence
Mortgage 56.0 46.4–65.5 49.2 44.4–54.0
No mortgage 44.0 34.5–53.6 50.0 45.2–54.8
Don’t know/refused 0.0 0 0.8 0.2–1.5
Insurance Presence
Insurance (homeowners’ or flood) 86.0 79.2–92.8 80.3 77.0–83.6
No insurance 11.8 5.8–17.8 16.2 13.1–19.4
Don’t know/refused 2.2 0.0–5.1 3.4 2.1–4.8
Owner-Reported Value
Value less than $80,000 12.3 6.6–18.0 16.5 13.2–19.8
Value $80,000–$175,000 45.8 36.8–54.7 50.0 45.1–54.9
Value $175,000–$300,000 25.9 19.6–32.2 20.2 16.4–24.1
Value $300,000+ 12.8 6.6–19.0 8.0 5.1–10.8
Don’t know/refused 3.2 0.4–6.1 5.3 3.7–6.9
CI = 90 percent confidence interval. **p < 0.01; *p < 0.05; +p < 0.10.
Note: Weighted population estimates based on 702 survey responses.
Source: 2011 Property Owner Survey

31Chapter 3: Repair Needs and Rebuilding
In addition to being more likely to be owner occupied, properties that changed ownership were also more likely to have had a mortgage, more likely to have had insurance, and more likely to have been valued at $175,000 at the time of the hurricanes, based on the owner’s assessment.27 These differences, however, are not statistically significant.
We also explored the relationship between the hurricane damage experienced by the property and the likelihood that the property had changed owners after 2005, using three measures of damage: the assessed damage amount reported by owners, whether the damage was from flooding or wind alone, and whether the damage had resulted in the structure needing to be leveled, condemned, or demolished. We find that the median assessed damage amount was higher for properties that had changed ownership after 2005, suggesting that owners with properties that had sustained more damage were more likely to leave their properties (exhibit 3-12). The median damage assessment reported by continuing owners was $78,125, compared with $98,720 for former owners. This difference is not statistically significant, however.
27 The interviewers asked owners how much they think the house and lot would have sold for in August 2005, around the time of the hurricanes.
Consistent with the higher damage assessment amounts for properties that had changed owners, these properties that changed owners after 2005 were also more likely to have had damage so substantial that the structure had been leveled, condemned, or demolished. Specifically, 37.6 percent of properties that had changed owners had been leveled, condemned, or demolished, compared with 20.0 percent of properties with the same owner in 2011 as 2005 (exhibit 3-13). This difference is statistically significant, indicating that 2005 owners were more likely to sell if their structure had been leveled or condemned, or had to be demolished. About one-fourth of the homes in Louisiana that were sold in this condition were sold to the Louisiana Land Trust (LLT) as part of The Road Home program. Among owners who reported selling to the LLT, 83 percent said the damage to the home was such that it was leveled, condemned, or demolished.
Exhibit 3-12. Total Dollar Amount of Assessed Damage as Reported by Owners
Property Did NotChange Ownership
Property ChangedOwnership
Percentile CI Percentile CI
25th percentile $34,391 $25,749–$43,032 $63,921 $38,769–$89,072
Median $78,125 $68,933–$87,317 $98,720 $80,061–$117,378
75th percentile $143,407 $127,288–$159,525 $136,886 $125,710–$148,061
CI = 90 percent confidence interval.
Notes: Weighted population estimates based on survey responses from 289 continuing owners and 51 former owners who provided a damage assessment amount. For owners who reported receiving more than one damage assessment, we used the highest damage assessment reported.
Source: 2011 Property Owner Survey

32Chapter 3: Repair Needs and Rebuilding
Exhibit 3-13. Association Between Damage Extent and Change in Ownership
Property Did NotChange Ownership
Property ChangedOwnership
Percentile CI Percentile CI
Structure was leveled, demolished, or condemned
20.0 15.9–24.1 37.6 28.3–46.9
Structure was not leveled, demolished, or condemned
78.8 74.7–83.0 60.9 51.9–70.0
Don’t know/refused 1.2 N/A 1.5 N/A
Total 100 100
CI = 90 percent confidence interval. **p < 0.01; *p < 0.05; +p < 0.10.
Notes: Weighted population estimates based on 702 survey responses. Percentages do not sum to 100 because a small number of survey respondents did not answer the question.
Source: 2011 Property Owner Survey
Owner Characteristics Associated With Change in OwnershipIn addition to looking at property characteristics, we also used the survey findings to explore owner characteristics that might be associated with the decision to sell or get rid of a hurricane-damaged property rather than to stay in the home and rebuild. For example, we hypothesized that such decisions might be conditioned by life stage (elderly might be less likely to move) and income (people with less resources might be more willing to sell than to stay and rebuild). We considered owner age, presence of dependents in household, disability status, pre-storm income, and race. However, we did not find a statistically significant association between any of these owner characteristics and the likelihood that a property would have changed ownership after the hurricanes.
3.3 HOUSING CONDITIONS IN 2011For properties that had the same owner in early 2011 as in 2005, the owner survey provided the opportunity to collect information from those owners on the 2011 condition of the property, taking into account external as well as internal systems and repair needs.
Exhibit 3-14 shows the condition of hurricane-damaged properties in early 2011 based on reports by continuing owners. The owner ratings of 2011 housing conditions are quite different from the ratings of conditions before the hurricanes, which are shown in exhibit 3-1. Exhibit 3-14 shows that 74.6 percent of owners said their hurricane-damaged properties were in excellent or good condition as of early 2011, compared with 94.8 percent in 2005. More than 15 percent of owners rated their property as being in fair (10.8 percent) or poor (4.9 percent) condition at the time of the survey, and 9.7 percent said it had been totally destroyed.28
28 The excellent or good category includes 56 cases (out of 588 surveyed) in which the hurricane-damaged residential structure was totally destroyed but the lot contains a second structure built to replace the one destroyed by the storm and rated by the owner as being in excellent or good condition.

33Chapter 3: Repair Needs and Rebuilding
Exhibit 3-14. Owner-Reported Condition of Properties in Early 2011 by State and Overall
Note: Weighted population estimates based on 588 survey responses.
Source: 2011 Property Owner Survey
These owner-reported ratings of overall property condition in 2011 can be compared with the findings from the windshield observations on the condition of properties about a year earlier and based only on what could be seen from the outside. 29 It is important to note that the distributions are quite similar between the two surveys: 73.6 percent of properties were in excellent or good condition based on the windshield observations in 2010, 10.1 were in fair condition, 4.6 percent were in fair condition, and 11.6 were destroyed or in the process of being rebuilt. This finding suggests that the owner-reported conditions among current owners are credible.
Housing Conditions in 2011 for Movers Versus StayersOne question of interest to the study is how people who were unable to or chose not to move back to their homes at the time of the storm are faring in their new locations. Approximately one-fourth of the weighted survey sample—51,377 of 202,102—were people who in 2005 owned and lived on a property that was
29 See Turnham, et al. (2010).
damaged by the hurricanes, but who as of early 2011 were living elsewhere regardless of ownership. Slightly more than 10 percent of these people identified their current housing as being in the same neighborhood as the property they had owned in 2005, but most were living in a different neighborhood, county, or state. These people were also no longer all homeowners. As shown in exhibit 3-15, 60.4 percent lived in a home they owned, but 17.8 percent were renting a house, apartment, or mobile home; another 17.8 percent were living with family or friends (some rent free); and 2.8 percent were living in a FEMA trailer or in some other situation.
80%
90%
100%
60%
70%
40%
50%
20%
30%
10%
0%Louisiana
Poor
Totally destroyed
Fair
Excellent or good
Mississippi Texas Overall
74.8
11.6
6.1
7.516.10.4
9.7
11.2
8.4
74.6
8.9
70.6
9.810.8
4.9
74.6

34Chapter 3: Repair Needs and Rebuilding
Exhibit 3-15. Current Housing of 2005 Owner-Occupiers Living Elsewhere in Early 2011
Percent Number
Living in a home that you own 60.4 31,011
Renting a house, apartment, or mobile home 17.8 9,128
Living with family or friends and not paying rent 10.8 5,557
Living with family or friends and paying part of the rent 7.0 3,598
FEMA trailer or other temporary housing provided after the storm 0.3 162
Some other housing situation 2.5 1,266
Don’t know/refused 1.3 654
Total 100.0 51,377
Note: Weighted population estimates based on 201 survey responses.
Source: 2011 Property Owner Survey
As described previously, the survey asked owners to rate the current condition of their housing, as of early 2011. When comparing the responses of those people who in 2011 were living on the same property as in 2005 (stayers) to the responses of people who had moved elsewhere (movers), we find that people who moved away rated the condition of their 2011 housing somewhat more highly than those who stayed, but that these differences are not statistically significant (exhibit 3-16).
We find a greater difference in levels of satisfaction with the current neighborhood. Movers were
significantly more like to be very satisfied with their 2011 neighborhood than stayers. As shown in exhibit 3-17, 70.4 percent of movers said they were very satisfied with their current neighborhood, compared with 47.8 percent of stayers. Even with small sample sizes, this is a statistically significant difference. Movers were also significantly more likely to describe their neighborhoods as very safe than stayers were, although in both cases 85 percent or more of respondents described their neighborhoods as either safe or very safe.
Exhibit 3-16. Owner-Reported Condition of Current Housing Occupied by Movers and Stayers
Movers Stayers
Number Percent CI Number Percent CI
Excellent or good condition 46,633 90.8 86.4–95.1 90,724 84.7 81.0–88.3
Fair condition 4,348 8.5 4.3–12.6 14,066 13.1 9.7–16.6
Poor condition 396 0.8 0.0–1.7 2,045 1.9 0.8–3.0
Don’t know/refused — — 322 0.3
Total 51,377 100.0 107,157 100.0CI = 90 percent confidence interval.
Notes: Weighted population estimates based on 201 mover responses and 376 stayer responses. Among stayers, does not include survey respondents who indicated they lived in a FEMA trailer or other temporary housing.
Source: 2011 Property Owner Survey

35Chapter 3: Repair Needs and Rebuilding
Exhibit 3-17. Satisfaction with Current Neighborhood for Movers and Stayers
Movers Stayers
Number Percent CI Number Percent CI
Very satisfied 36,158 70.4 64.1–76.7 52,125 47.8 43.4–52.2
Somewhat satisfied 12,222 23.8 18.3–29.3 37,305 34.2 30.0–38.4
Neither satisfied nor dissatisfied
1,829 3.6 0.9–6.3 4,746 4.4 2.6–6.1
Somewhat dissatisfied 495 1.0 0.0–1.9 11,035 10.1 7.6–12.6
Very dissatisfied 673 1.3 0.2–2.4 3,275 3.0 1.3–4.8
Total 51,377 100 108,486 100
CI = 90 percent confidence interval.
Note: Weighted estimates based on 201 mover responses and 381 stayer responses.
Source: 2011 Property Owner Survey
Given the level of satisfaction expressed with their new neighborhoods, it is not surprising that most people who moved away from their 2005 neighborhood did not plan to return, regardless of housing condition. Overall, two-thirds (66 percent) of those who moved to a different neighborhood after the hurricanes reported
that they were not interested in moving back. Among all movers, the three most common reasons for not having moved back were a preference for the current neighborhood, a belief that the old neighborhood was not safe, and a belief that the old neighborhood was not ready for people to move back (exhibit 3-18).
Exhibit 3-18. Reasons for Not Returning to Pre-Hurricane Neighborhood
Notes: Weighted population estimates based on 171 mover responses. Exhibit does not include movers who moved to a different property but stayed within the same neighborhood.
Source: 2011 Property Owner Survey
Neighborhood is not safe
Prefer current neighborhood
Cannot afford to move
Neighborhood is not ready
Family no longer lives there
Cannot find housing there
Poor health
Cannot find a good job there
Divorce or widowhood
No schools for my children Small reason
Big reason
60%
36%
34%
35%
24%
27%
15%
15%
14%
10%
16%
10%
12%
8%
12%
7%
10%
7%
4%
7%
0% 20% 40% 60% 80%

36Chapter 3: Repair Needs and Rebuilding
3.4 REBUILDING ACTIVITY SINCE 2005This section describes the state of rebuilding in early 2011 in response to hurricane damage. In contrast to the windshield survey, which either directly observed or (more commonly) inferred rebuilding activity based on visual appearance, the owner-reported findings in this report provide a richer depiction of rebuilding activity. These data address the completion level, scheduling, cost, and extent of rebuilding, or the explicit reasons for not rebuilding—information that is obviously not available through visual observation.
Rebuilding Activity and CompletionOverall, we estimate that about three-fourths (77.0 percent) of owners of properties with major or severe storm damage on significantly affected blocks had done some rebuilding in the 5.5 years since the hurricanes. As shown in exhibit 3-19, as of early 2011, 57.5 percent of owners had completed rebuilding, and 19.5 had started rebuilding but had given up, not yet completed the work, or sold the property before they completed the work. We estimate that 23.0 percent of owners did no rebuilding at all.
Exhibit 3-19. Extent of Rebuilding Activities
Number Percent CI
Repair or rebuilding completed 116,165 57.5 53.2–61.8
Repair or rebuilding started but not completed 39,493 19.5 16.3–22.8
Repair or rebuilding never started 46,443 23.0 18.0–28.0
Total 202,102 100
CI = 90 percent confidence interval.
Note: Weighted population estimates based on 722 survey responses.
Source: 2011 Property Owner Survey
Exhibit 3-20 shows that owners in Louisiana were somewhat less likely to have completed rebuilding than owners in the other states, but the differences between the distributions are not statistically significant. The estimates in exhibits 3-19 and 3-20 are based on survey responses from all owners surveyed, including those who sold or otherwise got rid of the property at some point after the hurricanes.
As described previously in section 3.2, we estimate that 18 percent of the 2005 owners of hurricane-damaged properties on significantly affected blocks no longer owned the property in 2011. Not surprisingly, former owners are significantly less likely to have engaged in any rebuilding (before the property changed hands) than owners who held on to the property (see exhibit 3-21).

37Chapter 3: Repair Needs and Rebuilding
Exhibit 3-20. Extent of Rebuilding Activities by State
Note: Weighted population estimates based on 467 survey responses in Louisiana, 171 survey responses in Mississippi, and 84 survey responses in Texas.
Source: 2011 Property Owner Survey
80%
90%
100%
60%
70%
40%
50%
20%
30%
10%
0%Louisiana N = 145,518
Mississippi N = 47,626
Texas N = 8,958
Repair/rebuilding completed
Repair/rebuilding started but not completed
No repairs or rebuilding
24.8%
19.4%
55.8% 61.2% 64.9%
17.8%
21.0%
21.1%
14.0%
80%
90%
100%
60%
70%
40%
50%
20%
30%
10%
0%Continuing Owners
N = 166,436Former Owners
N = 35,666
Any repair or rebuilding
No repair or rebuilding14%
86%
34%
66%
Exhibit 3-21. Rebuilding by Continuing and Former Owners
Note: Weighted population estimates based on 594 survey responses for continuing owners and 127 survey responses for former owners.
Source: 2011 Property Owner Survey
ongoing repair or rebuilding activity.30 Because the Overall, we estimate that about 10 percent of all continuing owners of hurricane-damaged properties on significantly affected blocks had work actively under way as of early 2011. As a point of comparison, the estimates from the windshield observations conducted in 2010 were that about 5 percent of properties with major or severe hurricane damage had observable
owners can report on interior work not observable from the street, these estimates are not inconsistent.
Among continuing owners who have not done any rebuilding as of 2011, about two-thirds (63 percent)
30 Turnham, et al. (2010), p. 44.

38Chapter 3: Repair Needs and Rebuilding
reported that they do not intend to rebuild or do not know if they plan to rebuild. This is consistent with our observation that most owners who rebuilt (including continuing and former owners) began rebuilding in 2005 and 2006 (exhibit 3-22) and, if they completed rebuilding, finished the work by 2008 (exhibit 3-23).
Owners who completed rebuilding did so faster in Texas and Mississippi than in Louisiana. As shown in exhibit 3-24, 40 percent of Texas owners who completed rebuilding did so in 2005, compared with 20 percent in Mississippi and 10 percent in Louisiana.
By 2006, about three-fourths of the owners in Texas and Mississippi who would complete rebuilding had done so, compared with less than one-half the owners in Louisiana. This may be a further indication of the greater severity of damage in Louisiana, requiring more time to rebuild, as well as contention over flood damage versus other hurricane damage and what damages flood and homeowners insurance would cover. As shown previously in exhibit 3-3, Louisiana had the highest assessed damage amounts of the three states, although Texas owners were most likely to report their properties had been condemned or had had to be demolished.
Exhibit 3-22. Year Repair or Rebuilding Work Started
Note: Weighted population estimates based on 458 survey responses from owners who engaged in some repair or rebuilding work to their hurricane-damaged property between 2005 and early 2011.
Source: 2011 Property Owner Survey
30%
45%
50%
40%
20%
35%
15%
25%
10%
5%
0%
2005 2006 2007 20092008 2010
47%
35%
12%
4%
1% 1%

39Chapter 3: Repair Needs and Rebuilding
Exhibit 3-23. Year Repair or Rebuilding Work Was Completed
Note: Weighted population estimates based on 348 survey responses from owners who completed repair or rebuilding work to their hurricane-damaged property.
Source: 2011 Property Owner Survey
Exhibit 3-24. Year Repair or Rebuilding Work Was Completed by State, Cumulative
Note: Weighted population estimates for owners who completed repair or rebuilding based on 208 survey responses in Louisiana, 87 survey responses in Mississippi, and 57 survey responses in Texas.
Source: 2011 Property Owner Survey
30%
45%
40%
20%
35%
15%
25%
10%
5%
0%
2005 2006 2007 20092008 2010 2011
41%
13%
24%
11%
4%6%
1%
Louisiana
Mississippi
Texas
80%
90%
100%
60%
70%
40%
50%
20%
30%
10%
0%2005 2006 2007 20092008 2010 2011

40Chapter 3: Repair Needs and Rebuilding
Elevation Activity and CompletionOne particular kind of rebuilding of interest to this study is the elevation of properties located within 100-year flood plains, in anticipation of future possible disasters. FEMA established advisory base flood elevations (ABFEs) for several of these regions after the storms, which, when formally adopted by the municipalities, become base flood elevations (BFEs). CDBG funds in each state also included elevation grant options that stipulated specific requirements for elevating homes. For example, Louisiana’s The Road Home Elevation Incentive program required grantees to elevate their homes within 3 years of grant receipt to the minimum ABFE requirements for a particular parish or the BFE levels in effect on August 26, 2006.
For those receiving other CDBG funding, the requirements as well as the specific height standards were less clear. In Louisiana, Option 1 recipients were required to comply with BFEs adopted by local government. In Mississippi, all Phase I and Phase II recipients of funds were required to elevate to the advisory BFEs if they rebuilt or substantially repaired, but recipients who only repaired did not seem to understand the terms of this constraint.
Elevation grants were disbursed to recipients in stages upon proof of permit and then certification.
Many of the Mississippi recipients, however, did not live in the flood plain and were therefore not likely to be required to elevate. In Southeast Texas, an additional grant was available for properties located within certain flood zones. CDBG elevation grants involved attaching covenants to affected properties that were later sold. These requirements were unclear, and this ambiguity was further compounded by the inconsistent availability of FEMA, ABFE, and BFE recommendations across sites.
The owner survey results regarding the properties’ pre-storm elevation levels are depicted in exhibit 3-25, which shows that 60.8 percent of properties were not elevated at all and 28.2 percent of properties were elevated less than 3 feet across all states. The 2010 windshield observations found that 59 to 63 percent of properties were rated in excellent or good condition, and therefore presumed to have completed rebuilding activities, but were still elevated less than 3 feet from street level.31 This suggests that only minimal elevation had occurred, if any. Given that a substantial share of housing in New Orleans was already built with some elevation, much of the elevation observed among rebuilt properties probably existed before the hurricanes.
31 Turnham, et al. (2010), p. 48.
Exhibit 3-25. Pre-Hurricane Elevation Status
Status
LouisianaN = 133,003
MississippiN = 45,456
TexasN = 7,134
TotalN = 185,594
% CI % CI % CI % CI
Not elevated
61.7 54.9–68.4 58.8 49.0–68.6 58.8 43.5–74.1 60.8 55.4–66.3
Elevated at or less than 3 feet
27.3 21.7–33.0 28.7 20.1–37.3 40.2 24.9–55.5 28.2 23.5–32.8
Elevated more than 3 feet
11.0 7.3–14.7 12.5 6.2–18.9 1.0 0.3–1.8 11.0 8.0–14.0
CI = 90 percent confidence interval.
Note: Weighted population estimates based on 656 survey responses.
Source: 2011 Property Owner Survey

41Chapter 3: Repair Needs and Rebuilding
Indeed, few respondents in the 2011 property owner survey reported elevating their homes as part of their repair and rebuilding activities. As shown in exhibit 3-26, across the three states we estimate that less than 10 percent of owners of properties with major or severe storm damage on SABs had completed elevation work on their properties. This modest level of elevation activity is consistent with the windshield observation findings and has also been documented elsewhere.32
It is true that not all properties need to elevate. We attempted to determine the number of properties in the owner survey sample that would need to be elevated
32 For example, a recent report by the HUD Office of Inspector General for Inves-tigation’s Inspections and Evaluations Division, titled “Inspection of the State of Louisiana’s The Road Home Elevation Incentive Program: Homeowner Compli-ance” (March 2010), found that a high percentage of recipients of CDBG-funded elevation grants had not elevated their properties.
based on the ABFE or BFE formula, but could not do so, because information on the elevation requirements was not available for a large share of sampled properties. Nevertheless, owners who received CDBG grants seem more likely to have completed elevation activity, perhaps as a consequence of the terms of award. About two-thirds of the owners who completed elevation work in Louisiana and Mississippi were CDBG recipients, suggesting that CDBG recipients in those states were more likely to elevate than nonrecipients, although the difference in Mississippi is not statistically significant. In Texas, most owners who elevated did not receive CDBG, but this likely reflects the much lower rates of CDBG receipt in that state overall (see chapter 5, exhibit 5-1).
Exhibit 3-26. Elevation Activity
LouisianaN = 10,698
MississippiN = 2,769
TexasN = 1,073
TotalN = 14,540
% CI % CI % CI % CI
No elevation work started
89.6 86.7–92.6 92.9 88.2–97.6 84.1 73.9–94.3 90.2 87.8–92.7
Elevation work started but not completed
1.6 0.4–2.8 — — — — 1.1 0.3–2.0
Elevation work completed
8.3 5.7–10.9 7.1 2.4–11.8 15.7 5.5–25.9 8.3 6.1–10.5
Refused 0.1 0.0–0.3 — — — — 0.1 0.0–0.2
Don't know 0.4 0.0–1.2 — — 0.2 0.0–0.6 0.3 0.0–0.7
CI = 90 percent confidence interval.
Note: Weighted population estimates based on 512 survey responses.
Source: 2011 Property Owner Survey
Exhibit 3-27. Completed Elevation Activity by CDBG Receipt
LouisianaN = 133,003
MississippiN = 45,456
TexasN = 7,134
TotalN = 185,594
% CI % CI % CI % CI
CDBG recipients who completed elevation work
63.9 50.8–77.0 67.5 40.8–94.3 5.6 0.0–12.1 59.8 49.8–69.8
Non-CDBG recipients who completed elevation work
36.1 23.0–49.2 32.5 5.7–59.2 94.4 88.0–100 40.2 30.2–50.2
CDBG = Community Development Block Grant. CI = 90 percent confidence interval.
Note: Weighted population estimates based on 51 responses.
Sources: 2011 Property Owner Survey; CDBG administrative data

42Chapter 3: Repair Needs and Rebuilding
Extent and Cost of RebuildingIn most cases, the rebuilding activities undertaken by 2005 owners consisted of repairs to an existing structure rather than construction of a completely new home. As shown in exhibit 3-28, we estimate that in 9 of 10 cases in which rebuilding work was initiated or completed between 2005 and 2011, the work involved repairs to an existing structure rather than the construction of a new house.
The survey asked owners who had done at least some rebuilding work to estimate the total cost of that work to date, including any elevation work. About two-thirds of owners (66.4 percent) reported total costs of $50,000 or more, including 36.7 percent who reported costs of $100,000 or more (exhibit 3-29). The estimates include owners who started but did not complete the rebuilding work, as well as those who completed it. Limiting the sample to owners who completed the work does not change the distribution.
Exhibit 3-28. Type of Rebuilding
Number Percent CI
Building a new house/building 8,621 5.6 3.6–7.6
Repairing the existing structure 143,598 93.1 90.9–95.4
Don’t know 1,946 1.3 0.4–2.1
Total 154,166 100.0
CI = 90 percent confidence interval.
Note: Weighted population estimates based on 512 survey responses.
Source: 2011 Property Owner Survey
Exhibit 3-29. Estimated Cost of Repairs or Rebuilding to Address Hurricane Damage
Note: Weighted population estimates based on 465 survey responses.
Source: 2011 Property Owner Survey
30%
40%
20%
35%
15%
25%
10%
5%
0%Less than $5,200 At least $5,200
but less than $10,000
At least $10,000 but less than
$50,000
$100,000 or more
At least $50,000 but less than
$100,000
5.7%4.3%
23.6%
29.7%
36.7%

43Chapter 3: Repair Needs and Rebuilding
Exhibit 3-30 compares the distribution of estimated rebuilding costs by state for all owners who undertook some repair or rebuilding to address hurricane damage. In general, repair and rebuilding costs are highest in Louisiana and lowest in Texas; there is a significant difference at the 1 percent level in rebuilding cost between properties in Louisiana and Texas, between properties in Louisiana and Mississippi, and between properties in Texas and Mississippi. This is consistent with the higher assessed damage amounts in Louisiana reported in exhibit 3-3 and with the lower assessed damage amounts in Texas.
Additional analysis of rebuilding activity based on the level of neighborhood damage is also revealing. In particular, we look at blocks with concentrated damage—that is, where FEMA assessments reported more than 50 percent of properties on the block
as having major or severe damage.33 One possible hypothesis would be that owners of properties on these more heavily damaged blocks would have less incentive to rebuild, and would be less satisfied with their neighborhoods after the storm, than those owners with properties on less damaged blocks. However, as shown in exhibit 3-31, there is no significant difference in rebuilding rates between these two kinds of properties overall. The sole exception to this is the difference between properties on blocks with concentrated damage in Mississippi and properties not on these blocks, which is statistically significant at the 10 percent level. For these reasons, funding for rebuilding may have leveled out the difference.
33 Note that only properties with FEMA assessments were studied to determine the level of block damage, although this is believed to be a good mirror for total properties on the block. We estimate the share of all the SABs in the sample that have this definition of concentrated damage to be at 67.8 percent.
Exhibit 3-30. Estimated Cost of Repairs or Rebuilding to Address Hurricane Damage by State
Louisiana Mississippi Texas
Percent 90% CI Percent 90% CI Percent 90% CI
Less than $5,200 5.8 3.1–8.5 2.9 0.9–4.9 9.8 2.8–16.7
At least $5,200 but less than $10,000
2.1 0.9–3.3 8.6 2.6–14.5 6.2 0.0–12.7
At least $10,000 but less than $500,000
16.8 13.2–20.3 30.6 21.0–40.2 48.3 32.9–63.7
At least $50,000 but less than $100,000
29.3 24.7–33.9 25.0 18.1–31.8 9.9 2.2–17.6
$100,000 or more 38.6 33.1–44.2 25.2 15.6–34.9 5.5 0.0–11.5
Don’t know/refused 7.4 5.2–9.6 7.7 3.1–12.3 20.3 8.9–31.7
CI = 90 percent confidence interval.
Note: Weighted population estimates based on 512 property owners who conducted repairs addressing damage inflicted from the hurricanes.
Source: 2011 Property Owner Survey

44Chapter 3: Repair Needs and Rebuilding
Exhibit 3-31. Association Between Rate of Rebuilding and Blocks with Concentrated Damage
Properties on Block with Concentrated Damage
Properties on Block without Concentrated Damage
Rebuilding CI Rebuilding CI
Texas (N = 7,857) 50.0 0.0–100 70.7 58.3–83.1
Mississippi (N = 42,037)+ 70.4 59.9–80.9 87.4 77.2–97.7
Louisiana (N = 114,474) 74.2 69.5–79.0 77.8 67.6–88.1
Rebuilding rate 73.3 68.9–77.7 79.0 72.5–85.4
CI = 90 percent confidence interval. **p < 0.01; *p < 0.05; +p < 0.10.
Notes: Weighted population estimates based on 588 owners who currently own the property and report don’t know/refused. Only two properties in Texas were on blocks with concentrated damage.
Source: 2011 Property Owner Survey
As shown in exhibit 3-32, we found that owners of storm-damaged properties located on blocks with concentrated damage were less likely to be very satisfied with their properties in 2011 than owners of properties located on blocks where there was not concentrated storm damage. This difference is statistically significant at the 5 percent level. We found no significant
difference in pre-storm neighborhood satisfaction between owners on blocks with concentrated damage and owners on blocks without that extensive damage, suggesting that the difference in satisfaction observed in 2011 is likely to be related to the level of damage that occurred (and that might still remain) on the block.
Exhibit 3-32. Association Between Pre-Storm and Post-Storm Neighborhood Satisfaction and Blocks with Concentrated Damage
Property on Block with Concentrated Damage
Property on Block withoutConcentrated Damage
Percent 90% CI Percent 90% CI
Pre-Storm Neighborhood Satisfaction
Very satisfied 84.6 80.5–88.8 81.6 74.2–88.9
Somewhat satisfied 13.3 9.6–17.0 17.2 10.3–24.2
Neither satisfied nor dissatisfied 0.9 0.0–1.8 0.1 0.0–0.2
Somewhat dissatisfied 1.2 0.0–2.5 0.4 0.0–0.1
Very dissatisfied 0.0 — 1.1 0.0–2.8
Post-Storm Neighborhood Satisfaction*
Very satisfied 44.4 38.3–50.5 54.2 46.1–62.2
Somewhat satisfied 34.2 29.1–39.3 36.1 28.1–44.0
Neither satisfied nor dissatisfied 4.4 2.5–6.3 4.9 0.1–8.9
Somewhat dissatisfied 12.8 9.3–16.4 4.5 1.5–7.4
Very dissatisfied 4.2 1.7–6.7 0.4 0.0–1.0
CI = 90 percent confidence interval. **p < 0.01; *p < 0.05; +p < 0.10.
Notes: Weighted population estimates based on 370 survey responses who owned the property before the hurricane and currently resides on the property. To conduct a valid significance test, all response categories need at least one observation. Because no owners residing in concentrated damage blocks reported being very dissatisfied with their neighborhood before the hurricane, any owners residing in nonconcentrated damage blocks that reported being very dissatisfied with their neighborhood were excluded from the significance test.
Source: 2011 Property Owner Survey

45Chapter 3: Repair Needs and Rebuilding
3.5 REASONS FOR NOT REBUILDINGThe owner survey also collected information on the reasons for not rebuilding from owners who reported that they did no repair or rebuilding work on their hurricane-damaged properties. The survey presented a list of possible reasons for not rebuilding and asked respondents to characterize each one as a big reason, a small reason, or not a reason for their decision not to rebuild. Respondents could identify more than one reason as a big reason. Exhibit 3-31 presents the most common big reasons for not rebuilding identified by survey respondents.
An important finding—and one that is further explored in chapter 5 with regard to CDBG funding—is that the most common reasons for not rebuilding involved owners not having sufficient funds to pay for the work. This was expressed in terms of not having enough money on hand to do the work (cited as a big reason
by 67.0 percent of owners), not being able to get a loan to do the work (51.1 percent), or waiting for a grant or other kind of financial assistance to get the work done (35.7 percent). Furthermore, the data suggest that the inability to obtain flood insurance—either not being able to qualify or not being able to afford it—was a big reason for 36.5 percent of the owners who did no rebuilding.
Other big reasons for not rebuilding were a lack of contractors or volunteer labor to do the work (33.3 percent) and the homeowners’ interest in selling the property (33.8 percent). (Note that the estimates presented in exhibit 3-33 include owners who no longer owned as of early 2011.) For about one in four owners, the general lack of rebuilding in the neighborhood—either few households returning to the neighborhood or incomplete infrastructure (schools, roads, and sewers)—was a big reason for not rebuilding.
Exhibit 3-33. Big Reasons for Not Rebuilding Among Owners Who Undertook No Repair and Rebuilding
Note: Weighted population estimates based on 205 survey responses.
Source: 2011 Property Owner Survey
Waiting for a grant or other financial assistance
Cannot obtain/afford flood insurance
Cannot get a loan to pay for the work
Don’t have enough money to do the work
Waiting for contractors or volunteer labor
Considering selling the property
Waiting for more people in neighborhood to rebuild
Waiting for infrastructure/schools to be completed
Waiting for new elevation requirements
Waiting for the economy to improve
Do not want to move back/settled where I am
Waiting for permits to do the work
36.5%
51.1%
67.0%
35.7%
33.8%
33.3%
25.1%
23.4%
18.8%
17.1%
13.5%
11.5%
0% 20% 40% 60% 80%

46Chapter 3: Repair Needs and Rebuilding
For the 33 percent of homeowners who did not cite having money on hand as a big reason, the big reasons cited were also primarily not related to funding access; their most common big reason was that they were considering selling the property (reported by 46.5 percent of this group). Waiting for other infrastructure, not wishing to resettle in the home (presumably reported by households who had moved but still owned the house), and waiting for contractors or volunteer labor were other big reasons for this group’s decision not to rebuild.
3.6 SUMMARY OF CHAPTER FINDINGSThis chapter presents findings from the property owner survey on the pre-hurricane and current condition of properties that sustained major storm damage and were located on blocks where at least two other housing units suffered major storm damage as well.
Pre-Storm and Post-Storm Housing ConditionThe survey results suggest that most owners of storm-damaged properties on significantly affected blocks thought them to be in good condition before the 2005 hurricanes. More than 90 percent of owners in Louisiana and Mississippi and 85 percent of owners in Texas rated their homes as being in excellent or good condition before the hurricanes, and no more than 2 percent of owners in any state rated them as being in poor condition. By contrast, at the time of the property owner survey in 2011, the proportion of owners rating the condition of their properties as excellent or good ranged from 75 percent in Louisiana to 71 percent in Texas. Although these ratings were available only for the subset of survey respondents who still owned the property in 2011, we can infer from the 2010 windshield observations that properties that changed ownership after the hurricanes were less likely to be in good condition as of 2011 than those that remained with the same owner. The 2011 reports of conditions, also, corroborated the 2010 windshield findings closely.
Hurricane DamageThe fact that owners rated their housing to be in worse condition in early 2011 than before the hurricanes reflects a combination of the damage wrought by the storms and the incomplete rebuilding efforts to date. All of the properties selected for the owner survey were assessed by FEMA as having major or severe hurricane damage, and owners confirmed that, reporting median assessed damage amounts of $89,523 in Louisiana and $74,227 in Mississippi. The median assessed damage amount in Texas was lower ($35,124), reflecting lower rates of damage from flooding in that state. But Texas owners nevertheless reported that about one-third of their properties were demolished, leveled, or had had their structure condemned after the hurricanes.
Decision to Stay or SellAfter the hurricanes, owners faced a decision whether to sell their properties or to stay and rebuild. The owner survey results suggest that 82 percent of owners of severely damaged properties on significantly affected blocks retained ownership of their homes, while 18 percent got rid of the property, primarily by selling to a private owner. Most people who sold or otherwise transferred ownership did so within 2 years of the hurricanes, by 2007. We found few statistically significant differences between the pre-storm characteristics of properties that changed owners versus those retained by the 2005 owners, except that rental properties were more likely to be kept than homeowner properties. This somewhat counter-intuitive finding might reflect the fact that owners of rental properties are more able to hold on to those properties without rebuilding, whereas homeowners who need to rebuild also need to find a new place to live. The extent of damage does appear to be a predictor of whether a storm-damaged property changed owners: properties where the structure had been condemned or had to be leveled or demolished due to hurricane damage were significantly more likely to be sold than properties with less extensive damage.

47Chapter 3: Repair Needs and Rebuilding
Housing Conditions and Neighborhood Satisfaction for Movers and StayersAs of 2011, about one-fourth of the owner survey sample reported that they were no longer living in the house that was damaged in the storm. This includes owners who sold their properties, as well as people who retained ownership of the damaged property but are living elsewhere. About two-thirds of surveyed homeowners still lived in a house that they owned, but 18 percent were renting, and the rest were either living with family or friends (18 percent) or in some other type of housing situation (3 percent). Owners who were no longer living in the same neighborhood as they were in 2005 were significantly more likely to report being very satisfied with their new neighborhood, compared with owners who stayed in the same neighborhood as in 2005. Owners in new neighborhoods were also significantly more likely to describe those neighborhoods as very safe during the day and at night. Not surprisingly, in light of these responses, two-thirds of owners in new neighborhoods had no plans to move back. Among all movers, the three most common reasons for not having moved back were a preference for the current neighborhood, a belief that the old neighborhood was not safe, and a belief that the old neighborhood was not ready for people to move back.
Rebuilding Activity and CompletionAmong all owners, including those who had sold their properties, slightly more than three-fourths (77 percent) reported that they had done some rebuilding work to address hurricane damage. In most cases, the rebuilding consisted of repairs to an existing structure rather than construction of a completely new home. As might be expected, continuing owners were much more likely to have done some rebuilding work (86 percent) than owners who had sold or otherwise relinquished ownership of the property (34 percent). Among continuing owners who have not done any rebuilding as of 2011, about two-thirds (63 percent) reported that they do not intend to rebuild or do not know if they plan to rebuild. This is consistent with the finding that most owners who did any rebuilding began the work
in 2005 and 2006 and, if they completed rebuilding, finished it by 2008. Not many 2005 owners are still actively rebuilding their properties, although properties that have been sold may be being worked on by their new owners.
Few survey respondents reported doing elevation work as part of their rebuilding. Across the three states, we estimate that less than 10 percent of owners of properties with major or severe storm damage on SABs had completed elevation work on their properties. This modest level of elevation activity is consistent with the windshield observation findings.
Owners of properties whose neighbors also experienced extensive damage (that is, properties on blocks where more than one-half the properties experienced major or severe damage per FEMA assessments) did not report significantly different rebuilding rates than owners of properties on less severely damaged blocks. This finding contrasts with the hypothesis that property owners in severely affected neighborhoods would be less likely to rebuild, and it suggests that rebuilding decisions were based more on individual owner circumstances. The owners of properties on severely damaged blocks reported being significantly less satisfied with their neighborhoods currently, however.
Among owners who did not rebuild, the most commonly cited reason was not having sufficient funds to pay for the work. This was expressed in terms of not having enough money on hand to do the work, not being able to get a loan to do the work, or waiting for a grant or other kind of financial assistance to get the work done. The inability to obtain flood insurance was another important reason reported by more than one-third of owners who did not rebuild. For owners who did not rebuild but did not cite lack of funding as a reason, nearly one-half reported delaying rebuilding because they were considering selling. Similarly, for owners who ended up selling their property, the decision to sell was also an important reason for not rebuilding, just as the inability or unwillingness to engage in rebuilding was likely part of the reason

48Chapter 3: Repair Needs and Rebuilding
for selling. The property and owner characteristics associated with rebuilding among continuing owners, most but not all of whom rebuilt, are described and analyzed in chapter 4. Chapter 5 then explores the relationship between the availability of financial assistance, especially CDBG grants, and rates of rebuilding.

Chapter 4: Owner and Property Factors Affecting Rates of Rebuilding 49
4. OWNER AND PROPERTY FACTORS AFFECTING RATES OF REBUILDING
While the preceding chapter provides descriptions of physical conditions, repair, and rebuilding, this chapter considers the relationships among
property and owner characteristics and rebuilding. The chapter makes use of the new information obtained through the owner survey—on pre-storm housing characteristics, owner characteristics, and level and type of damage as reported by owners—to supplement the analysis conducted in the Phase I report on the property and neighborhood characteristics associated with rebuilding.
The Phase I report used a measure of rebuilding constructed from the 2010 windshield observation to analyze factors related to rebuilding. The factors analyzed included pre-storm neighborhood characteristics (based on 2000 Census data), severity of hurricane damage (based on the FEMA assessment), and receipt of CDBG disaster assistance (based on CDBG administrative data). From that analysis, the severity of damage was determined to be a strong negative predictor of rebuilding. The median home value in 2000 in the neighborhood where a property was located was a significant, positive predictor of rebuilding. We also found that properties were more likely to be rebuilt if they were located in neighborhoods with higher percentages of Black or African American and Hispanic households before the hurricanes.
This chapter uses an alternative measure of rebuilding based on the owner assessment of the condition of the property as of 2011 and focusing on continuing owners (that is, people who still own the storm-damaged property) only. Section 4.1 discusses this alternative measure of rebuilding. The chapter explores the owner
and property characteristics that could be associated with rebuilding using cross-tabulations (sections 4.2–4.3) and multivariate analysis (section 4.4). Most of the characteristics that we examined were found not to have a statistically significant association with rebuilding. The multivariate analysis identifies which characteristics are most relevant for understanding the factors that affect rates of rebuilding.34
4.1 DEFINITION OF REBUILDINGSeveral options were potentially available as a measure of rebuilding for this analysis, including one from the windshield observations conducted in early 2010 and two from the property owner survey. We used a measure of rebuilding from the owner survey that was based on the owner ratings of the condition of their properties as of early 2011. Properties were considered to be rebuilt as of 2011 if the owner of the property rated its current condition as excellent or good. Since all properties in the survey sample were assumed to have hurricane damage,35 a property that is in excellent or good condition as of 2011 can be assumed to have been substantially repaired or rebuilt.
The measure of rebuilding used in this chapter is similar to the measure of rebuilding used in the Phase I report based on windshield observation in 2010: properties assessed by FEMA as having major or severe damage in 2005 that were rated by observers as being
34 The relationship between rebuilding and the presence of CDBG and other fund-ing sources is discussed in chapter 5.
35 As discussed in appendix C, in Texas the owner survey sample included 20 prop-erties that were not designated by FEMA as having major or severe damage but that nonetheless received CDBG assistance. These properties were included in the survey sample to increase the number of CDBG recipients in the sample, and because representatives of the CDBG program in Texas told us that the FEMA designations were not accurate in Texas, and that properties that received CDBG assistance would have had major or severe damage confirmed via state assessment.

50Chapter 4: Owner and Property Factors Affecting Rates of Rebuilding
in excellent or good condition in 2011 (with no major repair needs) were assumed to have been substantially rebuilt. There are two key differences between the owner-based measure of rebuilding reported in this chapter and the windshield-based measure used in the Phase I report:
•The owner-based measure provides more recent information (early 2011 versus early 2010).
•The measure is based on the owner’s more detailed knowledge of the condition and repair needs of the property, particularly interior conditions that are not observable from the sidewalk vantage point of the windshield observers.
Another difference between the owner-based measure and the windshield-based measure is that the owner-based measure of rebuilding is available only for those properties that had the same owner in 2011 as in 2005, 82 percent of the survey sample. This is because the survey did not ask former owners (those who sold their homes, often several years before the survey) to assess the 2011 condition of the property they no longer owned. By comparison, the windshield observations cover 88 percent of the owner survey sample.36
An alternative to the measure of rebuilding based on owners’ rating of the condition of the property in
36 We do not have windshield observations for 100 percent of the properties in the owner survey sample, because the owner survey sample includes properties from Texas added after the windshield observations were complete in order to increase the sample size of CDBG recipients in Texas. See discussion in chapter 2, section 2.2.
2011 would be a measure based on what the owner reported about the rebuilding work he or she has done since 2005. As discussed in chapter 3, owners provided information on whether they did any repair or rebuilding work to address hurricane damage and whether the work was substantially complete by the time of the survey. Thus, an alternative indicator of a rebuilt property could be that the owner reported having completed repairs.
Exhibit 4-1 compares the two owner-based measures.37 Overall, 74.6 percent of continuing owners’ homes are considered rebuilt per the owners’ assessment of the property condition (rated as either excellent or good). In comparison, only 64.0 percent of owners report that the repair or rebuilding work is substantially completed. Although a property is in good or excellent condition, an owner might still desire or plan further work and not consider the work to be complete. The share of properties considered rebuilt that also have owners reporting rebuilding work as complete, is closest in Texas, where 70.6 percent of properties are defined as rebuilt and 70.1 percent of owners report that the work is complete. The difference is largest in Mississippi, where 74.6 percent of properties are considered rebuilt, but owners report that work is complete for only 62.7 percent.
37 Section 3.4 describes slightly different rebuilding rates based on a different number of survey responses based on the exclusion of residents who sold or ceased to own. This was necessary to be able to a comparison with owner-report-ed conditions (only asked of continuing owners).
Exhibit 4-1. Alternative Owner-Reported Measures of Rebuilding (Continuing Owners Only)
Louisiana Mississippi Texas Overall
Percent rebuilt based on owner report of excellent 74.8 74.6 70.6 74.6or good condition
Percent rebuilt based on owner report of having completed repair or
64.1 62.7 70.1 64.0
rebuilding work
Note: Weighted population estimates based on 575 survey responses.
Source: 2011 Property Owner Survey

51Chapter 4: Owner and Property Factors Affecting Rates of Rebuilding
Although work may not be complete from the owner’s perspective, for the remainder of this report we define a property as being substantially rebuilt if the owner assessed its condition as either good or excellent at the time of the owner survey in 2011.
4.2 PROPERTY-LEVEL CHARACTERISTICSThis section reviews property-level characteristics as reported by the owners, in relation to repair and rebuilding status. We include financial, tenure, and other indicators, as well as the type of damage incurred from the hurricanes.
Location and Property Tenure as Factors in RebuildingDespite differences in the nature and impact of the hurricanes in Louisiana, Mississippi, and Texas and differences in homeowner assistance programs, rates of rebuilding are similar for the three states. As shown in exhibit 4-2, the point estimate of rebuilding in Louisiana is the highest, at 74.8 percent, and the estimate in Texas is the lowest, at 70.6 percent, but these differences are not significant.
The rates of rebuilding by state presented in exhibit 4-2 are different from those presented in the Phase I report that is based on windshield observations. Based
on windshield observations, the estimated percent of properties with major or severe damage that were rebuilt as of 2010 was 69.4 percent for Louisiana, 69.4 percent for Mississippi, and 80.7 percent for Texas. In addition to differences in the two samples—windshield and owner survey—rebuilding rates based on the owner survey measure are generally higher because the survey measure includes only properties whose ownership has not changed since 2005 (although it is also the case that the data were collected approximately 1 year later). As discussed in chapter 3, we can infer from the windshield observations that rebuilding rates are lower for properties that changed ownership, so excluding them from the sample produces a higher estimate of rebuilding. The lower rebuilding rate based on survey responses for Texas is surprising, but, given the very small survey sample size in Texas, the point estimate of 70.6 percent in exhibit 4-2 is very imprecise.
Rebuilding rates also varied by the tenure of the property at the time of the 2005 hurricanes, but the differences are not sufficiently large to be statistically significant. The point estimate for rebuilding is 75.7 percent among properties that were owner occupied as of 2005, 70.5 percent for properties that were renter occupied, and 58.3 for properties that were vacation homes or some other type of housing.
Exhibit 4-2. Rebuilding Status by State and Tenure
Percent Rebuilt CI
Location (N = 164,367 based on 588 survey responses)
Louisiana 74.8 70.5–79.2
Mississippi 74.6 66.4–82.8
Texas 70.6 58.2–83.0
Overall 74.6 70.9–78.3
2005 Tenure (N = 158,729 based on 569 survey responses)
Owner occupied 75.7 71.8–79.6
Renter occupied 70.5 61.7–79.3
Vacation/other 58.3 40.7–76.0CI = 90 percent confidence interval.
Source: 2011 Property Owner Survey

52Chapter 4: Owner and Property Factors Affecting Rates of Rebuilding
Mortgage and Insurance Presence, Insurance Coverage, and Home Value as Factors in RebuildingWe examined four financial characteristics of the survey properties for their relationship with rebuilding, with results shown in exhibit 4-3. These factors are potentially relevant because they affect the household’s ability to rebuild. We did not find a statistically significant difference in the distributions of rebuilding between homes that had mortgages at the time of the hurricane (74.8 percent) and homes that did not have mortgages (72.9 percent). We did find a large and statistically significant difference at the 1 percent level in the distribution of rates of rebuilding for properties with and without insurance coverage (either homeowners or flood) at the time of the hurricanes. Of properties reported in the owners’ survey as having insurance coverage, 79.4 percent were rebuilt on the
owner-reported measure, compared with 47.9 percent of properties without.
As part of the survey, owners were asked to estimate how much their house and lot would have sold for immediately before the 2005 hurricanes. Comparing the rebuilding status of properties with different estimated values, we find a statistically significant difference in the distributions of rate of rebuilding among properties from the distribution among properties not rebuilding. As shown in exhibit 4-3, properties at all pre-storm values were more likely to be rebuilt than not. This difference in distributions is statistically significant at the 10 percent level, and corroborates the windshield observation findings reported in the Phase I report, that homes in census blocks with higher median value before the hurricanes were more likely to have rebuilding activity.
Exhibit 4-3. Association Between Property Characteristics and Rebuilding Status: Mortgage and Insurance Presence, Insurance Coverage, and Home Value
Percent Rebuilt CI
Mortgage Presence (N = 157,553 based on 563 survey responses)
Mortgage 74.8 69.1–80.4
No mortgage 72.9 68.0–77.9
Insurance Presence** (N = 160,797 based on 575 survey responses)
Insurance (homeowners’ or flood insurance)
79.4 75.4–83.3
No insurance 47.9 37.7–58.1
Pre-Storm Value+ (N = 158,729 based on 569 survey responses)
Value less than $80,000 61.3 52.8–69.9
Value $80,000–$175,000 76.3 71.0–81.7
Value $175,000–$300,000 80.7 72.7–88.8
Value $300,000 76.5 62.9–90.1
CI = 90 percent confidence interval. **p < 0.01; *p < 0.05; +p < 0.10.
Note: Significance tests were performed for distributions of rebuilding rates across builders and nonrebuilders, but nonrebuilders are not portrayed in the exhibit for simplicity.
Source: 2011 Property Owner Survey

53Chapter 4: Owner and Property Factors Affecting Rates of Rebuilding
Type and Extent of Damage and Cost of Repairs as Factors in RebuildingCharacteristics related to storm damage could influence the desire to rebuild; the extent of damage may determine the household’s ability to do so. As shown in exhibit 4-4, homes that experienced flood damage reported less rebuilding than those that did not: 68.4 percent of homes with flood damage were rebuilt compared with 82.8 percent of homes experiencing damage from other sources (mostly wind). On the whole, flood-related damage is more costly to repair because it is usually more extensive and severe. Specifically, flooding affects more area, rooms, and systems in a home, while typical wind damage affects the roof and building envelope only. As a result, the damage caused by wind and wind driven rain is typically less than for flooding, and this damage severity may explain the lower rebuilding rate.
Properties that were leveled, demolished, or condemned also were associated with significantly lower levels of rebuilding. Only 46.5 percent of these homes were rebuilt, compared with 81.2 percent of properties that were not leveled or condemned and did not have to be demolished. Perhaps this is explained by the fact that the costs of total reconstruction can be significantly higher than the cost of repairing a damaged but still structurally habitable property. It is also possible that the commitment to rebuild is less likely when nothing of the old home is salvageable.
We also examined the relationship between the assessed damage amount as a percentage of the pre-storm value and the rate of rebuilding, and between the owner-reported cost of repairs and the rate of rebuilding, but we found no statistically significant differences between rebuilt and nonrebuilt properties.
Exhibit 4-4. Association Between Property Characteristics and Rebuilding Status: Type, Extent, and Value Relative to Property Value of Damage and Cost of Repairs
Percent Rebuilt CI
Type of Damage* (N = 158,220 based on 567 survey responses)
Flooding 72.6 68.3–76.9
No flooding 82.8 77.1–88.5
Extent of Damage** (N = 158,729 based on 569 survey responses)
Leveled/demolished/condemned 46.5 37.4–55.6
Not leveled/demolished/ condemned
81.2 77.6–84.7
CI = 90 percent confidence interval. **p < 0.01; *p < 0.05; +p < 0.10.
Notes: Table includes only those properties for which damage assessments were performed. Based on highest value assessment if multiple assessors.
Source: 2011 Property Owner Survey
4.3 OWNER CHARACTERISTICSThis section reviews owner characteristics (self-reported) in relation to rebuilding status. The owner characteristics examined in this report are household demographic indicators that may have played a factor in rebuilding decisions. This analysis complements analysis presented in the Phase I report, which analyzed the relationship between the demographic characteristics of neighborhood residents before
the storms—using 2000 Census data at the census block level—and rates of rebuilding in 2010 based on external observation. The analysis in this report is of individual owner characteristics associated with rebuilding, as reported by the owners in 2011.
Five characteristics were analyzed as possible factors in rebuilding: age, presence of dependents under the age of 18, the disability status of the owner, the pretax household income in 2004, and the race of the owner. The results are shown in exhibit 4-5.

54Chapter 4: Owner and Property Factors Affecting Rates of Rebuilding
Exhibit 4-5. Association Between Owner Characteristics and Rebuilding Status
Percent Rebuilt CI
Age (N = 159,640 based on 572 survey responses)
18–44 75.3 66.4–84.2
45–64 73.1 66.6–79.5
65+ 76.1 70.5–81.7
Dependents Under the Age of 18 (N = 159,640 based on 572 survey responses)
Household includes dependents < age 18 76.3 70.3–82.3
Household does not include dependents < age 18 73.9 69.3–78.6
Disability Status of Owner/Co-Owner (N = 159,640 based on 572 survey responses)
Has a disability that limits/prevents work 67.9 60.4–75.3
Does not have a disability that limits/prevents work 76.9 72.8–81.0
Pretax Household Income in 2004 (N = 159,640 based on 572 survey responses)
Less than $30,000 71.9 65.2–78.6
At least $30,000 but less than $60,000 73.0 65.2–80.7
At least $60,000 but less than $90,000 73.3 65.1–81.4
$90,000 or more 85.3 78.1–92.5
Race* (N = 159,640 based on 572 survey responses)
Black or African American alone 68.4 62.8–74.0
White alone 82.5 77.3–87.7
Other race or multiple race 62.4 51.3–73.5
CI = 90 percent confidence interval. **p < 0.01; *p < 0.05; +p < 0.10.
Source: 2011 Property Owner Survey
None of the individual owner characteristics, with the exception of race, were found to be significantly correlated with rebuilding. We found that owners reporting their race as Black or African American, with no other race, were significantly less likely to rebuild than owners reporting their race as White, with no other race, or owners reporting multiple races. However, in the multivariate analysis discussed in the next section, these differences were found not to be statistically significant when other factors were controlled.

55Chapter 4: Owner and Property Factors Affecting Rates of Rebuilding
4.4 MULTIVARIATE ANALYSISTo this point, this chapter has described the relationships between individual property-level and owner characteristics and rebuilding, one at a time. However, it is not always easy to interpret such relationships without digging deeper. For example, we observed previously that homes with mortgages at the time of the storm were rebuilt at a slightly higher rate (74.8 percent) than those without (72.9 percent), although this result is not statistically significant.
On its own, the interpretation of this finding is not obvious: should we say that having a mortgage promotes rebuilding? (A possible policy implication would be that homeowners should be encouraged not to pay off their mortgages in hurricane-prone areas, to promote subsequent rebuilding.) The interpretation of the mortgage variable becomes clearer when we take into account its relationship with other study variables. For example, insurance presence is also positively correlated with rebuilding; owners who have insurance are substantially more likely to rebuild (and the difference is statistically significant). Multivariate analysis indicates that these two variables are not independent: Exhibit 4-6 shows the relationship between mortgage presence and insurance coverage using weighted survey data.
The table shows that insurance coverage is positively and strongly correlated with mortgage presence—nearly all properties with a mortgage carry insurance. This leads to a rather different interpretation of the effect of mortgage presence on the decision to rebuild: perhaps owners with mortgages are more likely to rebuild because they are insured. (In fact, as we indicate in
a following section, owners who have a mortgage are less likely to rebuild than owners without a mortgage, when both are fully insured). The policy implication would shift from promoting mortgages to promoting insurance coverage.
The purpose of the multivariate regression analysis in this section is to provide a more nuanced interpretation of the relationship between owner characteristics and rebuilding activities, by controlling for correlations between the characteristics of interest. This analysis covers only continuing owners (excluding owners who sold their properties between 2005 and 2011). The analysis addresses the relationship between rebuilding and four categories of owner and property characteristics:
1. Tenure (renter versus owner occupied).
2. Financial and mortgage characteristics.
3. The type and extent of storm damage.
4. Demographic characteristics.
5. Average characteristics of the census block-group in which the property is located.
Four of these categories—tenure, financial and mortgage characteristics, demographic characteristics, and census block-group characteristics—include only pre-hurricane characteristics. Thus, these variables can be thought of as exogenous; there is no reason to worry that they might have been affected by the decision to rebuild. Therefore, the results of the analysis can be interpreted as providing evidence regarding how the decision to rebuild was influenced by these pre-existing characteristics.
Exhibit 4-6. Association Between Mortgage Presence and Property Insurance
Insurance No Insurance Total
Mortgage Presence
Mortgage 98% 2% 100%
No mortgage 69% 31% 100%
Source: 2011 Property Owner Survey

56Chapter 4: Owner and Property Factors Affecting Rates of Rebuilding
Because rebuilding status is a binary outcome (that is, it takes the value of 0 for not rebuilt or 1 for rebuilt), we estimate how the probability of rebuilding is affected by each of the characteristics of interest. Specifically, we estimate the relationships using a logistic regression model (logit), which constrains the predicted probability of rebuilding to be between 0 and 1. This approach also enables us to compute the marginal effect of any one variable at meaningful values of the other variables in the model. So, for example, we can estimate the relationship between insurance and rebuilding for property owners who do not have mortgages, while holding all other variables constant at their average values. The logit model takes the following form:
P( y = 1|X) = G(β0 + XTβT + XF βF + XHβH + XDβD + ε)
Where
P( y = 1|X) is the conditional probability of rebuilding;
G(z) is the logistic function: exp(z)/[1+exp(z)]
XT is the tenure variable;
XF is a vector of financial and mortgage characteristics;
XH is a vector of hurricane damage characteristics;
XD is a vector of demographic characteristics;
βT ,F ,H ,D are the coefficients of interest; and
ε is an error term.
The magnitudes of the coefficients (β) are not especially useful by themselves. For that reason, we report average partial effects for each of the variables of interest in exhibit 4-7. For variables found to be statistically significant, we explain in the text how these variables can be interpreted. In addition, the analysis controls for geographic region and incorporates sample weights.38
Exhibit 4-7. Regression Analysis Results
Variables Rebuilt
Owner and Property Characteristics:
Owner occupancy – 0.02 (0.055)
Presence of mortgage – 0.13* (0.057)
Presence of insurance 0.37*** (0.098)
Pre-storm home value ($100,000s)
– 0.02** (0.011)
Flood damage – 0.16*** (0.047)
Property was destroyed – 0.39*** (0.071)
Age of owner – 0.00 (0.002)
Presence in household of dependents
– 0.03 (0.064)
Disability status of owner – 0.02 (0.062)
Owner race—White 0.12 (0.090)
Owner race—Black or African American
– 0.04 (0.105)
Block Group Characteristics (2000 Census):
Percent Black or African American
0.07 (0.178)
Percent Hispanic – 0.10 (0.880)
Percent occupied 0.46 (0.382)
Percent owner occupied 0.37* (0.207)
Average household size – 0.03 (0.111)
Median home value 0.00 (0.000)
Median household income ($100,000s)
0.00 (0.000)
Percent with high school education
0.65* (0.386)
Percent unemployed – 0.28 (0.347)
Percent receiving public assistance
0.51 (0.959)
Observations 461*p < 0.01; **p < 0.05; ***p < 0.1.
Note: Robust standard errors in parentheses.
38 The regression above does not contain two variables of interest—pre-hurricane owner income and the estimated damage relative to pre-storm value—because these variables have missing values for many observations. For the former, while 468 observations are included in the original regression analysis, adding pre-hurricane income reduces the number of available observations to 374. To compensate for this, a sensitivity analysis including pre-hurricane income in the regression was performed using the larger sample for better statistical preci-sion. This check shows that this characteristic is not of statistical or practical significance when controlling for other variables, and it does not change the interpretation of the relationship between any other characteristic and rebuilding. Including damage relative to pre-storm value reduces the number of available ob-servations to 174. This substantially reduces statistical power and may introduce bias, if the properties with missing data on this characteristic are systematically different than those for which data is present.

57Chapter 4: Owner and Property Factors Affecting Rates of Rebuilding
TenureAfter controlling for other owner and property characteristics, we find no significant relationship between tenure status and rebuilding rates. Specifically, for the average property owner, we estimate that owner-occupancy is associated with less than a 2 percent decrease in the probability of rebuilding, and this relationship is not statistically significant.
Financial and Mortgage CharacteristicsInsurance is estimated to have a large and highly significant relationship with rebuilding. On average, insured properties are nearly 37 percent more likely to have been rebuilt than uninsured properties. At the same time, the relationship between mortgage presence and rebuilding is estimated to be negative and significant, with mortgaged properties 13 percent less likely to be rebuilt, on average, holding insurance constant at its average value. To see how these factors interact, we estimate that among fully insured properties, those with a mortgage were more than 11 percent less likely to have been rebuilt, on average.
Pre-storm home value was not found to be associated with rebuilding, but pre-storm home value was found to have a negative relationship with rebuilding when holding median home value in the neighborhood constant. This can be interpreted to mean that, as the pre-storm value of a property increases relative to neighboring properties, it is less likely to be rebuilt. Although this association is statistically significant, it is not large: we estimate that a $10,000 increase in pre-storm value is associated with a 0.2 percent decrease in rebuilding rates, holding the median home value in the census block-group constant. This finding suggests that, within a particular neighborhood, the owners of higher valued homes may have less incentive to rebuild.
Damage CharacteristicsWe found that two damage characteristics are significantly associated with rebuilding: whether the property sustained flood damage, and whether it was completely destroyed. Flood-damaged properties are, on average, 16 percent less likely to have been rebuilt
than properties that did not sustain flood damage. Properties categorized as being leveled, demolished, or condemned are 39 percent less likely to have been rebuilt, holding all other characteristics constant.
DemographicsWhen controlling for other characteristics, we did not find any statistically significant or substantively important relationships between owner demographic characteristics (including age, disability status, race, and presence of dependents in the household) and the probability of rebuilding.
Block-Group CharacteristicsTwo characteristics of the census block group in which the property is located were found to be significantly associated with rebuilding. Areas with more education—in particular a higher proportion of adults with at least a high school education—experience more rebuilding. Specifically, a 10 percent increase in the proportion of residents with a high school education is associated with a 7 percent increase in the probability of rebuilding. Likewise, properties are more likely to have been rebuilt in census block groups that have a higher proportion of owner-occupied houses. A 10 percent increase in the owner-occupancy rate is associated with a 4 percent increase in the likelihood of rebuilding. No other neighborhood characteristics were found to be significantly correlated with rebuilding.

58Chapter 4: Owner and Property Factors Affecting Rates of Rebuilding
4.5 SUMMARY OF CHAPTER FINDINGSThis chapter analyzed the owner and property factors affecting rates of rebuilding in Louisiana, Mississippi, and Texas. Rebuilding estimates are taken from the owner survey and are based on owner-reported information on the condition of their properties as of early 2011. The 575 survey responses (which include only continuing owners, who are presumably well informed about the 2011 condition of hurricane-damaged properties) are weighted to represent the 160,797 continuing owners of homes that individually experienced major hurricane damage and also were located on census blocks that were significantly affected by the storms of 2005.
Overall, we found that three-fourths of continuing owners rate the current condition of their properties as excellent or good. Given that all of the properties incurred major damage in the hurricanes, we assume that properties in excellent or good condition as of 2011 have been substantially rebuilt. However, only 64 percent of continuing owners report that the repair or rebuilding work to address hurricane damage is substantially complete. This suggests that some owners have brought their properties to a habitable standard but nonetheless think more work needs to be done. Comparing rates of rebuilding across states, using the measure of rebuilding based on the owner-reported condition of the property in 2011, we do not find significant differences across the three states in the study.
We used cross-tabulation and multivariate analysis to explore the relationships between pre-storm property characteristics (tenure, presence of a mortgage, presence of insurance, and owner-reported property value) and rebuilding, type and extent of hurricane damage and rebuilding, and owner and neighborhood demographic characteristics and rebuilding.
The multivariate analysis did not find any statistically significant correlation between individual owner characteristics and rebuilding. However, it did identify four property characteristics and two neighborhood characteristics that were significantly associated with rebuilding: presence of insurance before the hurricanes (positively associated with rebuilding), presence of a mortgage before the hurricanes (negatively associated with rebuilding), flood damage from the hurricanes (negatively associated with rebuilding), extent of damage caused by the hurricanes (negatively associated with rebuilding), education level (positively associated with rebuilding), and the proportion of houses in the neighborhood that are owner occupied (positively associated with rebuilding). In addition, the value of a house relative to the median home value in the neighborhood was found to be negatively associated with rebuilding.
The presence of insurance and the extent of hurricane damage were the strongest predictors of rebuilding.
The estimated sizes of all of the statistically significant effects are as follows:
•Properties with insurance before the hurricanes were 37 percent more likely to have been rebuilt than uninsured properties.
•Properties with mortgages at the time of the hurricanes were 13 percent less likely to be rebuilt, on average, holding insurance constant.
•Properties that experienced flood damage were 16 percent less likely to be rebuilt as of 2011 than properties that did not experience flood damage.
•Properties with hurricane damage so extensive that the structure was leveled or demolished or had to be condemned were 39 percent less likely to have been rebuilt than properties with less extensive damage.

59Chapter 4: Owner and Property Factors Affecting Rates of Rebuilding
•A 10 percent increase in the proportion of neighborhood residents with a high school education at the time of the hurricanes is associated with a 7 percent increase in the probability of rebuilding.
•A 10 percent increase in the owner-occupancy rate when the hurricanes struck is associated with a 4 percent increase in the likelihood of rebuilding.
The findings in this chapter reinforce some of the findings from the Phase I report. In particular, this analysis reinforces the finding that the severity of damage is a strong negative predictor of rebuilding. The Phase I report used the FEMA assessment as the main measure of damage. The owner survey provided an additional measure—whether the home was leveled, demolished, or condemned. This chapter shows that the presence of insurance before the hurricanes was an equally important factor in rebuilding, a factor that was not available for the analysis in the Phase I report.
Further, the findings from the multivariate analysis improve upon those reported in the Phase I report by adding individual owner and property characteristics as explanatory variables of rebuilding activity.39 Taking into account individual factors, such as the presence of insurance, reduces the significance of neighborhood factors such as the median house value as a predictor of rebuilding. The analysis presented in this chapter suggests that average neighborhood characteristics are not as important to owners’ rebuilding decisions as their individual personal and property situation—whether they have insurance, whether their mortgage is paid off, and whether their house was destroyed, for example. Many of these individual and property characteristics are correlated with neighborhood characteristics, which is why neighborhood characteristics were significant in the model presented in the Phase I report. Although the owner survey did not collect information on the educational attainment of individual owners, it is likely that, if we were able
39 For multivariate analysis of the association of neighborhood characteristics and rebuilding see Turnham, et al. (2010), pp. 60–62.
to include an individual measure of owner education level in the regression model, we would find that individual owner education was significantly associated with rebuilding, while average education in the neighborhood was not; however, with the information available, average education in the neighborhood is the best proxy for individual education level.
As individual owner and property characteristics at the time of the storms are explanatory variables for the rebuilding of these affected properties, the study explores individual sources and uses of funding for rebuilding after the storm as well. This topic is taken up in the next chapter.

Chapter 5: Funding for Rebuilding and CDBG Programs 60
5. FUNDING FOR REBUILDING AND CDBG PROGRAMS
The role and nature of CDBG funding is a key focus of this study. How did receipt of CDBG affect individual rebuilding decisions? How did recipients use the funds
in the two states where rebuilding was not mandatory? How were other sources of funding, including personal ones, used to supplement or substitute for CDBG funds? The Phase I report analyzed rates of CDBG receipt across the 230 significantly affected blocks sampled for the windshield observations and explored the relationship between CDBG receipt and rebuilding for the individual properties observed. Here, we supplement this analysis with new, owner-reported information on the range of financial resources that CDBG recipients obtained to support their rebuilding activities and, equally important, the funding used by owners of hurricane-damaged properties who did not receive CDBG assistance.
This chapter presents the findings and analysis related to CDBG receipt and rebuilding, and explores differences across the three states and program designs. The information on CDBG receipt and grant amounts presented in this chapter comes from the property-level administrative data obtained from the state CDBG programs in March 2010. Due to the very small number of recipients of CDBG small rental grants in the sample, the analysis focuses on homeowners and, in turn, the CDBG homeowner programs unless otherwise noted.
The chapter begins by providing a descriptive overview of the rates of CDBG receipt among the owner survey sample and the characteristics of CDBG homeowner grant recipients compared with nonrecipients. Section 5.2 then compares the use of CDBG funds across states. The next sections examine the various financial
resources that were employed, including CDBG (section 5.3), the gaps reported between available resources and estimated cost of rebuilding, and the use of personal funds for rebuilding (section 5.4), and the association between these various resources and rebuilding activity (section 5.5). Finally, section 5.6 discusses owner satisfaction with the CDBG programs and the pace of rebuilding across program models.
5.1 RATES OF CDBG RECEIPTExhibit 5-1 presents weighted estimates of the owners in the population from the survey sample who received CDBG homeowner and small rental program grants. This table is comparable to that presented in the Phase I report for the properties with major or severe damage included in the windshield observation sample.40 The weighted estimates suggest that in Louisiana and Mississippi, 50 to 60 percent of properties with major or severe damage received CDBG assistance. The rate of CDBG receipt was much lower among Texas homeowners, with a point estimate for the weighted sample of 6.5 percent and a confidence interval of 4.1 to 9.1 percent.41 CDBG funding was more limited in Texas and as a result the program was more targeted by geography and income.
40 Turnham, et al. (2010), exhibit 5-1, p. 72.
41 The raw numbers for Texas show a much higher rate of CDBG than the weight-ed numbers. This is because, as described in chapter 2, we oversampled CDBG recipients in Texas in order to obtain a sufficient number of survey responses from that group to permit analysis.

61Chapter 5: Funding for Rebuilding and CDBG Programs
Exhibit 5-1. CDBG Receipt Among Properties in the Owner Survey Sample by State
Louisiana Mississippi Texas
Raw Numbers
Weighted Estimatesa
Raw Numbers
Weighted Estimates
Raw Numbers
Weighted Estimates
Owner-Occupied Properties
Total properties 353 106,870 138 39,277 70 7,159
Number with CDBG awards 211 58,660 79 21,879 37 467
Percent with CDBG awards* 59.8 54.9 (49.6-60.2) 57.2 55.7
(46.3–65.1) 52.9 6.5 (4.1–9.0)
Rental Properties
Total properties 82 29,166 24 6
Number with CDBG awards 17 4,561 1 0
Percent with CDBG awards 20.7 15.6 (6.7–24.5) 4.2 0.0
CDBG = Community Development Block Grant. a 90 percent confidence intervals shown in parentheses.
Notes: Excludes properties identified as vacation homes or for which tenure in 2005 was not provided. Where the number of sampled properties or CDBG recipients is small (fewer than 25 properties and fewer than 10 CDBG recipients), we do not show weighted estimates.
Sources: 2011 Property Owner Survey; CDBG administrative data
Only Louisiana and Mississippi offered CDBG disaster assistance programs aimed at owners of small rental properties, and these programs were very small in scale compared to the homeowner programs. As shown in exhibit 5-1, we estimate that 15.6 percent of rental properties on significantly affected blocks in Louisiana received CDBG assistance; in Mississippi the survey sample size was too small to calculate a weighted estimate. Given the very small number of recipients of CDBG small rental grants in the owner survey sample, the remainder of this chapter (after exhibit 5-1) focuses exclusively on homeowners.
As described in chapter 2, recipients of CDBG homeowner funds in Louisiana (The Road Home program) had to choose one of three options: stay in the home and rebuild (Option 1), sell to the State and buy elsewhere in Louisiana (Option 2), or sell to the State and become renters in Louisiana or move out of state (Option 3). As shown in exhibit 5-2, most recipients in the owner survey sample (89.5 percent) chose Option 1, while 8.4 percent chose Option 2, and 2.2 percent chose Option 3.42
42 Statewide, 91.8 percent of recipients selected Option 1, 6.4 percent selected Option 2, and 1.8 percent selected Option 3. See Road Home Weekly Situation and Pipeline Report, Week 258, June 3,2011–June 9, 2011, available at http://www.road2la.org/Docs/pipeline/week258pipeline.pdf.

62Chapter 5: Funding for Rebuilding and CDBG Programs
Exhibit 5-2. CDBG Receipt by Option in Louisiana
Percent of CDBG Recipients CI
Option 1 89.5 84.8–94.2
Option 2 8.4 4.0–12.7
Option 3 2.2 1.2–3.1
Total 100.0
CDBG = Community Development Block Grant. CI = 90 percent confidence interval.
Notes: Weighted population estimates based on 216 survey responses. The CDBG administrative data did not indicate program option for all CDBG recipients in the survey sample.
Sources: 2011 Property Owner Survey; CDBG administrative data
Since CDBG administrative data do not provide detailed demographic characteristics for CDBG recipients, the findings from the 2011 owner survey provide new descriptive information on the characteristics of homeowners who received CDBG assistance compared with those who did not (exhibit 5-4). For two of the characteristics examined, race and ethnicity, the observed differences between CDBG recipients and nonrecipients were statistically significant. CDBG recipients were more likely to be of Hispanic or Latino origin and more likely to be African American than nonrecipients.
Exhibit 5-3 shows the distribution of CDBG homeowner assistance amounts by state for the owner survey sample. The median award amount was $78,949 in Louisiana, $66,577 in Mississippi, and $73,248 in Texas. This information is presented here to provide context for the analysis that follows, but it should be noted that the Phase I report provided comprehensive information on the distribution of CDBG award amounts for all recipients statewide and for the sample of properties included in the windshield observations, which is nearly five times as large as the owner survey sample.43
43 See Turnham, et al. (2010), exhibits 1-4 and 5-5. The distribution of award amounts for the CDBG programs statewide is presented in exhibit 1-4, and the distribution of award amounts for the windshield observation sample in Louisiana and Mississippi is presented in exhibit 5-5 of that report. In Louisiana, the median award amount for the owner survey sample is higher than the median award amount for the windshield observation sample ($78,949 compared with $65,000). The median award amounts for the owner survey sample and the wind-shield observation samples in Mississippi are nearly identical ($66,577 compared with $66,750).
Exhibit 5-3. Distribution of CDBG Award Amounts, Homeowners Only
Louisiana Mississippi Texas
25th percentile $38,657 $42,547 $62,812
50th percentile (median) $78,949 $66,577 $73,248
75th percentile $115,802 $98,334 $81,449
CDBG = Community Development Block Grant.
Note: Weighted population estimates based on 335 survey responses.
Sources: 2011 Property Owner Survey; CDBG administrative data

63Chapter 5: Funding for Rebuilding and CDBG Programs
Exhibit 5-4. Owner Characteristics of CDBG Recipients and Nonrecipients, Homeowners Only
CDBG Recipients Nonrecipients
Percent CI Percent CI
Age
18–44 13.6 10.6–16.7 17.5 12.9–22.1
45–64 45.9 40.2–51.7 45.7 39.1–52.1
65+ 40.4 34.7–46.2 36.8 30.5–43.1
Pretax Household Income in 2004
Less than $30,000 33.9 28.6–39.2 32.3 25.8–38.7
At least $30,000, less than $60,000 34.1 29.1–39.2 29.3 23.0–35.5
At least $60,000, less than $90,000 17.1 12.9–21.3 18.9 13.5–24.4
$90,000 or more 14.9 11.0–18.9 19.6 13.9–25.2
Ethnicity+
Hispanic or Latino 4.4 2.5–6.2 1.7 0.4–3.1
Not Hispanic or Latino 95.6 93.8–97.5 98.3 96.9–99.6
Race*
Black or African American 45.1 37.8–52.4 32.2 24.8–39.6
White alone 46.9 39.6–54.2 58.9 50.5–67.2
Other or multiple race 8.0 5.2–10.9 8.9 5.6–12.2
CDBG = Community Development Block Grant. CI = 90 percent confidence interval. **p < 0.01; *p < 0.05; +p < 0.10.
Note: Weighted population estimates based on 551 survey responses.
Sources: 2011 Property Owner Survey; CDBG administrative data
Exhibit 5-5 shows the property characteristics of CDBG recipients and nonrecipients. Like the demographic characteristics of owners, this information is largely unavailable in the CDBG administrative data. The properties that received CDBG assistance are different from those that did not receive CDBG in several ways that are consistent with the program goals and design. Each of these differences is statistically significant:
•Properties valued at $300,000 or more by their owners before the hurricanes are less likely to have received CDBG.
•Properties that experienced flood damage are more likely to have received CDBG. This holds true even if we exclude recipients in Mississippi,
where properties had to have some flood damage to qualify for CDBG homeowner assistance.
•Properties with higher levels of assessed damage—as reported by owners—are more likely to have received CDBG than properties that did not receive assistance.

64Chapter 5: Funding for Rebuilding and CDBG Programs
Exhibit 5-5. Characteristics of CDBG Recipient and Nonrecipient Properties, Homeowners Only
CDBG Recipients Nonrecipients
Percent CI Percent CI
Insurance Status
Insurance 88.2 84.3–92.2 86.5 82.5–90.4
No insurance 11.8 7.8–15.7 13.5 9.6–17.5
Mortgage Status
Mortgage 57.7 51.8–63.6 54.5 47.6–61.4
No mortgage 42.3 36.4–48.2 45.5 38.6–52.4
Pre-Storm Value*
Value less than $80,000 15.2 11.5–19.0 14.9 10.0–19.8
Value $80,000–$175,000 54.5 48.7–60.4 47.5 40.0–54.9
Value $175,000–$300,000 23.8 18.6–29.1 22.2 16.8–27.6
Value $300,000+ 6.4 3.6–9.1 15.5 9.6–21.4
Extent of Hurricane Damage*
Leveled/demolished/condemned 25.9 19.4–32.4 21.9 16.4–27.5
Not leveled/demolished/condemned 74.1 67.6–80.6 78.1 72.5–83.6
Type of Damage**
Flooding 95.4 93.2–97.7 73.8 67.4–80.2
No flooding 4.6 2.3–6.8 26.2 19.8–32.6
Assessed Damage Amount**
Less than $10,000 3.9 1.4–6.4 11.9 6.6–17.2
At least $10,000 but less than $50,000 14.3 9.0–19.7 26.5 19.4–33.6
At least $50,000 but less than $100,000 34.2 27.3–41.1 22.3 15.8–28.9
$100,000 or more 47.6 39.3–60.0 39.2 30.5–47.9
CDBG = Community Development Block Grant. CI = 90 percent confidence interval. **p < 0.01; *p < 0.05; +p < 0.10.
Note: Weighted population estimates based on 561 survey responses (assessed damage amount based on 296 responses).
Sources: 2011 Property Owner Survey; CDBG administrative data

65Chapter 5: Funding for Rebuilding and CDBG Programs
5.2 USE OF CDBG FUNDSFindings from the owner survey also shed more light on how CDBG recipients used their funds, beyond those uses laid out in the different program models (like selling the property in Louisiana’s Options 2 and 3, or only repair and rebuilding uses in Texas). The states had wide latitude in designing CDBG programs to assist owners of property affected by Hurricanes Katrina and Rita. The specifics of the programs are detailed in appendix A. But broadly speaking, the homeowner assistance programs in Mississippi and Texas were more targeted than the program in Louisiana, both by income and geography. In addition, the homeowner programs in Mississippi and Louisiana followed a compensation model, providing funds directly to homeowners, while the program in Texas used a rehabilitation model, in which funds were explicitly for repairs or reconstruction projects conducted by the state (through contractors) on the owner’s behalf.
The compensation model used in Louisiana and Mississippi gave homeowners discretion in how to address the damage to their homes, and also opened the possibility that some homeowners would use CDBG grants for purposes other than repairing or rebuilding their storm-damaged homes. There was no possibility of this in Texas, which reimbursed contractors and did not provide funds directly to homeowners. Not all grant recipients in Louisiana and Mississippi were required to repair or rebuild their homes. The Road Home program recipients in Louisiana who selected Option 1 agreed to ensure that their home would be repaired or rebuilt. Recipients who selected The Road Home Option 2 or 3 agreed to sell the damaged property and received the grant in compensation, so there was no expectation that they would rebuild their storm-damaged homes. In Mississippi, Phase 3 grant recipients in Mississippi—those who received grants under the Sold Home program—had already sold their properties and were not required to ensure that the damage was repaired. Anecdotally, there was also more
latitude in rebuilding requirements for the recipients of other Mississippi phases than in Louisiana’s Option 1 recipients.
For the remaining homeowners who were required to repair or rebuild, the extent to which CDBG recipients used their grant funds other than for repairing or rebuilding their storm-damaged homes is an important question for this study. If grant recipients in Louisiana and Mississippi used a large share of their grants for purposes other than rebuilding or repair, it would suggest that greater restrictions on the use of funds might be warranted if the goal is to encourage rebuilding.
The owner survey data suggest that most recipients used their grants for repairing or rebuilding activities only. As shown in exhibit 5-6, 86.5 percent of recipients in Louisiana and 64.0 percent of recipients in Mississippi reported using the entire grant to repair or rebuild the hurricane-damaged property. But, 7.1 percent of Louisiana recipients and 20.3 percent of Mississippi recipients used some, but not all, of their grant funds for repair and rebuilding. And 6.4 percent of recipients in Louisiana and 15.7 percent in Mississippi reported that they spent none of their grant funds on repair and rebuilding. Even with the small sample size, the difference observed between the two states in the proportion of CDBG funds used for rebuilding (all, none, or part) is statistically significant.

66Chapter 5: Funding for Rebuilding and CDBG Programs
Exhibit 5-6. Share of CDBG Homeowner Grant Funds Used for Repair and Rebuilding, Louisiana and Mississippi Homeowners Only
CDBG = Community Development Block Grant.
Note: Weighted population estimates based on 128 survey responses in Louisiana and 40 survey responses in Mississippi among CDBG recipient homeowners.
Sources: 2011 Property Owner Survey; CDBG administrative data
The sample size from the owner survey limits the opportunity to perform rigorous analysis of the uses of CDBG funds for purposes other than repair or rebuilding. Among the small share of CDBG recipients who reported using at least part of their CDBG grants for something other than repair and rebuilding, however, the most common use of funds was to purchase furniture (54.6 percent), followed by paying for everyday expenses (45.1 percent), and paying off a mortgage or loan (30.1 percent) (see exhibit 5-7). Rebuilding rates among those CDBG recipients who did not use any CDBG funds for repair and rebuilding were 38.2 percent in Louisiana and 22.2 percent in Mississippi—considerably lower than the 80.6 percent rebuilding rate among all CDBG recipients reported later in this chapter, although, again, the size of this subpopulation is too small for statistical comparison.
80%
90%
100%
60%
70%
40%
50%
20%
30%
10%
0%All of grant Part of grant None of grant
Mississippi (N = 11,602)
Louisiana (N = 41,619)
64.0%
86.5%
20.3%15.7%
7.1% 6.4%

67Chapter 5: Funding for Rebuilding and CDBG Programs
Exhibit 5-7. Common Uses of CDBG Homeowner Grants for Activities Other than Repair and Rebuilding, Louisiana and Mississippi Homeowners Only
Weighted population estimates based on 59 survey responses. Includes The Road Home Option 2 and 3 recipients.
Sources: 2011 Property Owner Survey; CDBG administrative data
5.3 RESOURCES FOR REBUILDINGGiven the small sample of owners who used CDBG grants for purposes other than repair or rebuilding, more interesting findings can be expected when analyzing the amount of CDBG grants in relation to all other potential sources of repair and rebuilding funding. CDBG grants were intended to provide resources to cover all, or at least a portion up to the grant maximum, of the costs associated with rebuilding for recipients beyond what other financial sources could cover, including homeowner or NFIP insurance payouts, SBA loans, and FEMA assistance.
The owner survey asked all owners to list each source of funding received for repair or rebuilding activities and to provide an estimate of the amount of funding received from each source. In addition to CDBG assistance, the survey asked owners about financial assistance received from homeowners insurance, flood insurance, Increased Cost of Compliance, Hazard Mitigation Grant Program, FEMA’s individual assistance program, SBA loans, state programs, churches or charities, and friends and family.
We calculated a total amount of resources received for each survey respondent using the owner-reported dollar amount for each funding source except for CDBG assistance. For CDBG assistance, we used the CDBG administrative data provide by each state, matched to
To make some other large purchase
To pay off a mortgage/loan
To pay for everyday expenses
To purchase furniture
To pay for moving expenses
To pay for temporary housing
To purchase a vehicle
Rent another place to live
Purchase a home
30.1%
45.1%
54.6%
21.8%
21.3%
18.5%
15.0%
14.8%
14.0%
0% 10% 20% 30% 50% 70%40% 60%
Percent of CDBG recipients who reported using funds for something
other than rebuilding

68Chapter 5: Funding for Rebuilding and CDBG Programs
the owner survey, as we determined that it would be more accurate than owner recall.
For the funding amounts reported by owners for sources other than CDBG, we relied solely on the owner-reported amounts. In a small number of cases—less than 1 percent of the sample—we were able to determine that the information owners provided on funding gaps was clearly inaccurate (for example, amounts reported in excess of $1 million from any one source, or exceeding those sources’ stated award caps), and these responses were excluded from analysis. Other
funding amounts that may have been over or under reported by owners, such as SBA loan amounts, could not be tested and these observations remain in the analysis.
Exhibit 5-8 compares the total resources reported among CDBG recipients and nonrecipients. CDBG recipients reported having substantially more resources than nonrecipients. The average (mean) amount of total resources reported by CDBG recipients was $144,963, compared with $95,211 for nonrecipients. This difference is statistically significant.
Exhibit 5-8. Total Amount of Resources (Including CDBG and Other Sources) Among CDBG Recipients and Nonrecipients, Homeowners Only
CDBG Recipients(N = 80,155)
Nonrecipients(N = 55,428)
Estimate CI Estimate CI
25th percentile $85,497 $76,243–$94,752 $14,751 $9,305–$20,196
Median $121,165 $111,423–$130,908 $51,159 $33,669–$68,648
Mean* $144,963 $131,117–$158,810 $95,211 $74,535–$115,887
75th percentile $177,549 $155,370–$199,729 $119,948 $89,425–$150,470
CDBG = Community Development Block Grant. CI = 90 percent confidence interval. **p < 0.01; *p < 0.05; +p < 0.10.
Note: Weighted population estimates based on 499 survey responses.
Sources: 2011 Property Owner Survey; CDBG administrative data
Further analysis of the survey data suggests that recipients also supplemented their CDBG assistance with other types of funding for repair and rebuilding after the hurricanes. Exhibit 5-9 shows how the share of CDBG assistance relative to total resources varies by state. The exhibit shows that less than one-fourth of recipients in Louisiana and Mississippi cited CDBG as their only source funding for repair or rebuilding. In Texas, the situation is reversed: for 71.1 percent of CDBG recipients, CDBG was the only source of financial assistance for rebuilding. This is what we would expect, given that recipients of CDBG assistance in Texas did not pay for the rebuilding work themselves, but rather had their homes repaired or rebuilt by state-hired contractors.
The owner survey provides us with the picture (exhibit 5-9) of the total value of all resources among the population. It provides additional insight into how CDBG grants fit into recipients’ resource mix. But, while non-CDBG recipients certainly tapped into other sources of funds, most CDBG recipients also supplemented their CDBG grants with other sources of funds. A deeper explanation of the sources of these other funds is warranted.

69Chapter 5: Funding for Rebuilding and CDBG Programs
Exhibit 5-9. CDBG Grant Relative to Total Amount of Resources of CDBG Recipients by State, Homeowners Only
CDBG as Percentage of Total Resources
Percentage of CDBG Recipients per State
Louisiana Mississippi Texas
1–49% 37.9 27.6 7.5
50–99% 39.7 55.7 20.9
100% 22.4 16.7 71.7
CDBG = Community Development Block Grant.
Note: Weighted population estimates based on 335 responses.
Sources: 2011 Property Owner Survey; CDBG administrative data (for CDBG assistance amounts)
One might expect homeowners who did not receive CDBG to draw on a wider or different array of funding sources than CDBG recipients. This is not borne out by the survey findings. Exhibit 5-10 shows, for each source of funding covered in the owner survey, the percent of CDBG recipients and nonrecipients using the source, and the median amount reported from that source. In general, we see no significant differences between CDBG recipients and non-CDBG recipients in the rate at which they reported using other sources of funding. However, CDBG recipients were significantly more likely to report receiving assistance through the SBA loan and HMGP elevation programs.44
Exhibit 5-10 also shows the median amounts reported by owners for each funding source. Among the more common sources of funding for rebuilding other than CDBG funds, flood insurance payouts provided the highest median amounts to both CDBG and non-CDBG owners, followed by SBA loans, homeowners insurance payouts, and FEMA Individual Assistance grants. Comparing the median dollar amounts reported
44 In Louisiana and Mississippi, the Hazard Mitigation Grant Program’s (HMGP’s) elevation grants and CDBG programs were linked based on similar eligibility requirements and on their cumulative meeting of owners’ needs. For example, CDBG recipients in Louisiana could apply for both The Road Home Elevation Incentives and the State’s HMGP elevation grants. However, HMGP funds were based on the costs of construction beyond funds covered first by other sources and then by The Road Home Elevation Incentive. The Road Home incentive was capped at $30,000 per home ($20,000 for manufactured homes) and was included in the $150,000 total The Road Home grant cap; the HMGP grant was capped at $100,000 based on the total construction cost but not subject to The Road Home grant cap. In all cases, only The Road Home Option 1 recipients were eligible for either. See www.road2la.org/homeowner/faqs.htm#9 and www.mitigatela.org/Elevate.aspx.
by CDBG and non-CDBG recipients, we find that CDBG recipients generally reported lower levels of funding from sources other than CDBG compared with nonrecipients. For example, the median amount of homeowners insurance payouts for CDBG recipients was $16,250, while for nonrecipients it was $24,603. Similarly, the median payout from flood insurance, National Flood Insurance Program (NFIP) insurance policies, and the NFIP’s Increased Cost of Compliance (ICC) funds was $63,295 for CDBG recipients, while it was $99,125 for nonrecipients.45 Although reported to be used at higher rates, the median CDBG recipients’ SBA loan was $38,231; the median non-CBBG recipients’ SBA loan amount was $82,904.46
The findings from exhibit 5-8 suggest that CDBG recipients were not dissimilar from nonrecipients in drawing on a range of funding sources to meet their rebuilding needs, although in many cases they received less assistance from these other (non-CDBG) sources than their non-CDBG counterparts. This is consistent with the design of the program, which was intended to make up the shortfall between rebuilding costs and the funding available to owners from other sources.
45 Increased Cost of Compliance is an NFIP bonus allowance to improve disaster mitigation for flood affected properties.
46 In Louisiana specifically, applicants who received The Road Home assistance under Option 1 and also had an SBA loan for costs to repair or rebuild their home were required by SBA to repay or reduce their SBA loan to the extent that the homeowner’s total benefits (SBA assistance plus The Road Home funds plus other assistance) exceeded the need. The SBA determined the amount of The Road Home award that it considered to be a duplication of benefits. So, the SBA loan amounts of CDBG recipients, on the whole, would be smaller than non-CDBG owners. See www.road2la.org/homeowner/faqs.htm#16.

70Chapter 5: Funding for Rebuilding and CDBG Programs
Exhibit 5-10. Percentage of Owners Reporting Other Sources of Funding (Other than CDBG) and Median Amount Reported from Each Other Source, Homeowners Only
CDBG Recipients Nonrecipients
Percent CIMedian Amount
Percent CIMedian Amount
Homeowners insurance payout 64.1 59.5–68.7 $16,250 62.3 57.0–67.7 $24,603
Flood insurance, NFIP, or ICC payout
36.8 29.3–44.3 $63,295 39.1 31.6–46.6 $99,127
FEMA individual assistance grant
27.4 22.8–31.9 $5,823 21.7 17.4–26.0 $4,029
SBA loan* 28.2 23.1–33.3 $38,231 10.3 6.1–14.6 $82,904
Church or charity 11.3 8.2–14.4 $723 8.4 4.8–12.0 $455
Friends or relatives 5.2 3.2–7.1 $1,927 7.0 4.3–9.7 $905
Other type of financial assistance
7.2 4.5–9.8 $1,041 3.5 1.8–5.1 $500
HMGP elevation grant* 7.3 4.4–10.1 $28,132 0.9 0.0–1.9 $21,480
Another state loan or grant 1.9 0.5–3.2 $65,947 0.3 0.0–0.8 $150,000
None of the above sources 12.7 9.4–16.0 — 16.7 12.5–20.9 —
CDBG = Community Development Block Grant. CI = 90 percent confidence interval. FEMA = Federal Emergency Management Agency. HMGP = Hazard Mitigation Grant Program. ICC = Increased Cost of Compliance. NFIP = National Flood Insurance Program. SBA = Small Business Administration. **p < 0.01; *p < 0.05; +p < 0.10.
Note: Weighted population estimates based on 592 responses.
Sources: 2011 Property Owner Survey; CDBG administrative data (for CDBG assistance amounts)
5.4 RESOURCE GAPS AND USE OF PERSONAL FUNDSIn addition to asking owners to report the amount of funding received, the assessed damage to their homes, and the actual repair costs incurred (from which funding sufficiency could be calculated), the property owner survey directly asked owners whether the total funding from all sources—including CDBG, when applicable—was sufficient to cover their rebuilding expenses. Exhibit 5-11 shows the percentage of owners reporting that their total funding was not sufficient to cover rebuilding expenses for CDBG recipients and nonrecipients. Across both groups, more than one-third of owners said their funding was not sufficient. The observed difference between CDBG recipients and nonrecipients is not statistically significant.
Exhibit 5-12 combines the owner-reported information on the total funding received for rebuilding and the amount of their damage assessment after the hurricanes, to show total funds received as a percent of assessed damage among CDBG recipients and nonrecipients. In contrast to the differences in exhibit 5-11, the observed differences between CDBG recipients and nonrecipients in exhibit 5-12 are statistically significant. CDBG recipients were more likely than nonrecipients to have total funding that equaled or exceeded the assessed damage amount and less likely to have funding that fell short of the damage amount.

71Chapter 5: Funding for Rebuilding and CDBG Programs
Exhibit 5-11. Owner Reports on the Sufficiency of Total Funding by CDBG and Non-CDBG Receipt, Homeowners Only
CDBG Recipients Nonrecipients
Percent CI Percent CI
Funding sufficient to cover rebuilding expenses
33.7 28.0–39.4 37.5 31.3–43.8
Funding not sufficient to cover rebuilding expenses
64.6 59.1–70.1 55.7 49.6–61.9
Don't know/refused 1.7 0.5–2.9 6.7 3.3–10.1
CDBG = Community Development Block Grant. CI = 90 percent confidence interval.
Note: Weighted population estimates based on 542 responses.
Source: 2011 Property Owner Survey
The higher share of owners for whom the amount of financial assistance for rebuilding matched the assessed damage among CDBG recipients suggests that the CDBG program did help address the funding gap for many owners. However, the findings presented in exhibits 5-11 and 5-12 are inconsistent. In particular, exhibit 5-12 suggests a smaller gap between total resources and needs than what owners reported in exhibit 5-11. It could be that the actual cost of repairs
Exhibit 5-12. Total Resources Relative to Owner-Reported Damage Assessments, Homeowners Only
proved to be higher than the assessed damage amount. It could also be that owner reports of the assessed damage amount (or the amounts of funding received) are unreliable, as discussed previously in section 3.1. For that reason, the multivariate analysis presented in section 5.5 uses the owner reports that funding was not sufficient to cover rebuilding expenses (as presented in exhibit 5-11) rather than the share of damage covered by total resources shown in exhibit 5-12.
CDBG Recipients Nonrecipients
Percent CI Percent CI
Total funding = less than 50% of assessed damage 5.5 2.7–8.2 16.0 10.7–21.3
Total funding = 50%–99% of assessed damage 12.3 6.6–18.1 19.6 12.6–26.7
Total funding = 100% of assessed damage or more 82.2 76.0–88.4 64.3 56.2–72.5
CDBG = Community Development Block Grant. CI = 90 percent confidence interval.
Note: Weighted population estimates based on 281 responses.
Source: 2011 Property Owner Survey

72Chapter 5: Funding for Rebuilding and CDBG Programs
The differences between CDBG and non-CDBG findings may not be surprising; however, the fact that CDBG recipients report insufficient levels of total resources to meet their rebuilding need is. Both CDBG and non-CDBG recipients sought out a variety of sources of assistance and also tapped into their personal resources. As shown in exhibit 5-13, for both recipients and nonrecipients, most homeowners reported using their own money to cover rebuilding expenses.47 The differences between the two groups are not statistically significant, suggesting that CDBG recipients were no less likely to tap into personal resources than owners who did not receive CDBG assistance.
Owners who reported using personal funds were asked to identify the various sources of personal funds used. As shown in exhibit 5-14, most of these owners (85.6 percent) reported using their personal checking and savings accounts to fill their funding gaps. Credit cards were the second most cited source of personal funds (30.1 percent), with retirement accounts, mutual
47 Of those CDBG recipients who used no portion of their CDBG funds for re-building, 21.3 and 54.2 percent used their own funds for rebuilding in Louisiana and Mississippi, respectively. Although too small a sample size to analyze statisti-cally, this suggests that some of this group could have tapped into their personal funds after exhausting CDBG funds on nonrepair uses.
funds, and other homeowner financing products cited at lower rates.
The exploration of these owners with insufficient funds, their alternative funding sources, and their use of personal funds focuses attention away from those owners who reported having sufficient funds from all financial assistance (including CDBG and other funding sources). As reported previously, more than one-third of owners reported that their funding was sufficient to cover their rebuilding expenses. When looking across the total owner population, and between the CDBG and non-CDBG recipient groups, we can visually compare the median assessed damage, total funding (including CDBG grant value for recipients), and repair costs across the states. This is shown in exhibit 5-15 for all owners including CDBG and non-CDBG recipients, exhibit 5-16 for CDBG recipients, and exhibit 5-17 for non-CDBG recipients.48
48 In these exhibits, owner-reported values for damage assessment, funding from non-CDBG sources, and repair costs are taken from the owner survey but admin-istrative data provide the values for CDBG grants matched to these recipients. Damage assessments and repair costs among CDBG recipients in Texas are likely distorted since recipients did not receive the funding directly and may not have known the exact values.
Exhibit 5-13. Use of Personal Funds to Cover Rebuilding Expenses, Homeowners Only
CDBG Recipients Nonrecipients
Percent CI Percent CI
Used own money to cover expenses 59.6 54.2–65.0 52.2 45.9–58.5
Did not use own money to cover expenses 40.0 34.7–45.4 47.6 41.2–53.9
Don't know/refused 0.4 0.0–0.9 0.2 0.0–0.6
CDBG = Community Development Block Grant. CI = 90 percent confidence interval.
Note: Weighted population estimates based on 500 responses.
Source: 2011 Property Owner Survey

73Chapter 5: Funding for Rebuilding and CDBG Programs
Exhibit 5-14. Sources of Personal Funds Used for Rebuilding, Homeowners Only
Note: Weighted population estimates based on 259 survey responses.
Source: 2011 Property Owner Survey
Exhibit 5-15. Median Assessed Damage, Total Funding Assistance, and Repair Costs for All Owners by State
Note: Estimates of assessed damage based on 231 respondents in Louisiana, 88 respondents in Mississippi, and 33 respondents in Texas. Estimates of total funding assistance based on 423 respondents in Louisiana, 166 respondents in Mississippi, and 74 respondents in Texas. Estimates of repair costs based on 246 respondents in Louisiana, 105 respondents in Mississippi, and 52 respondents in Texas.
Sources: 2011 Property Owner Survey; state administrative data; weighted population estimates
Mutual funds
Retirement savings account
Credit card
Checking or savings account
Home equity loan
Refinance
Life insurance
Other type of loan
Other
21.2%
30.1%
85.6%
15.5%
8.1%
6.5%
6.5%
2.5%
0.8%
0% 10% 20% 30% 50% 80%70% 100%40% 60% 90%
$120,000
$80,000
$40,000
$0Louisiana Mississippi Texas
Median repair costs
Median assessed damage
Median total funding
100,214
69,863
7,612
89,523
74,227
35,124
86,842
49,356
26,525

74Chapter 5: Funding for Rebuilding and CDBG Programs
Exhibit 5-16. Median Assessed Damage, Total Funding Assistance, and Repair Costs Among CDBG Recipients Only by State
Median funding non-CDBG
Median funding CDBG
Median assessed damage
Median repair costs
$120,000
$60,000
$90,000
$30,000
$0Louisiana Mississippi Texas
48,463
39,242
76,648
66,736
72,998
98,285
78,569
36,376
98,709
69,790 68,030
CDBG = Community Development Block Grant.
Note: CDBG funding values are based on administrative data, but this information was missing for 9 Louisiana recipients—that is, estimates of CDBG value for Louisiana are based on 224 respondents. Estimates of assessed damage based on 118 respondents in Louisiana, 47 respondents in Mississippi, and 14 respondents in Texas. Estimates of total funding assistance based on 232 respondents in Louisiana, 84 respondents in Mississippi, and 37 respondents in Texas. Estimates of repair costs based on 134 respondents in Louisiana, 52 respondents in Mississippi, and 28 respondents in Texas.
Sources: 2011 Property Owner Survey; state administrative data; weighted population estimates
Exhibit 5-17. Median Assessed Damage, Total Funding Assistance, and Repair Costs Among Non-CDBG Recipients by State
Louisiana Mississippi Texas
Median repair costs
Median assessed damage
Median total funding
38,549
16,780
6,054
84,345
38,84735,014
77,277
29,45124,609
$120,000
$60,000
$90,000
$30,000
$0
CDBG = Community Development Block Grant.
Notes: Estimates of assessed damage based on 113 respondents in Louisiana, 41 respondents in Mississippi, and 19 respondents in Texas. Estimates of total funding assistance based on 191 respondents in Louisiana, 82 respondents in Mississippi, and 37 respondents in Texas. Estimates of repair costs based on 112 respondents in Louisiana, 53 respondents in Mississippi, and 24 respondents in Texas.
Sources: 2011 Property Owner Survey; state administrative data; weighted population estimates

75Chapter 5: Funding for Rebuilding and CDBG Programs
5.5 RESOURCES AND REBUILDINGThe discussion in the preceding sections suggests that owners of hurricane-damaged properties on significantly affected blocks received substantial resources from insurance, the federal government, and local sources to use toward repair and rebuilding. At the same time, most owners—including those who received CDBG assistance and those who did not—reported that all of the resources they received combined were not sufficient to cover their rebuilding expenses.
Whether CDBG should have fully covered the costs of rebuilding for a smaller group of owners (versus spreading resources more thinly) is an important policy issue. The information collected through the property owner survey can shed light on this question by exploring whether additional CDBG funding might have resulted in increased rebuilding. We do this by examining the relationship between gaps in funding and rebuilding—using the same measure of rebuilding as in chapter 4, which is based on owner assessment of the condition of the storm-damaged property as of early 2011.
The question of whether additional funding would have increased rebuilding applies to both CDBG recipients and nonrecipients. For owners who did not receive CDBG assistance, the question is whether access to CDBG funds would have increased their rates of rebuilding. Among CDBG recipients, the question is whether additional CDBG funds would have increased their rates of rebuilding further. This section examines the gaps in funding assistance for both groups, identifying the characteristics of households
that experienced funding gaps and describing the relationship between funding gaps and rebuilding.49
Because the information for much of this analysis comes from the owner survey, a limitation of the analysis is that the measures of rebuilding, CDBG application, and the adequacy of funding are reported by the property owners after the fact—and owners’ responses may be colored by whether they managed to achieve rebuilding. In other words, owners who managed to rebuild might be more likely to report that they had sufficient funds to do so, and vice versa. It is worth reiterating here that the Phase I report found that—excluding properties that were sold to the state through The Road Home Options 2 and 3—properties that received CDBG assistance were nearly twice as likely to be rebuilt as of early 2010 (based on windshield observation) as properties that did not receive CDBG.
Access to Resources and RebuildingExhibit 5-18 describes the reported funding gaps and rebuilding rates for three groups of homeowners: owners who received CDBG grants, owners who applied for CDBG assistance but did not receive a grant, and owners who did not apply for CDBG assistance at all. The exhibit shows that the group of homeowners who applied for but did not receive CDBG funds lagged significantly in rebuilding. This set of homeowners includes a higher proportion of homeowners who reported insufficient funds and fewer properties that can be classified as rebuilt based on owner assessment of their condition in early 2011.
Exhibit 5-19 compares the amount of the funding gap (according to the owners) and the rate of rebuilding for homeowners who reported having insufficient funds for rebuilding, separating those who did not put their
49 In this report we have not tried to replicate the results presented in the Phase I report showing that properties that received CDBG funding (with the exception of those assisted through The Road Home Options 2 and 3) were significantly more likely to be rebuilt as of early 2010 than properties without this funding. The Phase I analysis was based on a sample of properties more than six times as large as the sample of properties with owner survey data relevant for this analysis. As a result, we limited our analysis in this report to questions that could be answered using only the information collected from the property owner survey.

76Chapter 5: Funding for Rebuilding and CDBG Programs
personal funds into rebuilding from those who did. It also shows the rate of rebuilding for homeowners who did not report a funding gap. The exhibit suggests that, among households who reported insufficient assistance,
there are substantial differences between those who used their personal funds (or who had personal funds available for use) and those who did not.
Exhibit 5-18. Funding Gaps and Rebuilding by CDBG Receipt and Application Status, Homeowners Only
Received CDBGApplied for but Did Not Receive CDBG
Did Not Apply for CDBG
Percent who reported insufficient funding
64.9% 83.0%** 56.3%
Amount of gap (if funds insufficient) $60,564** $94,288** $34,214
Percent who use own funds (if funds insufficient)
44.1%** 32.1% 28.5%
Amount of own funds $44,964** $47,223** $20,055
Percent rebuilt 80.6% 58.1%+ 74.7%
Number of survey responses 242 105 172
CDBG = Community Development Block Grant. **p < 0.01; *p < 0.05; +p < 0.10.
Notes: Weighted population estimates based on 519 responses. The percent of CDBG recipients who reported insufficient funding is slightly different from the percent reported in exhibit 5-11 previously, because this exhibit excludes anyone who answered “don’t know” or “refused” to the question of funding insufficiency or the question of whether they applied for CDBG assistance. Significant differences are determined between “Received CDBG” and “Did not apply for CDBG” and “Applied for but did not receive CDBG” and “Did not apply for CDBG” separately, with significance indicators on the first two respective columns.
Sources: 2011 Property Owner Survey; CDBG administrative data
Exhibit 5-19. Funding Gaps and Rebuilding by Funding Sufficiency and Use of Personal Funds, Homeowners Only
Insufficient Funds and No Personal Funds Put
into Rebuilding
Insufficient Funds and Personal Funds Put into
RebuildingSufficient Funds
Amount of gap $90,398 $45,856 $0
Percent rebuilt 46.2%** 80.7%+ 88.9%
Number of survey responses
179 181 177
**p < 0.01; *p < 0.05; +p < 0.10.
Note: Weighted population estimates based on 537 responses.
Sources: 2011 Property Owner Survey; CDBG administrative data

77Chapter 5: Funding for Rebuilding and CDBG Programs
The rebuilding measure, in particular, lags among those who reported not spending any of their own money on rebuilding, with only 46 percent of those properties rebuilt. This finding may suggest that a lack of funds prevented rebuilding activity for many of these homeowners. We did not ask the owners directly whether they had funds available that they did not use. However, it might also be a reflection of the decision not to rebuild—and therefore not to invest personal funds—by some homeowners.
In exhibits 5-18 and 5-19, tests of differences in means are applied to the figures in each table. In exhibit 5-18, each of the first two columns is compared against the set of homeowners who did not apply for CDBG. In exhibit 5-19, each of the first two columns is compared against the set of homeowners who reported that their total assistance was sufficient to cover rebuilding costs. Because this group—by definition—did not report a funding gap, no tests were performed to compare the amount of the funding gap in exhibit 5-19.
The overall conclusion from exhibits 5-18 and 5-19 is that the two groups of homeowners within the survey exhibit lower rates of rebuilding and might have benefited from additional funds. First, homeowners who applied for CDBG assistance but did not receive grants were less likely to rebuild. Among these homeowners, 58 percent of properties were rebuilt as of early 2011, compared with more than 75 percent among other homeowners. Second, among households who reported insufficient funding and did not or could not invest any of their own funds, 46 percent of properties were rebuilt. The exhibits that follow seek to describe the characteristics of each group to better understand the impact of CDBG eligibility rules and funding on their decisions to rebuild. Although there is some overlap between the two groups, it is nevertheless instructive to consider them separately.
Exhibit 5-20 provides descriptive statistics on the property attributes and demographic characteristics of homeowners who applied for but did not receive CDBG, compared with CDBG recipients and
nonapplicants. The exhibit shows that the homeowners who did not apply for CDBG are more likely to be White and to have wind damage only. (The latter is not surprising, given that eligibility for Mississippi’s CDBG program was limited to properties with flood damage.) Homeowners who applied for, but did not receive, CDBG are more likely than owners who did not apply to have flood insurance and to no longer own the property.

78Chapter 5: Funding for Rebuilding and CDBG Programs
Exhibit 5-20. Property and Owner Characteristics by CDBG Receipt and Application Status, Homeowners Only
Received CDBGApplied for but Did Not Receive CDBG
Did Not Apply for CDBG
Property Attributes
Presence of hazard insurance 58.8% 53.7% 58.8%
Presence of flood insurance 32.3%** 48.4%** 16.4%
Flood damage only 14.8% 13.1% 14.6%
Wind damage only 5.4%** 3.0%** 36.3%
Flood and wind damage 79.8%** 83.9%** 49.2%
Change in owner since 2005 9.8%* 45.2%** 18.3%
Property received FEMA grant 22.6% 20.5% 24.5%
Property received SBA loan 22.5%** 19.5%* 9.0%
Property received elevation grant 7.1%** 1.7% 0.6%
Owner Demographics
Income < $30,000 36.0% 27.3% 31.3%
Income $30,000–$59,999 34.8% 31.4% 30.8%
Income $60,000–89,999 17.2% 21.1% 16.5%
Income $90,000+ 12.0%+ 20.1% 21.3%
Age of property owner 60.9 58.9 58.6
Number of household members 2.6 2.7 2.7
Presence of dependent minor 25.4% 26.6% 30.6%
White alone 44.0%** 46.1%+ 66.0%
Black or African American alone 50.0%** 42.6%+ 23.6%
Other/multiple races 5.7% 10.6% 10.3%
Number of survey responses 242 105 172
CDBG = Community Development Block Grant. FEMA = Federal Emergency Management Agency. SBA = Small Business Administration.
**p < 0.01; *p < 0.05; +p < 0.10.
Note: Weighted population estimates based on 519 responses.
Sources: 2011 Property Owner Survey; CDBG administrative data

79Chapter 5: Funding for Rebuilding and CDBG Programs
More than 45 percent of owners who applied for CDBG but did not receive a grant, no longer own the property, compared with 9.8 percent of CDBG recipients and 18.3 percent of owners who did not apply. There are two potential explanations. It may be that some owners who applied for the grants decided to (or needed to) sell their properties in the long interval it took for this funding to come through. Alternatively, homeowners who did not receive CDBG may have sold their homes rather than partially rebuild or try to fund the rebuilding themselves.
To explore the comparisons in exhibit 5-20 further, we performed multinomial logit regressions that identify the association between the property and owner attributes and the categories of CDBG receipt. The findings from the regression analyses reinforce the comparisons shown in exhibit 5-20, providing little evidence that collinearity between the characteristics carries implications for interpreting these comparisons.50
Exhibit 5-21 presents similar information, but for homeowner groups defined by the reported sufficiency of total resources to cover rebuilding costs and use of personal funds for rebuilding expenses. The findings suggest that the set of homeowners who reported insufficient funds, but did not invest their own money, differ in several ways from other households. First, 41 percent of these homeowners no longer own the property, compared with 7 percent of homeowners who reported having insufficient funds but invested their own money and 13 percent of homeowners who reported having sufficient funds. Echoing the previous discussion, the causality of this relationship is unclear. It may be that owners planning to sell were not willing to invest their own funds into rebuilding. Alternatively, it could be that owners who did not have the financial resources to rebuild had no alternative but to sell the property and find another place to live.
50 The exception is that adding state dummy variables (for location in Louisiana, Mississippi, or Texas) results in the difference between groups with respect to the presence of flood insurance becoming smaller and no longer statistically signifi-cant across CDBG categories.
The set of homeowners who reported insufficient funds and did not invest their own money also differs in its racial composition. White homeowners are more likely to report that their funds were sufficient, while African-American homeowners are more likely either to report insufficient funds and invest their own money or to report insufficient funds and not invest their own money. Lastly, homeowners who report insufficient funds and did not invest their own money appear to be less likely to have had hazard insurance, although the difference between the groups has a large enough standard error that the difference is not statistically significant. Multinomial logit regressions that include the property and owner characteristics again reinforce the basic comparisons shown in exhibit 5-21.
Taken as a whole, the descriptive analyses do not offer a clear characterization of either group. Exhibits 5-18 and 5-19 suggest that rebuilding rates are lower for two groups: homeowners who applied for but did not receive CDBG funds, and homeowners who reported insufficient funds but did not invest their own money in rebuilding the property (or had no money to invest). In each case, the most striking characteristic of the homeowners in the group is a high frequency of homeowners who no longer own the property. This may represent an undesired outcome for some of these homeowners—deciding to sell in response to not being able to afford the costs of rebuilding. However, the absence of rebuilding may also reflect a purposeful decision by some homeowners to relocate and sell the property.
Ideally, we might be able to supplement the above analyses with a direct investigation of whether the presence and magnitude of a funding gap reduces the likelihood of rebuilding. Unfortunately, the sample size is too small to support this type of analysis for the set of interviewed owners. The nature of the owner survey also presents an obstacle, as respondents’ self-reported measures of rebuilding and funding gaps would likely suffer from endogeneity issues. The alternative approach is to rely on the state administrative CDBG data for the subset of CDBG recipients.

80Chapter 5: Funding for Rebuilding and CDBG Programs
Exhibit 5-21. Property and Owner Characteristics by Funding Sufficiency and Use of Personal Funds, Homeowners Only
Insufficient Funds and No Personal Funds Put
into Rebuilding
Insufficient Funds and Personal Funds Put
into RebuildingSufficient Funds
Property Attributes
Presence of hazard insurance
49.2% 60.2% 59.9%
Presence of flood insurance
30.6% 29.3% 29.7%
Flood damage only 17.5% 10.6% 15.1%
Wind damage only 8.6%** 15.5% 19.7%
Flood and wind damage 73.9% 73.8%+ 65.2%
Change in owner since 2005
40.8%** 7.2% 12.7%
Property received FEMA grant
23.4% 19.0% 25.6%
Property received SBA loan
17.5% 18.7% 16.7%
Property received elevation grant
0.7% 7.3%+ 3.2%
Owner Demographics
Income < $30,000 44.1% 22.4%* 35.7%
Income $30,000–$59,999 28.3% 41.3%* 26.4%
Income $60,000–$89,999 12.9% 20.3% 18.8%
Income $90,000+ 14.7% 16.0% 19.1%
Age of property owner 58.3 60.3 59.8
Number of household members 2.7 2.6 2.7
Presence of dependent minor 28.9% 25.5% 29.6%
White alone 42.9%* 51.1%+ 60.6%
Black or African American alone
48.8%* 38.7% 31.4%
Other/multiple races 8.1% 9.6% 8.0%
Number of survey responses 179 181 177
CDBG = Community Development Block Grant. FEMA = Federal Emergency Management Agency. SBA = Small Business Administration.
**p < 0.01; *p < 0.05; +p < 0.10.
Note: Weighted population estimates based on 537 responses.
Sources: 2011 Property Owner Survey; CDBG administrative data

81Chapter 5: Funding for Rebuilding and CDBG Programs
Resource Restrictions and RebuildingThe next component of the analysis of CDBG funding therefore uses the state CDBG administrative data to examine the impact of funding gaps on rebuilding activity among the set of CDBG recipients. Using the administrative data has two major advantages.
First, the measures of award amounts for CDBG and other sources of assistance come directly from the information used to calculate the CDBG award, so they are likely to be reliable. Second, the administrative data are available for the full windshield survey sample, providing far greater sample size and statistical power. The limitation is that this sample and measures do not directly correspond to the other analyses in this report. In particular, the measure of rebuilding is the measure used for the windshield survey sample in the Phase I report—defined in section 3.4. Another limitation is that these data do not permit comparison of grantees with other owners who did not receive (or did not apply for) CDBG funding.
The analysis of the CDBG administrative data directly examines the relationship between funding gaps and rebuilding. Using the program’s recorded damage estimate, we define a funding gap as the difference between the damage estimate recorded in the CDBG administrative data and the total amount of assistance received from insurance, FEMA, CDBG program, and other sources of assistance as recorded in the CDBG administrative data (other sources of assistance is available for Mississippi only). The analysis examines whether a gap is present and, if so, the amount of the gap.
To isolate the sample of homeowners who intended to rebuild their properties, the sample excludes CDBG recipients who chose Options 2 and 3 in Louisiana’s The Road Home program and the Sold Home option in Mississippi. The remaining analysis sample contains 1,104 homeowners who received CDBG grants through Option 1 in Louisiana and Phases I and II in Mississippi. Of this sample, 39 percent of homeowners have a positive gap (insufficient funds) between their
damage estimate and the total amount of assistance recorded. The mean gap amount for these homeowners is $57,479.
The association between funding gaps and rebuilding activity for this sample therefore reflects the decisions of homeowners who received grants contingent on rebuilding the damaged property. Exhibit 5-22 shows the association between funding gaps and whether the property still exhibited substantial damage in early 2010—that is, it was not yet substantially rebuilt at the time of the windshield observations—using three different regression specifications (Models 1, 2, and 3). For each specification, the exhibit presents the odds ratio and significance level produced by the logistic regression. The odds ratio measures the relative change in the likelihood of the outcome that is associated with a one unit change in the independent variable. An odds ratio of 1 indicates that no association exists, and odds ratios significantly greater than 1 indicate that an increase in the measure (for example, in the presence of a funding gap) is associated with a higher likelihood that the outcome (for example, a property with substantial repair needs in 2010) is observed. Because the models use logistic estimation techniques, the odds ratio is reported with a z-statistic that is used to determine the level of statistical significance for each estimate.51
In exhibit 5-22, the funding gap variable is defined as a binary measure—whether a gap exists or does not exist. The bivariate regression (Model 1) shows a clear association. Homeowners with any funding gap are more than 2.4 times as likely to still have substantial damage showing on their properties in the windshield survey. This relationship is diminished when the models adjust for the extent of damage and presence of insurance. Model 2 adds covariates that reflect the level of damage recorded by FEMA, an indication of the initial level of damage to the property. It also includes
51 The z-statistic is analogous to the t-statistic in least squares regression. It reflects the ratio of the coefficient estimate to the standard error, providing a measure of how confidently the estimate can be distinguished from the null hypothesis of no effect. A larger z-statistic implies a higher level of confidence.

82Chapter 5: Funding for Rebuilding and CDBG Programs
block-level fixed effects to control for any unobserved factors that may be common to properties on the same block. In this model, the presence of a gap is associated with a property being 54 percent more likely to show substantial damage. Model 3 shows that this effect is further moderated by whether the homeowner had
insurance. Not having insurance greatly increases the likelihood that substantial damage is observed (that is, properties without insurance are less likely to have been rebuilt). Controlling for the presence of insurance reduces the effect of a funding gap (which is no longer a statistically significant factor).
Exhibit 5-22. Association of Presence of Funding Gap with Property Having Substantial Damage in 2010, Based on Windshield Observation (Logit Estimation)
Model 1: Gap OnlyModel 2: Gap, Plus
Extent of Damage and Geographic Factors
Model 3: Gap, Extent of Damage, Presence of
Insurance, and Geographic Factors
Odds Ratio (z-statistic) Odds Ratio (z-statistic) Odds Ratio (z-statistic)
Funding gap exists 2.423** (5.27)
1.540* (1.96)
1.194 (0.86)
FEMA damage assessment: minor or no damage
N/A 0.158** (3.58)
0.127** (4.10)
FEMA damage assessment: major or severe damage
N/A 0.262** (4.17)
0.240** (4.32)
No insurance at time of hurricanes
N/A N/A 3.883** (4.87)
Block fixed effects No Yes Yes
FEMA = Federal Emergency Management Agency. N = 1,104 properties. **p < 0.01; *p < 0.05; +p < 0.10.
Sources: 2010 windshield observations; CDBG administrative data
Exhibit 5-23 repeats this analysis with the funding gap variable defined as the size (dollar amount) of the gap rather than just whether a gap is present. Again, the bivariate regression (Model 1) shows a clear relationship. A $10,000 increase in the amount of a funding gap is associated with a property being 7.5 percent more likely to show substantial damage (odds ratio is 1.075). This effect is reduced to 3.6 percent in the model that controls for the level of initial damage and block fixed effects (Model 2). Adding a covariate that reflects whether the homeowner had insurance further reduces the effect so that it is no longer statistically significant (Model 3). Lack of insurance is again a very powerful factor.
The main finding from both models is that the presence of a funding gap is correlated with the extent of damage (levels of FEMA assessment), but that this relationship largely reflects the reduced rebuilding activity among homeowners who did not previously have insurance. For such homeowners, reduced rebuilding may reflect the lack of funding following the hurricanes. However, it may also reflect unobserved attributes of homeowners willing to go without insurance, such as a higher tolerance for risk or a lower ability to afford regular insurance premiums. In either case, the effects shown in exhibits 5-22 and 5-23 suggest that homeowners with funding gaps may have been less likely to rebuild, particularly if they were uninsured.

83Chapter 5: Funding for Rebuilding and CDBG Programs
Exhibit 5-23. Association of Funding Gap Amount with Property Having Substantial Damage in 2010, Based on Windshield Observation (Logit Estimation)
Model 1: Gap OnlyModel 2: Gap, Plus
Extent of Damage and Geographic Factors
Model 3: Gap, Extent of Damage, Presence of
Insurance, and Geographic Factors
Odds Ratio (z-statistic) Odds Ratio (z-statistic) Odds Ratio (z-statistic)
Gap amount ($10,000s) 1.075** (4.18)
1.036+ (1.81)
1.024 (1.16)
FEMA damage assessment: minor or no damage
N/A 0.157** (3.57)
0.158** (4.04)
FEMA damage assessment: major or severe damage
N/A 0.262** (4.20)
0.262** (4.31)
No insurance at time of hurricanes
N/A N/A 3.946** (4.80)
Block fixed effects No Yes Yes
FEMA = Federal Emergency Management Agency. N = 1,104 properties. **p < 0.01; *p < 0.05; +p < 0.10.
Sources: 2010 windshield observations; CDBG administrative data
An extension of the analysis in the two preceding exhibits is to isolate the gaps in funding that result directly from CDBG program rules. Although the funding gaps among CDBG recipients arise for a variety of reasons, the calculation of CDBG grant amounts contains four specific gaps of policy interest:
1. The maximum CDBG grant amount is $150,000: 7.8 percent of sample homeowners—including owners in both Louisiana and Mississippi—had a funding gap because they hit the maximum CDBG funding amount.
2. The CDBG grant is capped at $120,000 if the homeowner qualifies for and claims the full elevation grant of $30,000: 4.8 percent of sample homeowners (all in Louisiana) hit the CDBG maximum grant amount of $120,000 because they also claimed an elevation grant of $30,000.
3. The CDBG grant amount is reduced to 70 percent of its full value for homeowners who do not have homeowners insurance: 5 percent of sample homeowners (all in Louisiana) are penalized 30 percent of the award amount for not carrying the
proper levels of insurance.
4. The grant amount is capped at $100,000 for homeowners in Mississippi’s Phase II program: 2.5 percent of sample homeowners (all in Mississippi) receive the maximum Mississippi Phase II grant amount of $100,000.
Exhibit 5-24 examines the relationship between gaps due to each of these CDBG program rules and the level of rebuilding. Exhibit 5-24 defines the grant cap variable as a binary measure—whether the grant is capped or is not capped. Each of the models includes covariates that reflect the level of hurricane damage (FEMA damage categories) and block fixed effects (that is, the models are analogous to Model 2 in exhibits 5-19 and 5-20). Model 1 in exhibit 5-24 shows that properties that encountered any one of these four grant caps were 54 percent more likely to still have substantial damage by 2010. Model 2 separates this variable into the specific grant caps and suggests that this effect is concentrated almost entirely among the homeowners who received the maximum Phase II award in Mississippi. These properties were 3.1 times more likely to have substantial damage than

84Chapter 5: Funding for Rebuilding and CDBG Programs
other properties. The magnitude of the odds ratio for variables receiving a 30 percent penalty in Louisiana is also large, but the effect is not significant. Model 3 shows that both effects are moderated by whether the homeowner had insurance.52
The patterns shown in exhibit 5-24 echo the findings from exhibits 5-22 and 5-23. The presence of a
52 We also conducted this analysis defining the grant cap as the amount of the funding gap resulting from the gap. The results were consistent with those pre-sented in exhibit 5-21.
funding gap is positively associated with reduced rebuilding, but primarily among homeowners who did not have insurance. In the case of the grant caps, the rules governing the award amounts were structured to penalize homeowners who did not carry adequate property insurance. The findings presented in this section suggest that these rules carry implications for the eventual levels of rebuilding.
Exhibit 5-24. Association of Presence of a Funding Cap with Property Having Substantial Damage in 2010, Based on Windshield Observation (Logit Estimation)
Model 1: Presence of Cap Only
Model 2: Specific Program Caps
Model 3: Specific Program Caps
Odds Ratio (z-statistic) Odds Ratio (z-statistic) Odds Ratio (z-statistic)
Any cap 1.54* (1.96) N/A N/A
Cap: $100,000 (Mississippi Phase II)
N/A 3.1 (2.31) 1.355 (0.57)
Penalty: 70% award (Louisiana)
N/A 2.047 (1.38) 0.761 (0.55)
Cap: $120,000 (Louisiana)
N/A 1.306 (0.56) 0.902 (0.22)
Cap: $150,000 (Louisiana and Mississippi)
N/A 1.045 (0.12) 0.91 (0.24)
FEMA damage assessment: minor or no damage
0.158 (3.58) 0.155 (3.69) 0.123 (4.16)
FEMA damage assessment: major or severe damage
0.262 (4.17) 0.272 (4.01) 0.238 (4.29)
No insurance at time of hurricanes
N/A 4.235 (4.97)
Block fixed effects Yes Yes Yes
FEMA = Federal Emergency Management Agency. N = 1,104 properties. **p < 0.01; *p < 0.05; +p < 0.10.
Sources: 2010 windshield observations; Community Development Block Grant administrative data
When interpreting this finding, it is useful to keep in mind the overall level of rebuilding. More than 70 percent of homeowners who reported a funding gap did not show substantial damage by the windshield survey’s definition—compared with 86 percent of homeowners without a funding gap. This figure drops to only 60 percent for homeowners who both have a funding gap
and did not have insurance. As a result, the rebuilding patterns documented in this section apply to the relative differences in rebuilding rates between these groups.
In sum, differences in the likelihood of rebuilding do exist, with moving (selling the property) and funding gaps predicting lower levels of rebuilding.

85Chapter 5: Funding for Rebuilding and CDBG Programs
5.6 OWNER EXPERIENCES WITH THE DIFFERENT PROGRAM MODELSLouisiana and MississippiThe owner survey asked recipients of CDBG funds in Louisiana and Mississippi whether they experienced any problems with the programs that delayed their rebuilding efforts and (if so) what those problems were. The sample size was too small in Mississippi to use the survey data. In Louisiana, however, 186 people reported receiving a CDBG award and answered this question about their experience, permitting some analysis. (We did not weight these data to create population estimates because the sample size is so small.) Of these respondents, 129 (69 percent) said they had not experienced any problems with the program, but 57 (31 percent) said they had experienced one or more problems. The most common problems reported were delays in getting the application accepted (24 people), problems reaching program staff (19 people), delays in receiving program funds (14 people), problems determining what paperwork to bring in
(13 people), and delays in completing the damage assessment for the property (11 people).
TexasIn the Texas CDBG program, state contractors built or rebuilt the homes of CDBG recipients. The property owner survey offered an opportunity to assess recipients’ experiences with the state-managed rebuilding program. Of the 83 survey respondents in Texas, only 31 reported having a new home built through a state or local program, so the findings reported here should be treated as exploratory only. However, the survey findings suggest a moderate level of satisfaction with the Texas CDBG program among recipients. As shown in exhibit 5-25, 58 percent of survey respondents were very satisfied overall with the program and another 19 percent were somewhat satisfied. Less than one-half of the survey respondents (45 percent) reported being very satisfied with the quality of the construction work, although less than one in five reported being dissatisfied. Most respondents (77 percent) were satisfied with the length of time that it took to complete construction.
Exhibit 5-25. Reported Satisfaction with the CDBG Program in Texas Among CDBG Recipients
Number Percent
Satisfaction with the Program Overall
Very satisfied 18 58
Somewhat satisfied 6 19
Somewhat dissatisfied 4 13
Very dissatisfied 3 10
Total 31 100
Satisfaction with the Quality of the Construction Work
Very satisfied 14 45
Somewhat satisfied 11 35
Somewhat dissatisfied 1 3
Very dissatisfied 5 16
Total 31 100
Satisfaction with Length of Time from Application to Construction Completion
Satisfied 24 77
Not satisfied 7 23
Total 31 100
CDBG = Community Development Block Grant.
Sources: 2011 Property Owner Survey; unweighted survey data

86Chapter 5: Funding for Rebuilding and CDBG Programs
Time Taken to Complete Rebuilding Under the Compensation and Rehabilitation ModelsOne important consideration in comparing the compensation and rehabilitation models of CDBG assistance is the length of time that it takes to complete rebuilding. We might hypothesize that the compensation model of Louisiana and Mississippi CDBG programs, in which owners receive a lump sum to pay for rebuilding they arrange themselves, would allow rebuilding to occur more quickly than under the rehabilitation model in effect in Texas, in which state contractors do the work and environmental and other reviews are needed to comply with federal and state regulations. However, we might further hypothesize that fewer recipients under the compensation model would actually complete rebuilding, because of the level of effort required on the part of the owner, the greater potential for contractor fraud, and the opportunity to use the funds to address other needs. The survey findings shed light on both hypotheses.
Neither the CDBG administrative data nor the owner survey provides information on when owners received their CDBG grants. However, the survey asked owners for the month and year in which they began rebuilding
activities and (as applicable) the month and year in which the repairs were completed. This enables us to calculate the number of months spent on rebuilding among CDBG recipients in each state. Exhibit 5-26 presents the results of this analysis.
The survey data suggest that rebuilding from the start of repair activity to completion took longer in Louisiana and Mississippi under the compensation model than in Texas under the rehabilitation model. On average, recipients of CDBG funds under the compensation models in Louisiana and Mississippi took 13.9 and 10 months, respectively, to rebuild compared with 8.1 months under the Texas rehabilitation model. The average rebuilding time for Louisiana recipients is significantly longer than the average rebuilding time for Texas recipients. The average rebuilding time for Mississippi recipients is also longer than for Texas recipients but the difference is not statistically significant. This difference between the combined compensation models and the rehabilitation model is statistically significant. Yet the difference in program model alone does not necessarily explain this difference.
Exhibit 5-26. Months to Complete Repair and Rebuilding Activities (from Repair Start to Completion) by State
Louisiana Mississippi Texas
Estimate 90% CI Estimate 90% CI Estimate 90% CI
25th percentile 4.9 3.2–6.7 3.0 2.1–3.8 1.0 0.0–2.2
Median 9.6 7.4–11.8 5.8 4.2–7.5 4.4 1.8–6.9
Mean 13.9 11.3–16.4 10.0 7.1–12.9 8.1 4.6–11.6
75th percentile 16.9 13.1–20.6 11.4 5.8–17.0 9.3 4.9–13.6
CDBG = Community Development Block Grant. CI = 90 percent confidence interval.
Notes: Weighted population estimates based on 152 survey responses by CDBG recipients who completed rebuilding. Excludes eight owners who reported starting and completing repairs on the same month.
Sources: 2011 Property Owner Survey

87Chapter 5: Funding for Rebuilding and CDBG Programs
This analysis, for example, only compares actual construction times—that is, from repair start to completion—as opposed to other measures of time for rebuilding. Equally valid comparisons could be made from either the time of the 2005 storms to the point of rebuilding (probably the measure of greatest interest to the owners themselves) or from the time of program start to the point of rebuilding (of concern to national policymakers looking at administrative implementation). In fact, the average time to complete rebuilding in Texas from the time of the 2005 storm events is substantially longer than those of Louisiana and Mississippi from the same time.53 This finding stands in contrast to the lower average time for rebuilding in Texas than the other two states when just considering construction. It also demonstrates differences in timing for appropriations and program implementation for each state. Louisiana administrators, for example, had the highest program allocation and the highest number of recipient owners. The involvement of regional governments in Texas early on delayed the acceptance of first applications there. In
53 Hurricanes Katrina and Rita made landfall on August 29 and September 23, 2005, respectively. Assuming a post-storm start date of September 1, 2005 for Louisiana and Mississippi and a post-storm start date of October 1, 2005 for Texas, as recommended by HUD, the average (mean) time to rebuild was 23.8 months in Louisiana, 13.5 months in Mississippi, and 39.8 months in Texas. The time to rebuild was significantly shorter in Louisiana compared with Texas, but significantly longer in Louisiana compared with Mississippi. Correspondingly, the time to rebuild in Mississippi was significantly shorter than in Texas. These differences are statistically significant at the 1 percent level.
all states, the timing of federal allocations also partially determined the individual program start dates.
The rebuilding rates for CDBG recipients across the three states provide additional insight into the respective models’ outcomes. Exhibit 5-27 shows the percent of CDBG recipients in each state reporting that rebuilding was complete. In Texas, 89.4 percent of CDBG recipients reported that rebuilding was complete as of early 2011, compared to 69.0 percent in Louisiana and 64.2 percent in Mississippi. The differences between Louisiana and Texas, and the difference between Mississippi and Texas, are both statistically significant. While the rate of completion is higher in Texas, where the rehabilitation model was in effect, it is also true that the Texas program operated on a much smaller scale than the programs in Louisiana and Mississippi. As chapter 1 described, only about 2,300 Texas homeowners received CDBG awards for damage from the 2005 hurricanes, compared with 28,000 in Mississippi and 128,000 in Louisiana. The different types and scale of damage across the three states—particularly the virtual absence of flood damage in Texas—also makes comparison difficult. Yet, it is possible that the concentration of accredited contractors in Texas, level of contract management by the program, as well as the lower severity of damage among Texas CDBG recipients’ properties all contributed to this more timely construction schedule.
Exhibit 5-27. Percent of CDBG Recipients Completing Repairs by State
Louisiana Mississippi Texas
Estimate 90% CI Estimate 90% CI Estimate 90% CI
Percent of recipients who completed rebuilding
69.0 62.7–75.1 64.2 54.1–74.2 89.4 80.7–98.0
CDBG = Community Development Block Grant. CI = 90 percent confidence interval.
Note: Weighted estimates based on 257 survey responses.
Sources: 2011 Property Owner Survey; CDBG administrative data

88Chapter 5: Funding for Rebuilding and CDBG Programs
5.7 SUMMARY OF CHAPTER FINDINGSThis chapter presented analyses related to CDBG receipt and rebuilding and explored differences across the three states and program designs. The information on CDBG receipt and grant amounts presented in this report came from the property-level administrative data obtained from the state CDBG programs in March 2010, although we use owner-reported information on the uses of CDBG grants. Due to the very small number of recipients of CDBG small rental grants in the sample, the analysis focused on homeowners and the CDBG homeowner programs.
Across all three states, slightly more than one-half of the homeowners in the owner survey sample received CDBG homeowner assistance. In Texas, receipt of CDBG assistance meant that the state had conducted repair and rebuilding activities on the owners’ behalf. In Louisiana and Mississippi, receipt of CDBG assistance took the form of financial assistance provided primarily for rebuilding activities to be undertaken by owners themselves. In Louisiana, owners could decide to sell their property to the state, rather than rebuilding it, and receive financial compensation. Slightly more than 10 percent of the owners in the Louisiana survey sample (and about 8 percent of the owners statewide) selected The Road Home Options 2 or 3, and sold their properties to the state. The rest received CDBG grants designed to help them stay in their homes and rebuild. Mississippi grant recipients had options to sell as well, but were also given more latitude with regard to rebuilding requirements.
Many of the property and owner characteristics of CDBG recipients, notably, followed the grant program’s original intent. The subsequent use of the funds, however, varied across the programs. Among CDBG recipients in Louisiana and Mississippi who received CDBG rebuilding grants (that is, excluding Option 2 and 3 recipients in Louisiana), most owners reported using all or part of their grants for rebuilding.
In Louisiana, 87 percent of CDBG recipients reported using the entire grant for rebuilding, 7 percent reported using part of the grant for rebuilding, and 6 percent reported using none of the grant for rebuilding. In Mississippi, a significantly higher share of recipients used their grants for something other than rebuilding, including 20 percent who said they used only part of their grant for rebuilding and 16 percent who said they spent none of their grant funds for rebuilding. Analysis of reported uses of funds among the minority of CDBG recipients who used their grant funds for something other than rebuilding shows that the most common use of funds was to purchase furniture, followed by paying for everyday expenses, and paying off a mortgage or loan.
Survey respondents were asked to estimate the amount of funding received for the purpose of repairing or rebuilding their hurricane-damaged properties from a variety of sources, including homeowners insurance, flood insurance, elevation grants, FEMA’s individual assistance program, SBA loans, state programs, churches or charities, and friends and family, as well as the CDBG disaster assistance programs. Taking into account all of these sources plus the CDBG grant, CDBG recipients reported receiving about $50,000 more in financial assistance than owners who did not receive CDBG.
CDBG recipients in Louisiana and Mississippi generally reported receiving other sources of funding in addition to CDBG; this was less often the case among CDBG recipients in Texas. In general, the survey findings suggest that CDBG recipients were similar to nonrecipients in drawing on a range of funding sources to meet their rebuilding needs, although they received less assistance from these other (non-CDBG) sources. This is consistent with the design of the program, which was intended to make up the shortfall between rebuilding costs and the funding available to owners from other sources.
Despite the general differences in funding amounts, more than one-third of both CDBG recipients and

89Chapter 5: Funding for Rebuilding and CDBG Programs
non-CDBG recipients said their funding was not sufficient to meet their needs. As a consequence, a slight majority of owners in both groups reported supplementing their financial assistance with personal funds (usually from personal bank accounts) to rebuild.
The analysis also provided evidence that the rates of rebuilding varied by homeowners’ access to funding and the presence and size of funding gaps. Specifically, when analyzing the rates of rebuilding across owners with various types and quantities of funding, we identified two groups of owners with particular rebuilding lags: (1) people who applied for CDBG assistance but did not receive it and (2) people who reported that they did not receive sufficient resources to rebuild and were not able to (or chose not to) use personal resources to supplement the assistance received.
Among homeowners who applied for CDBG assistance but did not receive funds, only 58 percent of properties were rebuilt, compared with more than 75 percent of other homeowners who either did not apply at all or who applied and received funds. In a similar pattern, only 46 percent of properties were rebuilt among households who reported having insufficient funding and who did not use their own funds. For both groups, the rate of moving away from the property was also significantly higher. Additional analysis demonstrates that the presence of a funding gap (for example, by reaching the grant caps for the various CDBG programs) is correlated with the continued presence of observable damage in early 2010, although this relationship largely reflects the lower level of rebuilding activity among homeowners who did not have property insurance at the time of the hurricanes.
Finally, the chapter included two findings related to owner experiences with the different CDBG program models. First, most survey respondents in both Louisiana and Texas reported satisfaction with the CDBG programs in their states, although the measures were different for the two states. Second, Texas CDBG recipients, under the rehabilitation model, reported
faster rebuilding in terms of construction time than recipients in Louisiana and Mississippi. Texas CDBG recipients were also more likely to complete rebuilding activities than CDBG recipients in the other two states, although actual implementation of grant programs and issuing of grants varied significantly between the states. These differences paint a different picture with regard to overall rebuilding efforts, starting with the time of the storms.

Appendix A: State CDBG Program Descriptions 90
APPENDIX A. STATE CDBG PROGRAM DESCRIPTIONS
LOUISIANAIn Louisiana, the CDBG-funded disaster recovery program is known as The Road Home program, administered by the state’s Louisiana Recovery Authority and Office of Community Development’s Disaster Recovery Unit. The Road Home program provides compensation to homeowners and owners of small rental properties whose properties were damaged by Hurricanes Katrina and Rita and for whom the other sources of disaster assistance funding (private insurance, FEMA housing assistance, and SBA loans) did not cover the cost of repairing or rebuilding the property.
The Road Home Homeowner ProgramThe Road Home Homeowner Program provided financial compensation, an average of about $68,000, for roughly 128,000 Louisiana homeowners whose residences were damaged as a result of the 2005 storms.54 Applicants to The Road Home Homeowner Program were required to choose one of three options, which affected the calculation and amount of the compensation:
•Option 1: Remain in the home.
•Option 2: Sell to the state and purchase another home in the state.
•Option 3: Sell to the state and become a renter in Louisiana or move out of state.
The majority of Road Home recipients (92 percent, or 118,058 recipients as of July 14, 2011) chose Option 1.55 The maximum total compensation amount for all three options was $150,000. Homes sold to the
54 Figures based on CDBG administrative data, April 2011.
55 Based on state CDBG administrative data from April 2011. Of recipients of The Road Home homeowner funds, 92 percent selected Option 1, 6 percent selected Option 2, and 2 percent selected Option 3.
state under Options 2 (8,238 homes) and 3 (2,310 homes) were transferred to the Louisiana Land Trust (LLT), the holding agency for properties owned by the state of Louisiana. LLT has about 10,500 homes in its inventory.56
As a condition of accepting the grant, owners who chose Option 1 placed covenants on the property. The covenants require the property owner to use the house as a primary residence within 3 years from the date of closing, to maintain hazard insurance on the home (as well as flood insurance if the home is located in a flood plain), comply with base flood elevations adopted by local government, and conform with local building codes in conducting rebuilding or repair. Owners who do not meet these requirements within the 3-year period of the covenants can apply for up to two 1-year extensions. Grant recipients who do not meet the terms of the covenants may be required to repay the entire amount of the grant.
Three different types of assistance were available:
•The basic compensation grant was the primary tool used to assist homeowners. This grant was based on either the uncompensated damage cost (that is, the estimated cost of damage minus any other compensation the applicant received) or the uncompensated loss of value (that is, the pre-storm value minus any other compensation the applicant received).
•The additional compensation grant offered up to $50,000 to owners with incomes equal to or less than 80 percent of Area Median Income (AMI) and who chose to remain in their homes or sell their homes to the state.
56 Current Property Listing as of 5/13/11, downloaded from www.lalandtrust.us.

91Appendix A: State CDBG Program Descriptions
•Owners who opted to rebuild their homes and who were located in a floodplain based on FEMA’s Base Flood Elevation (BFE) or Advisory Base Flood Elevation (ABFE) were eligible to apply for an elevation incentive to elevate their homes to meet the BFE or ABFE standard. The award amount is $30,000 for site-built homes and $20,000 for manufactured homes.
The Road Home Small Rental Property ProgramThe Road Home Small Rental Property Program offered funding to encourage property owners in nine specific parishes to repair their one- to four-unit rental properties and make these dwellings available to low- and moderate-income tenants at affordable rents. Funding was offered in the form of a no-interest, no-payment, forgivable loan, provided either as up-front financing or reimbursement after repairs had been made and the property met local building codes. In return, the owner agreed to maintain affordable rent levels for 10 years. The amount of funding available varied based on the income level of the tenants to be served, with the largest amount of funding available to owners who agreed to offer the lowest rents. The total loan amount could not exceed 100 percent of the estimated cost to repair or reconstruct the rental property.
As of April 2011, about 4,700 awards had been made to rental property owners, in an average amount of about $102,000.57
MISSISSIPPIMississippi’s CDBG-funded programs for homeowners and small landlords are administered by the Mississippi Development Authority (MDA). The program for homeowners is the Homeowner Assistance Program (HAP). The program for owners of one- to four-unit rental properties is the Small Rental Property Assistance Program. Eligibility for both programs required the property to be located in one of four Mississippi counties (Hancock, Harrison, Jackson, or Pearl River) and to have suffered flood damage as a result of Hurricane Katrina.58
57 The Road Home Small Rental Property Program Incentive Operations Status Report April 25, 2011. Based on commitment letters and amount committed and obligated to applicants active in the Constructive Management Initiative Option.
58 Properties that sustained only wind damage from the hurricane (no flood dam-age) were not eligible for assistance under either phase.
Homeowner Assistance Program HAP provided financial compensation for Mississippi homeowners whose residences were damaged as a result of Hurricane Katrina. As in Louisiana, the program provided one-time grant payments to homeowners. The maximum grant amount was $150,000 for Phase 1, $100,000 for Phase 2, and either 50 or 70 percent of the Phase 1 or Phase 2 grant for Phase 3. In Mississippi, almost 28,000 homeowner awards were made, with an average award amount of about $72,500.59
Phase 1 and Phase 2 HAP recipients agreed to place covenants on the storm-damaged property to ensure that any rebuilding or repairs would be made in accordance with local codes, that the home would be elevated in accordance with FEMA advisory flood elevations, and that the homeowner and successors in title would obtain and maintain both homeowners insurance and flood insurance on the property, whether or not the property was located in a flood plain.
Elevation grants in an amount up to $30,000 were also available to homeowners to defray the cost of elevating homes to FEMA’s flood requirements. Elevation grant funds could be used to raise homes on the same footprint or on expanded or changed footprints, or to replace an existing unit with an elevated one. Elevation grant funds could be combined with Phase 1 or Phase 2 HAP grants, but could only be used to cover the increased cost of elevating the structure.
To be eligible for HAP funds, the applicant had to have owned and occupied the property at the time of the storm. The two phases targeted different owner groups, however. Phase 1 targeted homeowners living outside the established flood zones who had homeowners insurance at the time of the storm. Phase 2 was designed to assist homeowners not eligible under Phase 1. Phase 2 applicants were not required to have carried homeowners insurance, and their homes could have been located inside or outside the 100-year flood plain.60 Eligibility was also limited to owners with incomes equal to or less than 120 percent of AMI.
59 CDBG administrative data, April 2011.
60 The 100-year flood plain is the area that would be expected to be inundated only in very extreme floods (happening approximately once every 100 years, or with a probability of 1 percent in any year).

92Appendix A: State CDBG Program Descriptions
Phase 3 of the HAP, also known as the Sold Home program, was designed for Phase 1 and Phase 2 grant applicants who no longer own their damaged residence, have an uncompensated loss, and who have not been able to attach the required covenants to the damaged residence property. Originally, MDA had allowed applicants who sold their homes to receive grant funds if a covenant was attached to the damaged residence by the new owners of that property. But many Phase 1 and Phase 2 applicants indicated that the new homeowners were unwilling to sign the covenants. MDA created the Sold Home program to enable these applicants to qualify for grant money, independent of the cooperation of the new owner(s) of their damaged former residence.
Most awards made under the homeowner program were made under Phase 1 (67 percent, more than 18,500 recipients) and Phase 2 (31 percent, more than 8,600 recipients).61
Small Rental Assistance ProgramThe Small Rental Assistance Program targeted owners of small rental properties with a goal of renovating and restoring small rental properties in storm-damaged neighborhoods. The program provided 5-year forgivable loans under one of four program options:
•Option A: Rental subsidy
•Option B: Rehabilitation or construction of Hurricane Katrina damage
•Option C: Reconstruction or conversion of non-Hurricane Katrina damage property
•Option D: New construction reimbursement
The maximum award was $30,000 for a four-bedroom rental unit, meaning that the maximum award that any one property could receive was $120,000 (for a four-unit property in which all units had four bedrooms). Recipients agreed to attach a covenant to the property for 5 years that includes compliance with local and state building code requirements, maintenance of hazard, flood,
61 Based on analysis of state CDBG administrative data from March 2010.
and commercial liability insurance, and an agreement to rent 51 percent or more of the available units to tenants with an income equal to or less than 80 percent of the AMI, with 100 percent of units being rented to tenants with incomes equal to or less than 120 percent of AMI.
In order to be eligible for Small Rental Assistance awards, properties had to pass a site inspection and environmental review at MDA’s expense. Applicants also had to have a good credit history and a satisfactory owner-manager experience surrounding the property. Applicants did not have to own the property at the time of Hurricane Katrina, and individuals, corporations, partnerships, trusts, churches, and nonprofit organizations were eligible to apply.
As of April 2011, about $227 million had been awarded for about 3,900 units, in an average amount of about $58,000 per unit.62
TEXASThe state of Texas received two rounds of CDBG disaster recovery funding to address damage caused by Hurricane Rita.63 The Texas Department of Housing and Community Affairs (TDHCA) used this funding for three separate homeowner programs: the Council of Government (COG) Programs, the Homeowner Assistance Program (HAP), and the Sabine Pass Restoration Program. Texas did not create a program specific to owners of small-scale rental properties. A total of about 2,270 awards had been made under all three programs as of April 2011.64
Council of Government ProgramsTDHCA allocated $40 million in supplemental CDBG funds to homeowner assistance programs administered by three COGs: Deep East Texas COG, Houston-Galveston Area COG, and the Southeast
62 CDBG administrative data, May 2, 2011. Note that amounts for Mississippi are per unit, not per property owner, so average amounts between the two states are not comparable.
63 In 2008, Texas also received $3.1 billion in supplemental CDBG funding to address damage caused by Hurricanes Ike and Dolly. The use of those funds for housing recovery is outside the scope of this study.
64 CDBG administrative data, March 2010 and April 2011.

93Appendix A: State CDBG Program Descriptions
Texas Regional Planning Commission COG. Together, these COGs assisted approximately 350 homeowners to repair or replace their homes damaged by Hurricane Rita.
In the COG programs, as in the other Texas programs, CDBG funds are used to pay for contractors to perform the rehab or reconstruction work. If the property is located in a flood zone, the owner assumes a zero-interest, 3-year forgivable loan for the amount of the funding. The three COGs vary in the amount of assistance provided:
•Deep East Texas offered up to $40,000 for rehabilitation and up to $65,000 for reconstruction and new construction.
•Houston-Galveston offered up to $25,000 for rehabilitation and up to $65,000 for reconstruction and new construction.
• Southeast Texas offered up to $65,000 for rehabilitation and up to $100,000 for reconstruction and new construction. The program also offered up to $35,000 for elevation of properties in certain flood zones and $5,000 per lot for demolition. Total assistance could not exceed $100,000.
Eligibility for the program was restricted to single-family homes that were located in certain specified counties and were damaged or destroyed by Hurricane Rita. Applicants also had to have incomes equal to or less than 80 percent of AMI and had to have owned and occupied the property at the time of the hurricane. Additional minor eligibility criteria varied by COG.
Homeowner Assistance Program HAP provided assistance in the form of a forgivable loan for properties located in special flood hazard areas; otherwise, the assistance took the form of a grant. The maximum award amount in HAP is $75,000 per property.65 The award is calculated based on the Storm Damage Cost Gap, which is the amount of storm damage (based on the cost of completed repairs or a damage
65 Interview with TDHCA staff, August 20, 2009.
assessment by FEMA, SBA, private insurance, or another approved damage assessor) minus any assistance received from FEMA grants, insurance proceeds, National Flood Insurance Program (NFIP) proceeds, or SBA loans. As with the COG program, HAP funds are disbursed directly to contractors selected by TDHCA at specified intervals in the construction process.
Only owners of single-family homes with income equal to or less than 80 percent of AMI were eligible to apply for HAP funds. In addition, the owner must have occupied the property as a primary residence at the time of Hurricane Rita. Finally, the property had to be located in 1 of the 22 counties eligible for FEMA assistance and must have sustained major or severe storm damage.
Sabine Pass Restoration ProgramThe Sabine Pass Restoration Program provided assistance to residents of the coastal community of Sabine Pass. The program offered three types of assistance, all in the form of a deferred forgivable loan:
•Up to $40,000 to assist with home rehabilitation and reconstruction.
•Up to $30,000 to help with the costs of elevating repaired or rebuilt homes.
•Up to $15,000 for accessibility-related costs associated with elevating the dwelling.
As with the HAP, funds were disbursed directly to contractors selected by TDHCA at specified intervals in the construction process.
To be eligible for the Sabine Pass Restoration program, homeowners had to have lived in Census Tract 4824501160 and have storm damage to their home caused by Hurricane Rita. The program was available to families who had insurance (but with an insufficient amount of coverage), as well as those who did not have homeowners insurance. Owners with incomes up to 150 percent of AMI were eligible to apply for rehabilitation and reconstruction assistance. Households of all income levels were eligible to apply for elevation assistance.

Appendix B: Overview of the Property Owner Survey 94
APPENDIX B. OVERVIEW OF THE PROPERTY OWNER SURVEY
The property owner survey questionnaire consisted of an introduction and 12 sections (Sections A-L). Multiple sections were needed to accommodate the different state CDBG programs and different rebuilding paths taken by owners. Most respondents
answered only 5-6 sections of the survey. Exhibit B-1 presents, for each section of the survey, the intended respondents for the section, the types of questions included in the section, and the reason for including the questions.
Exhibit B-1. Respondents, Content, and Reason for Inclusion by Survey Section and Subsection
Survey Section Subsection Respondents, Content, and Reason for Inclusion
Introduction N/A Respondents: All respondents.
Content:
•Description of survey purpose, length, and confidentiality.
• Invitation to participate in the interview and rescheduling if necessary.
•Screener questions to ensure that all respondents either owned a storm-damaged residential property in 2005 or purchased a storm-damaged property after 2005 as a rental property.
Reason: The screener questions are necessary to ensure that the respondent is the correct person of interest.
A: Baseline Property Characteristics and Condition
A1. Respondents: Owners (as of August 2005) of properties that sustained hurricane damage.
Content:
•Characteristics and condition of property and neighborhood pre-storm.
•Tenure (owner/renter) and occupancy pre-storm.
•Pre-storm market value, mortgage status, and insurance coverage.
Reason: To provide baseline information on the characteristics and value of the property prior to the 2005 hurricanes and distinguish between homeownership and rental properties.

95Appendix B: Overview of the Property Owner Survey
Survey Section Subsection Respondents, Content, and Reason for Inclusion
A: Baseline Property Characteristics and Condition(continued)
A2. Respondents: Owners who purchased the property after the 2005 hurricanes as rental properties.
Content:
•Characteristics, condition, and occupancy of property at time of purchase.
Reason: To provide information on the characteristics and value of the property at time of purchase as a baseline against which to compare its current characteristics.
B: Current Ownership of Property
N/A Respondents: All respondents.
Content:
•Current ownership of property.
• If no longer own, whether sold or lost to foreclosure.
Reason: To establish the current ownership of the property. Respondents who lost the property to foreclosure may be less likely to have rebuilt prior to losing the property.
C: Current Occupancy and Condition of the Property
N/A Respondents: Current owners only.
Content:
•Current characteristics and condition of property and neighborhood.
•Current tenure (owner/renter) and occupancy.
•Current neighborhood satisfaction and neighborhood safety.
Reason: To document current housing and neighborhood conditions among properties that sustained significant storm damage.
D: Housing Status of Homeowners Living Elsewhere
N/A Respondents: Respondents no longer living on the property.
Content:
•Current housing conditions and neighborhood satisfaction for relocated households.
• Interest in returning to pre-storm neighborhood and obstacles to returning.
Reason: To document housing and neighborhood conditions among households that relocated.

96Appendix B: Overview of the Property Owner Survey
Survey Section Subsection Respondents, Content, and Reason for Inclusion
E: Extent of Hurricane Damage
N/A Respondents: Owners as of August 2005.
Content:
•Level and type of storm damage.
Reason: To provide information on the level and type of storm damage necessary for analyzing whether owners received the resources they needed to rebuild and determining which owners may not have been eligible for CDBG assistance based on the type of damage their properties sustained.
F: Repair and Rebuilding Activities
F1. Respondents: Owners as of August 2005 who still own the property.
Content:
•Repair and rebuilding activities since hurricanes—nature and extent of the work and whether the work was completed.
•Barriers to rebuilding.
• Incidence of contractor fraud.
Reason: To provide information on the rebuilding status of the property and on obstacles to rebuilding and factors that affected the pace of rebuilding.
F2. Respondents: Owners as of August 2005 who no longer own the property.
Content:
•Same as F1.
Reason: Same as F1.
F3. Respondents: Owners who purchased the property after 2005 and still own it.
Content:
•Same as F1.
Reason: Same as F1.

97Appendix B: Overview of the Property Owner Survey
Survey Section Subsection Respondents, Content, and Reason for Inclusion
F: Repair and Rebuilding Activities(continued)
F4. Respondents: Owners who purchased the property after 2005 and no longer own it.
Content:
•Same as F1.
Reason: Same as F1.
G: Reasons for Not Rebuilding
G1. Respondents: Respondents who still own the property but have not done any rebuilding or repair work to date.
Content:
•Reasons for not rebuilding.
•Expectations for when rebuilding will start.
•Plans for property once rebuilding is complete.
Reason: To provide information on obstacles to rebuilding and on respondents’ intention for the property, which could affect their propensity to rebuild.
G2. Respondents: Respondents who no longer own the property and did not do any rebuilding or repair work while they owned it.
Content:
•Same as G1, except no questions on plans for property.
Reason: Same as G1.
H: Sources and Uses of Funds—Louisiana
H1. Respondents: Respondents who owned a storm-damaged property in Louisiana.
Content:
•Sources of funding received for rebuilding or as compensation for damage caused by hurricanes Katrina or Rita.
•Amounts of funding received.
•Gap between funding received and rebuilding/repair needs.
•Owner resources spent on rebuilding/repair.
Reason: To provide information on the amounts and types of funding received, including CDBG funds, and whether those funds were sufficient to cover the cost of repairs.

98Appendix B: Overview of the Property Owner Survey
Survey Section Subsection Respondents, Content, and Reason for Inclusion
H: Sources and Uses of Funds—Louisiana(continued)
H2. Respondents: Respondents who owned a storm-damaged property in Louisiana and indicated that they did not receive assistance through the CDBG-funded Road Home Homeowner Program or Road Home Small Rental Program.
Content:
•Whether respondent applied for funds.
•Reasons for denial of application or failure to follow-through on application.
Reason: To provide information on obstacles to accessing CDBG program funds and reasons for not applying.
H3. Respondents: Respondents who owned a storm-damaged property in Louisiana and indicated that they received assistance through the CDBG-funded Road Home Homeowner Program or Road Home Small Rental Program.
Content:
•Program option selected and reasons.
•Use of funds for housing repairs.
•Use of funds for other purposes.
Reason: To provide information on how Louisiana CDBG recipients used their grants—and how much was spent on housing needs—given that the program did not place restrictions on how people used the money.
H4. Respondents: Respondents who owned a storm-damaged property in Louisiana and indicated that they applied for or received assistance through the CDBG-funded Road Home Homeowner Program or Road Home Small Rental Program.
Content:
•Problems with applying for CDBG funds and other sources of financial assistance.
•Program problems that delayed rebuilding.
Reason: To provide information on problems with CDBG program delivery in Louisiana.

99Appendix B: Overview of the Property Owner Survey
Survey Section Subsection Respondents, Content, and Reason for Inclusion
I: Sources and Uses of Funds—Mississippi
I1. Respondents: Respondents who owned a storm-damaged property in Mississippi.
Content:
•Sources of funding received for rebuilding or as compensation for damage caused by hurricanes Katrina or Rita.
•Amounts of funding received.
•Gap between funding received and rebuilding/repair needs.
•Owner resources spent on rebuilding/repair.
Reason: To provide information on the amounts and types of funding received, including CDBG funds, and whether those funds were sufficient to cover the cost of repairs.
I2. Respondents: Respondents who owned a storm-damaged property in Mississippi and indicated that they did not receive assistance through the CDBG-funded MDA Homeowner Program or MS Small Rental Program.
Content:
•Whether respondent applied for funds.
•Reasons for denial of application or failure to follow-through on application.
Reason: To provide information on obstacles to accessing CDBG program funds and reasons for not applying.
I3. Respondents: Respondents who owned a storm-damaged property in Mississippi and indicated that they received assistance through the CDBG-funded MDA Homeowner Program or MS Small Rental Program.
Content:
•Program option selected and reasons.
•Use of funds for housing repairs.
•Use of funds for other purposes.
Reason: To provide information on how Mississippi CDBG recipients used their grants—and how much was spent on housing needs—given that the program did not place restrictions on how people used the money.

100Appendix B: Overview of the Property Owner Survey
Survey Section Subsection Respondents, Content, and Reason for Inclusion
I: Sources and Uses of Funds—Mississippi(continued)
I4. Respondents: Respondents who owned a storm-damaged property in Mississippi and indicated that they applied for or received assistance through the CDBG-funded MDA Homeowner Program or MS Small Rental Program.
Content:
•Problems with applying for CDBG funds and other sources of financial assistance.
•Program problems that delayed rebuilding.
Reason: To provide information on problems with CDBG program delivery in Mississippi.
J: Sources and Uses of Funds—Texas
J1. Respondents: Respondents who owned a storm-damaged property in Texas.
Content:
•Sources of funding received for rebuilding or as compensation for damage caused by Hurricane Rita.
•Amounts of funding received.
•Gap between funding received and rebuilding/repair needs.
•Owner resources spent on rebuilding/repair.
Reason: To provide information on the amounts and types of funding received, including CDBG rebuilding/repair assistance, and whether those funds/assistance were sufficient to cover the cost of repairs.
J2. Respondents: Respondents who owned a storm-damaged property in Texas and indicated that they did not receive assistance through the CDBG-funded TX Homeowner Assistance Program.
Content:
•Whether respondent applied for CDBG-funded assistance.
•Reasons for denial of application or failure to follow through on application.
Reason: To provide information on obstacles to accessing CDBG program assistance and reasons for not applying.

101Appendix B: Overview of the Property Owner Survey
Survey Section Subsection Respondents, Content, and Reason for Inclusion
J: Sources and Uses of Funds—Texas(continued)
J3. Respondents: Respondents who owned a storm-damaged property in Texas and indicated that they received assistance through the CDBG-funded TX Homeowner Assistance Program.
Content:
•Overall satisfaction with home repairs/rebuilding conducted by state.
•Satisfaction with design, size, and building materials.
•Satisfaction with workmanship.
Reason: To provide information on the level of satisfaction among Texas CDBG recipients with the work conducted on their behalf.
J4. Respondents: Respondents who owned a storm-damaged property in Texas and indicated that they applied for or received assistance through the CDBG-funded TX Homeowner Assistance Program.
Content:
•Problems with applying for CDBG funds and other sources of financial assistance.
•Program problems that delayed rebuilding.
Reason: To provide information on problems with CDBG program delivery in Texas.
K: Owner Demographics
N/A Respondents: All individual respondents. (Excludes representatives of corporate owners of rental properties.)
Content:
•Age, marital status, employment status, disability, income, financial hardship, household composition, race, ethnicity.
Reason: To provide information on the demographic characteristics of respondents that may affect their propensity to rebuild.
L: Closing N/A Respondents: All respondents.
Content:
•Confirmation of current mailing address and spelling of name.
Reason: To ensure that the respondent can receive the $25 in compensation for completing the interview.

Appendix C: Property Owner Survey Non-Response Bias Analysis and Adjustment 102
APPENDIX C. PROPERTY OWNER SURVEY NON-RESPONSE BIAS ANALYSIS AND ADJUSTMENT
This appendix describes our approach to creating sampling weights for the property owner survey. We begin with a brief discussion of the reasons for weighting, followed by discussions of computing base weights, assessing non-response bias, and computing non-response weights.
WHY WEIGHT?The need for sampling weights arises because observations are not a simple random sample from the population of interest; the sample was selected with known but unequal probabilities of selection. In this study, factors such as geography and extent of storm damage were used to stratify the sample of properties. Compensating for factors like this is relatively straightforward, and involves the construction of base weights.
Second, the desired information may not be obtained from all sampled units (non-response). In general, non-response reduces the precision of estimates using the survey data. But there is a more important problem if systematic differences between the respondents and non-respondents are present: estimates based only on the respondents may be biased. The size of the bias in an estimate depends on the non-response rate and the difference between the respondents and non-respondents in the characteristic of interest. A substantial literature shows that the non-response rate alone is a weak predictor of non-response bias (Groves, 2006). Nonetheless, when a low response rate is observed, it is incumbent on the researcher to determine whether non-response bias is present and, when possible, to make corrections. There are several methods of assessing the potential degree of non-response bias, and correcting for it involves the
construction of non-response adjustment factors to adjust the base weights—i.e., non-response weights. In the following sections we discuss base weights, assessing non-response bias, and non-response adjusted weights.
COMPUTING BASE WEIGHTSAs with the windshield observations, the sampling design for the property owner survey allows representative estimates to be calculated for states, counties, parishes, and jurisdictions through the creation of base weights at the block and property level. In general, the base weight of a sampled unit is the reciprocal of its probability of selection into the sample.
We used a two-stage sampling design to select the owner survey sample. In the first stage, we selected a random sample of significantly affected blocks (SABs) from Louisiana, Mississippi, and Texas. The second stage differed by state. In Louisiana and Mississippi, properties with major and severe damage were selected within the SABs such that there was a .5/.5 allocation between substantially rebuilt properties and properties with partial or no rebuilding within each geographic stratum. In Texas, very few properties in the windshield observation blocks received a CDBG grant, so an oversample was necessary to select 45 CDBG recipients, 45 non-CDBG recipients, and 30 rental properties in total. All properties selected in the Texas sample were assessed by FEMA as having major or severe damage, with the exception of 20 CDBG recipients. The original oversample of properties in Texas included only 25 CDBG recipients with major/severe damage. The set of 45 sampled CDBG recipients includes 20 CDBG recipients whose properties were classified by FEMA

103Appendix C: Property Owner Survey Non-Response Bias Analysis and Adjustment
as minor/no damage. These properties were included in the sample to get to the desired total of 45 CDBG recipients, and because representatives of the CDBG program in Texas told us that the FEMA designations were not accurate in Texas, and that properties that received CDBG assistance would have had major or severe damage confirmed via state assessment. We tested this assumption as part of the data analysis.
Because the property-level selection mechanism differs by state, a different weighting scheme was used for Louisiana and Mississippi than for Texas.
In all states, the block-level base weights can be defined as the inverse of the sampling probability:
Where h indexes the (geographical) stratum, nh is the number of (significantly affected) blocks drawn in stratum h, and N is the total number of (significantly affected) blocks in stratum h.
In Texas, property-level weights can be calculated as follows:
Where again h indexes geographical stratum,66 p indexes the property, and wh is the block-level weight corresponding to that property. Rhp is an indicator variable with three states: Rhp = 0 indicates a CDBG-recipient property classified by FEMA as having major or severe damage. Because all such properties were sampled, the property-level weight is equal to the block-level weight. Rhp = 1 indicates a CDBG-recipient
66 Note that, unlike Louisiana and Mississippi, Texas is considered a single geo-graphical stratum.
property classified by FEMA as having less than major damage. For these properties, the weight is calculated as the ratio of n1h (the number of CDBG-recipient properties with less than major damage that were sampled—because 45 total CDBG properties were sampled, n1h will be a number less than 45) and N1h (the total number of CDBG-recipient properties with less than major damage). Rhp = 2 indicates a rental-occupied property with major or severe damage that is not a CDBG recipient. For these properties, the weight is calculated as a function of the ratio of n2h (the number of non-CDBG renter-occupied properties with major or severe damage that were sampled—equal to 30 by design) and N2h (the total number of non-CDBG renter-occupied properties with major or severe damage). Rhp = 3 indicates an owner-occupied property with major or severe damage that is not a CDBG recipient. For these properties, the weight is calculated as a function of the ratio of n3h (the number of non-CDBG owner-occupied properties with major or severe damage that were sampled—equal to 45 by design) and N3h (the total number of non-CDBG owner-occupied properties with major or severe damage).
In Louisiana and Mississippi, property-level weights can be calculated as follows:
Where h indexes (geographical) stratum, p indexes the property, and wh is the block-level weight corresponding to that property. Dhp is an indicator variable for whether a property has been substantially rebuilt. N4h is the number of substantially rebuilt properties with major or severe damage sampled from stratum h, N4h is the total number of substantially rebuilt properties with major or severe damage in stratum h, n5h is the number of properties with major or severe damage and partial or no rebuilding sampled from stratum h, and N5h is the total number of properties with major or severe damage and partial or no rebuilding in stratum h.

104Appendix C: Property Owner Survey Non-Response Bias Analysis and Adjustment
ASSESSING NON-RESPONSE BIASThe first step in addressing non-response bias is to assess whether bias is present, and—if it is—to determine which characteristics of sample units appear to be correlated with the probability of response. Although the response rate to the owner survey was low, this alone is not a good predictor of whether there is non-response bias. Of course the only characteristics that can be used to assess non-response bias are those characteristics on which we have information for all sample members. Sources of explanatory variables available for sample units in the property owner survey include administrative data and the windshield observations. While certain administrative data are available for all 1,400 properties in the sample, windshield observation data are limited to a subsample of 1,285 properties. The non-response analysis includes both types of data.
Following is a list of characteristics available for all 1,400 properties:
1. Geographical stratum—17 values in total
2. Level of assessed hurricane damage in 2005—major or severe (FEMA assessment admin data)
3. Type of insurance—flood, hazard, both, or none (FEMA admin data)
4. Tenure of the property at time of hurricane—owner-occupied or renter-occupied (FEMA admin data)
5. Located in a flood plain—yes or no (FEMA admin data)
6. CDBG receipt (state level admin data)
7. Flood and/or wind damage (FEMA admin data)
8. Occupancy (USPS data)
9. Block-level demographic data (Census 2000)
10. For the subsample of 1,285 properties included in the windshield observations, additional variables are present:
11. Habitability of the property (windshield observations)
12. Condition of the property (windshield observations)
13. Observed and inferred rebuilding as of 2010 (windshield observations)
14. Occupancy (windshield observations)
For CDBG recipients in Louisiana and Mississippi, there is also information on:
15. Damage amount in dollars (state CDBG data)
16. CDBG award amount
Because certain data are available only for the windshield observation sample, we conducted non-response analyses for both the full sample of properties and for the windshield subsample. Based on a review of the non-response bias literature, we took the following approach:
1. First, we compared response rates across geographical strata (exhibit C-1). Response rates varied substantially by geography, from a low of 30 percent in Calcasieu and Cameron Parishes in Louisiana to a high of 70 percent in Texas. Statistical tests reveal that the distribution of response rates differs from what we would expect if the variation were simply random. This geographical variation in response rates is likely due to a combination of factors, including underlying demographic characteristics that vary by geography and also affect response rates (e.g., poverty).

105Appendix C: Property Owner Survey Non-Response Bias Analysis and Adjustment
Exhibit C-1. Comparison of Response Rates by Geographical County/Parish
Geographical AreaRespondents Non-Respondents Response Rate
N N %
Among All Properties Sampled for the Owner Survey (N = 1,400)
Louisiana 467 523 47
Calcasieu and Cameron Parishes
7 16 30
Jefferson Parish 60 58 51
Orleans Parish 301 305 50
St. Bernard Parish 68 94 42
St. Tammany Parish 11 24 31
Other LA Parishes 20 26 43
Mississippi 171 119 59
Hancock County 31 26 54
Harrison County 45 46 49
Jackson County 91 44 67
Other Mississippi Counties
4 3 57
Texas 84 36 70
Total (all states) 722 678 52
2. Second, we used administrative data on the full sample and windshield data on the subsample to compare key characteristics of respondents and non-respondents (Exhibit C-2). The property owner survey was designed to permit three types of comparisons: (1) CDBG recipients vs. non-recipients; (2) owners vs. renters; and (3) substantially rebuilt properties vs. partially rebuilt or not rebuilt properties. For that reason, it was especially important to see whether these characteristics appeared to be correlated with the probability of survey response. We also compared respondents and non-respondents in terms of the set of administrative and windshield
observation characteristics listed in exhibit C-2. Nine of these characteristics proved to be unconditionally correlated with non-response (that is, without taking into account any of the other characteristics), including all four administrative characteristics available for the full sample (CDBG receipt, owner occupancy, type of damage, and whether the property was substantially rebuilt). USPS occupancy status was significantly correlated with non-response; however, USPS data were not available for all properties in the windshield sample and therefore we could not include an occupancy variable in the logistic regression model of non-response.

106Appendix C: Property Owner Survey Non-Response Bias Analysis and Adjustment
Exhibit C-2. Comparison of Property Characteristics Between Respondents and Non-Respondents
Characteristic
Respondents Non-RespondentsDifference
Significant?
% of Respondents Having This
Characteristic
% of Non-Respon-dents Having This
CharacteristicP-Value
Among All Properties Sampled for the Owner Survey (N = 1,400)
Received CDBG assistance 50 39 Yes ( < 0.01)
Owner-occupied (vs. renter- occupied) at time of hurricane
75 63 Yes ( < 0.01)
Suffered flood damage 77 84 Yes ( < 0.01)
Substantially rebuilt 63 47 Yes ( < 0.01)
Among Properties Selected for Windshield Observation (N = 1,285)
Exhibits substantial repair needs 23 30 Yes ( < 0.01)
Overall Condition:
Excellent/good condition 57 43 Yes (< 0.01)
Fair condition 15 17
Poor condition 7 12
Totally destroyed 1 1
Structure is being built or undergoing complete renovation
1 1
Lot does not contain a permanent residential structure
19 26
Habitable 72 58 Yes (< 0.01)
Occupied (Windshield) 66 49 Yes (< 0.01)
Occupied (USPS) 74 56 Yes (< 0.01)
CDBG award amount (in dollars) 77,758 (mean) 77,226 (mean)
Damage amount (in dollars) 206,713 185,450

107Appendix C: Property Owner Survey Non-Response Bias Analysis and Adjustment
3. Third, using data from the administrative and windshield observations as well as Census block-group demographic data, we estimated a logistic regression model to determine which of these factors are significantly correlated with non-response. We conducted separate analyses for the full sample and the windshield observation subsample. The full-sample regression model was able to predict approximately 9.4 percent of the variation in response. The subsample regression model, which included the full set of windshield observation characteristics and Census block-group demographic characteristics, was able to explain approximately 11.3 percent of the variation. After controlling for geographic stratum and the four characteristics available for the full sample in the latter regression, none of the additional windshield-survey or demographic characteristics had significant explanatory power with the exception of windshield observation-identified occupancy. We conclude that, after controlling for geography, CDBG receipt, source of damage, owner-occupancy, rebuilding status, and windshield-survey identified occupancy status, there was not significant differential non-response due to demographic or other observable characteristics. In other words, no factors other than these six were found to be predictive of whether a property owner responded to the survey.
NON-RESPONSE WEIGHTSBecause there was not significant differential non-response due to demographic or other observable characteristics available for only windshield observation properties, we created only one set of non-response weights for the full sample of 1,400 properties that will be sufficient for all analyses. We created weights by estimating a logistic regression model of non-response and used the predicted probabilities from that model to generate inverse probability weights. The procedure for doing so is fairly straightforward. We estimated a logistic
regression with dummy variables for each geographic stratum, and covariates for the other variables of interest (CDBG receipt, rebuilt status, source of damage, and owner-occupancy). Then, we used the fitted model to predict the probability of response for each property (based on the estimated coefficients and actual values of all variables) and used those predicted probabilities to create an inverse probability weight for each property.
FINAL SURVEY WEIGHTSFinal Survey Weights are simply a combination of the base weights and the non-response weights. That is, Survey Weight = (Base Weight * Non-Response Weight).

Appendix D: Rates of Application to the CDBG Program 108
APPENDIX D. RATES OF APPLICATION TO THE CDBG PROGRAM
The owner survey provided an opportunity to explore owners’ experiences with applying for the CDBG program and receiving assistance. One of the questions of interest is the number of owners who applied to the programs in each state as compared to the number who received assistance. Exhibit 5-17 shows rates of CDBG receipt and application among homeowners. As shown above in exhibit 5-1, homeowners in Louisiana and Mississippi (roughly 55 percent in both states) were much more likely to receive a CDBG homeowner award than those in Texas (only 6.5 percent received an award). With a smaller amount of CDBG funding—$503 million compared to $13.4 billion in Louisiana and $5.5 billion in Mississippi—the CDBG homeowner programs in Texas were more narrowly targeted, by income and geography, than the programs in the other two states.67 Perhaps as a result, the majority (75.0 percent) of survey respondents in Texas did not apply for the CDBG program; in comparison, 23.7 percent of respondents in Louisiana and 34.2 percent of respondents in Mississippi did not apply.
Although Louisiana homeowners were most likely to apply for CDBG homeowner funds, among applicants, Mississippi owners were most likely to obtain an award. Among owners that applied for the program in Mississippi, 88 percent received an award, compared to 73 percent in Louisiana and 40 percent in Texas.
There were a number of reasons that some owners in the survey sample did not apply for a CDBG award. As shown in exhibit 5-18, a common reason for not applying for funding across all states was that the owner had other funding to pay for rebuilding. In Louisiana, 49.8 percent of respondents gave this response, similar to the 47.2 percent of respondents in Mississippi and 56.6 percent in Texas, where this was the most common reason cited. Perhaps this is because owners in Texas
67 See appendix A for program descriptions.
had lower repair and rebuilding costs than owners in Mississippi and Louisiana.
Aside from the availability of other funding to pay for repairs or rebuilding, the reasons given for not applying for a CDBG grant varied by state. The most common reason given in Louisiana was that the respondent did not think he/she would meet the eligibility requirements for the program (57.0 percent of respondents gave this reason). Fewer survey respondents said this in Mississippi (40.1 percent) or in Texas (33.8 percent). In Mississippi, the most common reason for not applying was that the respondent was not aware of the program (55.8 percent).68 Respondents in Louisiana (26.7 percent) were significantly less likely to give this response.
In Louisiana, the least common reason given for not applying was that the owner was not planning to rebuild (10.4 percent of respondents gave this reason). In comparison, owners in Mississippi and Texas were more likely to say they were not planning to rebuild (13.4 percent in Mississippi, and 21.3 percent in Texas). In both Mississippi and Texas, owners were least likely to cite that they “heard everyone was being turned down” as a reason for not applying. More respondents cited this reason in Louisiana (20.4 percent).
Lack of availability of the program when rebuilding began was more commonly cited as a reason for not applying for a CDBG award for owners in Louisiana (23.1 percent) than in Texas, where only 5.3 percent of owners gave this reason.
68 One problem with this measure for Mississippi in particular is that many survey respondents said that they did not receive a CDBG award although the administrative data obtained from the state suggests that they did. As described in chapter 5, in Mississippi the terminology used in the survey for the CDBG program may not have been familiar to some respondents. If this is the case, some people in Mississippi may have reported not being aware of the program when they might have known of it using another name.

109Appendix D: Rates of Application to the CDBG Program
Exhibit D-1. Rates of Application to Homeowner Assistance Programs
Louisiana Mississippi Texas
Percent CI Percent CI Percent CI
Applied for CDBG program and received an award
55.0 49.2–60.8 56.6 47.3–66.0 7.2 4.2–10.2
Applied for CDBG program but no award
20.6 14.8–26.4 7.8 2.5–13.2 10.7 1.4–20.0
Did not apply for CDBG program
23.7 18.5–28.8 34.2 23.9–44.4 75.0 63.4–86.5
Don’t Know 0.7 0.0–1.4 1.4 0.0–3.1 7.1 0.0–15.5
Total 100 100 100
Note: Weighted estimates for 155,976 recipients based on 564 survey responses.
Source: 2011 Property Owner Survey
Exhibit D-2. Reasons for Not Applying for a CDBG Award
LouisianaN = 45,321 Based on
130 Survey Responses
MississippiN = 25,305 Based on 95 Survey Responses
TexasN = 38 Based on 6,123
Survey Responses
Percent CI Percent CI Percent CI
Not aware of the program 26.7 18.9–34.5 55.8 47.1–64.5 43.1 29.8–56.5
Program not available when rebuilding began
23.1 16.1–30.1 19.5 11.7–27.2 5.3 0.0–11.8
Did not think eligibility requirements were met
57.0 49.3–64.7 40.1 27.2–53.0 33.8 19.4–48.2
Heard everyone was being turned down
20.4 14.1–26.7 10.9 6.5–15.4 3.3 0.0–7.3
Did not have the necessary paperwork
19.6 12.6–26.7 18.5 10.7–26.2 18.2 6.5–29.9
Property ownership issues too complicated
24.0 1.5–32.5 11.9 5.4–18.3 12.9 2.7–23.1
Application process too complicated for me to handle
33.9 25.1–42.8 15.2 9.7–20.7 19.9 8.0–31.8
Had other funding to pay for rebuilding
49.8 42.1–57.5 47.2 36.1–58.3 56.6 40.6–72.6
Not planning to rebuild 10.4 6.4–14.4 13.4 5.7–21.2 21.3 8.5–34.1
Not worth the hassle 38.5 31.0–45.9 26.5 17.8–35.2 25.2 12.1–38.3
Other reasons for not rebuilding
13.9 8.3–19.5 5.8 2.0–9.6 7.3 0.0–16.0
Note: Shaded percentages indicate a more common reason.
Source: 2011 Property Owner Survey

U.S. Department of Housing and Urban Development
Office of Policy Development and Research
Washington, DC 20410-6000
November 2011