how can gamified applications drive engagement and brand
TRANSCRIPT

administrative sciences
Article
How Can Gamified Applications Drive Engagement and BrandAttitude? The Case of Nike Run Club Application
Ivo Rodrigues 1 , João M. Lopes 2,3 , Ana Borges 1,4,5 , José Oliveira 6 and Márcio Oliveira 2,7,*
�����������������
Citation: Rodrigues, Ivo, João M.
Lopes, Ana Borges, José Oliveira, and
Márcio Oliveira. 2021. How Can
Gamified Applications Drive
Engagement and Brand Attitude?
The Case of Nike Run Club
Application. Administrative Sciences
11: 92. https://doi.org/10.3390/
admsci11030092
Received: 3 June 2021
Accepted: 30 August 2021
Published: 2 September 2021
Publisher’s Note: MDPI stays neutral
with regard to jurisdictional claims in
published maps and institutional affil-
iations.
Copyright: © 2021 by the authors.
Licensee MDPI, Basel, Switzerland.
This article is an open access article
distributed under the terms and
conditions of the Creative Commons
Attribution (CC BY) license (https://
creativecommons.org/licenses/by/
4.0/).
1 ISAG—European Business School, 4100-442 Porto, Portugal; [email protected] (I.R.);[email protected] (A.B.)
2 NECE—Research Unit in Business Sciences, University of Beira Interior, 6200-209 Covilhã, Portugal;[email protected]
3 Miguel Torga Institute of Higher Education, 3000-132 Coimbra, Portugal4 Research Center in Business Sciences and Tourism (CICET-FCVC), 4100-442 Porto, Portugal5 Research Centre in Organizations, Markets and Industrial Management (COMEGI), 1349-001 Lisboa, Portugal6 Instituto Superior Politécnico Gaya, Av. dos Descobrimentos 333, 4400-103 Vila Nova de Gaia, Portugal;
[email protected] Polytechnic Institute of Leiria, Apartado 4133, 2411-901 Leiria, Portugal* Correspondence: [email protected]
Abstract: This research aims to analyze the feasibility of gamified applications as a tool to promoteengagement and brand attitude. To accomplish this, this research was developed using a quantitativemethodology. A confirmatory factor analysis (CFA) was performed and the model hypotheseswere tested by a structural equation modeling (SEM). A questionnaire was applied to Portugueseconsumers who use the “Nike Run Club” application, from which 203 valid responses were received.The results confirm the influence of social circles and their impact on the intention to interactwith the brand. For theoretical contributions, this research contributes to the existing literatureand academic knowledge in the areas of marketing and gamification, providing a suggestion forthe TAM model to be used in this type of research. It also contributes to a better understandingof the relationship between gamification and marketing, demonstrating that the use of gamifiedapplications as engagement tools can have a positive impact on the brand attitude. On the practicalside, it contributes as a consultation tool for brands, application designers, and marketers whendefining engagement strategies, allowing a better understanding of the factors that may or maynot influence the public’s relationship with the brands and what dynamics they should use in thedevelopment of new Gamified marketing solutions.
Keywords: gamification; engagement; companies; brand attitude; marketing; mobile apps; COVID-19
1. Introduction
According to Kotler et al. (2019), the 1990s marked a significant change in the waymarketing was handled. Marketing strategies begin to change their emphasis and redi-rect the focus to the relationship developed between customers and brands. With suchchange, new campaigns and services were devoted to create and maintain customer–brandengagement emerged (Harmeling et al. 2017).
Supported by the technological boom felt in the 1990s, it was possible to observe asignificant investment in new technologies to promote marketing. The internet became avehicle of communication between brands and customers, but games also orientated itsdirection. According to Zichermann and Cunningham (2011), the individuals born between1981 and 2010 (also known as Millennials and Gen Zers) had an intrinsic predispositionto coexist with a technological environment and interact with each other through it. Thisinteraction may occur through social networks; games; forums; and many others.
Adm. Sci. 2021, 11, 92. https://doi.org/10.3390/admsci11030092 https://www.mdpi.com/journal/admsci
Adm. Sci. 2021, 11, 92 2 of 20
Initially associated with the game side, the concept of gamification was introduced atthe beginning of the 21st century. This concept consists of “the use of elements used in thecreation of games applied to non-game contexts” (Deterding et al. 2011).
The average activity with games for individuals born between 1990 and 2010 isestimated to be 16 h a week (Zichermann and Cunningham 2011). A game’s ability tocapture the attention of individuals for a long period has not been unnoticed by themarketing strategies of many companies and proof of this is in the investment growth inthe promotion of “gamified” content, accounting for an increase of more than 10% peryear, expecting to reach $30 billion by 2025 (Alsawaier 2018; MarketsandMarkets 2020;Seiffert-Brockmann et al. 2018).
Once the games ‘ability to effectively retain the players’ attention is validated, itbecomes interesting to associate this context with the theme of customer engagement in adigital component. Therefore, it is necessary to prove whether the combination of the twotranslates into a gain in brand attitude (Alsawaier 2018; Kamboj et al. 2020).
Many companies are already promoting an engagement with stakeholders in a digitalaspect (a good example can be found in Lego’s portal with the “LegoIdeas”); however,with the difficulties imposed nowadays, the importance of maintaining and increasing thistype of relationship has been increasing and this has occurred since companies do not actas closed systems anymore. Consequently, companies recognize the need to engage withthe entire community that surrounds them (Greenwood 2007; Karpen and Conduit 2020;Yang et al. 2017).
Engagement can be defined as the practices that an organization develops to positivelyinvolve stakeholders with the company’s activities (Bowden 2009). Thus, marketingrecognizes that engagement is a concept too broad to be studied with reliability and itis necessary to observe its subclasses and identify the aspects most focused on customerengagement. In this research, these aspects can be found in “customer engagement”(Hollebeek et al. 2014), since one of the objectives is to observe a sample of individualswho have already experienced contact with the brand through its digital application, orwill eventually do so (Yang et al. 2017).
It being widely known that customer engagement positively contributes to the successof marketing activities (Moliner et al. 2018), when looking at its digital aspect, it seems thatthere is literature that points out the need for further research on the reliability and how itshould be developed (Moliner et al. 2018; Thakur 2019). The same can be said about gami-fication, with its advantages supported by some literature (Alsawaier 2018; Hamari et al.2014; Huseynov and Dhahak 2020). A research gap continues to exist when the need arisesto validate whether the use of gamified applications as tools for engagement and brandattitude effectively represent a gain for organizations and consumers (Kamboj et al. 2020).
The literature demonstrates an existing interest in the study of gamification combinedwith marketing (Yang et al. 2017), aiming to prove the legitimacy of gamification as adigital engagement tool to establish a positive correlation between perceived enjoymentand perceived usefulness with the engagement and brand attitude. Nonetheless, it fails toestablish the same correlation between social influence and perceived ease of use.
Huseynov and Dhahak (2020) also refer to the use of the Technology Acceptance Model(TAM) to quantify the influence that gamification can have on the attitude and purchaseintention of digital consumers and managed to establish that social influence, perceivedusefulness, and perceived enjoyment actively influence brand attitude and engagement.The Technology Acceptance Model (TAM) was introduced by Davis (1989) as a tool usedto investigate the adoption of new technologies, offering important information in theintention to use a new technology as well as the type of attitude that it promotes. Thistype of study can be applied to various sectors, as we will see in Section 2.1, and has beenadapted by other authors in the investigation of themes related to gamification, beingaltered according to the theme under study (Mattar and Czeszak 2017; Richter et al. 2015;Vanduhe et al. 2020).
Adm. Sci. 2021, 11, 92 3 of 20
Much of the available literature on this topic predates 2020 events such as the COVID-19 pandemic. The reality and challenges presented by the emergence of the new virus,especially the need for isolation and reduction of physical contact, led us to reinforce theneed for organizations to explore digital solutions related to their consumers. Consequently,it strengthened the importance of finding viable solutions for engagement and brandattitude (Karpen and Conduit 2020).
When discerning the literature, an opportunity arises to deepen the scientific discus-sion regarding the viability and applicability of the concept of gamified engagement andbrand attitude in markets similar to the Portuguese one. In this sense, this research aims toprove the reliability of gamified applications as tools of engagement and brand attitude,using quantitative analysis, supported by an adaptation of the TAM model applied to theobservation of user’s experience using a gamified digital application (Nike Run Club) inthe Portuguese territory, which, according to the Portuguese Family Business Association(2019), presents market characteristics that are different from the rest of Europe, it being aperipheral economy with disparities in indicators such as average wages and educationlevels, amongst others. Important to this research is the fact that, according to the Statistaportal (2020), the average level of engagement created by social networks in Portugal (2%)is lower than the average of 4% recorded in central Europe. This level can be justified bythe fact that the digital appetite of citizens is also lower than the EU average since only 79%of the population has access to the internet and 23% of the same population has never hadcontact with a digital medium (National Statistics Institute 2019).
Thus, using the Nike Run Club application as a case study, this study begins withthe following research question: can gamified applications be considered viable tools forpromoting brand engagement and attitude?
This research is organized as follows: Section 1 presents an introduction to the theme;in Section 2 a literature review is performed as well as the formulation of hypotheses.Section 3 introduces the methodology used, the questionnaire structure, and the sampledescription. Section 4 exhibits the results compared with the literature and its discus-sion. Finally, Section 5 presents the conclusions, research limitations, and future lines ofinvestigation.
2. Literature Review and Formulated Hypothesis
Currently, some literature associates gamification with the connection that customersdevelop with companies. However, most of the authors point out the existence of a voidthat acknowledges the need for further research (Chen et al. 2016; Kuo and Chuang 2016).
The existence of such a void in knowledge about gamification, combined with en-gagement and brand attitude, points to a literature gap, which leads to the followinginitial question: “Through an adaptation of the TAM model, are we able to prove thatgamification in digital platforms represents a valid tool for users and organizations, capableof promoting engagement with the Portuguese consumer and directly affecting the brandattitude?”.
2.1. Technology Acceptance Model
The emergence of the Technology Acceptance Model (TAM) results from the necessityto prove or predict a possible degree of user acceptance when faced with a new technology(Davis 1989). To this purpose, the author used the dimensions of “perceived ease-of-use”and “perceived usefulness” to obtain a clear image of the user’s intention to develop arelationship with the technology in question (Deterding et al. 2011).
The “perceived ease-of-use” (PEU) allows us to observe the initial acceptance andcontinued use of a certain technology (Davis 1989), and denotes a critical factor in theadoption process (Lin et al. 2007). This aspect is still studied today, helping to understandthe factors that lead the user to accept a new technology (Mutambara and Bayaga 2020).
“Perceived usefulness” (PU) is identified as the most important aspect in the TAMmodel, since it acts as the main indicator of the user’s intention to use new technology
Adm. Sci. 2021, 11, 92 4 of 20
(Davis 1989), and reflects the degree of utility that the new technology represents for theuser in his view.
Recent investigations indicate that both “perceived usefulness” and “perceived ease-of-use” play a mediating role that influences not only the consumer’s intention to use thetechnology but also impacts its behavior before and after its use (Deterding et al. 2011).
The use of the TAM model investigates the adoption of new technologies and hasbeen applied to diverse sectors, such as financial (Zhou et al. 2018); tourism (Peng et al.2012); education (Sharma and Pal 2020); health (Djamasbi et al. 2009); and manufacturing(Hernandez et al. 2008). Therefore, it provides the versatility of the tool and its highadaptability (Hassan et al. 2019).
2.2. Gamification as a Tool for Engagement and Brand Attitude
Investigating gamification without addressing motivation and engagement is increas-ingly complicated since these concepts are interconnected and progressively developed(Alsawaier 2018).
On the other hand, the study of the relationship developed between gamificationand brand attitude is in a more embryonic stage. This does not mean that the impact ofgamification on brand attitude is a recent subject, but that it has been studied as a topicrecently (Huseynov and Dhahak 2020). The timeline that many point out as the first timethe term ‘gamification’ was used is in 2002 during a presentation conducted by Nick Pellingon a theme related to computer software (Mora et al. 2015). Gamification was later definedby Deterding et al. (2011) as the use of game mechanics and tools in non-game contexts.
When gamification is used in commercial contexts, it usually aims to afford morefun to the consumer experience and contribute directly and indirectly to the marketingof a product, but also playing a facilitating role aiming at customer loyalty (Huotari andHamari 2017). In the interaction with the user, the organization which created the gamifiedtool employs several strategies and elements such as the “PBL Triade” (points; badges andleaderboards) (Werbach and Hunter 2015); “Intrinsic Motivation and Flow” (Rheinberg andEngeser 2018); and Player segmentation (Bovermann and Bastiaens 2020). Consequently,it seeks to develop an experience that can contribute to the user’s engagement with thebrand.
When examining the available literature on engagement, we found that the term has awide scope; as such, it is necessary to deepen the research into a more specific aspect ofcustomer engagement (Kotler et al. 2019). Therefore, it is key to look for a clearer image ofthe relationship developed between the consumer and the brand (Thakur 2019).
Customer engagement can be defined as how brands connect with consumers at agiven time or over long-term relationships (Lee et al. 2017; Paul and Bhakar 2018; Viveket al. 2012). This is not only oriented to the physical and face-to-face interactions thatenvisage a disruption trend, but is increasingly oriented towards the adoption of digitaltools disregarding face-to-face interations and equipped with artificial intelligence (Chenand Aklikokou 2020; Normalini 2019).
The COVID-19 pandemic created uncertainty and economic pressure and acted as adriver for many businesses to evolve how they were approaching their consumers (Karpenand Conduit 2020). This forced numerous companies to digitize most of their services,promoting online contact points, migrating customers to digital channels, and significantlyincreasing their presence on social media (Jiang and Wen 2020).
In this context, the brand attitude reflects the most emotional aspect of the consumertowards the brand (Vahdat et al. 2020). The brand attitude acts as a barometer of consumersatisfaction with a brand, product, or service (Lee et al. 2017). This indicator is veryimportant since it allows the brand to understand the intentions of its potential consumersconcerning its products or services. Thus, it reflects which products respond to the needsof consumers; what level of performance is recognized by the consumer; and the level ofutility and value of the product (Mitchell and Olson 1981).

Adm. Sci. 2021, 11, 92 5 of 20
Previous studies prove the existence of a connection between attitude and behavior(Chen and Aklikokou 2020; Normalini 2019; Subramanian 1994), indicating that brandattitude can influence brand behavior (Spears and Singh 2004). This reinforces the need forthe brand not only to understand the kind of attitude consumers have, but mainly howthey can positively influence such an attitude (Paul and Bhakar 2018).
In a recent study developed by one of the leading companies in the commercialanalysis market, it was uncovered that the digital aspect tends to increasingly impact onthe relationship that the consumer develops with the brand (Salesforce Research 2019).
In this sense, it is important to have a quantifiable idea of the level of acceptance ofusers when exposed to a new digital tool. This leads us to the next topic.
2.3. Perceived Usefulness and Perceived Ease of Use
Perceived usefulness (PU) and perceived ease of use (PEOU) are two of the masterpillars when analyzing the level of acceptance that the user has towards a technology(Davis 1989).
The PU points out the degree that the user assigns to the utility that a given technologyplays in their daily lives, thus allowing users to perceive its performance level (Chen andAklikokou 2020; Normalini 2019; Subramanian 1994). In this research, this indicator reflectsto which extent the use of a gamified application can influence the intention to use orpurchase the brand’s products.
In the case of PEOU, it exposes the ease of interaction with the new technology, notonly in the initial moment, but also over time (Gede and Permana 2019; McNab and Hess2007; Subramanian 1994).
In the present research, the authors tried to understand how the easiness of use of agamified application can influence the feeling that the user develops towards the brand.Being thus, the following hypotheses were formulated:
Hypothesis 1 (H1). Perceived usefulness affects positively brand attitude.
Hypothesis 2 (H2). Perceived ease of use affects positively brand attitude.
2.4. Perceived Social Influence, Perceived Enjoyment, and Intention of Engagement
Although mentioned as a valid tool by several researchers, recent studies argue aboutpossible improvements in the quality and reliability of the TAM model, defending that thedimensions should always be adapted according to the subject under study, consequentlymanaging to direct the model more effectively to the subject under analysis (He et al. 2018;Silva 2007).
Several authors acknowledge that social influence can have a direct action not onlyon an individual’s intention to use new technology, but also on the fun deriving from it(Cho and Son 2019; Nawaz et al. 2017). Individuals tend to assume a certain behavior ifone or more individuals belonging to the same group commonly understand it (Weitznerand Deutsch 2015).
Observing this relationship is especially important nowadays when we are facinga significant increase in the use of social media. In turn, there is a substantial growth inonline groups where members share the same goals and values (Bruhn et al. 2012; Studenand Tiberius 2020; Tench and Jones 2015).
Currently, most gamification actions tend to take place in a virtual environment withthe direct use of social media (Alsawaier 2018; Tegtmeier et al. 2013). In this sense, socialpressure will likely be able to actively influence the individual’s interest in the use of agamified application. Social influence is often seen as a powerful tool to change behaviorsand ideas (Cook et al. 2009; Goodpastor and Montoya 1996).
Usually, individuals tend to demonstrate behaviors and values based on the groupthey are in or want to be associated with (Ruangkanjanases et al. 2020). These groups

Adm. Sci. 2021, 11, 92 6 of 20
where the individual is or wants to be can be constituted of friends, family, co-workers,famous individuals, and others.
When we relate the viability of social influence with the concept of gamification,we uncover that games have a strong component of competition and cooperation, thusestablishing the relationship of the individual to other groups and creating conditions forinfluence to occur between them (Huseynov and Dhahak 2020; Mitchell et al. 2017; Nobreand Ferreira 2017).
In brief, the concatenation of these two factors when transported to the commercialenvironment can impact the manner in how an individual is related to a brand. Taking thisinto account, the following hypotheses were formulated:
Hypothesis 3 (H3). Perceived social influence affects positively on the brand attitude.
Hypothesis 4 (H4). Perceived social influence affects positively on the intention of engagement.
2.5. Attitude towards the Use of a Gamified Application
The attitude towards the use (ATU), is strongly influenced by PU and PEOU and isregarded as one of the main indicators of a user’s willingness to use an application (Davis1993; Šebjan et al. 2016; Teo 2011).
Since we can not affirm that gamification generates consensus on whether it is aviable or adaptable tool to all markets and sectors (Hamari et al. 2014; Hussain et al. 2018),understanding how users view themselves is crucial to measure the possible success of agamified initiative.
Previous studies point to the success of gamification on the motivation of users tocontinue to be involved in the process (Alsawaier 2018; Ghazali et al. 2019; Kuo and Chuang2016). In this case, gamification can play an identical role by contributing to the interest ofusers to try the application and continue to use it. Consequently, believing that gamificationcan directly impact the user’s predisposition to participate in the action and, therefore,influence its outcome. Considering this, the following hypothesis was formulated:
Hypothesis 5 (H5). Intention of engagement affects positively brand attitude.
2.6. Player Motivations and Gamification Performance
Finally, two new dimensions were added (Player motivations; Gamification perfor-mance) to the model that we have adapted (Yang et al. 2017).
Having previously verified that customer engagement can be influenced by severalfactors (Kotler et al. 2019), it was also confirmed that this is usually analyzed in a downwardway (company to consumer) (Bowden 2009; Hollebeek et al. 2014).
Nevertheless, we understand that nowadays it is the consumer who often takes theinitiative to engage with the brand (Payne et al. 2009). Therefore, it is equally importantto listen to the phenomenon of customer engagement in an upward direction (consumerto the company) and attend to the reasons that lead the customer to interact with thebrand. Believing that the motivations that lead consumers to interact can also influencetheir intention to get involved in the engagement with brands, the following hypothesis isproposed:
Hypothesis 6 (H6). Player motivations affect positively the intention of engagement.
The second new dimension (gamification performance) focuses on the performanceof the gamified application and its relationship with the consumer’s attitude towards thebrand.
According to the literature previously analyzed (Lee et al. 2017; Vahdat et al. 2020), thebrand attitude has a strong emotional component in the consumer; previous studies alsopoint to a connection between attitude and behavior (Spears and Singh 2004). We believe

Adm. Sci. 2021, 11, 92 7 of 20
that it is equally important to assess the existence of a link between the attitude and theperformance of a gamified application; this being so, we formulate the last hypothesis:
Hypothesis 7 (H7). Gamification performance affects positively on brand attitude.
In summary, the literature review results in the elaboration of seven different hypothe-ses, five derived from previous studies and two dedicated to the present study, as can beseen in Table 1.
Table 1. Hypothesis and authors.
Hypothesis Authors
H1 Subramanian (1994); Normalini (2019); Chen and Aklikokou (2020)
H2 Subramanian (1994); McNab and Hess (2007); Gede and Permana (2019)
H3 Silva (2007); Weitzner and Deutsch (2015); Nawaz et al. (2017); Cho and Son (2019)
H4 Alsawaier (2018); Ruangkanjanases et al. (2020); Huseynov and Dhahak (2020)
H5 Davis (1993); Šebjan et al. (2016); Alsawaier (2018); Ghazali et al. (2019)
H6 Yang et al. (2017); Bowden (2009); Payne et al. (2009); Hollebeek et al. (2014)
H7 Spears and Singh (2004); Lee et al. (2017); Vahdat et al. (2020)
3. Methodology
This research was developed using a quantitative methodology. The adoption of aquantitative method, instead of a qualitative one, is because the qualitative analysis ismore related to the construction of theories and the quantitative one more oriented totest the theory (Newman and Benz 1999). Since the study that served as the initial basishad a strong qualitative component (Yang et al. 2017), at a later stage it was needed toquantify and analyze all possible scenarios using a numerical representation and to obtainquantifiable data that can be analyzed using statistical techniques and illustrate a valid andreal image of the observed hypothesis (Larsson 1993).
Consequently, this research observed the interaction that users developed with theNike brand through its gamified application, “Nike Run Club”. The ease of use of anew technological tool is crucial to ensure its adoption and continuous use (Yang et al.2017); hence, we recourse to the adaptation of a previously used methodology (TAM) toperceive the level of acceptance perceived by the users of the application (Zichermann andCunningham 2011).
The choice of the Nike Run Club application for this research was due to the factthat it belongs to a globally recognized brand, but also because the application has beendeveloped in such a way that it can be used to motivate users to engage in physical activitythat is not exclusively focused on selling the brand’s products and thus envisaging thegamification principles. The Nike Run Club app acts as a personal trainer which motivatesusers to overcome goals, using challenges and rewards to recompense the effort andmotivate continued involvement.
Furthermore, the application allows the achievement of the objective of our research bymeasuring the level of acceptance of the gamified application in the Portuguese public andchecking whether this type of marketing strategy can be considered valid in a peripheralcountry with digital acceptance rates lower than the rest of the European Union (NationalStatistics Institute 2019).
Since we do not have a complete list of the individuals belonging to the population, anon-probabilistic convenience sample was used (Acharya et al. 2013; Etikan 2016). Thus, thesample under analysis includes individuals (aged over 18 years) who used or had alreadyused the application and agreed to fill the questionnaire to share their experience, thus con-tributing to increase the viability of the collected data (Zichermann and Cunningham 2011).
Taking advantage that the application addresses a sports theme publicized online, thequestionnaire used to collect primary data was submitted online from June to December

Adm. Sci. 2021, 11, 92 8 of 20
2020, on a website specialized in the practice of physical activity (www.strava.com). Addi-tionally, two digital platforms were used (Facebook and Instagram). At the beginning ofthe questionnaire, the following question was asked: Have you used the Nike Run Clubapplication? Only if the answer was positive could the respondents continue to reply tothe questionnaire. Therefore, it was ensured that the sample only included experts/usersof the application.
3.1. Questionnaire
The questions used in the questionnaires were adapted from a study previouslydeveloped by Yang et al. (2017) and completed with new research constructs validatedby Zichermann and Cunningham (2011). The necessary adaptation and expansion of thepreviously developed questionnaires guarantee an up-to-date questionnaire in line withthe current literature. Before disseminating the questionnaire, a pre-test was carried out toeliminate possible errors, therefore allowing its further validation.
In this context, a questionnaire with 32 closed questions was prepared. The ques-tionnaire was divided into two distinct segments; the first (25 questions) aims to collectdata related to the use of the application and the relationship with the brand, while thesecond (seven questions) is oriented to collect information regarding the player profile.The questions were grouped according to the corresponding measurement item, which canbe consulted in Table 2 (Yang et al. 2017).
Table 2. Set of applied questions.
Type Questions
A (Sample characterization) Q1; Q2; Q3; Q4
B (Perceived usefulness) Q5; Q6; Q7
C (Perceived ease of use) Q8; Q9; Q10
D (Perceived Social Influence) Q11; Q12; Q13
E (Intention of Engagement) Q14; Q15; Q16
F (Brand attitude) Q17; Q18; Q19; Q20; Q21; Q22; Q23
G (Player motivations) Q24; Q25; Q26
H (Gamification performance) Q27; Q28; Q29; Q30; Q31; Q32
3.2. Data Analysis
Data collection was performed between June and December 2020 and was continu-ously publicized to increase the number of responses by users of the application.
After this period, the collected data were gathered and filtered. For data processing,Microsoft Excel (with statistical analysis additives), in parallel with SPSS software andAMOS 22.0, were used.
Throughout the research, different types of analysis were used. An initial phase useddescriptive statistics to summarize and describe the sample, allowing a better understand-ing of the data (Janes 1999).
Next, we performed both an exploratory (EFA) and confirmatory factor (CFA) by themaximum likelihood estimation method and Hair et al.’s (2010) criteria. All tests for modelvalidation were performed.
Five of the analyzed dimensions were adapted from the model previously used byYang et al. (2017); however, this research added two new dimensions: Player Motivationsand Gamification Performance. Therefore, the research concentrates its attention on sevendistinct dimensions with different hypotheses. Figure 1 shows the connection between thedimensions previously observed and the hypotheses that derive from them.

Adm. Sci. 2021, 11, 92 9 of 20
Adm. Sci. 2021, 11, x FOR PEER REVIEW 9 of 20
Next, we performed both an exploratory (EFA) and confirmatory factor (CFA) by the maximum likelihood estimation method and Hair et al.’s (2010) criteria. All tests for model validation were performed.
Five of the analyzed dimensions were adapted from the model previously used by Yang et al. (2017); however, this research added two new dimensions: Player Motivations and Gamification Performance. Therefore, the research concentrates its attention on seven distinct dimensions with different hypotheses. Figure 1 shows the connection between the dimensions previously observed and the hypotheses that derive from them.
Figure 1. Investigation Model. Source: Adapted from Yang et al. (2017).
4. Results and Discussion The sample consisted of 56.7% males and 43.3% females, in contrast to the Portuguese
average of 47% females and 53% males (Pordata 2019). The age group with the highest incidence is between 24 and 28 years, representing
33.5% of the sample. In terms of educational qualifications, more than half of individuals had a higher education degree, representing 49.3% of the sample.
Finally, the Porto region represents 58.6% and Lisbon 16.3% with the remaining 25.1% being occupied by the remaining regions, an important fact is the absence of data in the southern regions (Table 3). This is in line with the information advanced by the institute National Statistics Institute (INE), indicating a variation from 1000 inhabitants per km2 on the coast to 50 inhabitants per km2 in the interior (INE 2020).
Table 3. Sample description.
Variable Description Frequencies Percentage
Gender Male 115 56.7
Female 88 43.3
Age Group
19–23 47 23.2 24–28 68 33.5 29–33 33 16.3 34–38 33 16.3
39 or more 22 10.8
Education Degree 9th year or less 10 4.9
10–12th year 44 21.7 Undergraduate 100 49.3
Figure 1. Investigation Model. Source: Adapted from Yang et al. (2017).
4. Results and Discussion
The sample consisted of 56.7% males and 43.3% females, in contrast to the Portugueseaverage of 47% females and 53% males (Pordata 2019).
The age group with the highest incidence is between 24 and 28 years, representing33.5% of the sample. In terms of educational qualifications, more than half of individualshad a higher education degree, representing 49.3% of the sample.
Finally, the Porto region represents 58.6% and Lisbon 16.3% with the remaining 25.1%being occupied by the remaining regions, an important fact is the absence of data in thesouthern regions (Table 3). This is in line with the information advanced by the instituteNational Statistics Institute (INE), indicating a variation from 1000 inhabitants per km2 onthe coast to 50 inhabitants per km2 in the interior (INE 2020).
Table 3. Sample description.
Variable Description Frequencies Percentage
GenderMale 115 56.7
Female 88 43.3
Age Group
19–23 47 23.224–28 68 33.529–33 33 16.334–38 33 16.3
39 or more 22 10.8
Education Degree
9th year or less 10 4.910–12th year 44 21.7
Undergraduate 100 49.3Master 45 22.2
PhD 4 2.0
Geographic Region
Azores 2 1.0Aveiro 10 4.9Braga 9 4.4
Bragança 3 1.5Castelo Branco 2 1.0
Coimbra 4 2.0
Adm. Sci. 2021, 11, 92 10 of 20
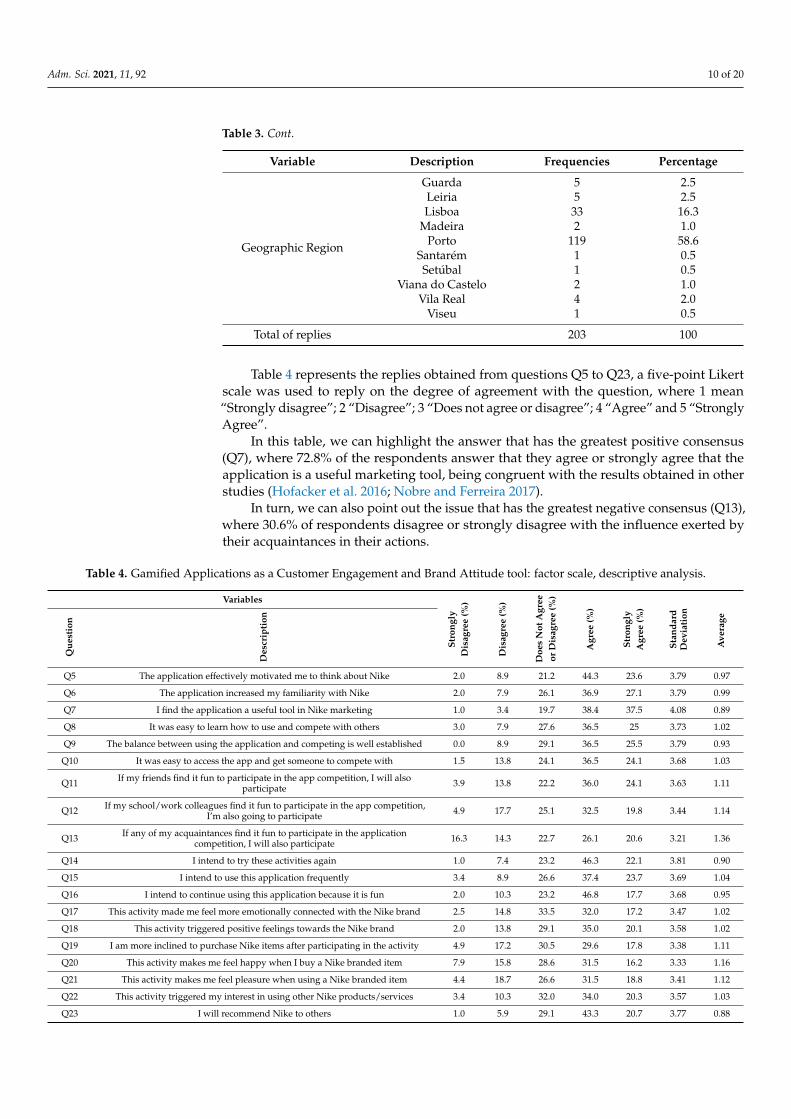
Table 3. Cont.
Variable Description Frequencies Percentage
Geographic Region
Guarda 5 2.5Leiria 5 2.5Lisboa 33 16.3
Madeira 2 1.0Porto 119 58.6
Santarém 1 0.5Setúbal 1 0.5
Viana do Castelo 2 1.0Vila Real 4 2.0
Viseu 1 0.5
Total of replies 203 100
Table 4 represents the replies obtained from questions Q5 to Q23, a five-point Likertscale was used to reply on the degree of agreement with the question, where 1 mean“Strongly disagree”; 2 “Disagree”; 3 “Does not agree or disagree”; 4 “Agree” and 5 “StronglyAgree”.
In this table, we can highlight the answer that has the greatest positive consensus(Q7), where 72.8% of the respondents answer that they agree or strongly agree that theapplication is a useful marketing tool, being congruent with the results obtained in otherstudies (Hofacker et al. 2016; Nobre and Ferreira 2017).
In turn, we can also point out the issue that has the greatest negative consensus (Q13),where 30.6% of respondents disagree or strongly disagree with the influence exerted bytheir acquaintances in their actions.
Table 4. Gamified Applications as a Customer Engagement and Brand Attitude tool: factor scale, descriptive analysis.
Variables
Stro
ngly
Dis
agre
e(%
)
Dis
agre
e(%
)
Doe
sN
otA
gree
orD
isag
ree
(%)
Agr
ee(%
)
Stro
ngly
Agr
ee(%
)
Stan
dard
Dev
iati
on
Ave
rage
Que
stio
n
Des
crip
tion
Q5 The application effectively motivated me to think about Nike 2.0 8.9 21.2 44.3 23.6 3.79 0.97
Q6 The application increased my familiarity with Nike 2.0 7.9 26.1 36.9 27.1 3.79 0.99
Q7 I find the application a useful tool in Nike marketing 1.0 3.4 19.7 38.4 37.5 4.08 0.89
Q8 It was easy to learn how to use and compete with others 3.0 7.9 27.6 36.5 25 3.73 1.02
Q9 The balance between using the application and competing is well established 0.0 8.9 29.1 36.5 25.5 3.79 0.93
Q10 It was easy to access the app and get someone to compete with 1.5 13.8 24.1 36.5 24.1 3.68 1.03
Q11 If my friends find it fun to participate in the app competition, I will alsoparticipate 3.9 13.8 22.2 36.0 24.1 3.63 1.11
Q12 If my school/work colleagues find it fun to participate in the app competition,I’m also going to participate 4.9 17.7 25.1 32.5 19.8 3.44 1.14
Q13 If any of my acquaintances find it fun to participate in the applicationcompetition, I will also participate 16.3 14.3 22.7 26.1 20.6 3.21 1.36
Q14 I intend to try these activities again 1.0 7.4 23.2 46.3 22.1 3.81 0.90
Q15 I intend to use this application frequently 3.4 8.9 26.6 37.4 23.7 3.69 1.04
Q16 I intend to continue using this application because it is fun 2.0 10.3 23.2 46.8 17.7 3.68 0.95
Q17 This activity made me feel more emotionally connected with the Nike brand 2.5 14.8 33.5 32.0 17.2 3.47 1.02
Q18 This activity triggered positive feelings towards the Nike brand 2.0 13.8 29.1 35.0 20.1 3.58 1.02
Q19 I am more inclined to purchase Nike items after participating in the activity 4.9 17.2 30.5 29.6 17.8 3.38 1.11
Q20 This activity makes me feel happy when I buy a Nike branded item 7.9 15.8 28.6 31.5 16.2 3.33 1.16
Q21 This activity makes me feel pleasure when using a Nike branded item 4.4 18.7 26.6 31.5 18.8 3.41 1.12
Q22 This activity triggered my interest in using other Nike products/services 3.4 10.3 32.0 34.0 20.3 3.57 1.03
Q23 I will recommend Nike to others 1.0 5.9 29.1 43.3 20.7 3.77 0.88

Adm. Sci. 2021, 11, 92 11 of 20
Regarding the players’ profiles, in Table 5 we can observe the aspects such as the typeof game, motivation to play, as well as the frequency with which they do it (Q24, Q25, andQ26) tend to vary. However, during the questionnaire period, we found that “Adventure”is considered a favorite by most of the sample (26.60%). Regarding the reasons that leadrespondents to play, we realized that “mental challenge” is the factor that most consensusespresents (33%).
Table 5. Player Profiles: factor scale, descriptive analysis.
Type Question Description Profile Frequency Percentage %
G Q24Indicate your favorite
game type
Action 34 16.75Adventure 54 26.60
Others (Puzzle; Board Games; etc.) 38 18.72Simulation 36 17.73
Strategy 41 20.20
G Q25What motivates you
the most to play
Botheration 23 11.33Physical challenge 27 13.30Mental challenge 67 33.00
Distraction from everyday life 1 0.49Play with other people 49 24.14
To socialize 28 13.79None 8 3.94
G Q26How often do you
play?
Daily (10 times or more per month) 63 31.03Weekly (5 to 9 times per month) 68 33.50
Monthly (2 to 4 times per month) 41 20.20Rarely (One or less per month) 26 12.81
Never 5 2.46
The sample was consulted to assess the type of gamification tools presented in theactivity. In Table 6, we can perceive that the tool that has the greatest positive consensuswith players is “badges” of achievements which directly contrasts with the “public profiles”which gathered the greatest negative consensus concerning their performance in a gamifiedactivity.
Table 6. Evaluation of gamification tools: factor scale, descriptive analysis.
Variables
Ver
yN
egat
ive
(%)
Neg
ativ
e(%
)
Nor
Neg
ativ
eor
Posi
tive
(%)
Posi
tive
(%)
Ver
yPo
siti
ve(%
)
Ave
rage
Stan
dard
Dev
iati
on
Type
Que
stio
n
Des
crip
tion
H Q27 Points (Points earned for reaching goals in the game,which can be exchanged for real or virtual items) 2.5 4.4 23.2 41.4 28.6 3.89 0.95
H Q28 Leaderboards (Table with the rank achieved by eachplayer) 3.4 5.9 21.7 46.8 22.2 3.78 0.97
H Q29 Player profile (Personalization of avatar and personalstatistics) 2.0 13.8 26.6 32.0 25.6 3.66 1.07
H Q30 Team (Possibility to play in team with other people) 1.5 11.8 20.2 37.4 29.1 3.81 1.03
H Q31 Progress bars (Graphs indicating the level of completionof an objective) 3.0 6.9 19.2 38.9 32.0 3.90 1.02
H Q32 Achievement badges (Badge awarded in recognition ofcompletion of an objective) 2.0 7.4 19.2 40.9 30.5 3.91 0.98
Factorial Analysis
To support the research, a factorial analysis was performed to corroborate the dimen-sions under study. To validate the factor analysis model, a Kaiser-Meyer-Olkin test (KMO)
Adm. Sci. 2021, 11, 92 12 of 20
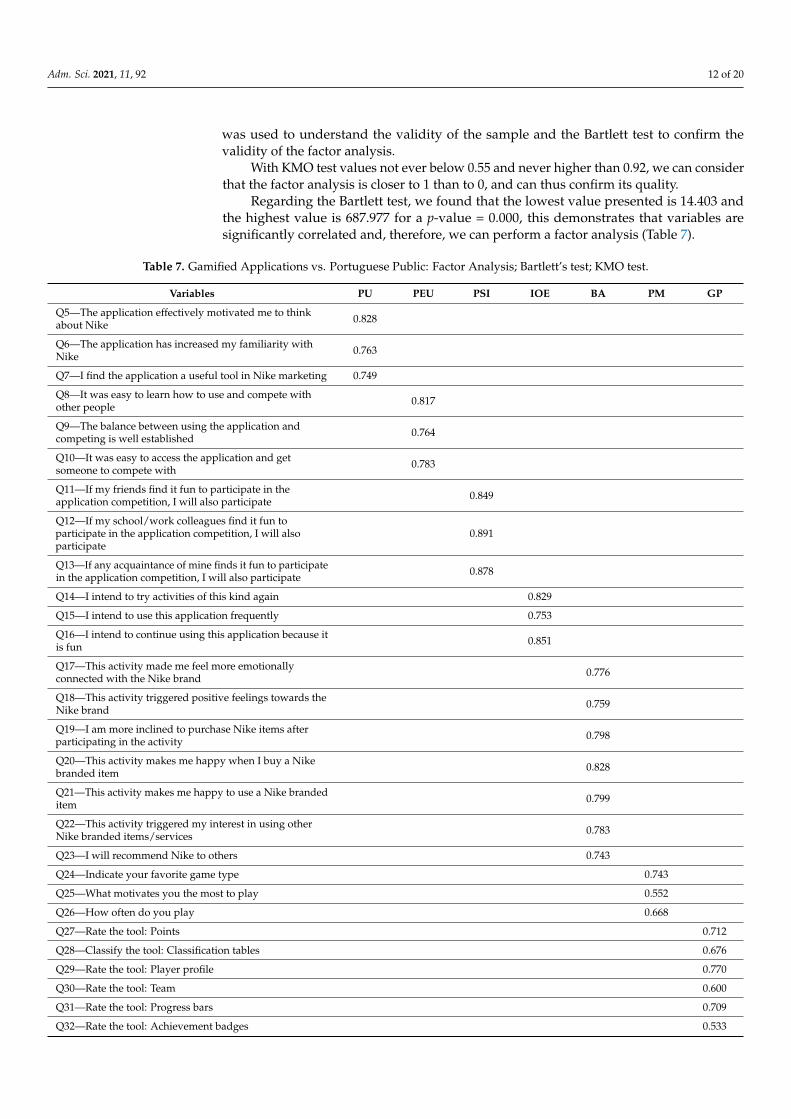
was used to understand the validity of the sample and the Bartlett test to confirm thevalidity of the factor analysis.
With KMO test values not ever below 0.55 and never higher than 0.92, we can considerthat the factor analysis is closer to 1 than to 0, and can thus confirm its quality.
Regarding the Bartlett test, we found that the lowest value presented is 14.403 andthe highest value is 687.977 for a p-value = 0.000, this demonstrates that variables aresignificantly correlated and, therefore, we can perform a factor analysis (Table 7).
Table 7. Gamified Applications vs. Portuguese Public: Factor Analysis; Bartlett’s test; KMO test.
Variables PU PEU PSI IOE BA PM GP
Q5—The application effectively motivated me to thinkabout Nike 0.828
Q6—The application has increased my familiarity withNike 0.763
Q7—I find the application a useful tool in Nike marketing 0.749
Q8—It was easy to learn how to use and compete withother people 0.817
Q9—The balance between using the application andcompeting is well established 0.764
Q10—It was easy to access the application and getsomeone to compete with 0.783
Q11—If my friends find it fun to participate in theapplication competition, I will also participate 0.849
Q12—If my school/work colleagues find it fun toparticipate in the application competition, I will alsoparticipate
0.891
Q13—If any acquaintance of mine finds it fun to participatein the application competition, I will also participate 0.878
Q14—I intend to try activities of this kind again 0.829
Q15—I intend to use this application frequently 0.753
Q16—I intend to continue using this application because itis fun 0.851
Q17—This activity made me feel more emotionallyconnected with the Nike brand 0.776
Q18—This activity triggered positive feelings towards theNike brand 0.759
Q19—I am more inclined to purchase Nike items afterparticipating in the activity 0.798
Q20—This activity makes me happy when I buy a Nikebranded item 0.828
Q21—This activity makes me happy to use a Nike brandeditem 0.799
Q22—This activity triggered my interest in using otherNike branded items/services 0.783
Q23—I will recommend Nike to others 0.743
Q24—Indicate your favorite game type 0.743
Q25—What motivates you the most to play 0.552
Q26—How often do you play 0.668
Q27—Rate the tool: Points 0.712
Q28—Classify the tool: Classification tables 0.676
Q29—Rate the tool: Player profile 0.770
Q30—Rate the tool: Team 0.600
Q31—Rate the tool: Progress bars 0.709
Q32—Rate the tool: Achievement badges 0.533

Adm. Sci. 2021, 11, 92 13 of 20
Table 7. Cont.
Variables PU PEU PSI IOE BA PM GP
% Variance 60.918 62.149 76.229 65.951 61.518 43.447 45.053
Bartlett’s test (sig) 97.165(0.000)
103.601(0.000)
252.009(0.000)
140.234(0.000)
687.977(0.000)
14.403(0.000)
265.658(0.000)
KMO’ teste 0.646 0.665 0.721 0.665 0.920 0.543 0.766
Note: Significant at p < 0.01, Extraction Method: Principal component analysis.
In Table 8 we can verify that the results indicate an acceptable measurement model fit(Byrne 2013; Kline 2015).
Table 8. Measurement model (CFA).
Construct Items Factor Loading CR AVE Cronbach’s Alpha
PUQ5Q6Q7
0.849 ***0.823 ***0.746 ***
0.927 0.809 0.835
PEOUQ8Q9
Q10
0.831 ***0.889 ***0.835 ***
0.888 0.726 0.876
PSIQ11Q12Q13
0.833 ***0.895 ***0.995 ***
0.935 0.828 0.896
IOEQ14Q15Q16
0.833 ***0.975 ***0.895 ***
0.929 0.815 0.841
BA
Q17Q18Q19Q20Q21Q22Q23
0.733 ***0.875 ***0.795 ***0.878 ***0.911 ***0.899 ***0.978 ***
0.956 0.757 0.961
PMQ24Q25Q26
0.825 ***0.895 ***0.901 ***
0.907 0.764 0.853
GP
Q27Q28Q29Q30Q31Q32
0.815 ***0.889 ***0.898 ***0.998 ***0.978 ***0.997 ***
0.975 0.868 0.856
Goodness-of-Fit
Chi-square test: X2/df = 5.441Root Mean Square Error of Approximation (RMSEA) = 0.067
Comparative Fit Index (CFI) = 0.942Tucker Lewis Index (TLI) = 0.976Incremental Fit Index (IFI) = 0.951
Note: Significant at *** p < 0.01. We also test the criterion for discriminant validity among latent variables.
The structural model’s psychometric values are: χ2/df = 5.441; RMSEA = 0.067;CFI = 0.942; TLI = 0.976; IFI = 0.951, this let us determine whether the model fit was good.From the analysis of Table 9 it is possible to evaluate if the hypotheses are confirmed.

Adm. Sci. 2021, 11, 92 14 of 20
Table 9. The results of the structural equation model.
Hypotheses Path Estimate R2 Result
H1: PU → BA 0.31 *** 0.41 Confirmed
H2: PEOU → BA 0.43 *** 0.39 Confirmed
H3: PSI → BA 0.26 *** 0.51 Confirmed
H4: PSI → IOE 0.32 ** 0.36 Confirmed
H5: IOE → BA 0.41 ** 0.27 Confirmed
H6: PM → IOE 0.26 *** 0.41 Confirmed
H7: GP → BA 0.39 ** 0.42 ConfirmedNote: Significant at *** p < 0.01; ** p < 0.05; p < 0.1.
Afterwards, we can verify if the proposed model is valid. For that, to evaluate thediscriminant validity, we applied Fornell and Larcker (1981) criteria. For that, we observedthat the AVE values were higher than the squared inter-construct correlation estimates. Weobserve that the BA is affected positively by the PU (γ = 0.31, p < 0.01), PEOU (γ = 0.43,p < 0.01) and PSI (γ = 0.26, p < 0.01); Patel and Patel (2018) confirmed identical resultswhen observing the influence of PEU and PU in the engagement. These results were alsopointed out by Huseynov and Dhahak (2020) as being positive influencers in the users’satisfaction with the brand. With regards to PSI relating to the data obtained with theliterature previously analyzed, we found that, as perceived by Weitzner and Deutsch(2015, PSI is identified as a positive influencer of BA, which induces the confirmation ofHypotheses 1–3.
The relation observed on H1 and H2 (PU and PEU with BA) also gos in line withthe work previously done by Seitz and Aldebasi (2016) where it was pointed that theconstruction phase of a user app was the most important one, because in order for the userto better relate with the app he needs to feel that the app is useful and relatively easy touse, pointing this out as key success factors.
The work of Lee et al. (2017) is also supported and PU and PEU are reinforced hasinfluencers of the users’ satisfaction with the brand.
We also observed that PSI has a direct influence on IOE (γ = 0.32, p < 0.05), confirmingthe data previously obtained by Kamboj et al. (2020) and supporting the remarks madeby Ruangkanjanases et al. (2020) of an existing influence imposed by social circles in theindividual’s attitude, indicating that Hypothesis 4 should be confirmed.
The results obtained in H3 and H4 validate that “peer pressure” can not just influencethe user undertaking a task, but also the way he feels about undertaking that same task(Cho and Son 2019).
These results relate to the proliferation of companies investing on growing onlineconsumer groups, taking advantage of their audience in order to promote their brand(Studen and Tiberius 2020).
Hypothesis 5 is also confirmed, stating that IOE influences positively the BA (γ = 0.41,p < 0.05) and confirming previous studies which point to this correlation (Alsawaier 2018;Ghazali et al. 2019), also validating the suggestion that gamification is considered to have apositive impact on the establishment of BA (Patzer et al. 2020).
The Hypotheses H6 and H7 are also confirmed. As suggested in the literature (Ghazaliet al. 2019), we were able to establish that PM affects the IOE confirming Payne et al.’s(2009) view on the interaction between player and brand.
This also brings a new insight to the work previously conducted by Kotler et al. (2019),because H6 also reinforces that engagement is not just in a downward motion, demonstratingthat the consumer can also be motivated to engage with the brand on their one.
We can also verify that GP influences BA, results that are in line with the reviewedliterature, where gamification tools are often pointed as instruments capable of influencingthat player’s attitude towards the brand (Huseynov and Dhahak 2020; Spears and Singh
Adm. Sci. 2021, 11, 92 15 of 20
2004). Not every game appeals to the same public and certainly not every game is a grantedsuccess; however, as we saw in the work of MacKay et al. (2009), the game offers aneffective platform for brand placement and thus supports the impact of brand attitude. Thebetter the gamification experience, the better the attitude the user will develop towardsthe brand.
5. Conclusions
The present research observed the interactions that users developed with the “Nike”brand throughout the use of the “Nike Run Club” application. The research is based ona quantitative methodology supported by an adaptation of the TAM model, seeking tovalidate the use of gamified digital applications as engagement and brand attitude tools,with the Portuguese consumers.
Seven hypotheses were formulated: H1: Perceived usefulness affects positively brandattitude; H2: Perceived ease of use affects positively brand attitude; H3: Perceived socialinfluence affects positively brand attitude; H4: Perceived social influence affects positivelyintention of engagement; H5: Intention of engagement affects positively brand attitude;H6: Player motivations affects positively intention of engagement; H7: Gamificationperformance affects positively brand attitude.
The results obtained demonstrated that, contrary to the data obtained in the originalpaper from Yang et al. (2017), it was possible to verify the existence of a correlation betweenBA and perceived usefulness (PU), perceived ease of use (PEU), and perceived socialinfluence (PSI). This correlation is supported by the fact that the majority of respondentsdemonstrate easiness when using the application and recognize that it is a useful tool inbrand marketing, validating H1–H3. It was possible to verify that, as indicated by theliterature (Huseynov and Dhahak 2020), there is an impact on BA, thus supporting H4.
In the sphere of the IOE, we found that the majority of respondents intend to use theseactivities again, with a large part assuming they will continue to use the Nike application.This is supported by the demonstrated correlation between IOE and BA, reflecting that thehigher the IOE, the greater the impact on BA and, therefore, supporting H5.
In line with the proposal by Ghazali et al. (2019), it was possible to establish acorrelation between the dimensions of player motivations (PM) and IOE, consequentlyvalidating H6. It was also possible to perceive, using the Chi-Square test, that age andgender tend to influence the types of favorite games, the adventure games having beenpointed out as the most accepted among men and women.
Finally, in gamification performance (GP), we found that badges and other gamifi-cation tools are perceived by the user as good engagement tools. This information is inline with the literature, supported by the observed correlation between GP and BA, thusconfirming H7.
This research presents three innovative aspects that result, in the first phase, from theadaptation of a TAM model previously tested by Yang et al. (2017), pretending to completeit by adding the dimensions “Gamification Performance” and “Player Motivations”. Thesecond innovative aspect is related to the fact that the sample is completed by individualsof different degrees of education and do not belong entirely to the academic environment,unlike previous studies. The third innovative aspect concerns the location of the sampleitself, which is entirely resident on Portuguese territory.
As for theoretical contributions, this research contributes to the existing literature andacademic knowledge in the areas of marketing and gamification, providing a suggestionfor the TAM model to be used in this type of research. It also contributes to a betterunderstanding of the relationship between gamification and marketing, demonstratingthat the use of gamified applications as engagement tools can have a positive impact on thebrand attitude, it being demonstrated that although Portugal is a peripherical country thatdemonstrates lower digital acceptance values when compared to the rest of the EuropeanUnion, the use of gamified applications presents itself with equal validity, as found incountries with more developed indexes.

Adm. Sci. 2021, 11, 92 16 of 20
On the practical side, it contributes as a consultation tool for brands, applicationdesigners, and marketers when defining engagement strategies, allowing a better under-standing of the factors that may or may not influence the public’s relationship with thebrands and what dynamics they should use in the development of new Gamified marketingsolutions.
Due to its specificity, the selected application can be pointed as being a research limi-tation as it was not possible to obtain a greater number of responses since the application isoriented towards sport and the sample had to be limited to practitioners of some type ofsports activity. To achieve a more uniform scope on the Portuguese market, it is importantto extend this research to a more diversified sample through the inclusion of questions inthe questionnaire, addressing themes without being connected to the use of the applicationunder investigation.
Another limitation found in the research is that possible usable gamification elementsare limited to the application under investigation. To enlarge the scope of the research,it would be important to be able to observe other gamified applications, with differentgamification elements.
It is also important to mention the inexistence of a significant number of articlesthat address gamification, which is even greater when the research is oriented to thePortuguese market, in turn justifying the continuation of research on this topic applied tothe Portuguese market.
As for future lines of investigation, it is recommended to broaden the scope of the re-search, allowing it to be replied by individuals who have never used a gamified applicationor have used completely different ones, to understand if the type of gamified applicationmay influence the results obtained. It would be pertinent to replicate this research in otherinternational markets to assess whether cultural or socioeconomic factors can influencethe validity of gamified applications. Given the COVID-19 pandemic, it would be alsoimportant to compare the validity of using gamified applications in pre-and post-pandemictimes.
In this research, only the interactions of users of the gamified application were an-alyzed. It would be interesting to hear opinions about gamified applications from otherstakeholders such as suppliers, store sellers, and others. It would also be interesting toinvestigate these dimensions more extensively in another type of sample and gamifiedstrategy.
Author Contributions: Conceptualization, I.R. and J.M.L.; methodology, A.B.; software, A.B.; vali-dation, J.O. and M.O.; formal analysis, A.B.; investigation, I.R., J.M.L. and J.O.; data curation, A.B.;writing—original draft preparation, I.R., J.M.L., A.B. and J.O.; writing—review and editing, M.O.;visualization, J.M.L.; supervision, J.M.L. All authors have read and agreed to the published versionof the manuscript.
Funding: This work was supported by the Foundation for Science and Technology “UIDB/04630/2020”.
Institutional Review Board Statement: Not applicable.
Informed Consent Statement: Not applicable.
Data Availability Statement: Not applicable.
Acknowledgments: The authors would like to thank the University of Minho, Polytechnic Instituteof Leiria, Miguel Torga Institute of Higher Education, University of Beira Interior, NECE—ResearchUnit in Business Sciences, ISAG—European Business School and Research Center in Business Sciencesand Tourism (CICET–FCVC), for their support.
Conflicts of Interest: The authors declare no conflict of interest.

Adm. Sci. 2021, 11, 92 17 of 20
ReferencesAcharya, A. S., A. Prakash, P. Saxena, and A. Nigam. 2013. Sampling: Why and how of it? Indian Journal of Medical Specialities 4.
[CrossRef]Alsawaier, R. S. 2018. The effect of gamification on motivation and engagement. International Journal of Information and Learning
Technology 35: 56–79. [CrossRef]Bovermann, K., and T. J. Bastiaens. 2020. Towards a motivational design? Connecting gamification user types and online learning
activities. Research and Practice in Technology Enhanced Learning 15: 1–18. [CrossRef]Bowden, J. 2009. The process of customer engagement: A conceptual framework. Journal of Marketing Theory and Practice 17: 63–74.
[CrossRef]Bruhn, M., V. Schoenmueller, and D. B. Schäfer. 2012. Are social media replacing traditional media in terms of brand equity creation?
Management Research Review 35: 770–90. [CrossRef]Byrne, B. M. 2013. Structural Equation Modeling with AMOS: Basic Concepts, Applications, and Programming, 2nd ed. New York: Routledge,
pp. 1–396. [CrossRef]Chen, L., and A. K. Aklikokou. 2020. Determinants of E-government Adoption: Testing the Mediating Effects of Perceived Usefulness
and Perceived Ease of Use. International Journal of Public Administration 43: 850–65. [CrossRef]Chen, A., Y. Lu, and B. Wang. 2016. Enhancing perceived enjoyment in social games through social and gaming factors. Information
Technology and People 29: 99–119. [CrossRef]Cho, E., and J. Son. 2019. The effect of social connectedness on consumer adoption of social commerce in apparel shopping. Fashion and
Textiles 6: 1–17. [CrossRef]Cook, E. C., C. Buehler, and R. Henson. 2009. Parents and peers as social influences to deter antisocial behavior. Journal of Youth and
Adolescence 38: 1240–52. [CrossRef] [PubMed]Davis, F. D. 1989. Perceived usefulness, perceived ease of use, and user acceptance of information technology. MIS Quarterly:
Management Information Systems 13: 319–39. [CrossRef]Davis, F. D. 1993. User acceptance of information technology: System characteristics, user perceptions and behavioral impacts.
International Journal of Man-Machine Studies 38: 475–87. [CrossRef]Deterding, S., K. O’Hara, M. Sicart, D. Dixon, and L. Nacke. 2011. Gamification: Using game design elements in non-gaming contexts.
Paper presented at Conference on Human Factors in Computing Systems, Vancouver, BC, Canada, May 7–12; pp. 2425–28.[CrossRef]
Djamasbi, S., A. L. Fruhling, and E. T. Loiacono. 2009. The influence of affect, attitude and usefulness in the acceptance of telemedicinesystems. Journal of Information Technology Theory and Application 10: 41–58.
Etikan, I. 2016. Comparison of Convenience Sampling and Purposive Sampling. American Journal of Theoretical and Applied Statistics 5: 1.[CrossRef]
Fornell, C., and D. F. Larcker. 1981. Evaluating Structural Equation Models with Unobservable Variables and Measurement Error.Journal of Marketing Research 18: 39–50. [CrossRef]
Gede, I. B., and A. Permana. 2019. The Impact of Task Technology Fit, System Quality and Information Quality To User Performance:Perceived Ease Usefullness and Perceived Ease of Use As Mediation. The International Journal of Organizational Innovation 12:335–40. Available online: http://www.ijoi-online.orghttp//www.ijoi-online.org (accessed on 3 May 2021).
Ghazali, E., D. S. Mutum, and M. Y. Woon. 2019. Exploring player behavior and motivations to continue playing Pokémon GO.Information Technology and People 32: 646–67. [CrossRef]
Goodpastor, W. A., and I. D. Montoya. 1996. Motivating physician behaviour change: Social influence versus financial contingencies.International Journal of Health Care Quality Assurance 9: 4–9. [CrossRef] [PubMed]
Greenwood, M. 2007. Stakeholder engagement: Beyond the myth of corporate responsibility. Journal of Business Ethics 74: 315–27.[CrossRef]
Hair, J. F., W. C. Black, B. J. Babin, and R. E. Anderson. 2010. Multivariate Data Analysis. Available online: https://books.google.com.my/books/about/Multivariate_Data_Analysis.html?id=JlRaAAAAYAAJ&pgis=1 (accessed on 3 May 2021).
Hamari, J., J. Koivisto, and H. Sarsa. 2014. Does gamification work?—A literature review of empirical studies on gamification.Paper presented at Annual Hawaii International Conference on System Sciences, Waikoloa, HI, USA, January 6–9; pp. 3025–34.[CrossRef]
Harmeling, C. M., J. W. Moffett, M. J. Arnold, and B. D. Carlson. 2017. Toward a theory of customer engagement marketing. Journal ofthe Academy of Marketing Science 45: 312–35. [CrossRef]
Hassan, M., S. S. A. S. Kazmi, and S. F. Padlee. 2019. Technology acceptance model (TAM) and dynamics of online purchase adaptability.International Journal of Recent Technology and Engineering 8: 390–402. Available online: https://www.researchgate.net/publication/334746159 (accessed on 3 May 2021).
He, Y., Q. Chen, and S. Kitkuakul. 2018. Regulatory focus and technology acceptance: Perceived ease of use and usefulness as efficacy.Cogent Business and Management 5: 22. [CrossRef]
Hernandez, B., J. Jimenez, and M. J. Martin. 2008. Business acceptance of information technology: Expanding TAM using industrysector and technological compatibility. International Journal of Enterprise Information Systems 4: 62–79. [CrossRef]
Hofacker, C., K. de Ruyter, N. Lurie, P. Manchanda, and J. Donaldson. 2016. Gamification and Mobile Marketing Effectiveness. Journalof Interactive Marketing 34: 25–36. [CrossRef]

Adm. Sci. 2021, 11, 92 18 of 20
Hollebeek, L. D., M. S. Glynn, and R. J. Brodie. 2014. Consumer brand engagement in social media: Conceptualization, scaledevelopment and validation. Journal of Interactive Marketing 28: 149–65. [CrossRef]
Huotari, K., and J. Hamari. 2017. A definition for gamification: Anchoring gamification in the service marketing literature. ElectronicMarkets 27: 21–31. [CrossRef]
Huseynov, F., and K. Dhahak. 2020. The Influence of Gamification on Online Consumers Attitude and Intention to Purchase FastMoving Consumer Goods. Business and Economics Research Journal 11: 769–91. [CrossRef]
Hussain, S., S. Qazi, R. R. Ahmed, D. Streimikiene, and J. Vveinhardt. 2018. Employees management: Evidence from gamificationtechniques. Montenegrin Journal of Economics 14: 97–107. [CrossRef]
INE. 2020. Densidade Populacional e População Residente. Consulted in January 2020. Available online: www.ine.pt (accessed on 3May 2021).
Instituto Nacional de Estatística. 2019. Portugal INCoDe.2030. Consulted in June 2021. Available online: www.incode2030.gov.pt(accessed on 3 May 2021).
Janes, J. 1999. Descriptive statistics: Where they sit and how they fall. Library Hi Tech 17: 402–9. [CrossRef]Jiang, Y., and J. Wen. 2020. Effects of COVID-19 on hotel marketing and management: A perspective article. International Journal of
Contemporary Hospitality Management 32: 2563–73. [CrossRef]Kamboj, S., S. Rana, and V. A. Drave. 2020. Factors Driving Consumer Engagement and Intentions with Gamification of Mobile Apps.
Journal of Electronic Commerce in Organizations 18: 17–35. [CrossRef]Karpen, I. O., and J. Conduit. 2020. Engaging in times of COVID-19 and beyond: Theorizing customer engagement through different
paradigmatic lenses. Journal of Service Management 31: 1163–74. [CrossRef]Kline, R. B. 2015. Principles and Practice of Structural Equation Modeling. New York: Guilford Publications.Kotler, P., H. Kartajaya, and D. H. Hooi. 2019. Marketing 4.0: Moving from Traditional to Digital. New York: John Wiley & Sons. [CrossRef]Kuo, M. S., and T. Y. Chuang. 2016. How gamification motivates visits and engagement for online academic dissemination—An
empirical study. Computers in Human Behavior 55: 16–27. [CrossRef]Larsson, R. 1993. Case Survey Methodology: Quantitative Analysis of Patterns Across Case Studies. Academy of Management Journal 36:
1515–46. [CrossRef]Lee, E. B., S. G. Lee, and C. G. Yang. 2017. The influences of advertisement attitude and brand attitude on purchase intention of
smartphone advertising. Industrial Management and Data Systems 117: 1011–36. [CrossRef]Lin, C. H., H. Y. Shih, and P. J. Sher. 2007. Integrating technology readiness into technology acceptance: The TRAM model. Psychology
and Marketing 24: 641–57. [CrossRef]MacKay, Thomas, Michael Ewing, Fiona Newton, and Lydia Windisch. 2009. The effect of product placement in computer games
on brand attitude and recall. International Journal of Advertising: The Quarterly Review of Marketing Communications 28: 423–38.[CrossRef]
MarketsandMarkets. 2020. Gamification Market Growth. Consulted in January 2020. Available online: www.marketsandmarkets.com(accessed on 3 May 2021).
Mattar, J., and W. Czeszak. 2017. Gamificação como um novo componente da indústria cultural. Revista Intersaberes 12: 60–67.[CrossRef]
McNab, A. L., and T. Hess. 2007. Reliability Generalization of Perceived Ease of Use, Perceived Usefulness and Behavioral Intentions.Paper presented at ICIS 2007, Montreal, QC, Canada, December 9–12. Available online: https://aisel.aisnet.org/icis2007/59(accessed on 3 May 2021).
Mitchell, A. A., and J. C. Olson. 1981. Are Product Attribute Beliefs the Only Mediator of Advertising Effects on Brand Attitude?Journal of Marketing Research 18: 318–32. [CrossRef]
Mitchell, R., L. Schuster, and J. Drennan. 2017. Understanding how gamification influences behaviour in social marketing. AustralasianMarketing Journal 25: 12–19. [CrossRef]
Moliner, M. Á., D. Monferrer-Tirado, and M. Estrada-Guillén. 2018. Consequences of customer engagement and customer self-brandconnection. Journal of Services Marketing 32: 387–99. [CrossRef]
Mora, A., D. Riera, C. Gonzalez, and J. Arnedo-Moreno. 2015. A Literature Review of Gamification Design Frameworks. Paperpresented at VS-Games 2015—7th International Conference on Games and Virtual Worlds for Serious Applications, Skovde,Sweden, Septermber 16–18.
Mutambara, D., and A. Bayaga. 2020. Rural-based Science, Technology, Engineering and Mathematics teachers’ and learners’ acceptanceof mobile learning. South African Journal of Information Management 22: 1–10. [CrossRef]
Nawaz, F., S. Shakeel, Z. Nawaz, and M. Ali Hamza. 2017. Acceptance of Social Fellow Groups for learning: Extension of TechnologyAssessment Model (TAM). LogForum 13: 151–57. [CrossRef]
Newman, I., and C. R. Benz. 1999. Qualitative-Quantitative Research Methodology: Exploring the Interactive Continuum. Carbondale:Southern Illinois University Press and SAGE Publications, vol. 28, Issue 2. [CrossRef]
Nobre, H., and A. Ferreira. 2017. Gamification as a platform for brand co-creation experiences. Journal of Brand Management 24: 349–61.[CrossRef]
Normalini, M. K. 2019. Revisiting the Effects of Quality Dimensions, Perceived Usefulness and Perceived Ease of Use on InternetBanking Usage Intention. Global Business and Management Research 11: 252–61.

Adm. Sci. 2021, 11, 92 19 of 20
Patel, K. J., and H. J. Patel. 2018. Adoption of internet banking services in Gujarat: An extension of TAM with perceived security andsocial influence. International Journal of Bank Marketing 36: 147–69. [CrossRef]
Patzer, B., B. Chaparro, and J. R. Keebler. 2020. Developing a Model of Video Game Play: Motivations, Satisfactions, and ContinuanceIntentions. Simulation and Gaming 51: 287–309. [CrossRef]
Paul, J., and S. Bhakar. 2018. Does celebrity image congruence influences brand attitude and purchase intention? Journal of PromotionManagement 24: 153–77. [CrossRef]
Payne, A., K. Storbacka, P. Frow, and S. Knox. 2009. Co-creating brands: Diagnosing and designing the relationship experience. Journalof Business Research 62: 379–89. [CrossRef]
Peng, R., L. Xiong, and Z. Yang. 2012. Exploring tourist adoption of tourism mobile payment: An empirical analysis. Journal ofTheoretical and Applied Electronic Commerce Research 7: 21–33. [CrossRef]
Pordata. 2019. População Residente, Média Anual: Total e Por Sexo. Consulted in November 2019. Available online: www.pordata.pt(accessed on 3 May 2021).
Portuguese Family Business Association. 2019. Annual Report AEF. Consulted in November 2019. Available online: www.empresasfamiliares.pt (accessed on 3 May 2021).
Rheinberg, F., and S. Engeser. 2018. Intrinsic motivation and flow. In Motivation and Action, 3rd ed. Berlin: Springer, pp. 579–622.[CrossRef]
Richter, G., D. R. Raban, and S. Rafaeli. 2015. Studying gamification: The effect of rewards and incentives on motivation. In Gamificationin Education and Business. Berlin: Springer, pp. 21–46. [CrossRef]
Ruangkanjanases, A., S. L. Hsu, Y. J. Wu, S. C. Chen, and J. Y. Chang. 2020. What drives continuance intention towards social media?Social influence and identity perspectives. Sustainability 12: 7081. [CrossRef]
Salesforce Research. 2019. State of the Connected Customer, 2nd ed. vol. 3. Available online: www.salesforce.com (accessed on 3 May2021).
Šebjan, U., S. Bobek, and P. Tominc. 2016. Factors influencing attitudes towards the use of CRM’s analytical tools in organizations.Organizacija 49: 28–41. [CrossRef]
Seiffert-Brockmann, J., W. Weitzl, and M. Henriks. 2018. Stakeholder engagement through gamification: Effects of user motivation onpsychological and behavioral stakeholder reactions. Journal of Communication Management 22: 67–78. [CrossRef]
Seitz, Victoria, and Nada Aldebasi. 2016. The Effectiveness of Branded Mobile Apps on User’s Brand Attitudes and Purchase Intentions.Review of Economic and Business Studies 9. [CrossRef]
Sharma, B. K., and V. K. Pal. 2020. Application of TAM model in teaching and learning—A behavioural study on social media.International Journal of Management Practice 13: 478–97. [CrossRef]
Silva, L. 2007. Post-positivist review of Technology Acceptance Model. Journal of the Association for Information Systems 8: 255–66.[CrossRef]
Spears, N., and S. N. Singh. 2004. Measuring attitude toward the brand and purchase intentions. Journal of Current Issues and Researchin Advertising 26: 53–66. [CrossRef]
Studen, L., and V. Tiberius. 2020. Social media, quo vadis? Prospective development and implications. Future Internet 12: 146.[CrossRef]
Subramanian, G. H. 1994. A Replication of Perceived Usefulness and Perceived Ease of Use Measurement. Decision Sciences 25: 863–74.[CrossRef]
Tegtmeier, T., S. Neofotistos, and N. A. Noormohamed. 2013. How Gamification Rewards College-Aged Consumer Loyalty: One Clickat a Time. American Society for Competitiveness 11: 177.
Tench, R., and B. Jones. 2015. Social media: The Wild West of CSR communications. Social Responsibility Journal 11: 290–305. [CrossRef]Teo, T. 2011. Factors influencing teachers’ intention to use technology: Model development and test. Computers and Education 57:
2432–40. [CrossRef]Thakur, R. 2019. The moderating role of customer engagement experiences in customer satisfaction–loyalty relationship. European
Journal of Marketing 53: 1278–310. [CrossRef]Vahdat, A., H. Hafezniya, Y. Jabarzadeh, and P. Thaichon. 2020. Emotional Brand Attachment and Attitude toward Brand Extension.
Journal of Services Marketing Quarterly 41: 1–20. [CrossRef]Vanduhe, V. Z., M. Nat, and H. F. Hasan. 2020. Continuance Intentions to Use Gamification for Training in Higher Education:
Integrating the Technology Acceptance Model (TAM), Social Motivation, and Task Technology Fit (TTF). IEEE Access 8: 21473–84.[CrossRef]
Vivek, S. D., S. E. Beatty, and R. M. Morgan. 2012. Customer engagement: Exploring customer relationships beyond purchase. Journalof Marketing Theory and Practice 20: 122–46. [CrossRef]
Weitzner, D., and Y. Deutsch. 2015. Understanding Motivation and Social Influence in Stakeholder Prioritization. Organization Studies36: 1337–60. [CrossRef]
Werbach, K., and D. Hunter. 2015. The Gamification Toolkit: Dynamics, Mechanics, and Components for the Win. Philadelphia: WhartonSchool Press.
Yang, Y., Y. Asaad, and Y. Dwivedi. 2017. Examining the impact of gamification on intention of engagement and brand attitude in themarketing context. Computers in Human Behavior 73: 459–69. [CrossRef]

Adm. Sci. 2021, 11, 92 20 of 20
Zhou, W., Z. Tsiga, B. Li, S. Zheng, and S. Jiang. 2018. What influence users’ e-finance continuance intention? The moderating role oftrust. Industrial Management and Data Systems 118: 1647–70. [CrossRef]
Zichermann, G., and C. Cunningham. 2011. Gamification by Design: Implementing Game Mechanics in Web and Mobile Apps. O’ReillyMedia, 1st ed. Newton: O’Reilly Media, Inc.