how the world views britain’s food - home | visitbritain · recommendations on their last trip to...
TRANSCRIPT
1
How the world views Britain’s foodForesight – issue 146
VisitBritain Research

2
Contents
1. Introduction
2. Summary
3. Food and tourismInterest in trying local and gourmet dishes when on holiday
Role of smartphones and social media in food and tourism
4. Expectations of Britain’s foodAssociations of Britain and food
Reasons for visiting Britain
5. Interest in Britain’s foodInterest in trying typical British dishes
6. Experiences of Britain’s foodVisitor satisfaction with British food

3
1. IntroductionFood is often not top of mind when tourists think about taking a trip Britain, and it often falls below
Britain’s great cultural and historical attractions in terms of appeal. Research shows that Britain’s food
and drink offering is not a strong driver for visiting. But what is the appeal of and satisfaction with
British food?
In this report we will look at how tourism and food are linked in general and at the perceptions of
British food. We will also look at the interest in trying different types of British dishes as well as the
actual experiences of visitors to the UK.

4
• Food and tourism:
– In general, a high proportion of travellers have tried a new food whilst on a recent trip. Many travellers are
keen to try out local specialities and nearly as many would like to have gourmet food whilst on holiday.
– Chinese travellers are most likely to use social media to look for food and drink recommendations, whilst
European travellers are least likely to do this.
– Over half (54%) of global travellers have used their smartphone to look at food or drink reviews whilst on a
holiday.
• Britain and food:
– Many travellers have a low association of Britain with food.
– Generally food is not a major reason why people visited the UK in 2015, and only 5% of visitors cited it as a
top 3 reason for coming in 2015.
• Trying British food:
– Despite it not being a strong motivator to visit, there is high interest in trying local food and drink in Britain.
– Many are open-minded to trying our local dishes, with 70% interested in trying at least one iconic British
dish.
– Women are more likely to be open to trying British dishes and new food in general.
– British desserts and beer are appealing to travellers, and many would like to try a British pudding or a craft
beer.
• Satisfaction with food:
– Over three quarters of visitors to the UK in 2015 were satisfied with their food and drink. This falls behind
satisfaction for attractions or transport but is ahead of satisfaction with value for money.
2. Summary

5
3. Food and Tourism

6
Interest in trying local and gourmet food on
holidayWhen thinking about travel in general, food does generate a good level of interest, and it is clear that tourism
and food are linked.
According to a study conducted in 2013, a high proportion of travellers are keen to enjoy local specialities when
on holiday, as well as higher quality gourmet food and drink.
Over two third (70%) of travellers would be interested in trying local specialities when on holiday, and a lower
proportion (64%) are interested in trying high quality gourmet food. Around a third do not have strong
preference or interest in trying either types of food on holiday, and only a small proportion (3% and 4%) would
be actively disinterested in trying these food types.
Source: Arkenford/VisitBritain (2013), The extent to which you want the following on holiday – ‘Enjoy local specialities (food and drink)’, ‘Enjoy high quality food and drink
(gourmet food)’
Base: Total n=23,229 in 23 markets (Australia, Brazil, Canada, China, France, Germany, India, Italy, Japan, Netherlands, Russia, Saudi Arabia, South Africa, South Korea,
Spain, Sweden, Turkey, UAE, USA)
70%
28%
3%
Local specialities (food and drink)
64%
33%
4%
High quality food and drink (gourmet food)
Interested
Neutral
Not Interested

7
Trying local and gourmet foodGender, AgeOverall, women are more interested than men in trying both local specialities and more high end food (6% and 5%
higher respectively).
It is also evident that those aged between 25 and 50 are likely to be more adventurous with food choices when on
holiday, as higher proportions within this age group would be interested in trying both local specialities or gourmet
food. Those aged under 25 are less likely to be interested in local specialities (63% v 70% of totally) and those aged
over 64 are less likely to want to try gourmet food than their younger counterparts.
70%67%
73%
63%
72% 72% 73%68% 65%64%
61%66%
59%
67% 66% 66%
60%
52%
Total Male Female Under 25 25-34 35-44 45-50 51-64 Over 64
Would like to try the following on holiday Enjoy local specialities
High quality food and drink (gourmet)
Source: Arkenford/VisitBritain (2013), The extent to which you want the following on holiday – ‘Enjoy local specialities (food and drink)’, ‘Enjoy high quality food and drink
(gourmet food)’
Base: Total n=23,229 in 23 markets, Male n=11,986, Female n=11,243, Under 25 n=3,540, 25-34 n=7,483, 35-44 n=5,629, 45-50 n=2,607, 51-64 n=3,272, Over 65 n=698

8
Trying local and gourmet foodMarketsIn general, there is a higher interest in trying local specialities than gourmet food in most markets. Brazil and China
are most interested in trying local food (79% and 78% respectively), whilst the Netherlands and Turkey are at the
other end of the scale. Germans are much more likely to be interested in local specialities than gourmet food (72%
v 40%) whilst the division is not so large in other markets.
Saudi Arabia and Japan are the only two markets that have a stronger preference for gourmet food rather than local
specialities when they are on holiday.
Travellers from the USA are quite likely to be interested in both with 72% keen to try local specialities and 63%
would enjoy gourmet food. Figures are a little lower in France; just under two thirds would enjoy local specialities
and half would be interested in trying gourmet food when on holiday.
70%
60%
79%
63%
78%
64%
72% 70%64%
53%48%
64%
60%
66%63%
67%62% 62%
72%
64%
49%
75%
55%
78%
50%
40%
69%
47%
59%
45%
57%61%
53%
45%
54%49%
60%
63%
Would like to try the following on holiday Enjoy local specialities
Enjoy high quality food and drink (gourmet)
Source: Arkenford/VisitBritain (2013), The extent to which you want the following on holiday – ‘Enjoy local specialities (food and drink)’, ‘Enjoy high quality food and drink
(gourmet food)’
Base: Total n=23,229, approx. n=1000 per market.

9
Trying a new food on holidayGender, AgeWhen on holiday, most travellers are fairly
adventurous and keen to try new food. Overall 81%
have tried a new food for the first time, whilst on a
recent holiday.
In general, women are slightly more adventurous
than men, with 83% having tried a new food,
compared with 80% of men. Again, those aged 25 –
50 seem to be more adventurous with food, and
greater than 80% of this age group have recently
tried a new food.
Those aged over 65 are least likely (71%) to have tried a new food whilst on a recent holiday.
81%
80%
83%
79%
84%
84%
82%
78%
71%
19%
20%
17%
21%
16%
16%
19%
22%
29%
Total
Male
Female
Under 25
25-34
35-44
45-50
51-64
Over 64
Have tried a new food for the first time on holiday in the last 3/5 years
Yes No
Source: Arkenford/VisitBritain (2013), Have you done this activity on holiday in the past 3/5 years? ‘Tried a new food for the first time’
Base: Total n=23,229, Male n=11,986, Female n=11,243, Under 24 n=3,540, 25-34 n=7,483, 35-44 n=5,629, 45-50 n=2,607, 51-64 n=3,272, Over 65 n=698

10
Trying a new food on holidayMarkets
Travellers from China are most likely to have tried
a new food on a recent holiday, with 89% saying
that they have done this.
Other markets who have been adventurous with
trying new foods on holiday are Brazil, India, Italy,
Spain and the USA, where more than 80% have
tried a new food within the last 3-5 years.
The markets that are least adventurous are Japan,
where only 61% have tried a new food, and the
Netherlands, with only 58%.
70% of French have tried a new food on holiday
recently, and 76% of Germans have done the
same.
89%
87%
85%
83%
80%
80%
79%
77%
76%
75%
75%
74%
73%
73%
72%
71%
70%
61%
58%
11%
13%
15%
17%
20%
20%
21%
23%
24%
25%
25%
26%
27%
27%
28%
29%
30%
39%
42%
China
Brazil
India
Italy
Spain
USA
UAE
Russia
Germany
Australia
South Korea
Canada
Sweden
New Zealand
Turkey
Saudi Arabia
France
Japan
Netherlands
Have tried a new food for the first time on holiday in the last 3/5 years
Yes No
Source: Arkenford/VisitBritain (2013), Have you done this activity on holiday in the past 3/5 years? ‘Tried a new food for the first time’
Base: Total n=23,229 in 23 markets

11
Using social media for food & drink
recommendationsTo what extent are social media and peer reviews being sought as well as
traditional reviews?
Travellers from China are most likely (56%) to use social media to look for food
and drink recommendations, followed by Brazil (47%), India (44%) and UAE
(39%).
European countries are less likely to use social media for looking for food and
drink recommendations: just 15% from France and 18% from Germany.
Travellers from the USA have a higher likelihood to use social media in this way,
with just over a third (34%) from USA having used social media to look for
recommendations on their last trip to Britain or holiday abroad.
Source: IPSOS/VisitBritain. Have you used social media in any of the following ways whilst on your last holiday to Britain (visitors) /on your last holiday to a foreign destination (considerers)? ‘Look
for recommendations for places to eat or drink’
Base: International travellers who have been to or would consider Britain as a travel destination All Respondents (11400), Australia (600), Brazil (600), Canada (600), China (600), India (600), Japan
(600), New Zealand (600), Russia (600), Saudi Arabia (347), South Korea (600), United Arab Emirates (253), United States (600), Denmark (600), France (600), Germany (600), Italy (600),
Netherlands (600), Norway (600), Spain (600), Sweden (600)
23%
47%
22%
56%
18% 19%15%
44%
28%
22%
15%
30%33%
39%34%
27% 27%
39%34%
Have you used social media to look for recommendations for places to eat or drink?% Yes
have used social media for
recommendations to eat or drink
30%
Global average

12
Using a smartphone to find food and drink
reviewsOver half have used their smartphone to access reviews about where to
eat and drink when they are on holiday.
This does vary greatly by market, with certain markets having a very high
propensity to do this – Brazil 75%, India 69%, USA 68%, Italy 68% and
China 66%.
Half of travellers from France have done this, and just a third of travellers
from Germany have done the same.
On the flip side, 46% from Germany are not interested in doing this at all,
followed by Japan (41%) and Netherlands (41%).
Source: IPSOS/VisitBritain. Which of the following have you done on holiday and which would you like to do in the future? ‘Used a smartphone to access reviews about places to eat or drink’
Base: International travellers, All Respondents (11400), Australia (600), Brazil (600), Canada (600), China (600), India (600), Japan (600), New Zealand (600), Russia (600), Saudi Arabia (347),
South Korea (600), United Arab Emirates (253), United States (600), Denmark (600), France (600), Germany (600), Italy (600), Netherlands (600), Norway (600), Spain (600), Sweden (600)
have used a
smartphone to
access reviews
about places to
eat and drink
when on holiday
50%
75%
51%66%
37%50%
32%
69% 68%
28%
34%
53% 59% 63% 60% 62%52% 47%
68%
24%
18%
25%
29%
27%24%
21%
26%18%
29%24%
25%26%
27% 31% 26%
23%40%
21%
25%
7%
24%
5%
36%26%
46%
6%14%
42% 41%
22% 16% 10% 10% 12%25%
13% 11%
Have you used a smartphone to access reviews about places to eat or drink?
Have done Not done, but interested in Not interested
54%
Global average

13
4. Expectations of Britain’s
food
Footer

14
Association of Britain and foodWhen asked which products they would associate with Britain for the 2015 Nation Brands Index study, the UK ranked
21st out of 50 for being associated with food as an export.
In general, 19% of those surveyed in the 2015 NBI study would associate Britain with food and this does vary a lot by
market. Countries that have a strongest association with Britain and food are South Africa (36%) India (27%) and
Australia (23%).
Countries that have the lowest association of Britain with food are Japan at just 7% and South Korea at 9%.
France and Italy, countries which typically score very well in terms of perceptions of their own food, do not score us
very favourably at all. Just 10% in each France and Italy would connect Britain and food.
Source: GFK NBI 2015. Please pick the category of product or service you would most expect to be produced in each country: % Food
Base: n=500 per market
19%
12%
23%
15%21% 20% 21%
10%15%
27%
10%7%
17% 17% 15%
36%
9%
18%14%
19%
Associate Britain with food (%)
Out of 50 NBI countries
#21 UK

15
Britain’s associations with local and
gourmet foodOf the 7 markets offered, France and Italy have high associations with both local specialities and high quality food and
drink. Italy is most likely to be associated with local specialities (93%) and also gourmet food (95%).
Britain falls behind some of the more well-known markets in terms of food associations, with just 55% associating
Britain with local specialities and 54% with high quality food and drink. Britain does, however, rank slightly higher than
the Netherlands for gourmet and both Netherlands and the USA for local specialities.
% who think the country is a good
place to get local specialities
Source: Arkenford/VisitBritain (2013), Of the following things that you have said you are looking for from a holiday, which of the following markets do you associate them
with?
Base: Those who consider each aspect important when on holiday: Total n=23,229
55%
90% 93%
65%
53%
73%
54%
GreatBritain
France Italy Australia USA Germany Netherlands
54%
92% 95%
61% 62%67%
48%
GreatBritain
France Italy Australia USA Germany Netherlands
% who think the country is a good
place to get high quality gourmet food

16
Reasons for visiting Britain
Amongst holiday visitors to the UK in 2015, food was not
often cited as a top reason for visiting the UK. The most
mentioned reasons were for heritage and history (36%),
culture (30%) and to see world famous places (29%).
Going out to eat and drink is a key reason for just 5% of UK
visitors, showing that it is not a strong driver why visitors
chose Britain as a destination. However, that is not to say
that our food does not delight or appeal to overseas tourists
but that it is not a primary reason for visiting. It could be that
eating out and drinking takes a back seat to the other
activities on offer in Britain, or is seen a hygienic factor –
something expected to meet a certain standard, but not
expected to wow.
Source: ONS IPS 2015: Why did you choose to visit the UK this time? Please choose up to 3 reasons.
Base: All departing holiday visitors to the UK (excluding ‘don’t know/NA’, and ‘didn’t choose’) n=12,025
36%
30%
29%
24%
23%
16%
11%
5%
3%
Heritage/history
Culture
To see world famous places
Visiting family/ friends
Shopping
Relaxation
Countryside/ outdoors/adventure
Going out to eat/drink
Sport
Reason for visiting UK

17
Reasons for visiting BritainVisitors v Considerers
Visitors (those who have visited Britain for a holiday) and Considerers (those who have not
been, but would consider visiting) have differing opinions when it comes to Britain and food.
Overall, it appears that Considerers are more positive about ‘sampling the local food and
drink’ in Britain, and 24% say it could motivate them to visit.
Compared to Considerers, Visitors are less likely (18%) to say it was a key reason why they
chose to visit, which reinforces that food is less likely to be a key motivator for actual visitors
but could be a factor in persuading Considerers. Food is more likely to have been a key
motivator for Visitors from some markets; 44% from China and 26% from Russia.
In terms of our largest inbound markets, visitors from France and Germany rank us on par
with the average whilst considerers are slightly less optimistic about our food. Visitors and
considerers from the USA are slightly more likely to see food and drink as a motivator and a
reason for visiting.
Source: IPSOS/VisitBritain, When you visited Britain on holiday, which of the following were the most important reasons why you chose to visit? Which of the following
would be the most important motivators for you to visit Britain on holiday in the future? Please choose up to 5. ‘Sampling the local food and drink’
Base: Britain Visitors n=4,754, Considerers n=5,555
18%
13%
24% 23%
44%
21%17% 17% 18% 17%
10%13% 12% 12%
10%
26%
14% 13%
18% 19%
24% 24%
29%27%
39%
31%
17% 17%20%
17%15%
27%
18%22%
19%
33%
27%
18%
26% 27%
‘Sampling the local food and drink’ is a reason or motivator to visit Britain on holiday
Visitor Considerer
Rank of ‘sampling the
local food and drink’
as a reason or
motivator for visiting
Britain on holiday
(out of 24 reasons)
#7 (Considerers)
#13 (Visitors)

18
5. Interest in British cuisine

19
Interest in trying local food and drink in Britain
In the 2014 Nation Brands Index
study, we saw that there was a high
level of interest in trying British food
and drink, with 55% interested in
doing this on a holiday to Britain.
Trying local food and drink rated
ahead of interest in seeing famous
attractions (49%) and visiting big
cities (47%).
In the 2015 Nation Brands Index
study we asked what kinds of iconic
British food people would like to try,
which will be revealed in the following
slides.
Source: GFK NBI July 2014. Imagine that you are going to be spending a week on holiday exploring Britain. To what extent would you be interested in doing each of the
following things? 7 point scale, ‘Completely interested’ to ‘Completely not interested’
Base: n=500 per market
6%
6%
6%
7%
6%
9%
9%
15%
12%
16%
40%
45%
47%
47%
47%
50%
55%
50%
57%
52%
55%
49%
47%
46%
46%
41%
37%
36%
32%
31%
Try local food and drink
See lots of famous attractions
Visit big cities
Visit the countryside
Go off the beaten track
Use a train to travel from place to place
Take day trips to other locations
Rent a Car
Have a planned itinerary
Be on a fully guided tour
Not interested Neither Interested
Interest in doing each of the following things on a trip to Britain

20
Interest in trying British dishes
Source: GFK NBI 2015. Imagine that you are going to be visiting Britain on holiday. To what extent would you be interested in trying the following British foods? (7 point
scale)
Base: n=500 per market
When asked about which specific British dishes people would like to try, some dishes
generate more interest than others. The typical Full English Breakfast is the most popular
dish with 49% saying they would like to try this if on a hypothetical holiday to Britain. After
this dish, the next most popular is the Roast Dinner with 46% interested in trying.
Fish and Chips and Afternoon Tea both rank equally with 45% interested in trying, whilst
Pie and Mash and Curry are the least popular food choices, generating interest amongst
just a third.
49% 46% 45% 45% 35% 33%
Full English
Breakfast
Roast Dinner Fish and Chips Afternoon Tea Pie and mash British-style Curry
50% are extremely
interested and 71%
either extremely or
very interested in
trying at least one of
the below British
dishesInterest in trying the following British foods:
31% 28% 28% 29%21% 19%
17% 18% 17% 16%
14% 14%
(Extremely
& Very
interested)
Extremely
interested
Very
interested

21
Interest in trying British dishesVisitors v Non-visitors
53%49%
51% 51%
37%39%
48%46% 44% 44%
35%31%
Full EnglishBreakfast
Roast Dinner Fish and Chips Afternoon Tea Pie and Mash British-Style Curry
Interest in trying the following British foods(Extremely and very interested)
Visited
Not Visited
Source: GFK NBI 2015. Imagine that you are going to be visiting Britain on holiday. To what extent would you be interested in trying the following British foods?
Base: n=500 per market
For all British dishes asked about, those who have previously visited the UK are more likely to be interested in
trying British food than those who have not visited. This indicates that the reality of British food might be better and
more appealing that the expectation, as Visitors may well have already tried some of these dishes.
Interest in Full English Breakfast increases to 53% amongst those who have visited (still in 1st place), and Fish and
Chips and Afternoon Tea rise to 2nd and 3rd place. British-Style Curry appeals to 39% of visitors and 31% of those
who have not yet visited.
22
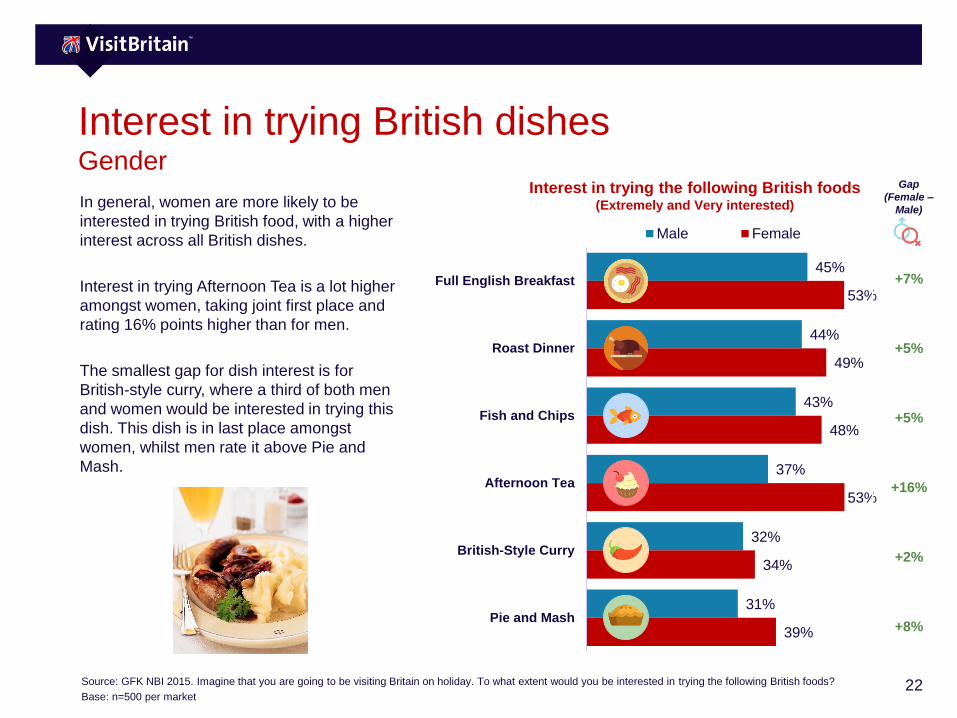
Interest in trying British dishesGender
In general, women are more likely to be
interested in trying British food, with a higher
interest across all British dishes.
Interest in trying Afternoon Tea is a lot higher
amongst women, taking joint first place and
rating 16% points higher than for men.
The smallest gap for dish interest is for
British-style curry, where a third of both men
and women would be interested in trying this
dish. This dish is in last place amongst
women, whilst men rate it above Pie and
Mash.
45%
44%
43%
37%
32%
31%
53%
49%
48%
53%
34%
39%
Full English Breakfast
Roast Dinner
Fish and Chips
Afternoon Tea
British-Style Curry
Pie and Mash
Male Female
Gap
(Female –
Male)
+7%
+5%
+5%
+16%
+2%
+8%
Source: GFK NBI 2015. Imagine that you are going to be visiting Britain on holiday. To what extent would you be interested in trying the following British foods?
Base: n=500 per market
Interest in trying the following British foods (Extremely and Very interested)

23
Interest in trying British dishesMarkets
Brazil, Argentina and Mexico, the South and Central American markets, are most interested in trying British food
with 66% of Brazilians interested in trying a Full English Breakfast.
Other English speaking nations (Australia, USA, Canada) are also relatively interested in trying British dishes, with
the Roast Dinner ranking first in Australia whilst Fish and Chips is top in USA and Canada.
European nations tend to have similar opinions and have average interest in British food, although Italians are most
interested in trying Afternoon Tea.
At the other end of the scale, Japan and South Korea are least interested in British food, with just 11% of Japanese
interested in trying Pie and Mash.
Source: GFK NBI 2015. Imagine that you are going to be visiting Britain on holiday. To what extent would you be interested in trying the following British foods?
Base: n=500 per market
Interest in trying the following British foods (Extremely and very interested):
TOTAL Argentina Australia Brazil Canada Germany France Italy Japan Mexico Poland S. Korea Sweden USA
Full English
breakfast49% 63% 57% 66% 53% 46% 44% 44% 21% 63% 47% 29% 49% 52%
Traditional
Roast Dinner46% 50% 61% 56% 54% 36% 41% 43% 25% 64% 47% 35% 39% 53%
Fish and
Chips45% 37% 56% 57% 57% 39% 45% 44% 24% 52% 40% 31% 48% 56%
Afternoon
Tea45% 61% 53% 53% 46% 32% 39% 48% 26% 55% 46% 28% 48% 46%
British-style
curry33% 39% 36% 41% 29% 29% 34% 31% 22% 52% 36% 22% 32% 28%
Pie and Mash 27% 30% 38% 37% 34% 21% 27% 29% 11% 30% 25% 15% 27% 38%

24
Meat and Traditional
Seafood Sweet FoodsDrinks
Interest in trying other British food and drinks
Haggis
Bangers and
Mash
Scampi
Fresh
seafood
Shepherd’s pie
Trifle
Whisky
Jelly
Tea Apple Pie
Cider
Ham & Eggs
Mint sauceSteak
Jellied Eels
Ploughman's
Scones
Toad in
the hole
Cakes
Pudding
Beer
Aside from the main dishes that we asked about,
many are keen to try lots of different types of British
dishes and foods.
There are two main themes coming through in
particular – desserts and drinks. There is interest in
trying British desserts such as cakes, puddings and
pies which might be influenced by famous TV shows
such as British Bake Off. In terms of drinks, beer
comes through strongly, and in particular there are
some references to craft beer.
Plum Pudding
Source: GFK NBI 2015. Imagine that you are going to be visiting Britain on holiday. To what extent would you be interested in trying the following British foods? ‘Other’
Base: All respondents who selected that they would like to try a dish not mentioned in the list n=2,152

25
6. Experience of British food

26
Visitor satisfaction with Britain’s food and drink
Source: ONS IPS 2015: How satisfied were you with your visit to the UK for: ‘Food and Drink’. On a scale of 1 – 5.
Base: Departing overseas visitors who stayed at least 1 night. Total n=31,933
The majority (78%) of overnight visitors to the UK were satisfied with the food and drink that they experienced
whilst in the UK, with 39% saying that they were ‘very satisfied’. This shows that the experience of British food is
generally positive.
However, food and drink does score lower for satisfaction than two other elements that visitors were asked about,
such as attractions / activities and transport. This confirms again that attractions and activities are a strong selling
point for Great Britain ahead of our food and drink. Food and drink still generates higher overall satisfaction than
for ‘value for money’, which is the weakest score in this case.
1% 1% 6%1%2% 4%
20%
7%9%
17%
34%
29%29%
39%
26%63% 58%
39%
14%
Attractions/Activities Transport Food & Drink Value for Money
Top 2 box (Extremely
& Fairly satisfied) %92% 88% 78% 41%
Very satisfied
Quite satisfied
Neither
Quite dissatisfied
Very Dissatisfied
Satisfaction with the following aspects during trip to UK

27
Visitor satisfaction with Britain’s food and drink Gender, Age, Journey Purpose
Source: ONS IPS 2015: How satisfied were you with your visit to the UK for: ‘Food and Drink’. On a scale of 1 – 5.
Base: Departing overseas visitors who stayed at least 1 night. Total n=31,933
Women more likely to be satisfied with British
food than men (79% v 77%).
There is a link between age and satisfaction, as
those who are older have a higher satisfaction
with British food, and those aged 16-24 have the
lowest satisfaction (72%).
Holiday travellers rate British food the same as
the average for satisfaction (78%), business
slightly lower (75%) and VFR slightly higher
(82%).
VFR travellers might have an advantage when
staying with friends or relatives, with the ability
to ‘live like a local’ and experiencing hidden
gems that are off the beaten tourist routes.
78%
77%
79%
72%
77%
79%
79%
82%
82%
78%
75%
82%
60%
78%
Total
Male
Female
16-24
25-34
35-44
45-54
55-64
65+
Holiday
Business
VFR
Study
Misc
Satisfaction with food and drink in the UK (Extremely and Fairly likely)

28
Visitor satisfaction with Britain’s food and drinkMarkets
Source: ONS IPS 2015: How satisfied were you with your visit to the UK for: ‘Food and
Drink’. On a scale of 1 – 5.
Base: Departing overseas visitors who stayed at least 1 night. Total n=31,933
Satisfaction with food and drink experienced
whilst in the UK is highest amongst Gulf states,
with over 90% of those who visited from Kuwait,
Qatar and Bahrain satisfied with our food.
Some other large long-haul markets, Canada,
USA and India, also rate British food highly.
Italy and France are less satisfied with British
food, with 71% of French saying they were
satisfied, and 61% from Italy.
Japan rates Britain lowest for food overall, with
just 60% saying that they were satisfied with the
food they experienced on their trip to the UK.
39%
62%
57%
77%
52%
53%
50%
60%
47%
50%
55%
43%
60%
56%
41%
36%
44%
33%
36%
41%
40%
30%
33%
34%
34%
29%
29%
25%
26%
34%
39%
32%
36%
15%
38%
36%
38%
27%
39%
36%
30%
42%
23%
27%
42%
45%
37%
47%
42%
37%
39%
46%
40%
39%
38%
43%
42%
37%
36%
26%
78%94%93%92%
90%89%88%87%86%86%85%85%
83%83%83%
81%81%80%
78%78%79%
76%73%73%72%72%71%
62%62%
60%
Total
Kuwait
Qatar
Bahrain
Canada
USA
India
UAE
Norway
Irish Republic
Brazil
Australia
Saudi Arabia
Russia
Switzerland
Oman
Denmark
Netherlands
Sweden
Turkey
Poland
Hong Kong
South Korea
China
Germany
Belgium
France
Spain
Italy
Japan
Satisfaction with food and drink in the UK
Extremely Satisfied Satisfied

29
Appendix

30
Information sources used in this report
Source: GFK NBI
Study Name: Anholt Nation Brand Index
Date: Annually, July (2014 and 2015 data used in this report)
Sample: Online fieldwork. 500 per market
Markets: Argentina, Australia, Brazil, Canada, China, Germany, Egypt, France, India, Italy, Japan, South Korea, Mexico, Poland, Russia,
South Africa, Sweden, Turkey, UK, USA
Source: ONS
Study Name: International Passenger Survey
Date: Continuous study, 2015.
Sample: Face to Face fieldwork. International visitors departing from the UK, sample size varies.
Markets: Australia, Bahrain, Belgium, Brazil, Canada, China, Denmark, France, Germany, Hong Kong, India, Irish Rep, Italy, Japan, Kuwait,
Netherlands, Norway, Oman, Poland, Qatar, Russia, Saudi Arabia, South Korea, Spain, Sweden, Switzerland, Turkey, UAE, USA
Source: Arkenford/VisitBritain
Study Name: Arkenford
Date: 2013
Sample: Online fieldwork. 1000 international travellers per market.
Markets: USA, South Africa, China, Saudi Arabia, UAE, Indonesia, Canada, Netherlands, Turkey, India, Australia, New Zealand, France,
Germany, Italy, Japan, Mexico, Brazil, Russia, South Korea, Spain, Sweden, Singapore
Source: IPSOS/VisitBritain
Study Name: Decisions & Influences
Date: 2016
Sample: Online fieldwork. Up to 600 Visitors or Considerers to the UK per market
Markets: Australia, Brazil, Canada, China, India, Japan, New Zealand, Russia, Saudi Arabia, South Korea, UAE, USA, Denmark, France,
Germany, Italy, Netherlands, Norway, Spain, Sweden

31
AppendixThere is more general information about VisitBritain Research on our website:
www.visitbritain.org/research. It is possible to find more detail about all of VisitBritain’s priority
markets, including the latest quarterly data from the International Passenger Survey, by
exploring the Insights & Statistics pages of our website.
In addition to being able to manipulate data through a series of visualisations our Market and
Trade Profiles provide a comprehensive summary of each market including trends, attitudes
and characteristics.
The icons are all designed by Freepik and distributed by Flaticon.

32