how to carve up the world: learning and collaboration for structure
TRANSCRIPT
How to carve up the world:Learning and collaboration for structure
recommendationMathias Verbeke, Ilija Subasic, and Bettina BerendtDepartment of Computer Science, KU Leuven, Belgium{mathias.verbeke,bettina.berendt}@cs.kuleuven.be
Abstract. Structuring is one of the fundamental activities needed tounderstand data. Human structuring activity lies behind many of thedatasets found on the internet that contain grouped instances, such asfile or email folders, tags and bookmarks, ontologies and linked data.Understanding the dynamics of large-scale structuring activities is a keyprerequisite for theories of individual behaviour in collaborative settingsas well as for applications such as recommender systems. One centralquestion is to what extent the “structurer” – be it human or machine– is driven by his/its own prior structures, and to what extent by thestructures created by others such as one’s communities.In this paper, we propose a method for identifying these dynamics. Themethod relies on dynamic conceptual clustering, and it simulates an in-tellectual structuring process operating over an extended period of time.The development of a grouping of dynamically changing items followsa dynamically changing and collectively determined “guiding grouping”.The analysis of a real-life dataset of a platform for literature managementsuggests that even in such a typical “Web 2.0” environment, users areguided somewhat more by their own previous behaviour than by theirpeers. Furthermore, we also illustrate how the presented method can beused to recommend structure to the user.
Keywords: Collaborative classification, social web mining, user mod-elling, structure recommendation, divergence measure
1 Introduction
Nowadays, people are faced with a huge amount of data, originating from theincreasing amount of emails, stored documents, or scientific publications. Justas people order their CD collection according to genre, sort books on shelvesby author, or clothes by colour, it lies in the human nature to structure digitalitems. This is supported by the directory structure on desktop computers ortags for bookmarks, photos, and online publications. The structuring of data isa diverse process, and the grouping of a set of items into subsets can be seen asinvesting it with semantics: a structuring into sets of items, each instantiating aconcept.
In addition, these concepts depend on each other: One concept is what theother is not; there is meaning not only in assigning an item to a concept, but also
2 Mathias Verbeke, Ilija Subasic, and Bettina Berendt
in not assigning it to another concept; and the abstract concepts co-evolve withthe assignment of concrete instances to them. This feature makes an analysis ofgrouping more complex than an analysis just focusing on “bipartite” relationsbetween items and concepts, on the growth of concept vocabulary over time, etc.
Since the end result of grouping will depend on the context, tasks, and pre-vious knowledge of the “structurer”, there is no overall “optimal” grouping.Grouping according to needs and knowledge is a prerequisite for the grouping tomake sense to the user. Despite the personal nature of this process, people tendto be influenced by others – be it their real-life social circle, their online friends,or social recommender systems, which could steer the user (and the grouping)in a certain direction.
A good understanding of the dynamics of these structuring activities is akey prerequisite for theories of individual behaviour in collaborative settings,and it is necessary to improve the design of current and next generation (social)recommender systems [1, 15]. Furthermore, it can leverage the design of mecha-nisms that rely on implicit user interactions such as social search [10, 8]. The goalof this paper is to develop a dynamic conceptual clustering [20] that simulatesthis intellectual structuring process which is able to identify these structuringdynamics. The evolution of the grouping of an individual user is influenced bydynamically changing and collectively determined ”guiding grouping(s)”, whichwe will refer to as guides. In this paper, we investigated two types of guides. Thefirst one is motivated by a “narrow” view of the structurer’s prior grouping be-haviour and experience, while the second one starts from a “wider” perspectivethat also takes peer experience into account in grouping decisions.
The process in which we want to transfer the structuring of one set of items toanother set of items is a combination of two data mining tasks. First, we learna model for this grouping (classification), which can be applied to structurealternative sets of items. We refer to this model as the grouping’s intension, asopposed to its extension, which is the original, un-annotated grouping of theitems. The first task starts with an extension of a structuring, and learns itsintension as a classification model. The second task is to use the intensions ofthe peer groupings and apply their classifiers for prediction, to structure a newitem. It starts from defining the k nearest peer groupings for a user. To decideon the k nearest peer groupings in a situation where peers group different items,we defined a novel measure of divergence between groupings that may have adifferent number and identities of items. Once we obtain the k nearest peers,the task is to decide on item-to-group assignment using their groupings. Basedon the presence of an item in peer groupings, this decision is based either onthe extension of the peer grouping (when a peer already grouped the item) oron its intension (when a peer has not grouped the item yet). By comparing thepossible end groupings with the actual end grouping, we see which guide is morelikely to have determined the actual process.
Our main contributions are: (a) a new data-mining approach that learns anintensional model of user groupings and uses these to group new items. Themethod can be used to identify structuring dynamics, which simulates an in-
Learning and collaboration for structure recommendation 3
tellectual structuring process operating over an extended period of time, (b) anew divergence measure to define divergence between groupings of non-identicalitem sets, (c) a study of grouping behaviour in a social bookmarking system,and (d) two systems illustrating the proposed method to recommend structureto the user.
This paper is structured as follows. The following section reviews relatedwork. Section 3 describes the method for identifying the structuring dynamicsvia grouping guidance, where we first outline the general system workflow andsubsequently present a formalisation of the different parts. Section 4 containsan empirical analysis of this process that centres on item grouping in a real-lifedata set. In Section 5 we show that the grouping of new objects can also be usedto recommend structure to a user, which is illustrated by means of two systemsembodying this idea. Finally, Section 6 concludes the paper and presents anoutlook for future work.
2 Related work
Our work is closely related to the research on personalised information organisa-tion, where the goal is to understand how the user can be supported in search-ing, exploring, and organising digital collections. This field studies how usersstructure data collections. Current approaches usually concentrate on individualaspects such as search (e.g. personalised ranking), rudimentary exploration sup-port and visualisation. In [18] the authors present a taxonomy of the featuresthat can be used for this purpose. They introduce content-based features (e.g.,word distributions), content-descriptive features (e.g., keywords or tags describ-ing textual or image content), and context-independent metadata (e.g., creator)features. The key questions from this domain that are relevant to the topic of thispaper are: How is it possible to support a user in grouping collections of items?,How can we use information about the way a user groups collections to sup-port him in structuring as-yet-unknown collections? Nurnberger and Stober [23]give an answer to this question. They describe an adaptive clustering approachthat adapts to the user’s way of structuring, based on a growing self-organisingmap. As illustrated in [3], hierarchical clustering can help to structure unseencollections based on the way a user structures her own collections. It models thestructuring criteria of a user by constraints in order to learn feature weights. Thegoal of our approach is to examine these structuring dynamics and investigatehow a user is guided by himself or his peers. This can be very useful in detectinga user’s guiding preferences and obtaining an overview of the user characteristicsin the overall system.
In characterisation studies, system usage patterns are studied to proposemodels which explain and predict user behaviour in these systems. A numberof studies have investigated tagging systems. Closest to our work is the researchby Santos-Neto et al. [26] on individual and social behaviour in tagging systems.They define interest-sharing between users as a measure for inferring an implicitsocial structure for the tagging community. In addition, they investigate whethera high level of tag reuse results in users that tag overlapping sets of items and/or
4 Mathias Verbeke, Ilija Subasic, and Bettina Berendt
use overlapping sets of tags. Sen et al. [28] study how a tagging community’svocabulary of tags forms the basis for social navigation and shared expression.They present a user-centric model of vocabulary evolution in tagging commu-nities based on community influence and personal tendency, with an evaluationon a real system, namely the MovieLens recommender system. Musto et al. [22]investigate the relation between tagging based on one’s own past tags or on thecommunity’s tags, abstracting from the dynamics of tag assignments.
However, the studies of tagging are limited to a “bipartite” view of the bi-nary relations between tags and items (or the ternary ones between tags, itemsand users). They do not take into account the relations between tag assign-ments and tag non-assignments, i.e. the way in which different concepts interactstructurally, for example by being in competition with each other.
Our method complements these results with insights into structuring dynam-ics and behavioural characteristics in collaborative settings. We focus on the wayusers group items and how they are influenced during this process. This can helpto improve the design of future collaborative systems and leverage the design ofmechanisms that rely on implicit user interactions.
From conceptual and predictive clustering [6, 34], we used the key idea to a)form clusters of elements, then b) learn classifiers that reconstruct these clustersand c) apply the classifier for further result sets. Research on ontology re-use, inparticular adaptive ontology re-use [30], investigates the modelling and mappingsteps needed for re-using given ontologies, for whatever purpose. In contrast, weconcentrate on re-use for grouping/classifying new objects, and on how to findthe most suitable ontologies for re-use.
3 Grouping guidance
This section introduces notation (Section 3.1) and describes the system’s generalworkflow and the individual steps.
The system observes, for each user, an initial grouping and learns an initialclassifier from it (Section 3.2). It then identifies, for a given user, which classifierto use next – the user’s own or one determined by his peers (Section 3.3). Itapplies the chosen classifier (Section 3.4) and then updates it to reflect the newitem grouping, which now also contains the just-added item (Section 3.5).
Steps 2, 3 and 4 are iterated on any item that the users want to structure.To analyse the structuring behaviour of each user, we compare the resultinggroupings of this process to the real user groupings, which are the result of theuser’ structuring without computational assistance.
In Section 3.3, we present our measure of divergence between user groupingsof non-identical item sets.
3.1 Notation
In this section we will introduce notational conventions for the basic concepts,for the groupings of each user’s items and the classifiers learned from them, andfor the time points through which the structuring evolves. Specific instantiationsof these concepts can be found in Figures 1 and 2.
Learning and collaboration for structure recommendation 5
Basic components We use the following notation:
– Let U denote the set of all users (used symbols: u, v, w).– Let T denote the set of all time points {0, 1, ..., tmax}, where tmax represents
the time at which the last item arrives.– Let D denote the set of all items (used symbol: d).
D will be used in combination with subscripts that represent users. Its super-scripts represent time points. Thus Dt
u ⊆ D denotes the set of all d ∈ D alreadyconsidered by u ∈ U at t ∈ T . The item assigned to the structure by user u at tis an addition to this; it is represented by dtu ∈ (D \Dt
u).
Groupings and classifiers G and C are the (machine-induced) groupings foreach user’s items and the classifiers learned from them, respectively. G can beany of following:
OG - Observed Grouping This represents the grouping of the user at thestart of the learning phase. As will be clarified in subsection 3.2, this will bethe grouping used to learn the initial classifier at the start of the cycle.
GS - Simulated Grouping, guided by self This represents the grouping, ata certain point in time during the cycle, that is solely generated by theclassifier of the user in question. This will be specified in subsection 3.4.
Gn - Simulated Grouping, guided by n peers Just as GS, this representsthe grouping at a certain point in time during the cycle, but now the groupingis guided by n peers of the user under consideration. This will be specifiedin subsection 3.4.
As was the case for item sets, subscripts denote users and superscripts denotetime points. Gt
u is the grouping that holds at time t for user u (the set of u’sitem sets), i.e. a function that partitions the user’s current items into groups:Gt
u : Dtu 7→ 2D. We will refer to this as the extensional definition of a concept,
where the definition is formed by listing all objects that fall under that definition,and thus belong to the set or class for which the definition needs to be formed.
Ctu is the classifier (intension) learned from Gt
u, modelled as the functionspecifying an item’s group according to this classifier: Ct
u(d) = x with Ctu :
D 7→ 2D. The intensional definition is a concept that originated from logic andmathematics. In this context, an intensional definition is defined as a set ofconditions for an object to belong to a certain class. This is done by specifyingall the common properties of the objects that are part of this set, with the goalof capturing its meaning. Analogously to OG, GS and Gn for groupings, OC,CS and Cn are defined as the initial classifier and the classifiers guided by “self”and by n peers, respectively.
Time Structuring is modelled as evolving through a series of discrete timepoints, where each new structuring-related activity (such as tagging a documentin a social-bookmarking system) happens at some time point and leads to either
6 Mathias Verbeke, Ilija Subasic, and Bettina Berendt
the assimilation of the item into the given conceptual structure of G and C,or to a modification of the conceptual structure to accommodate the item. Theconceptual structure remains stable until the subsequent activity.
We will refer to next(t, u) with next : T ×U 7→ T as the first time point after
t at which u structures an item, which changes the item set to Dnext(t,u)u = Dt
u∪{dtu}. For each time point t′ between subsequent considerations of items, group-ing and classification remain unchanged. Formally, ∀t′ = t + 1, ..., next(t, u) :
Dt′
u = Dnext(t,u)u ∧ Ct′
u = Cnext(t,u)u ∧Gt′
u = Gnext(t,u)u .
3.2 Initial classifier learning
The task is to classify an item according to a set of concepts, based on itscontents. We regard a classifier as an explanation why an object is assigned to acertain concept, i.e. its intensional definition. As indicated above, the oppositeapproach is the extensional definition, obtained by listing all objects that fallunder that definition, and thus belong to the set or class for which the definitionneeds to be formed.
The goal is to determine intensional definitions for the user-generated group-ings. Each cluster or group is then regarded as a class for which a definition needsto be calculated. Since different algorithms can be used for clustering, there aredifferent ways in which these definitions can be calculated. These intensionaldefinitions can then be used to assign new items to these clusters or groups.This can be seen as a classification task, since new, unclassified items need tobe categorised.
3.3 Choosing the classifier(s)
The selection of peer guides whose classifiers are used in grouping requires a mea-sure of user similarity or divergence. Each user organises a set of items whichhe is interested in. Multiple peer users organise different, possibly overlapping,subsets of D. We start from the idea that similarity of items in peers’ groupingsindicates their interest similarity. The question that arises is: how to define simi-larity/divergence between groupings of non-identical item sets? Using a measurebased on the overlap of items, such as Jaccard index, or mutual informationwould fit as the similarity/divergence measure if item sets overlap to a largeextent. However, it is usually the case that peers have access (or interest) to alimited number of items, and only a small number of popular (easily accessed)items are available to all peers. To overcome this, we define a new measure ofdivergence between peers.
We assume that a user groups items based on their features, e.g. text fordocuments. For users u and v and their respective groupings Gt
u and Gtv, we
define the inter-guide measure of diversity udiv as:
Learning and collaboration for structure recommendation 7
udiv(u, v) =1
2( 1/|Gt
u|∑x∈Gt
u
miny∈Gtvgdiv(x, y)
+1/|Gtv|
∑y∈Gt
v
minx∈Gtugdiv(y, x) )
(1)
where gdiv(x,y), or inter-group diversity, is any divergence measure defined ontwo groups.1
The measure defined in Eq. 1 captures the differences between groupings byrewarding groups having shared items and groups containing similar items. Thedouble average creates a symmetric measure.
We calculate the inter-guide divergence for all pairs of users u, v ∈ U andcreate a |U | × |U | matrix Msim. The Msim matrix is used to select the mostsimilar users to the user who is structuring items. For each user, we extract thecorresponding row from Msim and sort it to find the most similar peers, definedas the least divergent ones. From this list, we select the top n users as guide(s).
3.4 Classification
In the classification step, the identified determining classifiers of the peer usersfrom the previous step are now used to classify the item under consideration. Wedistinguish two cases: in the first one, the user guides himself, so the intensionalmodel of his own structuring is used as classifier for the new item. In the othercase, the user is guided by his peers.
Self-guided classification If the user has not seen the item yet, we can usethe intensional description of the user’s current clustering to classify the new2
instance.At time t, the time where the new item arrives, the user’s own classifier is
applied: x = CStu(d). This gives the proposed group x based on the intensional
model of the user under consideration. The item d is added to this x, which
results in the new grouping GSnext(t,u)u .
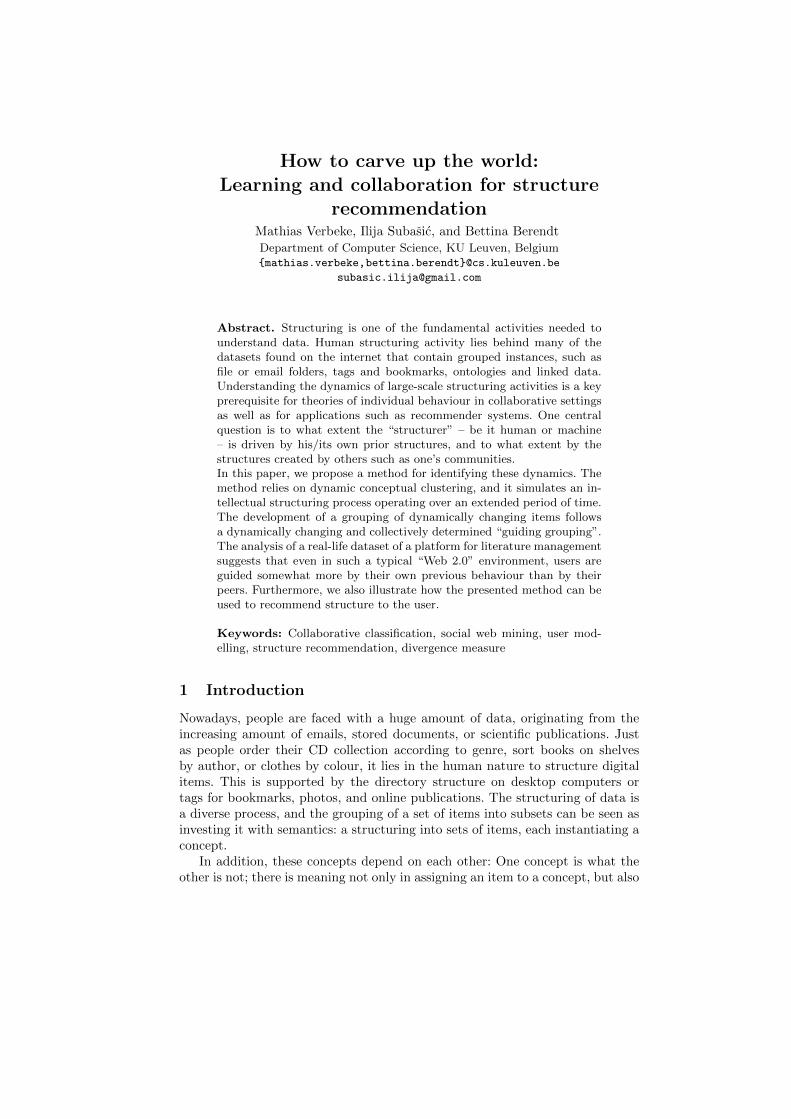
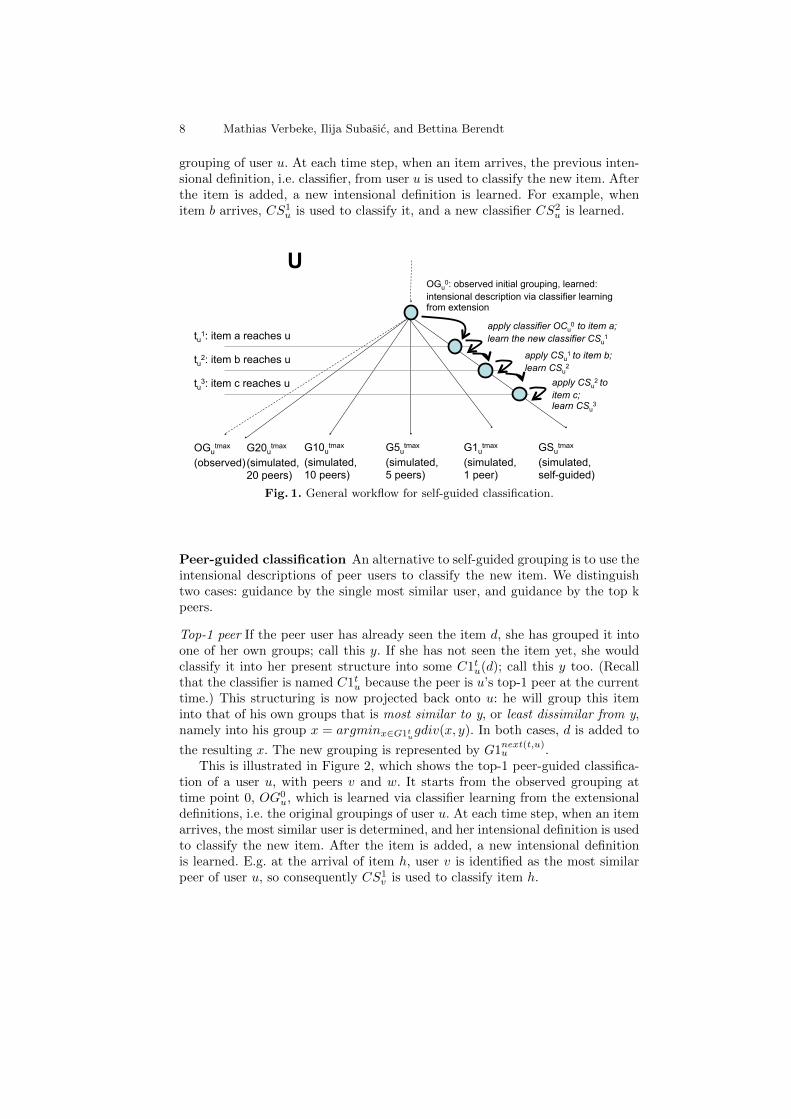
This is illustrated in Figure 1, which shows the self-guided classification ofa user u. It starts from the observed grouping at time point 0, OG0
u, which islearned via classifier learning from the extensional definitions, i.e. the original
1 If desired, a similarity measure can be calculated from this easily by appropriate nor-malisation: usim(u, v) = (maxw,z∈Uudiv(w, z)− udiv(u, v))/(maxw,z∈Uudiv(w, z) .
2 Note that there is another possible case, namely when an item arrives that a user hasalready seen. However, we were able to disregard this case given the nature of ourdata. We used CiteULike data, which is a social bookmarking system for scientificpapers, where we determined the groupings based on the taggings. As already shownin [26], only a very small proportion of the taggings are produced by the user whooriginally introduced the item to the system, and in general, users do not add newtags to describe the items they collected and annotated once.
8 Mathias Verbeke, Ilija Subasic, and Bettina Berendt
grouping of user u. At each time step, when an item arrives, the previous inten-sional definition, i.e. classifier, from user u is used to classify the new item. Afterthe item is added, a new intensional definition is learned. For example, whenitem b arrives, CS1
u is used to classify it, and a new classifier CS2u is learned.
tu1: item a reaches u
tu2: item b reaches u
tu3: item c reaches u
OGutmax
(observed)G20u
tmax
(simulated,20 peers)
G10utmax
(simulated,10 peers)
G5utmax
(simulated,5 peers)
G1utmax
(simulated,1 peer)
GSutmax
(simulated,self-guided)
OGu0: observed initial grouping, learned:
intensional description via classifier learning from extension
apply classifier OCu0 to item a;
learn the new classifier CSu1
apply CSu1 to item b;
learn CSu2
apply CSu2 to
item c;learn CSu
3
U
Fig. 1. General workflow for self-guided classification.
Peer-guided classification An alternative to self-guided grouping is to use theintensional descriptions of peer users to classify the new item. We distinguishtwo cases: guidance by the single most similar user, and guidance by the top kpeers.
Top-1 peer If the peer user has already seen the item d, she has grouped it intoone of her own groups; call this y. If she has not seen the item yet, she wouldclassify it into her present structure into some C1tu(d); call this y too. (Recallthat the classifier is named C1tu because the peer is u’s top-1 peer at the currenttime.) This structuring is now projected back onto u: he will group this iteminto that of his own groups that is most similar to y, or least dissimilar from y,namely into his group x = argminx∈G1tu
gdiv(x, y). In both cases, d is added to
the resulting x. The new grouping is represented by G1next(t,u)u .
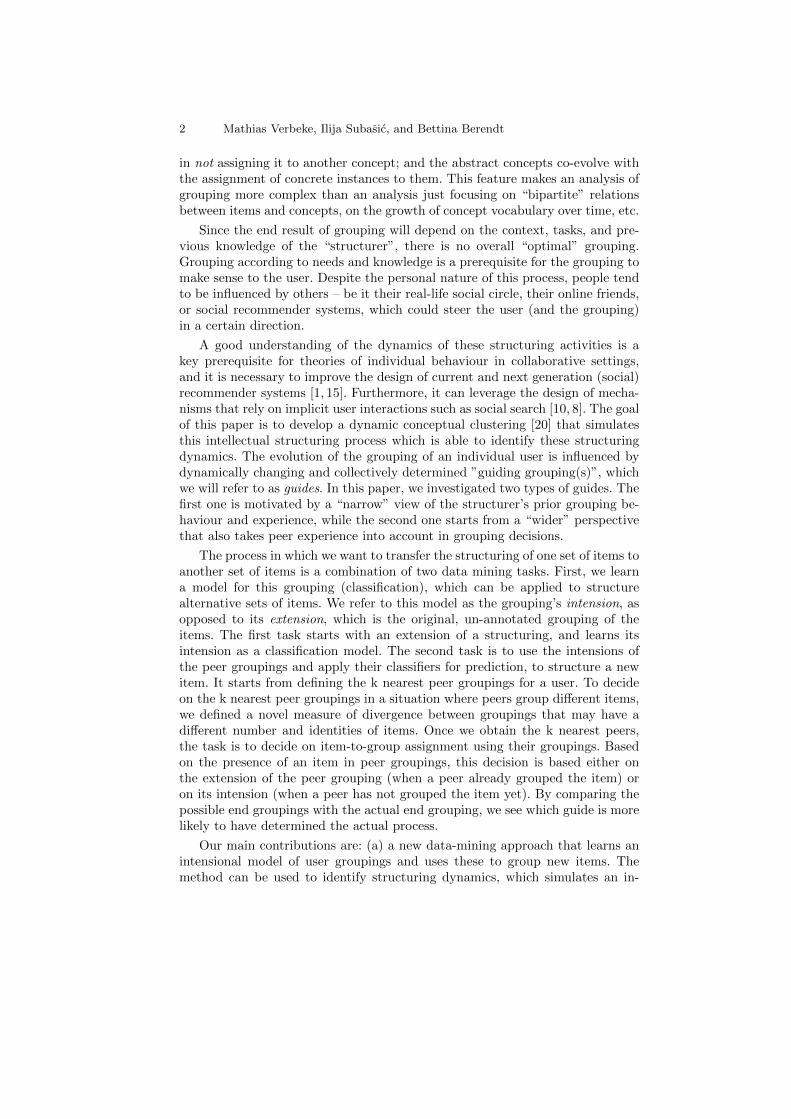
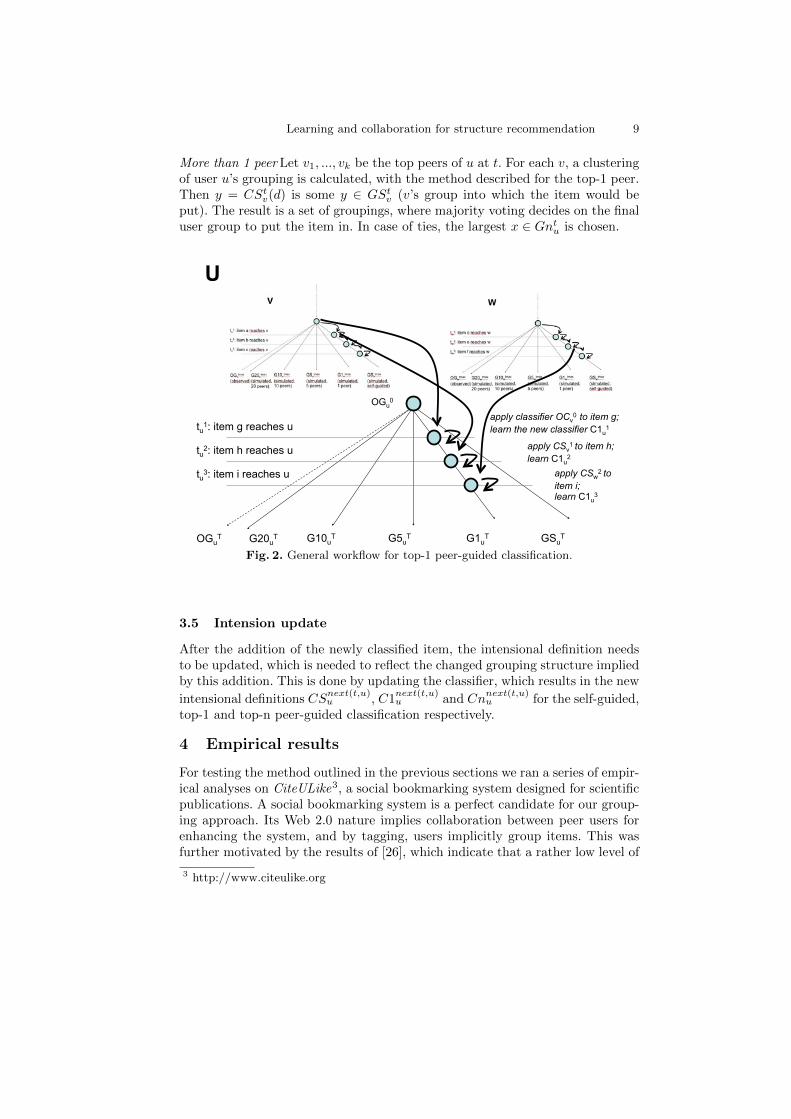
This is illustrated in Figure 2, which shows the top-1 peer-guided classifica-tion of a user u, with peers v and w. It starts from the observed grouping attime point 0, OG0
u, which is learned via classifier learning from the extensionaldefinitions, i.e. the original groupings of user u. At each time step, when an itemarrives, the most similar user is determined, and her intensional definition is usedto classify the new item. After the item is added, a new intensional definitionis learned. E.g. at the arrival of item h, user v is identified as the most similarpeer of user u, so consequently CS1
v is used to classify item h.
Learning and collaboration for structure recommendation 9
More than 1 peer Let v1, ..., vk be the top peers of u at t. For each v, a clusteringof user u’s grouping is calculated, with the method described for the top-1 peer.Then y = CSt
v(d) is some y ∈ GStv (v’s group into which the item would be
put). The result is a set of groupings, where majority voting decides on the finaluser group to put the item in. In case of ties, the largest x ∈ Gntu is chosen.
tu1: item g reaches u
tu2: item h reaches u
tu3: item i reaches u
OGuT G20u
T G10uT G5u
T G1uT GSu
T
OGu0
apply classifier OCv0 to item g;
learn the new classifier C1u1
apply CSv1 to item h;
learn C1u2
apply CSw2 to
item i;learn C1u
3
U
Fig. 2. General workflow for top-1 peer-guided classification.
3.5 Intension update
After the addition of the newly classified item, the intensional definition needsto be updated, which is needed to reflect the changed grouping structure impliedby this addition. This is done by updating the classifier, which results in the new
intensional definitions CSnext(t,u)u , C1
next(t,u)u and Cn
next(t,u)u for the self-guided,
top-1 and top-n peer-guided classification respectively.
4 Empirical results
For testing the method outlined in the previous sections we ran a series of empir-ical analyses on CiteULike3, a social bookmarking system designed for scientificpublications. A social bookmarking system is a perfect candidate for our group-ing approach. Its Web 2.0 nature implies collaboration between peer users forenhancing the system, and by tagging, users implicitly group items. This wasfurther motivated by the results of [26], which indicate that a rather low level of
3 http://www.citeulike.org
10 Mathias Verbeke, Ilija Subasic, and Bettina Berendt
item re-tagging and tag reuse, together with the much larger number of itemsthan tags in CiteULike, suggests that users exploit tags as an instrument tocategorise items according to topics of interest. This is also indicated by resultson usage patterns of collaborative tagging systems in [13]. Furthermore, theyalso indicate that the relatively high level of tag reuse suggests that users mayhave common interest over some topics. This motivated us to test whether thiscollaborative power and shared interests are the basis for users’ organisationsof documents, or whether they rather “trust” their own experience and are not“guided” by their peers.
In a social bookmarking system users apply free-text keywords (tags) todescribe an item. One application of a tag by a user to a item is referred toas tagging. Combining multiple taggings by multiple users gives rise to a datastructure that has been termed folksonomy [21]. A folksonomy can be viewedas a tripartite graph where nodes belong to sets of users, tags, or items and ahyper-edge is created between between a user, tag, and item for each tagging.
4.1 Dataset
We obtained a dump of the CiteULike database containing all entries from De-cember 2004 to February 2010. In total, there were 486,250 unique tags, 70,230users, 2,356,013 documents, and 10,236,568 taggings. As noted by previous work[13], the nodes and hyper-edges in a folksonomy have a long tail distribution, andmost users tag a small number of items, and most items are tagged rarely. Toovercome this sparsity, we followed a widely used folksonomy sampling methodbased on p-core subgraphs. The p-core subgraphs of a graph are its connectedcomponents in which the degree of each node must be at least equal to p. As insimilar studies [27, 16], we set the value for p to 5. Further, we constrained thedataset with regard to time and analysed only the taggings from 01/2009 until02/2010. In total this dataset had 12,982 tags, 377 users, 11,400 documents, and124,976 taggings. We refer to this folksonomy as F . For each document in thep-cores, we obtained the text of the abstract available on the CiteULike website.
4.2 Initial grouping
There are structures where people group explicitly, such as mail folders, andothers where people group implicitly. Tagging is an example of the latter. Sinceorganising and structuring items is one of the largest incentives for using a socialbookmarking system [28], we assume that the tagging assignments the user hasat the start of the learning phase are a reasonable starting point to create theinitial groupings. In accordance with Section 3.1, we use the word “observed”for these groupings, fully aware that these are generated by clustering, but wewanted to make the distinction based on the data which was used for grouping(observed data).
In order to learn those observed groupings, we split the dataset into twoparts. The first part, containing the first 7 months of our dataset, is used forlearning the initial groupings G0
•. On this part, we apply a clustering algorithm
Learning and collaboration for structure recommendation 11
as in [4, 3]. For a user u, we first restrict F to contain only nodes connected tou. This gives rise to a graph Fu. We then project Fu to a graph SFu in whichnodes belong to documents from set D0
u and edges are created between thesenodes when some tag is applied to both documents. The weight of the edges inSFu is equal to the number of tags that two documents share in Fu. We thenapplied a modularity clustering algorithm [33] to partition the SFu graph. Eachpartition is treated as one group in G0
u. This is repeated for all u ∈ U to obtaininitial groupings of all users, and resulted in an average of 6.59 groups per user.
The next step is to learn the initial classifiers. For this purpose, we usedthe Naive Bayes Classifier implementation in the WEKA data mining toolkit[14]. We used the bag of words representation of each publication’s abstract asfeatures for classification. This motivates our choice for Naive Bayes, since it hasthe property of being particularly suited when the dimensionality of the inputsis high. We also used a kernel estimator for modelling the attributes, ratherthan a single normal distribution, since this resulted in a better classificationaccuracy. The kernel estimator uses one Gaussian per observed value in thetraining data, and the conditional probability output by a kernel estimator isthe weighted combination of the conditional probabilities computed from eachof its constituent Gaussians.
4.3 Simulating groupings
We represent groups belonging to a grouping using language models. At time tfor a user u for every of his groups x ∈ Gt
u we create a language model Θx. Tofind the most similar peers to a user u we calculate his inter-guide divergence(Eq. 1) to all users v ∈ U . In our experiment on social bookmarking, as the inter-group divergence (gdiv) we used Jensen-Shannon divergence (JS) [7]. For twolanguage models Θx and Θy representing groups x and y belonging to groupingsG•u and G•v, JS is defined as:
JS(Θx, Θy) =1
2KL(Θx, Θz) +
1
2KL(Θy, Θz), (2)
where the probability of every word in Θz is the average probability in Θx andΘy; KL(Θ•, Θ∗) is Kullback-Leibler divergence between two language models.
4.4 Results
Once we obtained the groupings for GS and G{1|5|10|20} of one user, we com-pared these groupings with his observed groupings at tmax. Like the observedinitial grouping of a user u, his observed final grouping at tmax is a structuring ofall the documents he has considered at that time. Every simulation run (whetherit be guided by self, the top-1 peer, or the top-k peers) also considers the samesequence of documents arriving for u. Therefore, all simulated groupings andthe observed grouping of one user at tmax contain the same document set. Tocompare these groupings, we investigated the similarity between them. Since thegroupings to compare contain the same set of documents, we can use normalised
12 Mathias Verbeke, Ilija Subasic, and Bettina Berendt
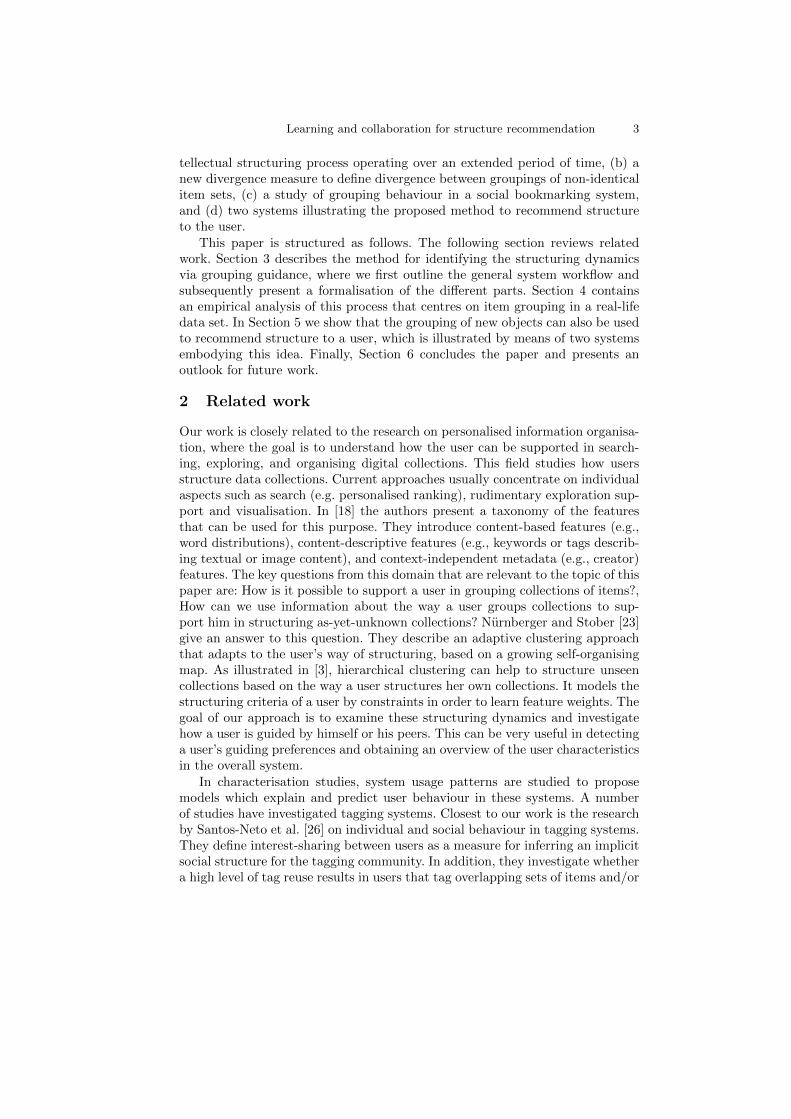
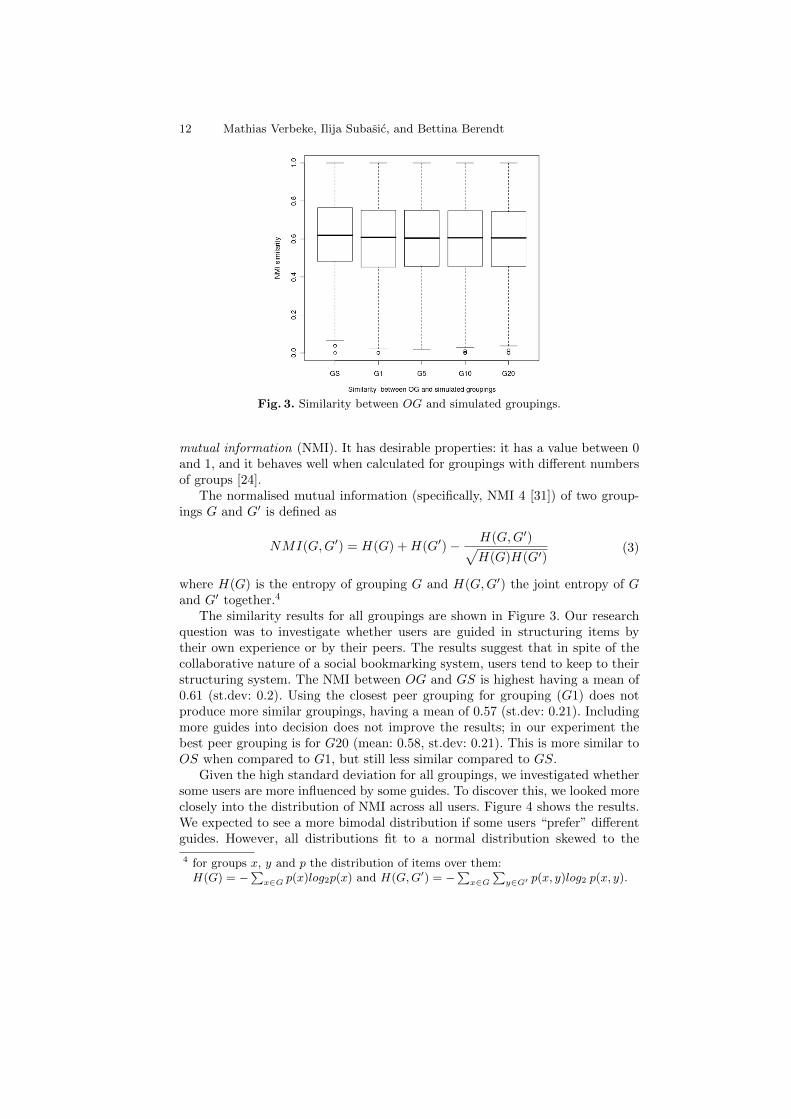
Fig. 3. Similarity between OG and simulated groupings.
mutual information (NMI). It has desirable properties: it has a value between 0and 1, and it behaves well when calculated for groupings with different numbersof groups [24].
The normalised mutual information (specifically, NMI 4 [31]) of two group-ings G and G′ is defined as
NMI(G,G′) = H(G) +H(G′)− H(G,G′)√H(G)H(G′)
(3)
where H(G) is the entropy of grouping G and H(G,G′) the joint entropy of Gand G′ together.4
The similarity results for all groupings are shown in Figure 3. Our researchquestion was to investigate whether users are guided in structuring items bytheir own experience or by their peers. The results suggest that in spite of thecollaborative nature of a social bookmarking system, users tend to keep to theirstructuring system. The NMI between OG and GS is highest having a mean of0.61 (st.dev: 0.2). Using the closest peer grouping for grouping (G1) does notproduce more similar groupings, having a mean of 0.57 (st.dev: 0.21). Includingmore guides into decision does not improve the results; in our experiment thebest peer grouping is for G20 (mean: 0.58, st.dev: 0.21). This is more similar toOS when compared to G1, but still less similar compared to GS.
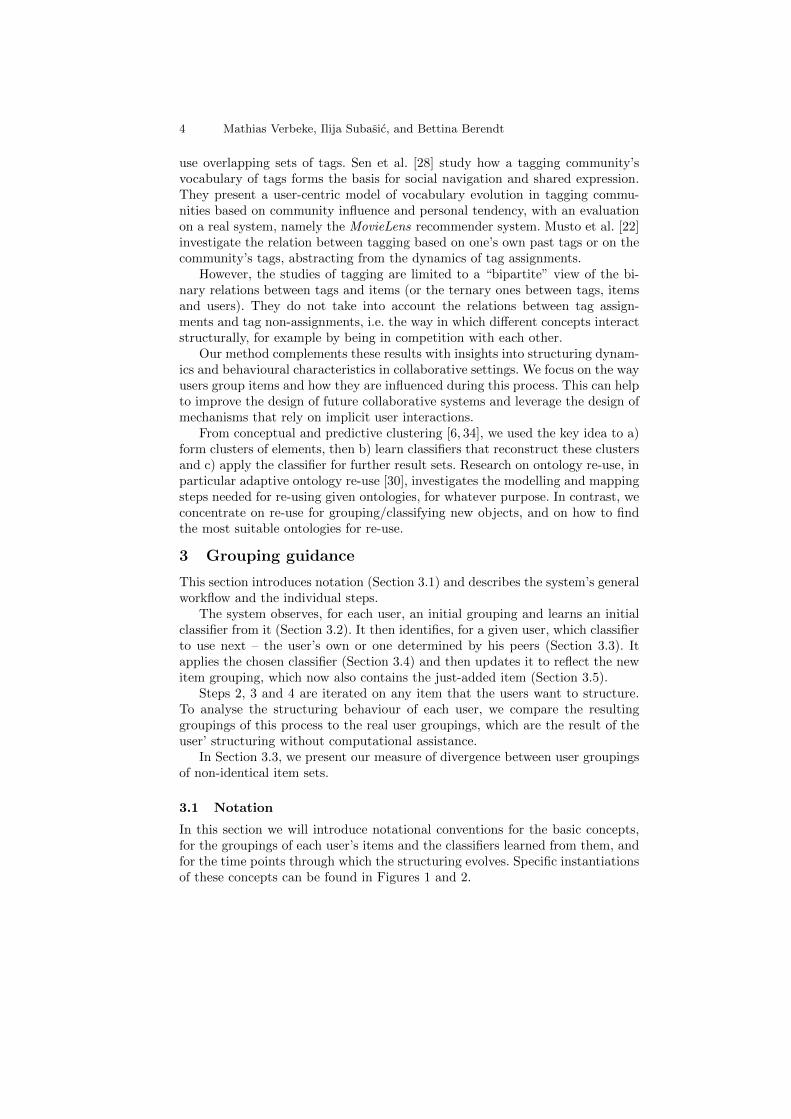
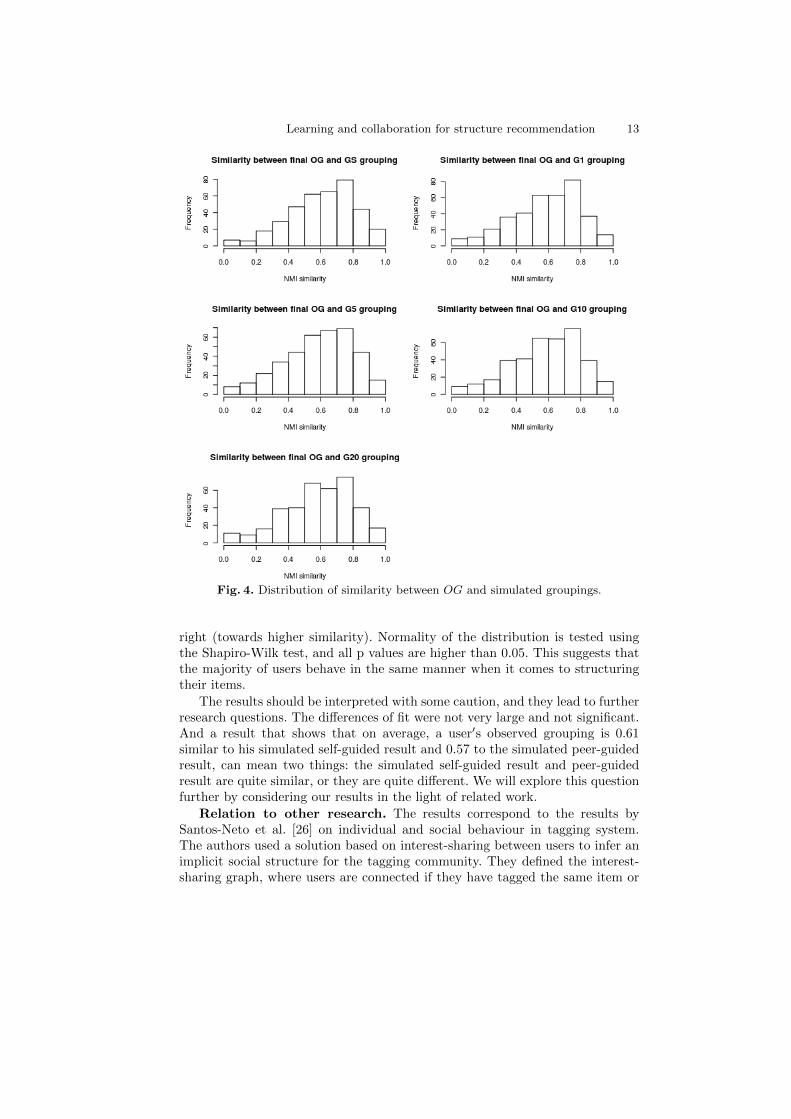
Given the high standard deviation for all groupings, we investigated whethersome users are more influenced by some guides. To discover this, we looked moreclosely into the distribution of NMI across all users. Figure 4 shows the results.We expected to see a more bimodal distribution if some users “prefer” differentguides. However, all distributions fit to a normal distribution skewed to the
4 for groups x, y and p the distribution of items over them:H(G) = −
∑x∈G p(x)log2p(x) and H(G,G′) = −
∑x∈G
∑y∈G′ p(x, y)log2 p(x, y).
Learning and collaboration for structure recommendation 13
Fig. 4. Distribution of similarity between OG and simulated groupings.
right (towards higher similarity). Normality of the distribution is tested usingthe Shapiro-Wilk test, and all p values are higher than 0.05. This suggests thatthe majority of users behave in the same manner when it comes to structuringtheir items.
The results should be interpreted with some caution, and they lead to furtherresearch questions. The differences of fit were not very large and not significant.And a result that shows that on average, a user′s observed grouping is 0.61similar to his simulated self-guided result and 0.57 to the simulated peer-guidedresult, can mean two things: the simulated self-guided result and peer-guidedresult are quite similar, or they are quite different. We will explore this questionfurther by considering our results in the light of related work.
Relation to other research. The results correspond to the results bySantos-Neto et al. [26] on individual and social behaviour in tagging system.The authors used a solution based on interest-sharing between users to infer animplicit social structure for the tagging community. They defined the interest-sharing graph, where users are connected if they have tagged the same item or
14 Mathias Verbeke, Ilija Subasic, and Bettina Berendt
used the same tags and found out that users self-organise in three distinct re-gions: users with low activity and unique preferences for items and tags, userswith high similarity among them, but isolated from the rest of the system, and alarge number of users with mixed levels of interest sharing. The results are alsocompatible with the findings of [13], which – based on the usage patterns in col-laborative tagging systems – indicates that users are drawn primarily to taggingsystems by their personal content management needs, as opposed to the desireto collaborate with others. Our results extend those findings: Our approach notonly looks at the tags they use, but also at the way they use the tags vis-a-visone another, i.e. in their structuring. This can give an indication as to whetherusers are more self-guided than peer-guided.
The results of [22] may at first sight appear to point into a different direction:Musto et al. studied the accuracy of tag prediction based on self-guidance andcommunity-guidance (in our terminology: all peers). They found that (a) thecommunity-guided tag predictions were somewhat more accurate than the self-guided ones and that (b) a strategy that first extracts tag suggestions fromthe items themselves and then complements them with personal tags and thenthe community’s tags produced the best accuracy. Closer inspection reveals,however, that the basic assumptions of that model and of our own form aninteresting complementarity and may help to further interpret our results.
The basic difference is that we are not interested in the tags per se, but in themental structure that they reveal. We will explain the complementarity using avery simple fictitious example. Assume a user u and a user v (who representsthe whole community). u has tagged items D1 (some set of items) with the tagtag1, and D2 with tag2. v has tagged some D3 with tag3 and some D4 withtag4. All 4 tags are different. A new item arrives for u that is most similar to hisgroup D1 and to the community’s group D3. If the user is guided by self, ourmodel will predict the new item to go into D1; if he is peer-guided, our modelwill predict that the new item goes into that of u’s groups that is most similar toD3. Now assume that D1 is most similar to D3. This corresponds to a situationin which everybody more or less structures in the same way. Our model will thenpredict that the new item goes into D1. And the final observed grouping willbe quite similar to the self-guided simulated one, and also to the peer-guidedsimulated one. (And this is what we found.) Musto et al., in contrast, look atthe tag manifestations of this mental structure. Their model predicts for self-guidance that the new item will be tagged with tag1, and for peer-guidance thatit will be tagged with tag3. So if vocabulary converges in the population, theitem will be tagged with tag1 and tag3, and the personal-plus-community modelwill produce the best prediction. (And this is what Musto et al. found.) Thus,one interpretation that is consistent with the results of both studies is that whilethere is some more self-guidance, the differences to peers are actually quite small,and individual vocabularies do tend to converge to the community’s vocabulary.
This interpretation however relies on an assumption about dynamics (theconvergence of vocabulary), and dynamics were not modelled by Musto et al.Also, there are combinations of equality/difference in grouping on the one hand
Learning and collaboration for structure recommendation 15
and vocabulary on the other, that are associated with different predictions in thetwo models. These combinations may persist in specific subcommunities. Finally,the levels of accuracy/NMI that they/we measured indicate that other factorsplay an important role too in tagging. In future work, this should be investigatedin more detail.
5 Self-guided and peer-guided grouping: influence vs.interactive recommendations
In the previous sections, we have investigated self-guided and peer-guided group-ing as a model of how content organisation in social media may evolve. This isa study of influence as it (may have) happened. However, the grouping of newobjects (and the continued learning of classifiers this entails) can also be used torecommend structure to a user. In other words, we can move from a descriptivestudy of influence to a prescriptive suggestion of influence. We have created sys-tems embodying this idea in two domains: the structuring of scientific literatureand “friends grouping” in online social networks.
5.1 Interactive self-guided and peer-guided grouping: referencemanagement
The CiteSeerCluster and Damilicious tools [5, 32] help users structure a list ofscientific articles. Both assume that these lists are the results of using a searchengine for a query q for user u. This decision was made to allow us to integratethe tool with a real-world platform for literature search (CiteSeer), but it wouldbe straightforward to also allow the user to upload a list obtained in some otherway. To make the list more manageable, it is clustered into subgroups based onthe textual contents or links to other articles, using typical clustering algorithmsused and validated in bibliometrics. The user can then work with this structure,naming clusters based on proposals based on textual analysis, deleting or movingitems from one cluster to another, or creating new clusters.
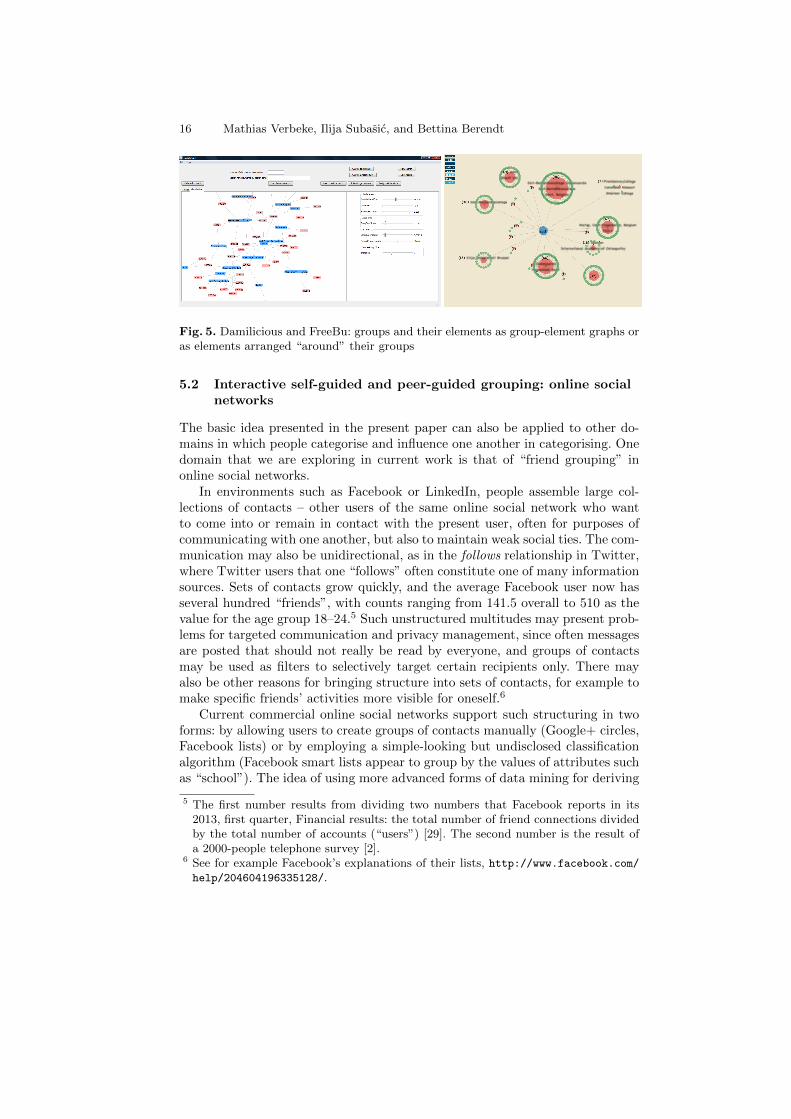
Each group of publications in the final grouping is regarded as the extensionaldefinition of a concept. An intensional description of each concept is created bythe top-10 TF.IDF terms in the grouped texts and, optionally, user input (Cite-SeerCluster) respectively the top Lingo phrase of the group’s original cluster(Damilicious). The advantage of the former is greater adaptivity, the advantageof the latter is better human understandability. Figure 5 (left) shows the Damili-cious interface with group labels and publication IDs. (The latter can be clickedon for information and full-text access.) User u may later re-use her own classi-fication of the results to q for a new query q′, or she may use another user v’sclassification. This user v may be selected on different grounds, and homophilyis only one of them. Thus, a user may decide to not follow the groupings of thev who is most similar to her, but to try and use the groupings least similar inorder to broaden her horizon.
16 Mathias Verbeke, Ilija Subasic, and Bettina Berendt
Fig. 5. Damilicious and FreeBu: groups and their elements as group-element graphs oras elements arranged “around” their groups
5.2 Interactive self-guided and peer-guided grouping: online socialnetworks
The basic idea presented in the present paper can also be applied to other do-mains in which people categorise and influence one another in categorising. Onedomain that we are exploring in current work is that of “friend grouping” inonline social networks.
In environments such as Facebook or LinkedIn, people assemble large col-lections of contacts – other users of the same online social network who wantto come into or remain in contact with the present user, often for purposes ofcommunicating with one another, but also to maintain weak social ties. The com-munication may also be unidirectional, as in the follows relationship in Twitter,where Twitter users that one “follows” often constitute one of many informationsources. Sets of contacts grow quickly, and the average Facebook user now hasseveral hundred “friends”, with counts ranging from 141.5 overall to 510 as thevalue for the age group 18–24.5 Such unstructured multitudes may present prob-lems for targeted communication and privacy management, since often messagesare posted that should not really be read by everyone, and groups of contactsmay be used as filters to selectively target certain recipients only. There mayalso be other reasons for bringing structure into sets of contacts, for example tomake specific friends’ activities more visible for oneself.6
Current commercial online social networks support such structuring in twoforms: by allowing users to create groups of contacts manually (Google+ circles,Facebook lists) or by employing a simple-looking but undisclosed classificationalgorithm (Facebook smart lists appear to group by the values of attributes suchas “school”). The idea of using more advanced forms of data mining for deriving
5 The first number results from dividing two numbers that Facebook reports in its2013, first quarter, Financial results: the total number of friend connections dividedby the total number of accounts (“users”) [29]. The second number is the result ofa 2000-people telephone survey [2].
6 See for example Facebook’s explanations of their lists, http://www.facebook.com/help/204604196335128/.
Learning and collaboration for structure recommendation 17
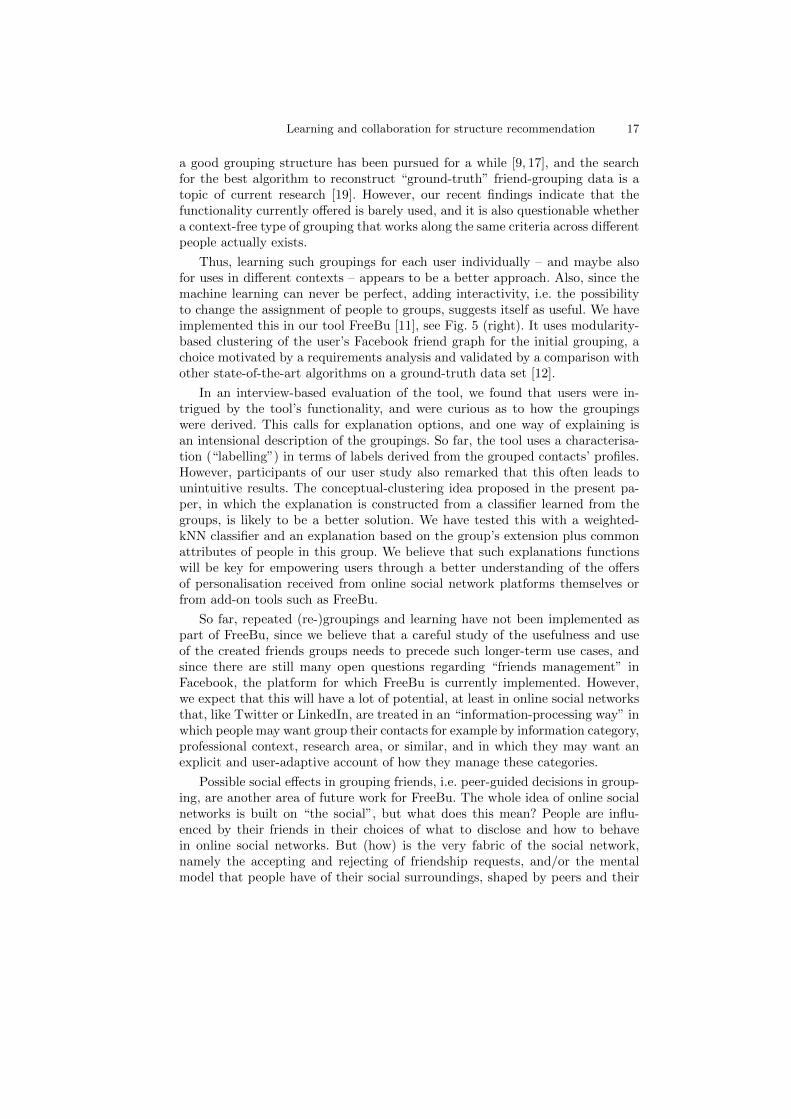
a good grouping structure has been pursued for a while [9, 17], and the searchfor the best algorithm to reconstruct “ground-truth” friend-grouping data is atopic of current research [19]. However, our recent findings indicate that thefunctionality currently offered is barely used, and it is also questionable whethera context-free type of grouping that works along the same criteria across differentpeople actually exists.
Thus, learning such groupings for each user individually – and maybe alsofor uses in different contexts – appears to be a better approach. Also, since themachine learning can never be perfect, adding interactivity, i.e. the possibilityto change the assignment of people to groups, suggests itself as useful. We haveimplemented this in our tool FreeBu [11], see Fig. 5 (right). It uses modularity-based clustering of the user’s Facebook friend graph for the initial grouping, achoice motivated by a requirements analysis and validated by a comparison withother state-of-the-art algorithms on a ground-truth data set [12].
In an interview-based evaluation of the tool, we found that users were in-trigued by the tool’s functionality, and were curious as to how the groupingswere derived. This calls for explanation options, and one way of explaining isan intensional description of the groupings. So far, the tool uses a characterisa-tion (“labelling”) in terms of labels derived from the grouped contacts’ profiles.However, participants of our user study also remarked that this often leads tounintuitive results. The conceptual-clustering idea proposed in the present pa-per, in which the explanation is constructed from a classifier learned from thegroups, is likely to be a better solution. We have tested this with a weighted-kNN classifier and an explanation based on the group’s extension plus commonattributes of people in this group. We believe that such explanations functionswill be key for empowering users through a better understanding of the offersof personalisation received from online social network platforms themselves orfrom add-on tools such as FreeBu.
So far, repeated (re-)groupings and learning have not been implemented aspart of FreeBu, since we believe that a careful study of the usefulness and useof the created friends groups needs to precede such longer-term use cases, andsince there are still many open questions regarding “friends management” inFacebook, the platform for which FreeBu is currently implemented. However,we expect that this will have a lot of potential, at least in online social networksthat, like Twitter or LinkedIn, are treated in an “information-processing way” inwhich people may want group their contacts for example by information category,professional context, research area, or similar, and in which they may want anexplicit and user-adaptive account of how they manage these categories.
Possible social effects in grouping friends, i.e. peer-guided decisions in group-ing, are another area of future work for FreeBu. The whole idea of online socialnetworks is built on “the social”, but what does this mean? People are influ-enced by their friends in their choices of what to disclose and how to behavein online social networks. But (how) is the very fabric of the social network,namely the accepting and rejecting of friendship requests, and/or the mentalmodel that people have of their social surroundings, shaped by peers and their
18 Mathias Verbeke, Ilija Subasic, and Bettina Berendt
influence? Future work could create the correlational and experimental settingsin which these options are prescriptive suggestions, carry out user studies toevaluate them, and also investigate how datasets could be assembled in whichsuch influences could be studied in descriptive settings.
5.3 Evaluating interactive uses of grouping guides
Interactive uses such as the ones described in the previous two sections requirea very different form of evaluation than models of influence such as the onedescribed in the main part of this paper. These evaluations cannot be performedon historical data, but must involve users. They also need to ask more questionsbeyond the focus of historical-data analysis, i.e. beyond “did this influence thecurrent user’s behaviour” (or in fact “is the current user’s behaviour consistentwith being influenced in this way”). First, the interactive tool should be one thatpeople like using, so a number of measures of usability and perceived usefulnessare an integral part. An example of this is shown in [5]. Second, the interactivetool should ideally produce something that is indeed useful for the user’s currenttask – to measure this goal, one must also measure other criteria like “are thegroups semantically meaningful in the application domain” [5] or “do the groupssupport another relevant behaviour in the application domain” [12].
The user-centric evaluations we performed [5, 12] suggest that the tools are agood support for their respective tasks and well-liked by users. Still, we believethat the tasks they “really” support (building up knowledge about scientific ar-eas, communicating over a social-networking site) are more complex and longer-term than those that can be tested in the usual form of one-shot laboratory userstudies, and that this should be investigated in future work [25].
6 Summary and outlook
Summary. In this research, we investigated collaborative grouping of items andbuilt a framework that simulates this process. Specifically, we were interested inhow different users structure items depending on the influence that guides thisstructuring process. We developed a new method that learns and combines clas-sifiers for item set structuring. This method starts by, in the first step, learninga model for an existing grouping, which we referred to as the intensional defi-nition. The second step uses these learned intensions to classify new items. Todecide on the most appropriate users to take into account when grouping a newitem, we defined a new divergence measure between groupings that may havedifferent numbers and identities of elements. This method is applied to simulatethe intellectual structuring process which underlies these structuring dynamics.We tested this approach on CiteULike, a social-bookmarking platform for liter-ature management. The results of the study can have implications for systemdesign of recommender systems and social search methods, for which a goodunderstanding of the dynamics of these grouping activities is a prerequisite.
In addition to the simulation framework and its evaluation on historical data,we also described past and ongoing research on building interactive tools with
Learning and collaboration for structure recommendation 19
which users can profit from their own and others’ structuring of content andconceptual-clustering models learned from such structuring.
Limitations of the analysis of historical data. The main question weaddressed was one of the difference in groupings, and we did not look at thebenefits users have from adopting some guides. As a baseline we used observedgroupings, which are not explicit user groupings, but implicit groupings learnedbased on users tag assignments. We are aware of the possible bias here and do notclaim that these are the “best” groupings users can have. Also, we used a rathersimple classifier, and a limited dataset. Our current analysis provides insightsboth into the grouping behaviour in general and into the behaviour of users insocial bookmarking systems. In future work, with a more extensive dataset, thiscould be extended to an iterative approach where the groupings are evaluatedat different time points to evaluate the impact of including new items in theconstruction of the classifiers.
Challenges for evaluation. The evaluation of grouping systems and there-fore the design of better grouping systems face a number of challenges. One is theenvironment: If a recommender system operates in the platform itself (as is thecase for example in Bibsonomy or CiteULike), then this may influence behaviourand therefore the historical data. Such influences are exacerbated in real-life ap-plications such as reference management or social-network use, in which peoplealso use other software such as search engines that also effectively act as recom-menders. An interactive grouping system will also operate in such a pre-givenenvironment and be affected by its recommender functionalities.
A special challenge for peer-guided grouping is privacy: an interactive group-ing system divulges substantial information about the peer who is proposed asthe “guide” or “donor” of a grouping. In contrast to recommender systems thatrecommend an item or a tag, the recommendation of a grouping will in manycases make it possible to identify the guide. This linking to a person may bea desired feature for the recipient user (“I want to group like someone who isknowledgeable”), but it may not be desired in all settings by the donor users.Thus, platforms offering peer-guided groupings should clearly describe this func-tionality and/or limit it to smaller groups whose participants trust each otherand agree to this use of their data. These privacy concerns on the user side ofcourse also imply privacy concerns on the data-controller side, which makes itmore difficult for them to release historical datasets and for researchers to obtainsuch datasets for analysis.
Future work. Our method can be of use in different applications for (tag)recommendation and social search, where the grouping dynamics and behaviouradds a new level to the current individual and social measures used by thesesystems. Furthermore, we could extend the method to rearranging own group-ings, based on the groupings of one’s peers. The proposed method can also becombined with other metrics to create a hybrid measure for item set structuring.
In interactive applications, peers can be selected in different ways. One isto base the peer search on a relatedness based on personal acquaintance (as insocial search), or on common properties, preferences, or behaviour (as in collab-
20 Mathias Verbeke, Ilija Subasic, and Bettina Berendt
orative filtering). Alternatively, relatedness can be based on different thinking.We believe that the latter, i.e. our approach to recommending structuring, canalleviate some filter-bubble side effects on relying only on a social network andinstead leverage the diversity of internet users. For example, why should the samepeople (= one’s set of contacts in a social network) be equally well equipped togive recommendations in totally different tasks? Finding guides based on theintellectual structure of a given task and its contents allows more flexibility andtherefore potentially more quality.
Conclusion. We presented a study into grouping behaviour of users. Ourframework combines different data mining methods to simulate collaborativegrouping of items. The results of our experiment suggest that even in such opensystems as social bookmarking tools, people tend to “trust” their own experiencemore than turn to the wisdom of the crowd. The main question we wish to followin the future is not one of trust, but one of the “benefit” users get by being ableto choose from a myriad of diverse groupings of the items they are interested in.
References
1. G. Adomavicius and A. Tuzhilin. Toward the next generation of recommendersystems: a survey of the state-of-the-art and possible extensions. Knowledge andData Engineering, IEEE Transactions on, 17(6):734–749, 2005.
2. Arbitron and Edison Research. The infinite dial 2013. navigating digi-tal platforms. http://www.edisonresearch.com/wp-content/uploads/2013/04/
Edison_Research_Arbitron_Infinite_Dial_2013.pdf, May 2013.3. Korinna Bade and Andreas Nurnberger. Creating a cluster hierarchy under con-
straints of a partially known hierarchy. In SDM, pages 13–24, 2008.4. G. Begelman, P. Keller, and F. Smadja. Automated tag clustering: Improving
search and exploration in the tag space. In Proceedings of the WWW CollaborativeWeb Tagging Workshop, Edinburgh, Scotland, 2006.
5. B. Berendt, B. Krause, and S. Kolbe-Nusser. Intelligent scientific authoring tools:Interactive data mining for constructive uses of citation networks. Inf. Process.Manage., 46(1):1–10, January 2010.
6. Hendrik Blockeel, Luc De Raedt, and Jan Ramon. Top-down induction of clus-tering trees. In Proceedings of the Fifteenth International Conference on MachineLearning, ICML ’98, pages 55–63, San Francisco, CA, USA, 1998. Morgan Kauf-mann Publishers Inc.
7. Jop Briet and Peter Harremoes. Properties of classical and quantum jensen-shannon divergence. Phys. Rev. A, 79:052311, May 2009.
8. David Carmel, Naama Zwerdling, Ido Guy, Shila Ofek-Koifman, Nadav Har’el, In-bal Ronen, Erel Uziel, Sivan Yogev, and Sergey Chernov. Personalized social searchbased on the user’s social network. In Proceedings of the 18th ACM conference onInformation and knowledge management, CIKM ’09, pages 1227–1236, New York,NY, USA, 2009. ACM.
9. George Danezis. Inferring privacy policies for social networking services. In Pro-ceedings of the 2nd ACM workshop on Security and artificial intelligence, AISec’09, pages 5–10, New York, NY, USA, 2009. ACM.
10. Brynn M. Evans and Ed H. Chi. Towards a model of understanding social search.In Proceedings of the 2008 ACM conference on Computer supported cooperativework, CSCW ’08, pages 485–494, New York, NY, USA, 2008. ACM.
Learning and collaboration for structure recommendation 21
11. Bo Gao, B. Berendt, D. Clarke, R. de Wolf, T. Peetz, J. Pierson, and R. Sayaf.Interactive grouping of friends in osn: Towards online context management. In DataMining Workshops (ICDMW), 2012 IEEE 12th International Conference on, pages555–562, 2012.
12. Bo Gao and Bettina Berendt. Circles, posts and privacy in egocentric socialnetworks: An exploratory visualization approach. In Proceedings of the 2013IEEE/ACM International Conference on Advances in Social Networks Analysisand Mining, ASONAM’13, New York, NY, USA, To appear. ACM.
13. Scott A. Golder and Bernardo A. Huberman. Usage patterns of collaborativetagging systems. J. Inf. Sci., 32(2):198–208, April 2006.
14. Mark Hall, Eibe Frank, Geoffrey Holmes, Bernhard Pfahringer, Peter Reutemann,and Ian H. Witten. The weka data mining software: an update. SIGKDD Explor.Newsl., 11(1):10–18, November 2009.
15. Jonathan L. Herlocker, Joseph A. Konstan, Loren G. Terveen, and John T. Riedl.Evaluating collaborative filtering recommender systems. ACM Trans. Inf. Syst.,22(1):5–53, January 2004.
16. Robert Jaschke, Leandro Marinho, Andreas Hotho, Lars Schmidt-Thieme, andGerd Stumme. Tag recommendations in folksonomies. In Proceedings of the11th European conference on Principles and Practice of Knowledge Discovery inDatabases, PKDD 2007, pages 506–514, Berlin, Heidelberg, 2007. Springer-Verlag.
17. Simon Jones and Eamonn O’Neill. Feasibility of structural network clusteringfor group-based privacy control in social networks. In Proceedings of the SixthSymposium on Usable Privacy and Security, SOUPS ’10, pages 9:1–9:13, New York,NY, USA, 2010. ACM.
18. Vipul Kashyap and Amit Sheth. Semantic Heterogeneity in Global InformationSystems: The Role of Metadata, Context and Ontologies. In Michael P. Papazoglouand Gunter Schlageter, editors, Cooperative Information Systems, pages 139–178.Academic Press, San Diego, 1998.
19. Julian J. McAuley and Jure Leskovec. Learning to discover social circles in egonetworks. In NIPS, pages 548–556, 2012.
20. Ryszard S. Michalski and Robert E. Stepp. Learning from observation: Conceptualclustering. In Ryszard S. Michalski, Jaime G. Carbonell, and Tom M. Mitchell,editors, Machine Learning: An Artificial Intelligence Approach, chapter 11, pages331–364. Tioga, 1983.
21. Peter Mika. Ontologies are us: A unified model of social networks and semantics.Web Semant., 5(1):5–15, March 2007.
22. Cataldo Musto, Fedelucio Narducci, Pasquale Lops, and Marco Gemmis. Com-bining collaborative and content-based techniques for tag recommendation. InFrancesco Buccafurri and Giovanni Semeraro, editors, E-Commerce and Web Tech-nologies, volume 61 of Lecture Notes in Business Information Processing, pages13–23. Springer Berlin Heidelberg, 2010.
23. Andreas Nrnberger and Sebastian Stober. User modelling for interactive user-adaptive collection structuring. In Nozha Boujemaa, Marcin Detyniecki, andAndreas Nrnberger, editors, Adaptive Multimedia Retrieval: Retrieval, User, andSemantics, volume 4918 of Lecture Notes in Computer Science, pages 95–108.Springer Berlin Heidelberg, 2008.
24. Darius Pfitzner, Richard Leibbrandt, and David Powers. Characterization and eval-uation of similarity measures for pairs of clusterings. Knowl. Inf. Syst., 19(3):361–394, May 2009.
22 Mathias Verbeke, Ilija Subasic, and Bettina Berendt
25. Catherine Plaisant. The challenge of information visualization evaluation. InProceedings of the working conference on Advanced visual interfaces, AVI ’04, pages109–116, New York, NY, USA, 2004. ACM.
26. Elizeu Santos-Neto, David Condon, Nazareno Andrade, Adriana Iamnitchi, andMatei Ripeanu. Individual and social behavior in tagging systems. In Proceedingsof the 20th ACM conference on Hypertext and hypermedia, HT ’09, pages 183–192,New York, NY, USA, 2009. ACM.
27. Christoph Schmitz, Andreas Hotho, Robert Jschke, and Gerd Stumme. Mining as-sociation rules in folksonomies. In Vladimir Batagelj, Hans-Hermann Bock, AnukaFerligoj, and Ale iberna, editors, Data Science and Classification, Studies in Clas-sification, Data Analysis, and Knowledge Organization, pages 261–270. SpringerBerlin Heidelberg, 2006.
28. Shilad Sen, Shyong K. Lam, Al Mamunur Rashid, Dan Cosley, Dan Frankowski,Jeremy Osterhouse, F. Maxwell Harper, and John Riedl. tagging, communities,vocabulary, evolution. In Proceedings of the 2006 20th anniversary conference onComputer supported cooperative work, CSCW ’06, pages 181–190, New York, NY,USA, 2006. ACM.
29. Craig Smith. By the numbers: 32 amazing face-book stats. http://expandedramblings.com/index.php/
by-the-numbers-17-amazing-facebook-stats/, May 2013.30. Rodolfo Stecher, Claudia Niedere, Wolfgang Nejdl, and Paolo Bouquet. Adaptive
ontology re-use: finding and re-using sub-ontologies. IJWIS, 4(2):198–214, 2008.31. Alexander Strehl and Joydeep Ghosh. Cluster ensembles — a knowledge reuse
framework for combining multiple partitions. J. Mach. Learn. Res., 3:583–617,March 2003.
32. Mathias Verbeke, Bettina Berendt, and Siegfried Nijssen. Data mining, interactivesemantic structuring, and collaboration: a diversity-aware method for sense-makingin search. In Claudia Niederee, editor, Proceedings of First International Workshopon Living Web, Collocated with the 8th International Semantic Web Conference(ISWC-2009), Washington D.C., USA, October 26, 2009,, page 8. CEUR-WS,October 2009.
33. Li Wan, Jianxin Liao, and Xiaomin Zhu. Cdpm: Finding and evaluating communitystructure in social networks. In Changjie Tang, CharlesX. Ling, Xiaofang Zhou,NickJ. Cercone, and Xue Li, editors, Advanced Data Mining and Applications,volume 5139 of Lecture Notes in Computer Science, pages 620–627. Springer BerlinHeidelberg, 2008.
34. Bernard enko, Sao Deroski, and Jan Struyf. Learning predictive clustering rules.In Francesco Bonchi and Jean-Franois Boulicaut, editors, Knowledge Discovery inInductive Databases, volume 3933 of Lecture Notes in Computer Science, pages234–250. Springer Berlin Heidelberg, 2006.