hses 1ete c17.qxd 5/16/04 1:28 pm page 476 section 17.1...
TRANSCRIPT
476 Chapter 17
17.1 Atmosphere Characteristics
Reading StrategyComparing and Contrasting Copy theVenn diagram below. As you read, completethe diagram by comparing and contrastingsummer and winter solstices.
Key ConceptsHow does weather differfrom climate?
Why do seasonal changesoccur?
Vocabulary◆ ozone◆ troposphere◆ stratosphere◆ mesosphere◆ thermosphere◆ summer solstice◆ winter solstice◆ autumnal equinox◆ spring equinox
E arth’s atmosphere is unique. No other planet in our solar systemhas an atmosphere with the exact mixture of gases or the moistureconditions and heat needed to sustain life as we know it. The gases thatmake up Earth’s atmosphere and the controls to which they are sub-ject are vital to our existence. In this chapter, you will begin to examinethe ocean of air in which we live.
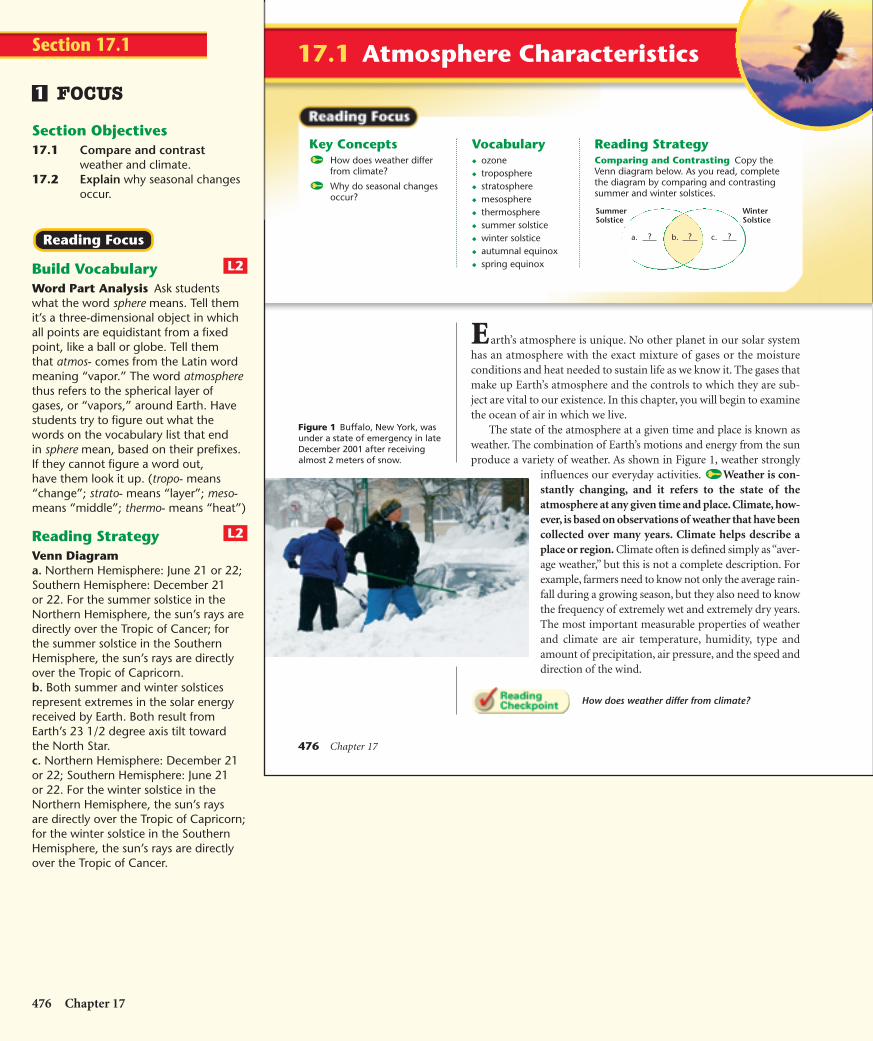
The state of the atmosphere at a given time and place is known asweather. The combination of Earth’s motions and energy from the sunproduce a variety of weather. As shown in Figure 1, weather strongly
influences our everyday activities. Weather is con-stantly changing, and it refers to the state of theatmosphere at any given time and place. Climate, how-ever, is based on observations of weather that have beencollected over many years. Climate helps describe aplace or region. Climate often is defined simply as “aver-age weather,” but this is not a complete description. Forexample, farmers need to know not only the average rain-fall during a growing season, but they also need to knowthe frequency of extremely wet and extremely dry years.The most important measurable properties of weatherand climate are air temperature, humidity, type andamount of precipitation, air pressure, and the speed anddirection of the wind.
How does weather differ from climate?
a. ? b. ? c. ?
SummerSolstice
WinterSolstice
Figure 1 Buffalo, New York, wasunder a state of emergency in lateDecember 2001 after receivingalmost 2 meters of snow.
476 Chapter 17
FOCUS
Section Objectives17.1 Compare and contrast
weather and climate.17.2 Explain why seasonal changes
occur.
Build VocabularyWord Part Analysis Ask studentswhat the word sphere means. Tell themit’s a three-dimensional object in whichall points are equidistant from a fixedpoint, like a ball or globe. Tell themthat atmos- comes from the Latin wordmeaning “vapor.” The word atmospherethus refers to the spherical layer ofgases, or “vapors,” around Earth. Havestudents try to figure out what thewords on the vocabulary list that endin sphere mean, based on their prefixes.If they cannot figure a word out,have them look it up. (tropo- means“change”; strato- means “layer”; meso-means “middle”; thermo- means “heat”)
Reading StrategyVenn Diagrama. Northern Hemisphere: June 21 or 22;Southern Hemisphere: December 21or 22. For the summer solstice in theNorthern Hemisphere, the sun’s rays aredirectly over the Tropic of Cancer; forthe summer solstice in the SouthernHemisphere, the sun’s rays are directlyover the Tropic of Capricorn.b. Both summer and winter solsticesrepresent extremes in the solar energyreceived by Earth. Both result fromEarth’s 23 1/2 degree axis tilt towardthe North Star.c. Northern Hemisphere: December 21or 22; Southern Hemisphere: June 21or 22. For the winter solstice in theNorthern Hemisphere, the sun’s raysare directly over the Tropic of Capricorn;for the winter solstice in the SouthernHemisphere, the sun’s rays are directlyover the Tropic of Cancer.
L2
L2
Reading Focus
1
Section 17.1
HSES_1eTE_C17.qxd 5/16/04 1:28 PM Page 476

Carbon dioxideArgon
All others
Oxygen
Nitrogen
The Atmosphere: Structure and Temperature 477
Composition of the AtmosphereThe composition of the atmosphere has changed dramatically overEarth’s nearly 4.6 billion year history. The atmosphere is thought tohave started as gases that were emitted during volcanic eruptions.Evidence indicates that oxygen did not start to accumulate in theatmosphere until about 2.5 billion years ago. The atmosphere contin-ues to exchange material with the oceans and life on Earth’s surface.
Major Components Sometimes the term air is used as if it werea specific gas, which it is not. Air is a mixture of different gases andparticles, each with its own physical properties. The composition ofair varies from time to time and from place to place. However, if thewater vapor, dust, and other variable components were removedfrom the atmosphere, its makeup would be very stable worldwideup to an altitude of about 80 kilometers.
Look at Figure 2. Two gases—nitrogen and oxygen—makeup 99 percent of the volume of clean, dry air. Although thesegases are the most common components of air, they don’taffect the weather much. The remaining 1 percent of dryair is mostly the inert gas argon (0.93 percent) plus tinyquantities of a number of other gases. Carbon dioxide ispresent in only small amounts (approximately 0.039 per-cent), but it is an important component of air. Carbondioxide is an active absorber of energy given off by Earth.Therefore, it plays a significant role in heating the atmosphere.
Variable Components Important materials that vary in the airfrom time to time and place to place include water vapor, dust parti-cles, and ozone. These components also can have significant effects onweather and climate.
The amount of water vapor varies from almost none to about 4 percent by volume. Why is such a small quantity so significant?
Water vapor is the source of all clouds and precipitation. Likecarbon dioxide, water vapor absorbs heat given off by Earth. It alsoabsorbs some solar energy.
Movements of the atmosphere allow a large quantity of solid andliquid particles to be suspended within it. Although visible dust some-times clouds the sky, these relatively large particles are too heavy tostay in the air for very long. Still, many particles are microscopic andremain suspended for longer periods of time. These particles includesea salts from breaking waves, fine soil blown into the air, smoke andsoot from fires, pollen and microorganisms lifted by the wind, and ashand dust from volcanic eruptions.
Figure 2 Volume of Clean, DryAir Nitrogen and oxygendominate the volume of gasescomposing dry air.
INSTRUCT
Composition of theAtmosphere
Students often think that when liquidwater turns into water vapor, it breaksapart into hydrogen and oxygen.Students also sometimes have troubledistinguishing between water vapor andliquid water in the atmosphere. Explainthat water vapor is a gas made up ofindividual water molecules that are toosmall to see. Different amounts of watervapor in the air make the air feel dry orhumid. Liquid water in the atmosphereis usually in the form of tiny droplets.Ask students to give examples of this.(clouds, fog, mist, rain, drizzle)Logical
Build Science SkillsAnalyzing Data Give students a briefhistorical background of the Farmer’sAlmanac, a publication that predictslong-term weather forecasts in NorthAmerica by using a complex formulathat considers sunspots, moon phases,and other astronomical and atmosphericconditions. Farmers have used it sinceearly in the nineteenth century as aprimary source for weather forecasts.
Instruct students to visitwww.farmersalmanac.com to obtain localweather forecasts as predicted by theFarmer’s Almanac. Then reviewnewspapers or local media records foryour area. Distribute your findings tostudents and discuss with them howaccurate the almanac’s forecasts are.
If Web resources are not available, useprinted almanacs of previous years. Youcould build a bar graph plotting yearlyweather predictions by the almanac,and compare it to a bar graph of actualweather conditions for the same year asrecorded by local weather stations.
L2
L2
2
The Atmosphere: Structure and Temperature 477
Customize for English Language Learners
Adapt your content presentation to the lessproficient ELL students. Use visual examples asmuch as possible to explain importantconcepts. For example, when discussing thecomponents of air, emphasize the pie chart in
Figure 2. When discussing how pressure varieswith altitude, emphasize the graph in Figure 4.When discussing the structure of the atmo-sphere, refer to Figure 6. When discussingthe seasons, use Figures 7 and 8. Answer to . . .
Weather changesconstantly, but climate is
based on patterns of weather that havebeen observed over years. Climate helpsdescribe a place or region.
HSES_1eTE_C17.qxd 5/16/04 1:28 PM Page 477

478 Chapter 17
Another important variable com-ponent of the atmosphere is ozone.Ozone is a form of oxygen that com-bines three oxygen atoms into eachmolecule (O3). Ozone is not the sameas the oxygen we breathe, which has twoatoms per molecule (O2). There is verylittle ozone in the atmosphere, and it isnot distributed evenly. It is concentratedin a layer located between 10 and 50kilometers above Earth’s surface.
In this altitude range, oxygen molecules (O2) are split into singleatoms of oxygen (O) when they absorb ultraviolet (UV) radiationemitted by the sun. Ozone is then produced when a single atom ofoxygen (O) and a molecule of oxygen (O2) collide. This collision musthappen in the presence of a third, neutral molecule that acts as a cat-alyst. A catalyst allows a reaction to take place without being consumedin the process. Ozone is concentrated 10 to 50 kilometers above Earthbecause the UV radiation from the sun is sufficient to produce singleatoms of oxygen. In addition, there are enough gas molecules to bringabout the required collisions.
The ozone layer is crucial to life on Earth. Ozone absorbs poten-tially harmful UV radiation from the Sun. If ozone did not filtermost UV radiation and all of the sun’s UV rays reached the surface ofEarth, our planet would be uninhabitable for many living organisms.
Human Influence Air pollutants are airborne particles and gasesthat occur in concentrations large enough to endanger the health oforganisms. Primary pollutants, shown in Figure 3, are emitted directlyfrom identifiable sources. Emissions from transportation vehiclesaccount for nearly half the primary pollutants by weight.
Secondary pollutants are not emitted directly into air. They formin the atmosphere when reactions take place among primary pollutantsand other substances. For example, after the primary pollutant sulfurdioxide enters the atmosphere, it combines with oxygen to producesulfur trioxide. Then the sulfur trioxide combines with water to createsulfuric acid, an irritating and corrosive substance.
Reactions triggered by strong sunlight are called photochemicalreactions. For instance, when nitrogen oxides absorb solar radiation,a chain of complex reactions begins. If certain volatile organic com-pounds are present, secondary products form that are reactive,irritating, and toxic. This noxious mixture of gases and particles iscalled photochemical smog.
What are secondary pollutants?
Figure 3 Primary PollutantsThese circle graphs show majorprimary pollutants and theirsources. Percentages arecalculated by weight.Source: U.S. Environmental ProtectionAgency.
Primary Pollutants
What They Are
VolatileOrganics13.6%
Particulates6.0%
SulfurOxides16.4%Nitrogen
Oxides14.8%
Carbon Monoxide49.1%
StationarySource FuelCombustion
27.3%
Where They Come From
IndustrialProcesses
15.0%
Solid Waste Disposal2.5%
Miscellaneous9.0%
Transportation46.2%
478 Chapter 17
Students sometimes think that globalwarming is caused by the ozone hole.Dispel this misconception by explainingthat although both phenomena occur inthe atmosphere, they are otherwise notrelated. The depletion of ozone maylead to increases in UV radiation, whichmay be harmful to living things. Globalwarming is an increase in thetemperature of the atmosphere thatmay be partly caused by increases incarbon dioxide.Logical
Use VisualsFigure 3 Use this diagram to discussprimary pollutants and where they comefrom. Ask: What is the main primarypollutant? (carbon monoxide) Whatis the main source of primarypollutants? (transportation) What doesthe term “transportation” refer to?(cars, trucks, trains, ships, and airplanes)What do you think the term“stationary source fuel combustion”refers to? (power plants, furnaces inhomes, and businesses)Visual, Logical
L2
L2
Section 17.1 (continued)
Significant improvements in air quality haveoccurred since the U.S. EnvironmentalProtection Agency initiated air-pollutioncontrol programs. Between 1970 and 2000,national total emissions of primary pollutantsdeclined by about one third. This occurredduring a period when the U.S. population
increased by about one third, and vehiclemiles traveled rose nearly 130 percent.Despite continued improvements in airquality, standards have not yet been met inlarge numbers of places. In 2000, more than100 million people lived in countries withunhealthy air.
Facts and Figures
HSES_1eTE_C17.qxd 9/24/04 6:58 PM Page 478

The Atmosphere: Structure and Temperature 479
Height and Structure of theAtmosphereWhere does the atmosphere end and outer space begin?There is no sharp boundary. The atmosphere thins asyou travel away from Earth until there are too few gasmolecules to detect.
Pressure Changes To understand the vertical extentof the atmosphere, examine Figure 4, which shows changesin atmospheric pressure with height. Atmospheric pres-sure is simply the weight of the air above. At sea level, theaverage pressure is slightly more than 1000 millibars, orslightly more than 1 kilogram per square centimeter. Onehalf of the atmosphere lies below an altitude of 5.6 kilo-meters. Above 100 kilometers, only 0.00003 percent of allthe gases making up the atmosphere exist.
Temperature Changes The pictures of snow-capped mountains rising above snow-free valleys shownin Figure 5 might remind you that Earth’s atmospherebecomes colder as you climb higher. But not all layers of the atmos-phere show this temperature pattern.
2
6
10
14
18
2236
32
28
24
20
16
12
8
4
0 200 400 600 800 1000
Pressure (mb)
Alti
tud
e (k
m)
Mt. Everest
50% of airlies below
this altitude
20
16
12
8
4
Alti
tud
e (m
iles)
Figure 5 In Jasper National Parkin Alberta, Canada, snowymountaintops contrast withwarmer, snow-free lowlandsbelow.
Figure 4 Atmospheric Pressurevs. Altitude This graph showshow atmospheric pressure varieswith altitude.Comparing How do changesin air pressure at low altitudescompare with air pressurechanges at high altitudes?
Height and Structureof the AtmosphereBuild Science SkillsUsing Models To helpstudents understandhow and why airpressure decreases asyou go up through the atmosphere,have them work in groups to buildmodels of the atmosphere. Have eachgroup make a stack of at least 6 identicalheavy books. Have them place a sheet ofscrap paper between each layer, withpart of the paper sticking out the sameamount. Have students then try to pullout each sheet of paper from betweenthe layers. Ask: Which sheet was thehardest to pull out? (the one on thebottom) Why was it so hard to pullout? (It had the most layers of books piledon it, and thus the most weight.) Whichsheet was the easiest to pull out? (theone on the top) Why was it so easy topull out? (It had only one book piled onit, and thus the least weight.)Visual, Logical
Integrate PhysicsUnits of Air Pressure Students maybe confused by the many differentunits used to measure air pressure.Newspaper and television weatherreports often use the non-metric unitinches of mercury, which is related tothe height of a column of mercury ina mercury barometer. The average airpressure at sea level is about 29.92inches of mercury. The metric (SI) unitfor air pressure is the pascal (Pa), theequivalent of one newton per squaremeter (N/m2), which is force per unitarea. Meteorologists use the unitmillibar (mb), which equals 100 Pa. Theaverage air pressure at sea level is about101,325 Pa. Ask: How many millibarswould 101,325 Pa be? (1013.25 mb)Logical
L2
L2
The Atmosphere: Structure and Temperature 479
Answer to . . .
Figure 4 Air pressure decreasesrapidly near Earth’s surface and moregradually at greater heights.
Secondary pollutantsare pollutants that
form when reactions take placeamong primary pollutants andother substances.
HSES_1eTE_C17.qxd 9/24/04 7:02 PM Page 479

480 Chapter 17
The atmosphere can be divided vertically into four layers basedon temperature. Figure 6 illustrates these layers. The bottom layer,where temperature decreases with an increase in altitude, is the tro-posphere. It is in this layer that essentially all important weatherphenomena occur. The thickness of the troposphere is not the sameeverywhere. It varies with latitude and the season. On average, the tem-perature drop continues to a height of about 12 kilometers, where theouter boundary of the troposphere, called the tropopause, is located.
Beyond the tropopause is the stratosphere. In the stratosphere, thetemperature remains constant to a height of about 20 kilometers. Itthen begins a gradual increase in temperature that continues until thestratopause, at a height of nearly 50 kilometers above Earth’s surface.Temperatures increase in the stratosphere because the atmosphere’sozone is concentrated here. Recall that ozone absorbs ultraviolet radi-ation from the sun. As a result, the stratosphere is heated.
In the third layer, the mesosphere, temperatures again decreasewith height until the mesopause. The mesopause is more than 80 kilo-meters above the surface and the temperatures approach �90°C. Thefourth layer extends outward from the mesopause and has no well-defined upper limit. It is the thermosphere, a layer that contains onlya tiny fraction of the atmosphere’s mass. Temperatures increase in thethermosphere because oxygen and nitrogen absorb short-wave, high-energy solar radiation.
Figure 6 This diagram illustrates thethermal structure of the atmosphere.Interpret How do air temperatureschange with height in themesosphere?
Hei
ght
(km
)
100
90
80
70
60
50
40
30
20
10
60
50
40
30
20
10
Temperature
THERMOSPHERE
Mesopause
MESOSPHERE
Stratopause
STRATOSPHERE
Tropopause
TROPOSPHERE
–100 – 90 – 80 –70 – 60 – 50 – 40 – 30 – 20 –10 0 10 20 50˚C
–140 –120 –100 – 80 – 60 – 40 – 20 0 2032
40 60 120˚F
Temperature
Hei
ght
(mile
s)
Mt. Everest
80 100
30 40
110
120
130
140
70
80
90
Maximum ozone
Meteor
Aurora
For: Links on the layers of theatmosphere
Visit: www.SciLinks.org
Web Code: cjn-6171
480 Chapter 17
Build Reading LiteracyRefer to p. 186D in Chapter 7, whichprovides the guidelines for relating textand visuals.
Relate Text and Visuals Havestudents read the text on p. 480 thatdescribes the features of the layers of theatmosphere. Have students use Figure 6to describe how temperature changes asyou go up through the atmosphere. (Itdecreases with altitude in the troposphere;it remains constant in the lower part of thestratosphere and then gradually increasesuntil 50 km above Earth; it decreases withheight in the mesosphere; and it increasesagain in the thermosphere.)Visual
Use VisualsFigure 6 Use this diagram to discusslayers of the atmosphere. Ask: What isthe lowest level of the atmosphere,and what happens there? (troposphere;essentially all important weatherphenomenon occur) What is the second-lowest level of the atmosphere, andwhat important gas is found there?(stratosphere; ozone) What are the thirdand upper levels of the atmosphere?(mesosphere; thermosphere)Visual, Logical
L1
L1
Section 17.1 (continued)
The rate of temperature decrease in thetroposphere is called the environmental lapserate. Its average value is 6.5°C/km. This figureis known as the normal lapse rate. The environ-mental lapse rate is not a constant but canbe highly variable. To determine the actualenvironmental lapse rate, as well as gather
information about vertical changes in pressure,wind, and humidity, meteorologists useradiosondes. A radiosonde is an instrumentpackage that is attached to a balloon, and ittransmits data by radio as it ascends throughthe atmosphere.
Facts and Figures
Download a worksheet on layers ofthe atmosphere for students tocomplete, and find additionalteacher support from NSTASciLinks.
HSES_1eTE_C17.qxd 9/24/04 7:04 PM Page 480

The Atmosphere: Structure and Temperature 481
Earth-Sun RelationshipsNearly all of the energy that drives Earth’s variable weather and cli-mate comes from the sun. Earth absorbs only a tiny percentage of theenergy given off by the sun—less than one two-billionth. This mayseem insignificant, but the amount is several hundred thousand timesthe electrical-generating capacity of the United States.
Solar energy is not distributed evenly over Earth’s surface. Theamount of energy received varies with latitude, time of day, and seasonof the year. As you will see, the variations in solar heating are causedby the motions of Earth relative to the sun and by variations in Earth’sland and ocean surface. It is the unequal heating of Earth that createswinds and drives the ocean’s currents. These movements transport heatfrom the tropics toward the poles in an attempt to balance energy dif-ferences. The results of these processes are the phenomena we callweather.
Earth’s Motions Earth has two principal motions—rotation andrevolution. Rotation is the spinning of Earth about its axis. The axis isan imaginary line running through the north and south poles. Ourplanet rotates once every 24 hours, producing the daily cycle of day-light and darkness. Revolution is the movement of Earth in its orbitaround the sun. Earth travels at nearly 113,000 kilometers per hour inan elliptical orbit about the sun.
Earth’s Orientation We know that it is colder in the winter thanin the summer. But why? Length of day and a gradual change in theangle of the noon sun above the horizon affect the amount of energyEarth receives. Seasonal changes occur because Earth’s positionrelative to the sun continually changes as it travels along its orbit.Earth’s axis is not perpendicular to the plane of its orbit around thesun. Instead it is tilted 23.5 degrees from the perpendicular, as shownin Figure 7. Because the axis remains pointed toward the North Star asEarth moves around the sun, the position of Earth’s axis to the sun’srays is constantly changing. If the axis were not tilted, we would nothave seasonal changes.
The orientation of Earth relative to the sun and the constant move-ment of Earth cause the angle of the noon sun to vary by up to 47 degrees(�23.5 degrees to �23.5 degrees) for many locations during the year. Forexample, a mid-latitude city like New York, located about 40 degreesnorth latitude, has a maximum noon sun angle of 73.5 degrees when thesun’s vertical rays reach their farthest northward location in June. Sixmonths later, New York has a minimum noon sun angle of 26.5 degrees.
In which direction does Earth’s axis point?
Atmosphere
Sun'srays
N
1 2/66 ˚
23 ˚
90˚
30˚
0˚
23 ˚
S
1 2/
1 2/
Figure 7 Tilt of Earth’s AxisEarth’s axis always points towardthe North Star as it revolvesaround the sun.
Earth-SunRelationships
Angles and SeasonsPurpose Students observe howdifferences in the angle of the sun’srays affect heating of Earth’s surface.
Materials narrow-beam flashlight,globe on stand
Procedure Dim the room lights.Position the globe similarly to how Earthis shown in Figure 7. First, shine thelight around 23 degrees S so it makes atight circle. Explain that this representssummer in the Southern Hemisphere.Then move the flashlight and beam upto about 23 degrees N (keeping theflashlight horizontal). Ask students todescribe how the area covered by thelight changed, and what season thisrepresents in the Northern Hemisphere.
Expected Outcome The light spreadsout to cover a greater area, whichrepresents winter in the NorthernHemisphere. Make sure studentsunderstand that the light from theflashlight represents a fixed amount ofenergy. When it spreads out, it may lookas if more energy is hitting the surface ofthe globe. Actually, the same amount ofenergy is being spread out over a largerarea.Visual, Logical
L2
The Atmosphere: Structure and Temperature 481
Answer to . . .
Figure 6 Air temperatures decreasewith height in the mesosphere.
Earth’s axis pointstoward the North Star.
HSES_1eTE_C17.qxd 5/16/04 1:28 PM Page 481
482 Chapter 17
Section 17.1 Assessment
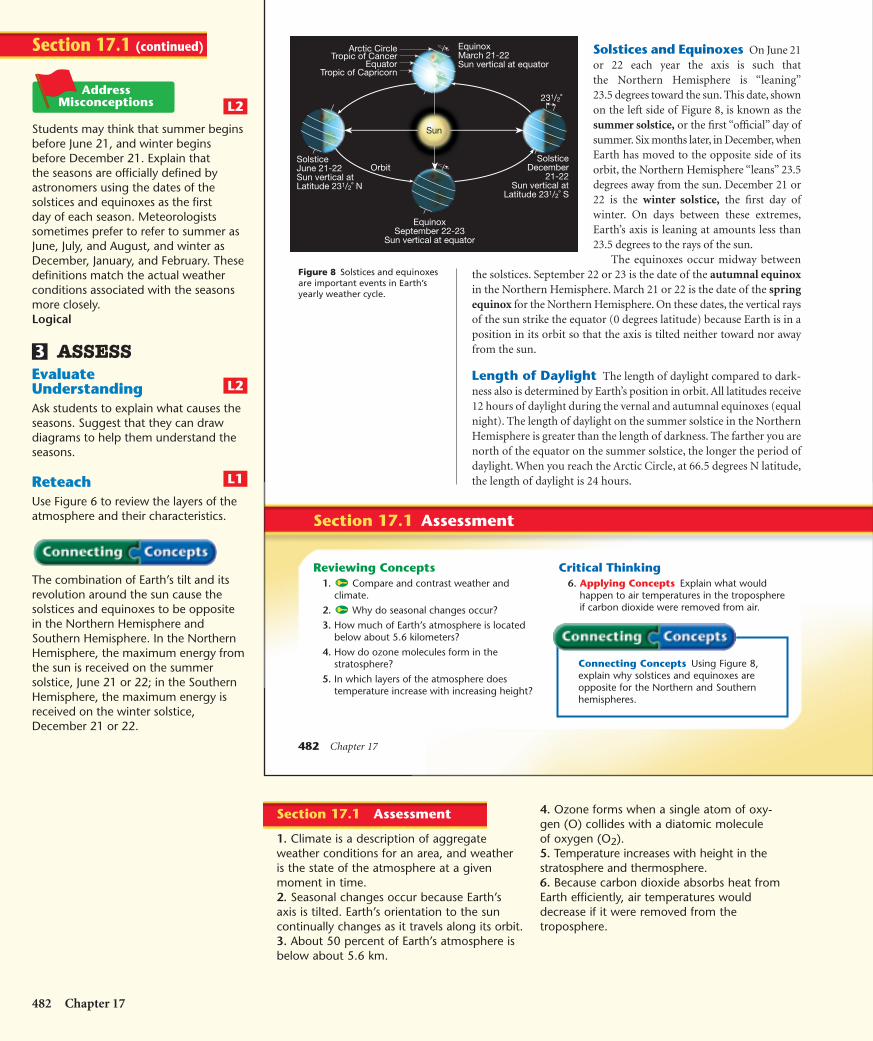
Solstices and Equinoxes On June 21or 22 each year the axis is such thatthe Northern Hemisphere is “leaning”23.5 degrees toward the sun. This date, shownon the left side of Figure 8, is known as thesummer solstice, or the first “official” day ofsummer. Six months later, in December, whenEarth has moved to the opposite side of itsorbit, the Northern Hemisphere “leans” 23.5degrees away from the sun. December 21 or22 is the winter solstice, the first day ofwinter. On days between these extremes,Earth’s axis is leaning at amounts less than23.5 degrees to the rays of the sun.
The equinoxes occur midway betweenthe solstices. September 22 or 23 is the date of the autumnal equinoxin the Northern Hemisphere. March 21 or 22 is the date of the springequinox for the Northern Hemisphere. On these dates, the vertical raysof the sun strike the equator (0 degrees latitude) because Earth is in aposition in its orbit so that the axis is tilted neither toward nor awayfrom the sun.
Length of Daylight The length of daylight compared to dark-ness also is determined by Earth’s position in orbit. All latitudes receive12 hours of daylight during the vernal and autumnal equinoxes (equalnight). The length of daylight on the summer solstice in the NorthernHemisphere is greater than the length of darkness. The farther you arenorth of the equator on the summer solstice, the longer the period ofdaylight. When you reach the Arctic Circle, at 66.5 degrees N latitude,the length of daylight is 24 hours.
SolsticeDecember
21-22Sun vertical at
Latitude 231/2˚ S
EquinoxSeptember 22-23
Sun vertical at equator
EquinoxMarch 21-22Sun vertical at equator
Arctic CircleTropic of Cancer
Equator
231/2˚
SolsticeJune 21-22Sun vertical atLatitude 231/2˚ N
Orbit
Tropic of Capricorn
Sun
Figure 8 Solstices and equinoxesare important events in Earth’syearly weather cycle.
Connecting Concepts Using Figure 8,explain why solstices and equinoxes areopposite for the Northern and Southernhemispheres.
Critical Thinking6. Applying Concepts Explain what would
happen to air temperatures in the troposphereif carbon dioxide were removed from air.
Reviewing Concepts1. Compare and contrast weather and
climate.
2. Why do seasonal changes occur?
3. How much of Earth’s atmosphere is locatedbelow about 5.6 kilometers?
4. How do ozone molecules form in thestratosphere?
5. In which layers of the atmosphere doestemperature increase with increasing height?
482 Chapter 17
Students may think that summer beginsbefore June 21, and winter beginsbefore December 21. Explain thatthe seasons are officially defined byastronomers using the dates of thesolstices and equinoxes as the firstday of each season. Meteorologistssometimes prefer to refer to summer asJune, July, and August, and winter asDecember, January, and February. Thesedefinitions match the actual weatherconditions associated with the seasonsmore closely.Logical
ASSESSEvaluateUnderstandingAsk students to explain what causes theseasons. Suggest that they can drawdiagrams to help them understand theseasons.
ReteachUse Figure 6 to review the layers of theatmosphere and their characteristics.
The combination of Earth’s tilt and itsrevolution around the sun cause thesolstices and equinoxes to be oppositein the Northern Hemisphere andSouthern Hemisphere. In the NorthernHemisphere, the maximum energy fromthe sun is received on the summersolstice, June 21 or 22; in the SouthernHemisphere, the maximum energy isreceived on the winter solstice,December 21 or 22.
L1
L2
3
L2
Section 17.1 (continued)
4. Ozone forms when a single atom of oxy-gen (O) collides with a diatomic moleculeof oxygen (O2).5. Temperature increases with height in thestratosphere and thermosphere.6. Because carbon dioxide absorbs heat fromEarth efficiently, air temperatures woulddecrease if it were removed from thetroposphere.
Section 17.1 Assessment
1. Climate is a description of aggregateweather conditions for an area, and weatheris the state of the atmosphere at a givenmoment in time.2. Seasonal changes occur because Earth’saxis is tilted. Earth’s orientation to the suncontinually changes as it travels along its orbit.3. About 50 percent of Earth’s atmosphere isbelow about 5.6 km.
HSES_1eTE_C17.qxd 9/24/04 7:05 PM Page 482
The Atmosphere: Structure and Temperature 483
17.2 Heating the Atmosphere
Reading StrategyUsing Prior Knowledge Before you read,copy the table below and write your definitionfor each vocabulary term. After you read,write the scientific definition of each term andcompare it with your original definition.
Key ConceptsHow are heat andtemperature related?
What are the three majormechanisms of heattransfer?
How is the atmosphereaffected by each of theheat transfer mechanisms?
Vocabulary◆ heat◆ temperature◆ conduction◆ convection◆ radiation◆ reflection◆ scattering◆ greenhouse effect
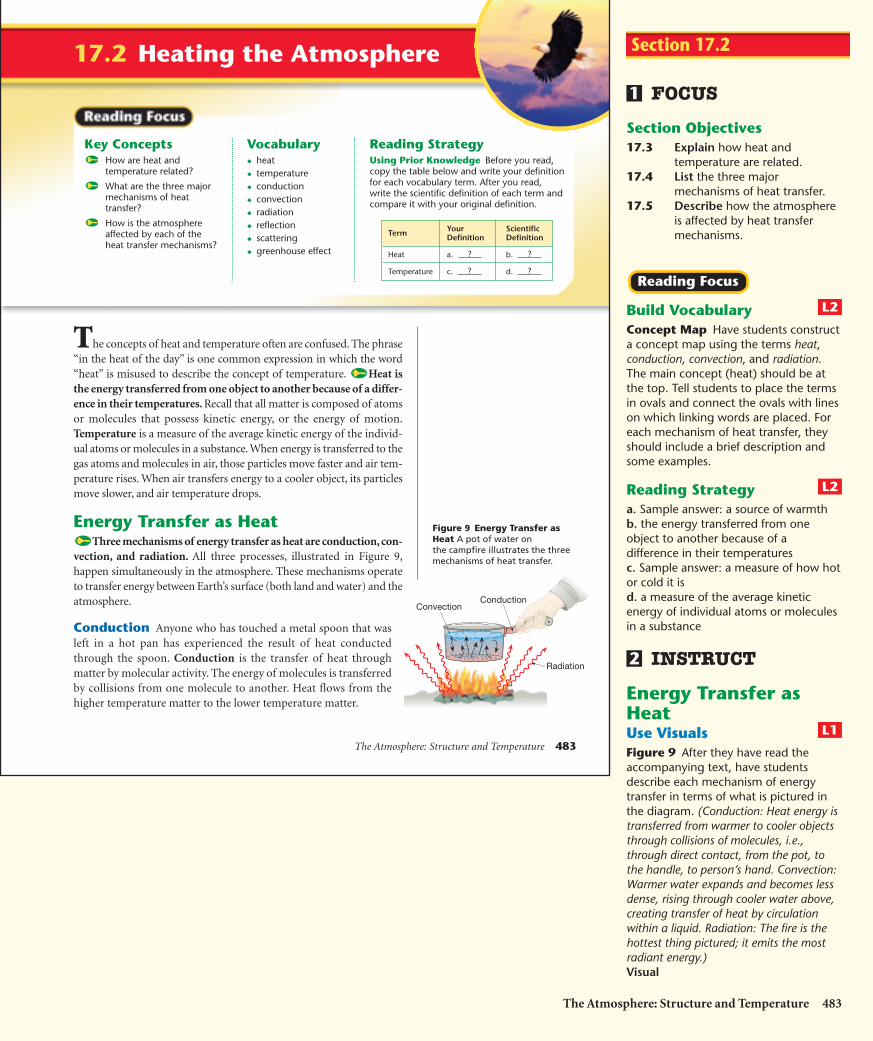
The concepts of heat and temperature often are confused. The phrase“in the heat of the day” is one common expression in which the word“heat” is misused to describe the concept of temperature. Heat isthe energy transferred from one object to another because of a differ-ence in their temperatures. Recall that all matter is composed of atomsor molecules that possess kinetic energy, or the energy of motion.Temperature is a measure of the average kinetic energy of the individ-ual atoms or molecules in a substance. When energy is transferred to thegas atoms and molecules in air, those particles move faster and air tem-perature rises. When air transfers energy to a cooler object, its particlesmove slower, and air temperature drops.
Energy Transfer as HeatThree mechanisms of energy transfer as heat are conduction, con-
vection, and radiation. All three processes, illustrated in Figure 9,happen simultaneously in the atmosphere. These mechanisms operateto transfer energy between Earth’s surface (both land and water) and theatmosphere.
Conduction Anyone who has touched a metal spoon that wasleft in a hot pan has experienced the result of heat conductedthrough the spoon. Conduction is the transfer of heat throughmatter by molecular activity. The energy of molecules is transferredby collisions from one molecule to another. Heat flows from thehigher temperature matter to the lower temperature matter.
Term Your ScientificDefinition Definition
Heat a. b.
Temperature c. d. ??
??
Figure 9 Energy Transfer asHeat A pot of water on the campfire illustrates the threemechanisms of heat transfer.
ConvectionConduction
Radiation
FOCUS
Section Objectives17.3 Explain how heat and
temperature are related.17.4 List the three major
mechanisms of heat transfer.17.5 Describe how the atmosphere
is affected by heat transfermechanisms.
Build VocabularyConcept Map Have students constructa concept map using the terms heat,conduction, convection, and radiation.The main concept (heat) should be atthe top. Tell students to place the termsin ovals and connect the ovals with lineson which linking words are placed. Foreach mechanism of heat transfer, theyshould include a brief description andsome examples.
Reading Strategya. Sample answer: a source of warmthb. the energy transferred from oneobject to another because of adifference in their temperaturesc. Sample answer: a measure of how hotor cold it isd. a measure of the average kineticenergy of individual atoms or moleculesin a substance
INSTRUCT
Energy Transfer asHeatUse VisualsFigure 9 After they have read theaccompanying text, have studentsdescribe each mechanism of energytransfer in terms of what is pictured inthe diagram. (Conduction: Heat energy istransferred from warmer to cooler objectsthrough collisions of molecules, i.e.,through direct contact, from the pot, tothe handle, to person’s hand. Convection:Warmer water expands and becomes lessdense, rising through cooler water above,creating transfer of heat by circulationwithin a liquid. Radiation: The fire is thehottest thing pictured; it emits the mostradiant energy.)Visual
L1
2
L2
L2
Reading Focus
1
The Atmosphere: Structure and Temperature 483
Section 17.2
HSES_1eTE_C17.qxd 5/16/04 1:29 PM Page 483

484 Chapter 17
The ability of substances to conduct heat varies greatly. Metals aregood conductors, as those of us who have touched hot metal have quicklylearned. Air, however, is a very poor conductor of heat. Because air is apoor conductor, conduction is important only between Earth’s surfaceand the air directly in contact with the surface. For the atmosphere as awhole, conduction is the least important mechanism of heat transfer.
Convection Much of the heat transfer that occurs in the atmos-phere is carried on by convection. Convection is the transfer of heat bymass movement or circulation within a substance. It takes place influids, like the ocean and air, where the atoms and molecules are freeto move about. Convection also takes place in solids, such as Earth’smantle, that behave like fluids over long periods of time.
The pan of water in Figure 9 shows circulation by convection.Radiation from the fire warms the bottom of the pan, which conductsheat to the water near the bottom of the container. As the water isheated, it expands and becomes less dense than the water above. Thewarmer water rises because of its buoyancy. At the same time, cooler,denser water near the top of the pan sinks to the bottom, where itbecomes heated. As long as the water is heated unequally, it will con-tinue to circulate. In much the same way, most of the heat acquired byradiation and conduction in the lowest layer of the atmosphere istransferred by convective flow.
Electromagnetic WavesThe sun is the ultimate source ofenergy that creates our weather.You know that the sun emitslight and heat as well as theultraviolet rays that cause asuntan. These forms of energyare only part of a large array ofenergy called the electromag-netic spectrum. This spectrumof electromagnetic energy isshown in Figure 10. All radia-tion, whether X-rays, radio
waves, or heat waves, travel through the vacuum of space at 300,000kilometers per second. They travel only slightly slower through ouratmosphere.
What is convection?
Long radiowavesS
tand
ard
AM
rad
ioB
road
cast
ban
d
Sho
rt-w
ave
rad
io
Tele
visi
on, F
M r
adio
MicrowavesInfrared
Visiblelight
Ultr
avio
let
X raysGamma
rays
1000meters
1meter
1000micrometers
1micrometer
0.001micrometer
Long-wave radiationShort-wave radiation
0.7Red
0.6OrangeYellow0.5
GreenBlue0.4Violet
Figure 10 ElectromagneticSpectrum Electromagneticenergy is classified according to wavelength in theelectromagnetic spectrum.
484 Chapter 17
Heat ConductionPurpose Students observe differencesin the ability of different substances toconduct heat.
Materials red candle, wood, metal,and plastic rods of the same length(at least 15 cm), 500-mL beaker,water, hot plate
Procedure Before doing the demo, usethe candle to drip spots of wax at about1-cm intervals onto all of the rods. Then,place the rods in about 1 cm of water inthe beaker. Put the beaker on the hotplate and turn it on. Ask students topredict what they think will happen.Have them observe what actuallyhappens. Then ask them to explaintheir observations.
Expected Outcome The wax dots willmelt in order from the bottom up. Thedots on the metal rod will melt thefastest (since metal conducts heat thebest), followed by the plastic and thenthe wood.Visual, Logical
Build Science SkillsUsing Models Havestudents work in pairsto develop ways tomodel the threemethods of heat transfer. Give eachpair a crumpled-up piece of scrap paperand tell them it represents heat. Eachstudent represents a molecule. Tellstudents to use physical movementsto model each method of transfer. Forexample, to demonstrate conduction,students can pass the ball directly to thepartner; for convection, students cancarry the ball to the partner; and forradiation, students can throw the ballto the partner.Kinesthetic, Logical
L2
L2
Section 17.2 (continued)
Customize for Inclusion Students
Gifted Have students create a computergraphics presentation that compares thedifferent mechanisms of heat transfer. The
presentations should include both diagramsand photographs.
HSES_1eTE_C17.qxd 5/16/04 1:29 PM Page 484

The Atmosphere: Structure and Temperature 485
Imagine what happens when you toss apebble into a pond. Ripples are made andmove away from the location where thepebble hit the water’s surface. Much likethese ripples, electromagnetic waves moveout from their source and come in varioussizes. The most important difference amongelectromagnetic waves is their wavelength, orthe distance from one crest to the next. Radiowaves have the longest wavelengths, rangingto tens of kilometers. Gamma waves are theshortest, and are less than a billionth of acentimeter long.
Visible light is the only portion of thespectrum you can see. White light is really amixture of colors. Each color corresponds toa specific wavelength, as shown in Figure 11. By using a prism, whitelight can be divided into the colors of the rainbow, from violet with theshortest wavelength—0.4 micrometer (1 micrometer is 0.0001 cen-timeter)—to red with the longest wavelength—0.7 micrometer.
Radiation The third mechanism of heat transfer is radiation. Asshown in Figure 9, radiation travels out in all directions from itssource. Unlike conduction and convection, which need materialto travel through, radiant energy can travel through the vacuum ofspace. Solar energy reaches Earth by radiation.
To understand how the atmosphere is heated, it is useful to thinkabout four laws governing radiation.1. All objects, at any temperature, emit radiant energy. Not only
hot objects like the sun but also Earth—including its polar icecaps—continually emit energy.
2. Hotter objects radiate more total energy per unit area thancolder objects do.
3. The hottest radiating bodies produce the shortest wave-lengths of maximum radiation. For example, the sun, with asurface temperature of nearly 6000°C radiates maximum energyat 0.5 micrometers, which is in the visible range. The maximumradiation for Earth occurs at a wavelength of 10 micrometers, wellwithin the infrared range.
4. Objects that are good absorbers of radiation are good emit-ters as well. Gases are selective absorbers and radiators. Theatmosphere does not absorb certain wavelengths of radiation, butit is a good absorber of other wavelengths.
Figure 11 Visible light consists ofan array of colors commonlycalled the colors of the rainbow.
For: Links on conduction andconvection
Visit: www.SciLinks.org
Web Code: cjn-6172
Build Reading LiteracyRefer to p. 474D, which provides theguidelines for monitoringunderstanding.
Monitor Your Understanding Havestudents read the passage Radiation onpp. 484–485. When they reach thebottom of p. 485, have them stopand write down the main ideas of thepassage. They should have two maingroups of ideas: the different types ofelectromagnetic waves, and the lawsthat govern radiation. Have studentsask themselves, “Did I have any troublereading this passage? If so, why?” Leada class discussion of strategies that canbe used to improve understanding,such as looking up difficult wordsand discussing difficult concepts witha partner. Have students use thesestrategies as they continue reading.Logical, Verbal
Integrate PhysicsRainbows Tell students that a rainbowoccurs when white light passes throughtiny drops of water in the air. Each waterdrop acts like a tiny prism. When lightenters a drop, it slows down andrefracts, or bends. Red light slows downand bends the least, whereas violet lightslows down and bends the most. Thelight then reflects off the far innersurface of the drop and passes backthrough the drop, refracting again.Have students use prisms to separatelight into a spectrum and project itonto a sheet of white paper.Logical
L2
L1
The Atmosphere: Structure and Temperature 485
Answer to . . .
Convection is thetransfer of heat by
mass movement or circulation withina substance.
Download a worksheet onconduction and convection forstudents to complete, and findadditional teacher support fromNSTA SciLinks.
HSES_1eTE_C17.qxd 5/16/04 1:29 PM Page 485

486 Chapter 17
5% backscatteredto space by the
atmosphere
20%reflected
fromclouds
5% reflected fromland-sea surface
30% lost to space byreflection and scattering
20% of radiationabsorbed byatmosphereand clouds
50% of direct and diffused radiationabsorbed by land and sea
Solar radiation100%
What Happens toSolar Radiation?
When radiation strikes an object,there usually are three different results.1. Some energy is absorbed by the
object. When radiant energy isabsorbed, it is converted to heatand causes a temperature increase.
2. Substances such as water and air aretransparent to certain wavelengthsof radiation. These substances trans-mit the radiant energy. Radiationthat is transmitted does not con-tribute energy to the object.
3. Some radiation may bounce off theobject without being absorbed ortransmitted. Figure 12 shows whathappens to incoming solar radia-tion, averaged for the entire globe.
Figure 12 Solar Radiation Thisdiagram shows what happens, onaverage, to incoming solarradiation by percentage.
Figure 13 Reflection vs.ScatteringA Reflected light bounces backwith the same intensity. B Scattering produces more lightrays with a weaker intensity.
Reflection and Scattering Reflection occurs when lightbounces off an object. The reflected radiation has the same intensity asthe incident radiation. In contrast, scattering produces a larger numberof weaker rays that travel in different directions. See Figure 13.Scattering disperses light both forward and backward. However, moreenergy is dispersed in the forward direction. About 30 percent of thesolar energy reaching the outer atmosphere is reflected back to space.This 30 percent also includes the amount of energy sent skyward byscattering. This energy is lost and does not play a role in heating Earth’satmosphere.
Small dust particles and gas molecules in the atmosphere scattersome incoming radiation in all directions. This explains how light
reaches into the area beneath a shade tree, and how aroom is lit in the absence of direct sunlight. Scatteringalso accounts for the brightness and even the blue colorof the daytime sky. In contrast, bodies like the moon andMercury—which are without atmospheres—have darkskies and “pitch-black” shadows even during daylighthours. About half of the solar radiation that is absorbedat Earth’s surface arrives as scattered light.
What causes the blue colorof the daytime sky?
Reflection Scattering
A B
486 Chapter 17
What Happens toSolar Radiation?Use VisualsFigure 12 Use the diagram to discusswhat happens to solar radiation. Ask:What percentage of radiation isreflected from clouds? (20 percent)What percentage of radiation is lostto space by reflection and scattering?(30 percent) What types of radiationare absorbed by land and sea? (directand diffused radiation)Visual
Build Science SkillsApplying ConceptsDim the room lightsand shine a beam oflight through the airfrom a large flashlight or other stronglight source. Have students look at thebeam and describe what they see. (tiny particles) Ask students whatphenomenon allows them to see theseparticles. (scattering)Logical
L2
L1
Section 17.2 (continued)
The fraction of the total radiation that isreflected by a surface is called its albedo. Thealbedo for Earth as a whole (the planetaryalbedo) is 30 percent. The albedo variesconsiderably from place to place and time totime in the same location. Albedo can varywith amount of cloud cover and particles in
the air, as well as the nature of the surface andthe angle of the sun’s rays. A lower sun anglemeans that the rays pass through more of theatmosphere, and more solar radiation is lost.Albedo can be as low as 5 percent for a forestand as high as 90 percent for fresh snow.
Facts and Figures
HSES_1eTE_C17.qxd 10/11/04 12:00 PM Page 486

Section 17.2 Assessment
Absorption About 50 percent of the solar energy that strikesthe top of the atmosphere reaches Earth’s surface and is absorbed,as shown in Figure 12. Most of this energy is then reradiated sky-ward. Because Earth has a much lower surface temperature than thesun, the radiation that it emits has longer wavelengths than solarradiation does.
The atmosphere efficiently absorbs the longer wavelengths emit-ted by Earth. Water vapor and carbon dioxide are the majorabsorbing gases. When a gas molecule absorbs light waves, thisenergy is transformed into molecular motion that can be detected asa rise in temperature. Gases in the atmosphere eventually radiatesome of this energy away. Some energy travels skyward, where it maybe reabsorbed by other gas molecules. The remainder travelsEarthward and is again absorbed by Earth. In this way, Earth’s surfaceis continually being supplied with heat from the atmosphere as wellas from the sun.
Without these absorbing gases in our atmosphere, Earth wouldnot be a suitable habitat for humans and other life forms. Thisimportant phenomenon has been termed the greenhouse effectbecause it was once thought that greenhouses were heated in a sim-ilar manner. A more important factor in keeping a greenhouse warmis the fact that the greenhouse itself prevents the mixing of air insidewith cooler air outside. Nevertheless, the term greenhouse effect isstill used.
Critical Thinking6. Applying Concepts Dark objects tend to
absorb more radiation than light-coloredobjects. Explain whether dark objects or lightobjects on Earth’s surface would be betterradiators of heat.
Reviewing Concepts1. How are heat and temperature related?
2. List and describe the three majormechanisms of heat transfer in theatmosphere.
3. How is the atmosphere affected by
a. convection?
b. conduction?
c. radiation?
4. Describe what happens to solar radiationwhen it strikes an object.
5. Contrast reflection and scattering.
Descriptive Paragraph Write a paragraphthat describes the four laws governing radia-tion discussed in this chapter. Make sure touse your own words. Use examples to rein-force concepts wherever possible.
Q Isn’t the greenhouse effectresponsible for global warming?
A It is important to note thatthe greenhouse effect and glob-al warming are not the samething. Without the greenhouseeffect, Earth would be uninhab-itable. We do have mountingevidence that human activity(particularly the release of car-bon dioxide into the atmos-phere) is responsible for a risein global temperatures. Thus,human activities seem to beenhancing an otherwise naturalprocess (the greenhouse effect)to increase Earth’s temperature.Nevertheless, to equate thegreenhouse effect, which makeslife possible, with undesirablechanges to our atmospherecaused by human activity isincorrect.
The Atmosphere: Structure and Temperature 487
Students often think that the green-house effect and global warming are thesame phenomenon. Emphasize that thegreenhouse effect occurs naturally and isessential to keeping the atmospherewarm enough for living things to surviveon Earth. Global warming, on the otherhand, is an increase in the temperatureof Earth’s atmosphere that may becaused or influenced by humanactivities.Logical
ASSESSEvaluateUnderstandingAsk students to list and describe thethree ways heat can be transferred. Havethem give an example of each processin the atmosphere.
ReteachUse Figure 12 to review what happensto incoming solar radiation.
Student paragraphs should clearly statethe fundamental principles of radiation,and they should include examples toreinforce the principles.
The four laws are: All objects emitradiant energy, hotter objects radiatemore energy than colder objects, thehottest radiating bodies produce theshortest wavelengths of maximumradiation, objects that are goodabsorbers are also good emitters.
L1
L2
3
L2
The Atmosphere: Structure and Temperature 487
3. Convection: Much of the heat transfer inthe atmosphere is carried by convection.Most of the heat acquired by radiation andconduction in the lowest layer of the atmos-phere is transferred by convective flow;Conduction: Air is a poor conductor of heat,so conduction is most important betweenEarth’s surface and the air directly in contactwith the surface. Conduction is the leastimportant mechanism of heat transfer in theatmosphere; Radiation: Solar energy reachesEarth by radiation. The radiation can be ab-sorbed, transmitted, or reflected. The radiant
Section 17.2 Assessment
1. Both heat and temperature arise fromthermal vibrations in atoms and molecules.Heat is energy transferred between objects(matter) that are at different temperatures.Temperature is the average kinetic energyof individual atoms and molecules in thesubstance.2. Conduction: heat transfer through matterby particle activity. Convection: heat transferby mass movement within a substance.Radiation: energy transfer by electromag-netic waves.
Answer to . . .
The blue color is causedby gas molecules in the
atmosphere that scatter incoming solarradiation.
energy that is absorbed is converted to heatand causes an increase in temperature.4. When solar radiation strikes an object, itcan absorb, reflect, or scatter the radiation.5. Reflection: radiation bouncing off anobject at the same angle and intensity as theincident radiation. Scattering: radiationbouncing off in all directions with intensitiesthat are weaker than the incident radiation.6. Because good absorbers also tend to begood radiators of heat, dark-colored objectsare expected to be better radiators thanlight-colored objects.
HSES_1eTE_C17.qxd 9/24/04 7:06 PM Page 487

488 Chapter 17
17.3 Temperature Controls
Reading StrategyPreviewing Copy the table below. Beforeyou read, use Figure 15 to describe thetemperature variations for Vancouver andWinnipeg.
Key ConceptsWhat is a temperaturecontrol?
How do the heating ofland and water differ?
Why do some cloudsreflect a portion ofsunlight back to space?
Vocabulary◆ albedo◆ isotherm
Temperature is one of the basic elements of weatherand climate. When someone asks what it is like outside,air temperature is often the first element we mention. Ata weather station, the temperature is read on a regularbasis from instruments mounted in an instrument shelterlike the one in Figure 14. The shelter protects the instru-ments from direct sunlight and allows a free flow of air.
Why Temperatures VaryA temperature control is any factor that causes tempera-ture to vary from place to place and from time to time.Earlier in this chapter you examined the most importantcause for temperature variations—differences in thereceipt of solar radiation. Because variations in the angleof the sun’s rays and length of daylight depend on latitude,they are responsible for warmer temperatures in the trop-ics and colder temperatures toward the poles. Seasonaltemperature changes happen as the sun’s vertical raysmove toward and away from a particular latitude duringthe year. Factors other than latitude that exert astrong influence on temperature include heating of landand water, altitude, geographic position, cloud cover,and ocean currents.
List three factors that influence temperature.
Figure 14 This moderninstrument shelter contains anelectrical thermometer called athermistor.
Temperature Variations
Vancouver a.
Winnipeg b. ?
?
488 Chapter 17
FOCUS
Section Objectives17.6 Explain what a temperature
control is.17.7 Compare and contrast the
heating of land and water.17.8 Explain why some clouds
reflect a portion of sunlightback to space.
Build VocabularyLINCS Have students use the LINCSstrategy to learn and review the termsalbedo, windward, leeward, and isotherm.In LINCS exercises, students List whatthey know about each term, Imagine apicture that describes the word, Note a“sound-alike” word, Connect the termsto the sound-alike word by making up ashort story, and then perform a briefSelf-test.
Reading Strategya. slight temperature variationb. more extreme temperature variation
INSTRUCT
Why TemperaturesVaryBuild Science SkillsInterpreting Photographs Havestudents look at Figure 14 carefully.Ask: What is inside this shelter? (anelectrical thermometer called a thermistor)Why does the thermistor need to beprotected by a shelter? (Direct sunlightwould spoil the temperature readings, andit needs to be protected from breaking.)What does the shelter need to havevents for air flow? (The air inside theshelter cannot get hotter than theoutside air.)Logical, Visual
L2
2
L2
L2
Reading Focus
1
Section 17.3
HSES_1eTE_C17.qxd 5/16/04 1:29 PM Page 488

The Atmosphere: Structure and Temperature 489
Land and Water The heating of Earth’s surface controls the tem-perature of the air above it. To understand variations in air temperature,we consider the characteristics of the surface. Different land surfacesabsorb varying amounts of incoming solar energy. The largest contrast,however, is between land and water. Land heats more rapidly andto higher temperatures than water. Land also cools more rapidly andto lower temperatures than water. Temperature variations, therefore,are considerably greater over land than over water.
Monthly temperature data for two cities, shown in Figure 15, showthe influence of a large body of water. Vancouver, British Columbia, islocated along the windward Pacific coast. Winnipeg,Manitoba, is far from the influence of water. Both cities areat about the same latitude, so they experience similarlengths of daylight and angles of the sun’s rays. Winnipeg,however, has much greater temperature extremes thanVancouver does.Vancouver’s moderate year-round climateis due to its location by the Pacific Ocean.
Temperature variations in the Northern and Southernhemispheres are compared in Table 1. Water accounts for61 percent of the Northern Hemisphere, and landaccounts for the remaining 39 percent. In the SouthernHemisphere, 81 percent of the surface is water and only 19percent of the surface is land. The Southern Hemisphereshows smaller annual temperature variations.
Tem
per
atur
e (˚C
)
24
20
16
12
8
4
0
– 4
– 8
–12
–16
–20
Month
J F M A M J J A S O N D
Vancouver
(marine)W
inni
peg
(con
tinen
tal)
• VancouverWinnipeg •
Canada
United States
Tem
per
atur
e (˚F
)
40
70
60
50
30
20
10
0
Figure 15 Mean MonthlyTemperatures for Vancouver andWinnipeg Winnipeg illustrates thegreater extremes associated with aninterior location. Calculating How much lower isWinnipeg’s January mean temperaturethan Vancouver’s? Calculate thetemperature to the nearest degree.
Northern Southern Latitude Hemisphere Hemisphere
0 0 0
15 3 4
30 13 7
45 23 6
60 30 11
75 32 26
90 40 31
Table 1 Variation in Annual MeanTemperature Range (ºC) with Latitude
Integrating PhysicsSpecific Heat Water requires a greatdeal more heat to raise its temperaturethe same amount as an equal quantityof land. The amount of energy neededto raise the temperature of 1 g of asubstance 1°C is its specific heat. Thehigher a substance’s specific heat, themore heat it takes to raise its temp-erature a certain amount. Ask: Whenyou go to the beach on a sunny day,why does the sand feel hot? (The sandhas a low specific heat, so its temperaturerises quickly.) Why does the water feelcold even though it is sunny? (Thewater has a high specific heat, so itstemperature rises slowly.)Logical
Use VisualsFigure 15 Use this graph to helpstudents understand how data arepresented on climate graphs. Ask:What does the left axis indicate?(temperature in degrees Celsius)What does the right axis indicate?(temperature in degrees Fahrenheit)What does the bottom axis indicate?(month) What do the curves forVancouver and Winnipeg indicateabout their climates? (They havesimilar summer climates but Winnipeghas a much colder winter climate.)Visual, Logical
L1
L2
The Atmosphere: Structure and Temperature 489
Customize for English Language Learners
ELL students can benefit from relatingexamples from their lives to material in thesection. Encourage students to think about the
climate where they were born or grew up.Have them explain that climate in terms of thefactors that influence temperature. Answer to . . .
Figure 15 It is 21°C lower.
Accept any three ofthe following: latitude,
differential heating of land and water,altitude, geographic position, cloudcover, ocean currents
HSES_1eTE_C17.qxd 5/16/04 1:29 PM Page 489

490 Chapter 17
Geographic Position The geographic setting can greatlyinfluence temperatures experienced at a specific location. ExamineFigure 16. A coastal location where prevailing winds blow from theocean onto the shore (a windward coast) experiences considerably dif-ferent temperatures than does a coastal location where the prevailingwinds blow from the land toward the ocean (a leeward coast). In thefirst situation, the windward coast will experience the full moderatinginfluence of the ocean—cool summers and mild winters, compared toan inland station at the same latitude. In contrast, a leeward coast willhave a more continental temperature pattern because winds do notcarry the ocean’s influence onshore. Eureka, California, and New YorkCity illustrate this aspect of geographic position. The annual temper-ature range in New York City is 19°C greater than Eureka’s range.
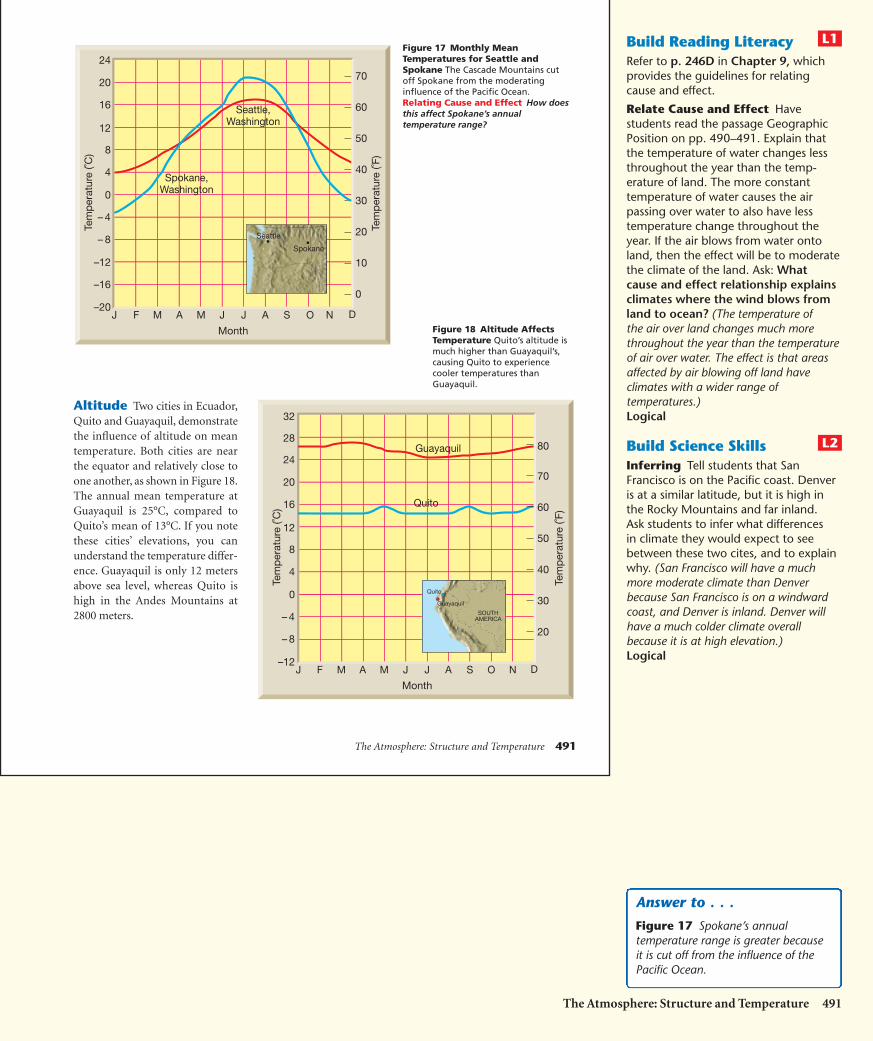
Seattle and Spokane, both in the state of Washington, illustrateanother aspect of geographic position—mountains that act as barriers.Although Spokane is only about 360 kilometers east of Seattle, the tow-ering Cascade Range separates the cities. As a result, Seattle’stemperatures show a marine influence, but Spokane’s are more typi-cally continental, as shown in Figure 17. Spokane is 7°C cooler thanSeattle in January and 4°C warmer than Seattle in July. The annualrange in Spokane is 11°C greater than in Seattle. The Cascade Rangecuts Spokane off from the moderating influence of the Pacific Ocean.
Figure 16 Monthly MeanTemperatures for Eureka and NewYork City Eureka is stronglyinfluenced by prevailing ocean winds,and New York City is not.
Eureka, California(Windward)
New York City(Leeward)
Tem
per
atur
e (˚C
)
24
20
16
12
8
4
0
– 4
– 8
–12
–16
–20
Month
J F M A M J J A S O N D
New York City••Eureka
Tem
per
atur
e (˚F
)
40
70
60
50
30
20
10
0
490 Chapter 17
Heating of Landand WaterPurpose Students observe how landand water heat up at different rates.
Materials 2 500-mL beakers, water,sand or dry soil, 2 thermometers, sunnywindow or lamp with 100-W bulb
Procedure Before the demo, half-fillone beaker with water and the otherwith sand or dry soil. Put a thermometerinto each (well below the surface of thesoil), and set them aside until they bothreach room temperature. Show studentsthe beakers and that both are at thesame temperature. Place them in asunny spot or under a hot lamp. Asstudents what they think will happen.Check the thermometers regularly untilyou see a noticeable difference. Askstudents to explain the results.
Expected Outcome The temperatureof the soil will increase much faster thanthe temperature of the water.Visual, Logical
L2
Section 17.3 (continued)
There are many reasons why land and waterheat up differently. First, water has a muchhigher specific heat capacity than land, so itheats up more slowly. Second, land surfacesare opaque, so energy is absorbed only at thesurface. Water absorbs energy to a depth of
several meters. Third, when surface water isheated, it often mixes with water below it,distributing the heat through a larger mass ofwater. Fourth, evaporation, which is a coolingprocess, is greater from water surfaces thanfrom land.
Facts and Figures
HSES_1eTE_C17.qxd 9/24/04 7:07 PM Page 490
The Atmosphere: Structure and Temperature 491
Altitude Two cities in Ecuador,Quito and Guayaquil, demonstratethe influence of altitude on meantemperature. Both cities are nearthe equator and relatively close toone another, as shown in Figure 18.The annual mean temperature atGuayaquil is 25°C, compared toQuito’s mean of 13°C. If you notethese cities’ elevations, you canunderstand the temperature differ-ence. Guayaquil is only 12 metersabove sea level, whereas Quito ishigh in the Andes Mountains at2800 meters.
Seattle,Washington
Spokane,Washington
Tem
per
atur
e (˚C
)
24
20
16
12
8
4
0
– 4
– 8
–12
–16
–20
Month
J F M A M J J A S O N D
Tem
per
atur
e (˚F
)
40
70
60
50
30
20
10
0
Spokane
Seattle• •
Quito
Guayaquil
Quito
Guayaquil
SOUTHAMERICA
Tem
per
atur
e (˚C
)
24
20
16
12
8
4
0
– 4
– 8
–12
Month
J F M A M J J A S O N D
Tem
per
atur
e (˚F
)40
70
60
50
30
20
28
32
80
Figure 18 Altitude AffectsTemperature Quito’s altitude ismuch higher than Guayaquil’s,causing Quito to experiencecooler temperatures thanGuayaquil.
Figure 17 Monthly MeanTemperatures for Seattle andSpokane The Cascade Mountains cutoff Spokane from the moderatinginfluence of the Pacific Ocean.Relating Cause and Effect How doesthis affect Spokane’s annualtemperature range?
Build Reading LiteracyRefer to p. 246D in Chapter 9, whichprovides the guidelines for relatingcause and effect.
Relate Cause and Effect Havestudents read the passage GeographicPosition on pp. 490–491. Explain thatthe temperature of water changes lessthroughout the year than the temp-erature of land. The more constanttemperature of water causes the airpassing over water to also have lesstemperature change throughout theyear. If the air blows from water ontoland, then the effect will be to moderatethe climate of the land. Ask: Whatcause and effect relationship explainsclimates where the wind blows fromland to ocean? (The temperature ofthe air over land changes much morethroughout the year than the temperatureof air over water. The effect is that areasaffected by air blowing off land haveclimates with a wider range oftemperatures.)Logical
Build Science SkillsInferring Tell students that SanFrancisco is on the Pacific coast. Denveris at a similar latitude, but it is high inthe Rocky Mountains and far inland.Ask students to infer what differencesin climate they would expect to seebetween these two cites, and to explainwhy. (San Francisco will have a muchmore moderate climate than Denverbecause San Francisco is on a windwardcoast, and Denver is inland. Denver willhave a much colder climate overallbecause it is at high elevation.)Logical
L2
L1
The Atmosphere: Structure and Temperature 491
Answer to . . .
Figure 17 Spokane’s annualtemperature range is greater becauseit is cut off from the influence of thePacific Ocean.
HSES_1eTE_C17.qxd 9/24/04 7:07 PM Page 491

492 Chapter 17
Cloud Cover and Albedo Albedo is the fraction of total radi-ation that is reflected by any surface. Many clouds have a highalbedo, and therefore reflect a significant portion of the sunlight thatstrikes them back to space. The extent of cloud cover is a factor thatinfluences temperatures in the lower atmosphere. By reducing theamount of incoming solar radiation, the maximum temperatures ona cloud-covered day will be lower than on a day when the clouds areabsent and the sky is clear, as shown in Figure 19A.
At night, clouds have the opposite effect, as shown in Figure 19B.Clouds act as a blanket by absorbing outgoing radiation emitted byEarth and reradiating a portion of it back to the surface. Thus, cloudynighttime air temperatures do not drop as low as they would on aclear night. The effect of cloud cover is to reduce the daily tempera-ture range by lowering the daytime maximum and raising thenighttime minimum.
World Distribution of TemperatureTake a moment to study Figure 20, which is a world isothermal map.Isotherms are lines that connect points that have the same temperature.From hot colors near the equator to cool colors toward the poles, thismap shows mean sea-level temperatures in the seasonally extreme monthof July. All temperatures on this map have been reduced to sea level toeliminate complications caused by differences in altitude.
On this map, you can study global temperature patterns and theeffects of the controlling factors of temperature, especially latitude,distribution of land and water, and ocean currents. The isotherms gen-erally trend east and west and show a decrease in temperatures fromthe tropics toward the poles. This map emphasizes the importance oflatitude as a control on incoming solar radiation, which in turn heatsEarth’s surface and the atmosphere above it.
Figure 19 A During daylighthours, clouds reflect solarradiation back to space. B Atnight, clouds absorb radiationfrom the land and reradiate someof it back to Earth, increasingnighttime temperatures.
A B
492 Chapter 17
Use VisualsFigure 19 Use the diagrams to helpstudents understand the effect cloudcover has on temperature. Ask: What ishappening to the solar radiation inFigure A? (The clouds are reflecting thesolar energy back into space.) How dothe clouds during the day affect thetemperature? (Because they reflect thesolar radiation, less radiation reachesEarth, so the temperatures are lower.)What is happening in Figure B? (Theclouds are absorbing radiation from landand reradiating some of it to Earth.) Howdo the clouds affect the temperature?(The clouds increase the temperaturebecause they are re-radiating the radiationfrom the land, increasing the temperature.)Why do clouds during the day andnight affect temperature differently?(They block the radiation in different ways.During the day, they block the sun’sradiation, and during the night theyblock the radiation from land.)Visual, Logical
World Distributionof TemperatureUse CommunityResourcesInvite a climatologist from a localcollege to visit the classroom anddiscuss factors that affect climate andworldwide temperature patterns. Askstudents to prepare questions for theclimatologist in advance. Remind themto use Who, What, Where, When, Why,and How questions.Interpersonal
L2
L1
Section 17.3 (continued)
The highest temperature ever recorded atEarth’s surface is nearly 59°C. It was recordedon September 13, 1922, at Azizia, Libya, inNorth Africa’s Sahara Desert. Not surprisingly,the lowest temperature was measured inAntarctica. It was –89°C. This temperature
was recorded at the Russian Vostok Station onAugust 24, 1960. The greatest annual rangeof temperatures is in Siberia (eastern Russia).Temperatures in Verkhoyansk, Siberia havegone from �68°C to 37°C, a span of 105°C.
Facts and Figures
HSES_1eTE_C17.qxd 5/16/04 1:30 PM Page 492

Section 17.3 Assessment
20°
40°
60°
80°
100°120°140°160°180°
0°
20°
40°
60°
80° 80° 60° 40° 20° 0° 20° 40°160°140°120°100°80°
0°
10°
15°
20°
25°
30°
5°
5°
25°
20°15°
10°
–10°–20°
30°
30°
10°15°20°
25°
5°
5°
25°
20°15°
10°
–10°
–20°JULY
0°
35°35° 35°
35°35°
0°
Figure 20
Regions The map shows the distribution ofworld mean sea-level temperatures averaged forthe month of July. Locating Estimate the latitude range fortemperatures between 20 and 25 degrees Celsius
in the Northern Hemisphere. Approximate to thenearest 5 degrees latitude for each extreme. Predicting Do you expect the color of thetemperature band to change near the equator forthe month of January? Explain your prediction.
Critical Thinking6. Inferring Look back at the graph in
Figure 18. Why do the temperatures ofthese two cities stay within a limited rangethroughout the year?
Reviewing Concepts1. What is a temperature control?
2. How do the heating of land and waterdiffer?
3. Why do many clouds reflect a significantamount of sunlight back to space?
4. Why do some coastal cities experience amoderation of temperature from water, whileothers do not?
5. List four specific controls of atmospherictemperature.
7. Using the data in Table 1, determinethe latitude that shows the greatestvariation in average mean temperaturebetween the Northern and SouthernHemispheres.
The Atmosphere: Structure and Temperature 493
World Isothermal Map
AnswersLocating The range is approximately10°N latitude to 55°N latitude.
Predicting No; regions near theequator receive about the same amountof solar radiation all year long.
ASSESSEvaluateUnderstandingAsk students to describe and explainthree factors that have a stronginfluence on temperature.
ReteachUse Figure 19 to review how cloudsaffect surface temperatures during theday and night.
Solution7. 60°
L1
L2
3
The Atmosphere: Structure and Temperature 493
4. Some coastal cities are influenced morestrongly from prevailing ocean winds thanothers are.5. Accept any of the following: latitude, alti-tude, geographic position, continental versusmarine positions, ocean currents.6. because they are both located near theequator and receive about the same amountof solar radiation all year long
Section 17.3 Assessment
1. A temperature control is any factor thatcauses temperature to vary from place toplace and from time to time.2. Land heats and cools more rapidly andto greater temperature extremes than waterdoes.3. Clouds reflect a significant amount ofsunlight back to space because of theirhigh albedos.
HSES_1eTE_C17.qxd 5/16/04 1:30 PM Page 493

Earth’s AtmosphereThe outermost part of the Earth is the atmosphere, a multilayeredmixture of gases, water vapor, and tiny solid particles. It extendsat least 600 miles (1,000 km) above the solid surface of the Earth, but about half the mass of these gases is in the lowest (5.6 kilometers). The atmosphere’s gasessupport plant and animal life. Theyalso protect the Earth from thesun’s harmful rays. The layerof the atmosphere closest toland is the troposphere.It contains the air that webreathe. Here, temper-ature and humiditychange rapidly, and theair is turbulent, creatingweather patterns.
OXYGEN FROM PHOTOSYNTHESISOxygen is a relative newcomer in theEarth’s atmosphere. It has come fromplants that, during photosynthesis,use carbon dioxide to make their food,while giving out oxygen. The earliestphotosynthesizing plants, which prob-ably looked like these algae, evolvedabout 3,500 million years ago.
THE ATMOSPHEREFROM SPACEViewed from space, theEarth looks totally unlikeother planets of our solarsystem. It is partly shrouded in white clouds, which swirl inpatterns, making weather. Clouds aremasses of tiny particles of water and dustfloating in the atmosphere. A very low cloud is called fog.
How the Earth Works
FERTILE LANDThe atmosphere helps life to flourish on the Earth. It
offers protection from harmful radiations and providesnourishment for both plants and animals. Winds in
the troposphere moderate daily and seasonal tempera-tures by distributing heat around the world.
OXYGEN CYCLEA vast store of oxygenexists in oceans, rocks,and the atmosphere.Oxygen created by plantphotosynthesis balancesoxygen used by peopleand animals.
494 Chapter 17
494 Chapter 17
FOCUS
ObjectivesIn this feature, students will be able to• name the layers of Earth’s atmosphere
and the gases it contains.• describe how the atmosphere
supports human and plant lifeon Earth.
• explain how the atmosphere wasformed and how the ozone layer isin danger of being destroyed.
Build VocabularyUnderstand Terms Have studentsexplain how the stratosphere differsfrom the troposphere. Then have themuse the terms to write sentences.
INSTRUCTBellringerAsk students what images come to mindwhen they think of Earth’s atmosphere.Ask: Do you usually think about theatmosphere as just containing thebottom layer where weather occurs?(Answers will vary.) Do you know whatthat layer is called? (troposphere) Doyou know how many other layersthere are? (three other layers)Logical
Build Science SkillsUsing a Chart Discuss the role ofoxygen and carbon dioxide in Earth’satmosphere. Then have volunteers drawa cause-and-effect chart on the board toshow the cycle of how gases are createdand used by humans and plants.Visual
L2
L12
L2
Reading Focus
1
Although the entire troposphere containsoxygen, the amount of oxygen varies atdifferent altitudes. The summit of MountEverest is the highest point on Earth,measuring about 8.8 km high. At that level,oxygen levels are extremely low, which makes
climbing Everest very dangerous. If climbersdo not get enough oxygen, they becomedizzy and disoriented. Today, climbing teamscarry tanks of oxygen with them in theirefforts to reach the summit.
Facts and Figures
HSES_1eTE_C17.qxd 5/16/04 1:30 PM Page 494

GASES IN THE ATMOSPHEREThe most abundant gas in the lower atmosphere isnitrogen, which makes up about 78 percent of air.Oxygen, about 21 percent of air, is essential forsupporting animal life. Carbon dioxide is just atiny fraction of the atmosphere, but it is vital insustaining plant life.
LAYERS OF ATMOSPHEREThe Earth’s atmosphere hasseveral layers. The heights ofthese layers vary with seasonand latitude. Weather is con-fined to the troposphere, andalmost all clouds are below thislevel. In the stratosphere liesthe important ozone layer thatfilters the sun’s rays.
OZONE HOLEWithin the strato-
sphere is the ozone layer,a band of ozone gas that absorbs the sun’s harmfulultraviolet rays. In recent years, the ozone layer hasbeen getting thinner. Certain pollutant gases, such aschlorofluorocarbons, cause ozone molecules to breakdown. Some scientists suggest that ozone depletionalso may be caused by natural phenomena. Holes inthe ozone layer were first detected over Antarctica andthe Arctic. At times, the southern hole has expandedover populated areas of South America, as shown bythe dark blue color in this NASA satellite photograph.
VOLCANIC GASESAbout 4 billion years ago, the Earthhad no atmosphere and its surface
was covered with erupting volca-noes. The Earth’s atmosphere
was formed mostly from gasesspewed out by volcanoes
since the Earth began,although some gases,
like oxygen, are alater contribution.
1. Key Terms Define (a) troposphere,(b) photosynthesis, (c) cloud,(d) ozone layer.
2. Physical Processes How was theearth’s atmosphere formed?
3. Natural Resources How doescarbon dioxide support life?
4. Geographic Tools How does theNASA satellite photograph display thegrowing problem of ozone holes?
5. Critical Thinking AnalyzingProcesses Study the diagramshowing the oxygen cycle. (a) Howwould extensive deforestation affectthe oxygen cycle? (b) Which part ofthe cycle can damage the ozonelayer?
495
Integrate ChemistryTroposphere’s Gases After studentsread the paragraph labeled Earth’sAtmosphere, tell them that thetroposphere includes the air theybreathe. Have students brainstorm tocreate a list of gases that exist in thetroposphere.Logical
ASSESSEvaluateUnderstandingHave students examine the hole in theozone layer shown on the next page.Have students predict some of theproblems South America might beexperiencing because of the hole.
ReteachRefer students to the diagram of thelayers of atmosphere. Have studentssummarize the feature’s sections andmain topics by describing them in termsof what layer they are associated withmost. (Accept all reasonable and accurateanswers. Sample answers—Oxygen fromPhotosynthesis: Troposphere, sincephotosynthesis is a process in plants atthe surface. The Atmosphere from Space:Troposphere, since most weather patternsand cloud masses that can be seen fromspace take shape here, due to rapidchanges in temperature and humidity.Oxygen Cycle and Fertile Land: Tropo-sphere, since these sections describeconditions and processes at the surface,such as photosynthesis and consumingfossil fuels. Gases in the Atmosphere:Troposphere, since about half of the massof gases is in lowest 3.8 miles (5.6 km) ofatmosphere. Ozone Hole: Stratosphere,since this zone is where ozone reactionsoccur. Volcanic Gases: Troposphere, sincevolcanoes erupt at Earth’s surface.)
L1
L2
3
L2
The Atmosphere: Structure and Temperature 495
3. Plants use carbon dioxide to complete theprocess of photosynthesis.4. It uses color to show how the ozone holeover Antarctica has spread.5. (a) It would reduce the number of oxygen-producing plants. (b) burning fossil fuels
Assessment
1. (a) layer of the atmosphere closest to land;(b) the process during which plants use car-bon dioxide to make their food, while givingout oxygen; (c) a mass of tiny particles ofwater and dust floating in the atmosphere;(d) a band of ozone gas that absorbs thesun’s harmful ultraviolet rays2. It was formed mainly from gases spewedout by volcanoes. Some gases, such asoxygen, formed later.
HSES_1eTE_C17.qxd 9/24/04 7:08 PM Page 495