hydrogen energy system with renewables for isolated households: the optimal system design, numerical...
TRANSCRIPT

Accepted Manuscript
Title: Hydrogen energy system with renewables for isolatedhouseholds: The optimal system design, numerical analysisand experimental evaluation
Author: Rok Lacko Bostjan Drobnic Mihael Sekavcnik MitjaMori
PII: S0378-7788(14)00309-0DOI: http://dx.doi.org/doi:10.1016/j.enbuild.2014.04.009Reference: ENB 4973
To appear in: ENB
Received date: 23-1-2014Revised date: 2-4-2014Accepted date: 6-4-2014
Please cite this article as: R. Lacko, B. Drobnic, M. Sekavcnik, M. Mori, Hydrogenenergy system with renewables for isolated households: The optimal system design,numerical analysis and experimental evaluation, Energy and Buildings (2014),http://dx.doi.org/10.1016/j.enbuild.2014.04.009
This is a PDF file of an unedited manuscript that has been accepted for publication.As a service to our customers we are providing this early version of the manuscript.The manuscript will undergo copyediting, typesetting, and review of the resulting proofbefore it is published in its final form. Please note that during the production processerrors may be discovered which could affect the content, and all legal disclaimers thatapply to the journal pertain.

Page 1 of 37
Accep
ted
Man
uscr
ipt
Hydrogen energy system with renewables for isolated households: The
optimal system design, numerical analysis and experimental evaluation
Rok Lackoa, Boštjan Drobničb,c, Mihael Sekavčnikb,c, Mitja Morib,c,*
a INEA d.o.o., Stegne 11, 1000 Ljubljana, Slovenia
b Faculty of mechanical engineering, University of Ljubljana, Aškerčeva 6, 1000 Ljubljana, Slovenia
c Centre of Excellence for Low‐Carbon Technologies, Hajdrihova 19, 1000 Ljubljana, Slovenia
*Corresponding author. Tel +386 1 4771715; fax: +386 1 2518567. E‐mail address:
[email protected]‐lj.si (M. Mori)
Abstract
One potential solution for stand‐alone power generation is to use hybrid energy systems
with hydrogen storage. In this paper, the physical behaviour of a hydrogen energy system
with renewables has been numerically simulated and experimentally re‐enacted. A reference
household in Slovenia’s coastal region was used to identify the optimal energy system
design, by considering the geographical location, availability of energy sources, actual load
dynamics, and components’ technical and economical characteristics. The results show that
optimal electricity supply is technically feasible with a 100% renewable system, consisting of
wind turbines and solar photovoltaic arrays, including hydrogen technologies (electrolyser,
hydrogen tank, fuel cell). The optimal feasible system capacity (33 kW), with the lowest total
net present cost (€136,063), is approximately eight times larger than the peak power
demand (3.8 kW). The experimental work was performed at hydrogen laboratory facilities.

Page 2 of 37
Accep
ted
Man
uscr
ipt
Experiments proved the possibility of alternative uses of existing industrial hydrogen
technology for balancing power supply and demand, with a mere 3% deviation from
numerical results. Keywords: Experimental validation; Hydrogen technologies; Reference
household; Renewable energy sources; Self‐sufficient energy system.
1. Introduction
The increasing needs for energy and the uncertain costs of future fossil fuel supplies, along
with the mitigation of climate change effects and natural environment preservation, are the
reasons for the increasing interest in renewable (RES), local and distributed energy sources,
as opposed to centralised fossil primary energy usage. While fully energy self‐sufficient
dwellings are still rare, solar and wind power units have been widely adopted for private
family homes. The introduction of RES into the energy supply, however, raises certain issues
in balancing energy demand and supply due to their variable and non‐storable nature. This
especially applies to wind and solar energy, and (to a lesser respect) to other RES, such as
geothermal energy, hydropower and biomass. Furthermore, a single stand‐alone user
presents the most challenging case of RES integration, due to its inability to import and
export surplus energy.
In coping with the misalignment of energy production and demand, the use of energy
storage is usually required [1]. Hydrogen technology is a technically viable storage solution
especially in energy systems with high shares of renewables [2–4]. Several technical and
economic numerical simulations of stand‐alone RES energy systems with hydrogen storage
have already been discussed [5–11]. Such hybrid energy systems have also been
experimentally demonstrated [12–15] or partially experimentally validated [16].

Page 3 of 37
Accep
ted
Man
uscr
ipt
Although stand‐alone RES‐hydrogen energy systems have been proposed and studied,
common shortcomings of those analyses include (a) a pre‐determined system design, (b)
optimization of system’s performance without preliminary optimising its configuration or
design, (c) overgeneralised input parameters, such as using typical daily consumption data
sets only, (d) short term simulation only (day, week) and finally (e) numerical models and
simulation results not being experimentally evaluated and verified. Studies also show that
results are highly dependent on numerous local factors, e.g. meteorological conditions;
therefore, a site‐specific analysis is needed for credible results [17].
This paper aims to overcome the detected shortcomings by considering the topics of optimal
hydrogen‐RES system design based on relevant, site specific and actual measured input data,
hourly system’s dynamics analysis for a period of one year, including experimental
evaluation of numerical results. An RES‐hydrogen energy system for a self‐sufficient power
supply of a single household is described and analysed in this study, as shown schematically
in Fig. 1. In this example, hydrogen is produced (and stored in a tank) by an electrolyser,
which is powered by the surplus electricity from renewable energy sources, using solar and
wind technologies (specifically at summer daytime). When RES are scarce, or demand is high,
additional power is needed; therefore, the fuel cell converts the chemical energy of the
stored hydrogen gas directly into electricity (usually at night and in winter).
2. Methodology
The scope of this work is, first, to find an optimal feasible configuration of a self‐sufficient
energy system based on RES and hydrogen technologies for a remote household located in
Slovenia and to numerically model its physical behaviour and, second, to experimentally

Page 4 of 37
Accep
ted
Man
uscr
ipt
validate the results of the system’s operation. In this study, only electricity is considered.
Experimentally, only hydrogen technologies are validated, while renewables are only
simulated. A demonstration laboratory system with hydrogen technologies was used for
experimental evaluation of the numerical results; its photograph is shown in Fig. 6.
2.1 Numerical model and simulation
The optimal RES‐hydrogen energy system structure was determined using the HOMER
numerical simulation software, based on the lowest net present cost. The energy system’s
physical behaviour and its life‐cycle cost, which is the total cost of installation and operation
over its life span, have been modelled. HOMER is a deterministic input/output model making
annual analyses in steps of one hour. The general inputs are the demands, capacities,
component technical characteristics and costs. Outputs or results are the energy balances,
capacities, resulting annual production and life‐cycle costs.
In this paper, the power supply of a stand‐alone household, located in Slovenia, is
considered. In the model (Fig. 1), AC electrical load is supplied, via DC‐AC inverter, primarily
by wind turbine and photovoltaic array. Excess electricity produced from RES is stored as
electrolytically produced hydrogen. When primary RES are scarce or unavailable, the fuel cell
system produces power from stored hydrogen.
Here, mathematical models of energy systems are not based on differential equations;
instead, a quasi‐dynamic approach has been used, and stationary conditions within each
hourly interval have been assumed. For each time interval, an energy balance has been
calculated, presented in general by Eq. (1),
(1)

Page 5 of 37
Accep
ted
Man
uscr
ipt
where E denotes the total energy at time interval t.
For the conversion of solar radiation to electrical energy, a photovoltaic array (PV) has been
used. The power output of the PV array depends on the amount of radiation striking its
surface, which is generally not horizontal. Thus, in each time step, the model calculates the
global solar irradiation on the surface of the PV array. In the calculation of the PV’s power
output, its rated capacity, de‐rating factor, solar irradiation, temperature coefficient of
power and PV cell temperature are considered. For converting wind kinetic energy into
electricity, a wind turbine (WT) was used. Its power depends on wind speed, adjusted to hub
height, and its power curve [18]. The cut‐in wind speed of the chosen wind turbine equals 3
m/s, and it reaches peak output power at wind speeds of 13 m/s. The hydrogen production
rate is defined by the electrolyser’s efficiency and minimum load ratio (technical minimum).
Experimentally determined values 72 and 50%, respectively, were used [19]. A hydrogen
container is used to store produced hydrogen for later use. A fuel cell system re‐powers
stored hydrogen when there is not enough RES. Fuel cell hydrogen consumption depends on
the fuel curve, shown in Fig. 2, which was experimentally defined [20]. The fuel cell’s electric
efficiency is based on a lower heating value (LHV): 120 MJ/kg (maximum efficiency is 48%).
The DC/AC power converter’s energy efficiency of 0.9 has been used in the calculation.
The model simulates different system configurations with several combinations of
components (and their sizes), which are specified in the components’ inputs. All feasible
system configurations are then listed in order from most cost‐effective to least cost‐
effective, based on their net present cost (NPC).
The project’s lifetime is assumed to be 20 years, as well as all components’ lifetime, except
for the fuel cell, which has to be replaced every 20,000 operating hours. The annual real

Page 6 of 37
Accep
ted
Man
uscr
ipt
interest rate considered in the model was 6%. Table 1 shows components’ parameters as
boundary conditions of the model, considered in optimising the configuration of the system.
The sizes of the PV array and wind turbine considered in calculation were 10 to 30 and 5 to
20 kW, respectively. The electrolyser, fuel cell and converter sizes between 1 and 6 kW were
considered. The capital costs of investment are based on invoices acquired within this
project. Operation and maintenance (O&M) costs are based on [7]. The minimum and
maximum sizes of components were chosen in an iterative process to ensure that the
optimum lies within spans presented in Table 1.
2.2 Model input data
The input data time series (hourly averages) needed for the analysis were obtained from
actual measurements. Electricity consumption data (Fig. 3) were taken from the MeRegio
and Mirabel projects [21]. A single load with average electricity consumption of 11 kWh/day
and a 3.8 kW hourly averaged maximum peak has been chosen. Its annual electricity
consumption amounts to 4,160 kWh.
Meteorological data (solar irradiation, wind speed) for renewable energy source
determination were acquired from ARSO’s1 meteorological test reference year (synthetically
constructed time series based on a multiple year historical digital data set that is typical for a
specific location). Fig. 4 shows reference hourly averaged global solar irradiation (left) and
wind speed (right) in Slovenia’s coastal region, with annual average daily global horizontal
irradiation 3.9 kWh/m² and wind speed of 2.8 m/s, peaking at 10.6 m/s [22].
1 Slovenian Environment Agency

Page 7 of 37
Accep
ted
Man
uscr
ipt
2.3 Experimental hydrogen energy system
The hydrogen energy system set for experimental and technology demonstration purpose is
installed at the Šoštanj thermal power plant in Slovenia. The facilities were used to provide
experimental evaluation of the use of hydrogen technology for energy storage and balancing
in a RES‐rich system. The schematic of the experimental set‐up is shown in Fig. 5 and its
photograph in Fig. 6. It is composed of alkaline electrolyser (Hydrogenics HySTAT) with 120
kWe nominal capacity and hydrogen production rate up to 15 Nm³/hr at 25 bar. The
hydrogen tank size is 20 m³. The low temperature PEM‐type fuel cell UPS system (Future‐E
Jupiter) delivers 6 kWe of power. Additional equipment consists of an electronic load (Amrel
PLW) with cooling unit (Hidros LSK), measuring instrumentation (hydrogen mass flow
meters, electric meters, pressure gauges, etc.), PLC (Mitsubishi Q series) and a computer
control system with remote access. This system has been fully‐instrumented to accurately
determine energy and hydrogen mass balances.
3. Results and discussion
3.1 Numerical simulation results
A feasible system is defined as a hybrid system configuration that is capable of meeting the
required load. Under given conditions, one system configuration was found to be feasible. It
has a total of 102 different combinations of size or number of components. The optimal
combination, with the lowest total net present cost (€136,063), is presented in Table 2. The
(levelised) cost of energy for optimal system combination is €2.8/kWh. The current
electricity grid purchase price in Slovenia for households is approximately €0.15/kWh. The
combined nominal primary (RES) and secondary (fuel cell) power source capacity is 33 kW,
Page 8 of 37
Accep
ted
Man
uscr
ipt
while peak demand is 3.8 kW. The optimal electrolyser and converter size is 4 kW, each, with
tank capacity being 30 kg of hydrogen.
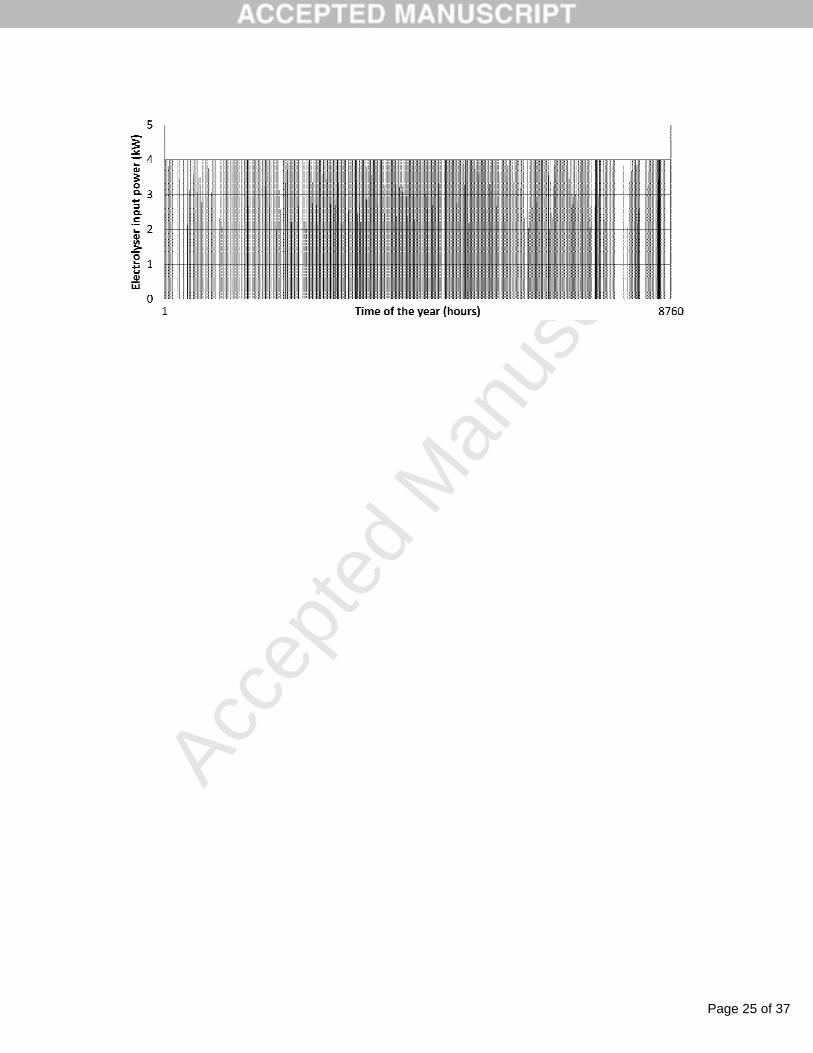
Fig. 7–Fig. 9 show the principal components’ operating characteristics: electrolyser input
power, fuel cell output power and their duration curves and hydrogen storage level,
respectively. Hydrogen energy storage shows the ability to store inter‐seasonal fluctuations
of RES availability. Summers’ higher RES energy density is stored to be used during the
colder half of the year (Fig. 9). Unlike the fuel cell (Fig. 8), the electrolyser (Fig. 7) operates
during 74% of the operation time at nominal power (Fig. 9). In Fig. 9, the difference between
electrolyser electricity consumption and fuel cell electricity production, which represents the
overall efficiency of hydrogen energy storage (averaging 26%) is also shown.
Table 3 presents an optimal system’s electrical production and consumption values. The PV
arrays produce 75%, while the secondary power source (fuel cell) produces 10% of the
electricity. The electrolyser’s electricity consumption rate is 69%, while the household
consumes 31%. All electric load was met throughout the year, and the excess electricity is
42% of overall production.
Table 4 lists optimal system configuration characteristics, reflected in low mean outputs and
low capacity factors. Capacity factors vary from 3.4% to 12.1%, except for the electrolyser
being 26.5%. The average power of production, from primary and secondary power sources,
exceeds the average household load by 588%, the largest contribution being from
photovoltaic arrays (PV) with 447% penetration. The results show similar operation times of
PV and wind turbine (WT), 3,873 and 3,556 hours per year, respectively. In contrast, the
electrolyser (EL) operates less frequently (2,507 hours/year) than the fuel cell (4,771
hours/year), which is also demonstrated by fewer start‐ups. The fuel cell’s (FC) life span of

Page 9 of 37
Accep
ted
Man
uscr
ipt
20,000 operating hours means that replacement is necessary after every 4.14 years. The
average fuel cell’s electric efficiency is 42.9%. The electrolyser produces 170 kg of hydrogen,
while the fuel cell consumes 167 kg annually, which enables the start of the following year
with sufficient supplies of hydrogen.
3.2 Experimental results
The fact that the given experimental system configuration is unalterable prevents the
recreation of an exact experimental match to different numerical model designs. In order to
conduct an experiment in which the model and real system capacity do not match, scaling
has to be applied. For the purpose of this experiment, capacity (input power), hydrogen
production rate and time scaling were applied. The fuel cell system’s modular design (3 ×
2 kW) enabled the direct transfer of the numerical model results to be replicated in the
experiment. In contrast, the electrolyser prevents any capacity adjustment; therefore, linear
scaling was performed. After consulting electrolyser system operators, the maximum input
power in the experiment was set to 72 kWe.
The electrolyser’s experimental operation program was acquired using numerical simulation
results, multiplied by 72/4. For analogue‐to‐input power, the hydrogen production
measurements during the experiment were multiplied by 4/72. On the basis of previous
experimental work, the fast electrolyser system operation response to power changes and
relatively fast start‐up times (less than 10 seconds) were observed. For that reason, and due
to relatively long simulation period (hourly steps in one year), the experiment’s duration was
limited to a period of one week in summer and scaled so that one hour in the model
corresponds to one minute in the experiment. Furthermore, due to frequent start‐up
limitations, the electrolyser was not shut down during the experiment, but its power was

Page 10 of 37
Accep
ted
Man
uscr
ipt
reduced, as seen in Fig. 10. For the analysis, data (power and hydrogen production rate)
from that period were not taken into consideration (used as zero), which is also shown in Fig.
10. Fig. 11 and Fig. 12 present the chosen one‐week period with both numerical and
experimental results of device power and hydrogen flow rate, respectively. Both the
electrolyser and the fuel cell typically start once per day. The electrolyser operates in periods
of excess electricity production during the daylight. In contrast, the fuel cell mostly operates
during the night, acting as a substitute for the missing solar irradiation. A comparison of
integral parameters, both simulation and experiment, presented in Table 5, shows
remarkably good matches of both results, with differences of less than 3%.
3.3 Error analysis and validation of results
The analyses in this paper have been conducted using the HOMER model, which is a leading
micro‐power optimisation tool for off‐grid and grid‐connected hybrid renewable energy
systems; it has been used for a large number of analyses published in peer‐reviewed journal
articles, including [6,8,10,23–32]. The model has been validated through its ability to
replicate existing energy systems, such as calculating the same fuel demands as revealed by
energy statistics.
Experimental studies usually involve some unpredictable and uncertain factors that occur
due to instrumental manufacturing errors, calibration errors and human mistakes. The
measurement uncertainty has been calculated based on the instruments’ documentation
and calibration data sheets. The instruments accuracy, the maximum absolute error and a
type B uncertainty of direct or indirect measurements for each individual component in the
instrumental chain are presented in Table 6. In general, industrial Class 1 measuring
instruments have been used with a 1% accuracy, or better. Alongside measurement

Page 11 of 37
Accep
ted
Man
uscr
ipt
uncertainty, some error can be attributed to the generalised modelling of the devices; the
fuel cell UPS system also contains a battery for quick power response due to slow core (fuel
cell stack) ramping dynamics, which have been modelled as one single device. Furthermore,
the actual electrolyser efficiency is not constant, but has been modelled as such.
Additionally, other dynamic characteristics of the electrolyser have been ignored, e.g.
internal pressure buffer, hydrogen filtering discharge and power ramping. Due to the fact
that the electrolyser operates at nominal power the majority of time (74%) and only starts
once per day on average, the model using a single operating point proves sufficient for the
scope of this research.
Scaling the results of a fuel cell or electrolyser linearly, raises a question of accuracy. Some
errors in results and reduced relevance could rightly be recognised. Arguments in favour of
this method (linear scaling) are that (a) fuel cells (and electrolysers, since it is essentially the
same process) are unique as energy converters, i.e. their range of application (in terms of
power and use) far exceeds all other types [33], (b) most auxiliary power is used for cooling
which is proportional to power, (c) one large unit in the model can in reality be substituted
by several smaller ones (dispersed or centralised), and (d) EL and FC are in essence both
already composed of multiple individual cells (forming stack), implying their fundamental
ability to scale.
The experimental results presented in this paper indicate that previously described
shortcomings only have a minor effect since the deviation to the calculations is small. Thus,
the results additionally validate (in addition to the literature) the numerical structure of the
tool itself, as well as the specific model that we have designed, specifically in part of the
hydrogen technology. Furthermore, the results of this analysis show that (a) the electrolyser

Page 12 of 37
Accep
ted
Man
uscr
ipt
mostly operates at daytime, while the fuel cell at night; (b) in any case, they do not operate
simultaneously; and (c) integrating RES for an isolated and self‐sufficient household in
Slovenia requires the use of seasonal energy storage, which is in accordance with
expectations. Additionally, the results show that a 100% renewable energy system is
feasible, which is in accordance with [8,10,30,34–38].
4. Conclusions
In this paper, an optimal RES‐hydrogen system was analysed and designed. A numerical
model of an RES‐hydrogen energy system was experimentally recreated and compared to
numerical results.
The analyses are based on historically relevant, site‐specific and actual measured input data,
hourly system dynamics for a period of one year, which were used as inputs for modelling
and simulation using commercial software and for conducting the experiment.
The results illustrate that the discussed energy system requires large production capacity,
which results in considerable excess electricity production (almost 50%) and low energy
utilisation (low capacity factor). Due to low resource availability and intermittent seasonal
energy, large seasonal storage of hydrogen is required. Furthermore, the results of this
analysis show that the electrolyser mostly operates at daytime with nominal power, while
the fuel cell operates highly variably at night; they never operate simultaneously.
Additionally, the results show that a 100% renewable power supply of a household, using
hydrogen storage is feasible, although costly. Experiments have confirmed the numerical
results with a mere 3% deviation. In addition, the experiments proved possible the

Page 13 of 37
Accep
ted
Man
uscr
ipt
alternative use of existing industrial hydrogen technology: as the storage and balancing of
energy in a stand‐alone household powered from fluctuating renewable energy sources.
Acknowledgements
This operation has been partly financed by the European Union, the European Social Fund.
The part of presented work has been accomplished within the Centre of Excellence for Low‐
Carbon Technologies (CONOT), Hajdrihova 19, 1000 Ljubljana, Slovenia. This work was
supported by INEA d.o.o., Stegne 11, 1117 Ljubljana, Slovenia and Šoštanj thermal power
plant, Cesta Lole Ribarja 18, 3325 Šoštanj.
References
[1] B.V. Mathiesen, H. Lund, Comparative analyses of seven technologies to facilitate the integration of
fluctuating renewable energy sources, IET Renew. Power Gener. 3 (2009) 190–204.
[2] K. Agbossou, R. Chahine, J. Hamelin, F. Laurencelle, A. Anouar, J.‐M. St‐Arnaud, et al., Renewable energy
systems based on hydrogen for remote applications, J. Power Sources. 96 (2001) 168–172.
[3] F. Barbir, PEM electrolysis for production of hydrogen from renewable energy sources, Sol. Energy. 78
(2005) 661–669.
[4] B.V. Mathiesen, H. Lund, Fuel‐efficiency of hydrogen and heat storage technologies for integration of
fluctuating renewable energy sources, in: 2005 IEEE St. Peterbg. Powertech Conf. Proc., Faculty of
Mechanical Engineering and Naval Architecture, St. Peterburg, 2005: pp. 1–7.
[5] S.R. Vosen, J.O. Keller, Hybrid energy storage systems for stand‐alone electric power systems :
optimization of system performance and cost through control strategies, Int. J. Hydrogen Energy. 24
(1999) 1139–1156.
[6] M.J. Khan, M.T. Iqbal, Pre‐feasibility study of stand‐alone hybrid energy systems for applications in
Newfoundland, Renew. Energy. 30 (2005) 835–854.
Page 14 of 37
Accep
ted
Man
uscr
ipt
[7] E.I. Zoulias, N. Lymberopoulos, Techno‐economic analysis of the integration of hydrogen energy
technologies in renewable energy‐based stand‐alone power systems, Renew. Energy. 32 (2007) 680–696.
[8] R. Dufo‐López, J.L. Bernal‐Agustín, Multi‐objective design of PV–wind–diesel–hydrogen–battery systems,
Renew. Energy. 33 (2008) 2559–2572.
[9] B. Shabani, J. Andrews, S. Watkins, Energy and cost analysis of a solar‐hydrogen combined heat and power
system for remote power supply using a computer simulation, Sol. Energy. 84 (2010) 144–155.
[10] R. Jallouli, L. Krichen, Sizing, techno‐economic and generation management analysis of a stand alone
photovoltaic power unit including storage devices, Energy. 40 (2012) 196–209.
[11] S. Zafar, I. Dincer, Energy, exergy and exergoeconomic analyses of a combined renewable energy system
for residential applications, Energy Build. 71 (2014) 68–79.
[12] a. M. Chaparro, J. Soler, M.J. Escudero, E.M.L. de Ceballos, U. Wittstadt, L. Daza, Data results and
operational experience with a solar hydrogen system, J. Power Sources. 144 (2005) 165–169.
[13] E. Cetin, A. Yilanci, Y. Oner, M. Colak, I. Kasikci, H.K. Ozturk, Electrical analysis of a hybrid photovoltaic‐
hydrogen/fuel cell energy system in Denizli, Turkey, Energy Build. 41 (2009) 975–981.
[14] E. Cetin, A. Yilanci, H.K. Ozturk, M. Colak, I. Kasikci, S. Iplikci, A micro‐DC power distribution system for a
residential application energized by photovoltaic–wind/fuel cell hybrid energy systems, Energy Build. 42
(2010) 1344–1352.
[15] Y. Hamada, K. Takeda, R. Goto, H. Kubota, Hybrid utilization of renewable energy and fuel cells for
residential energy systems, Energy Build. 43 (2011) 3680–3684.
[16] L. Valverde, F. Rosa, A.J. del Real, A. Arce, C. Bordons, Modeling, simulation and experimental set‐up of a
renewable hydrogen‐based domestic microgrid, Int. J. Hydrogen Energy. 38 (2013) 11672–11684.
[17] V. Dorer, R. Weber, a. Weber, Performance assessment of fuel cell micro‐cogeneration systems for
residential buildings, Energy Build. 37 (2005) 1132–1146.
[18] T. Lambert, P. Gilman, P. Lilienthal, Micropower system modeling with Homer, in: Integr. Altern. Sources
Energy, John Wiley & Sons, 2006: pp. 379–418.
[19] K. Jurko, Experimental determination of transfer functions of electrolyzer in the advanced energy supply,
University of Ljubljana, Faculty of Mechanical Engineering, 2013.
[20] U. Sredenšek, Enery system with electrolyser, hydrogen storage and a fuel cell, University of Ljubljana,
Faculty of Mechanical Engineering, 2013.

Page 15 of 37
Accep
ted
Man
uscr
ipt
[21] G. Černe, Z. Marinšek, others, MIRABEL, Micro‐request‐based aggregation, forcasting and scheduling of
energy demand, supply and distribution, Ljubljana, 2011.
[22] Slovenian Environment Agency, Test reference year, Ljubljana, 2008.
[23] M. Beccali, S. Brunone, M. Cellura, V. Franzitta, Energy, economic and environmental analysis on RET‐
hydrogen systems in residential buildings, Renew. Energy. 33 (2008) 366–382.
[24] S.H. Wu, D.B. Kotak, M.S. Fleetwood, An integrated system framework for fuel cell‐based distributed
green energy applications, Renew. Energy. 30 (2005) 1525–1540.
[25] N.N. Barsoum, P. Vacent, Balancing Cost, Operation and Performance in Integrated Hydrogen Hybrid
Energy System, First Asia Int. Conf. Model. Simul. (2007) 14–18.
[26] S. Rehman, I.M. El‐Amin, F. Ahmad, S.M. Shaahid, A.M. Al‐Shehri, J.M. Bakhashwain, et al., Feasibility
study of hybrid retrofits to an isolated off‐grid diesel power plant, Renew. Sustain. Energy Rev. 11 (2007)
635–653.
[27] P.S. Georgilakis, State of the Art of Decision Support Systems for the choice of Renewable Energy Sources
for Energy Supply in Isolated Regions, Int. J. Distrib. Energy Resour. 2 (2006) 129–150.
[28] A.F. Shaahid SM, El‐Amin I, Rehman S, Al‐Shehri A, Bakashwain J, Potential of autonomous/off‐grid hybrid
wind‐diesel power system for electrification of a remote settlement in Saudi Arabia, Wind Eng. 28 (2004)
621–628.
[29] M.T. Iqbal, A feasibility study of a zero energy home in Newfoundland, Renew. Energy. 29 (2004) 277–289.
[30] C. Li, X. Ge, Y. Zheng, C. Xu, Y. Ren, C. Song, et al., Techno‐economic feasibility study of autonomous
hybrid wind/PV/battery power system for a household in Urumqi, China, Energy. 55 (2013) 263–272.
[31] S. Rehman, L.M. Al‐Hadhrami, Study of a solar PV–diesel–battery hybrid power system for a remotely
located population near Rafha, Saudi Arabia, Energy. 35 (2010) 4986–4995.
[32] Y. Himri, a. Boudghene Stambouli, B. Draoui, S. Himri, Techno‐economical study of hybrid power system
for a remote village in Algeria, Energy. 33 (2008) 1128–1136.
[33] J. Larminie, A. Dicks, Fuel Cell Systems Explained, John Wiley & Sons, Chichester, 2003.
[34] B. Ćosić, G. Krajačić, N. Duić, A 100% renewable energy system in the year 2050: The case of Macedonia,
Energy. 48 (2012) 80–87.
[35] H. Lund, P.A. Østergaard, Sustainable towns : the case of Frederikshavn ‐ 100% renewable energy, in:
Clark WW, Springer, New York, 2009: pp. 155–168.

Page 16 of 37
Accep
ted
Man
uscr
ipt
[36] B.V. Mathiesen, 100 % renewable energy systems in project Future Climate ‐ the case of Denmark, in:
Zvonimir Guzovic, N. Duic, M. Ban (Eds.), 5th Dubrovnik Conf. Sustain. Dev. Energy Water Environ. Syst.,
University of Zagreb, Dubrovnik, 2009: p. 20.
[37] M. Santarelli, Design and analysis of stand‐alone hydrogen energy systems with different renewable
sources, Int. J. Hydrogen Energy. 29 (2004) 1571–1586.
[38] B.K. Sovacool, R.F. Hirsh, Island wind‐hydrogen energy: A significant potential US resource, Renew.
Energy. 33 (2008) 1928–1935.

Page 17 of 37
Accep
ted
Man
uscr
ipt
Fig. 1. A schematic of the numerical model of a stand-alone energy system with
renewables and hydrogen storage.
Fig. 2. Experimentally determined fuel cell’s fuel curve (left); corresponding
maximum efficiency of the fuel cell is 48% (right) [20].
Fig. 3. A one-year (left) and a one-day section (right) of hourly averaged electricity
consumption of a reference household [21].
Fig. 4. Reference hourly averaged solar irradiation (left) and wind speed (right) in
Portorož. Meteorological data were acquired from ARSO [22].
Fig. 5: General scheme of experimental system with hydrogen technologies.
Fig. 6: Photograph of the outside of the hydrogen technology testing facilities, which
consist of container units with electrolyser and fuel cell systems, and a hydrogen
storage.
Fig. 7. The result of annual simulation of electrolyser’s input power in steps of one
hour.
Fig. 8. The result of a simulation of fuel cell’s output power: full year scale (left),
one-week section (right).
Fig. 9: Electrolyser and fuel cell duration curves (left) and hourly averaged hydrogen
storage content (right).
Fig. 10. Correction of experimental results by neglecting values in periods of
simulated turn-off.

Page 18 of 37
Accep
ted
Man
uscr
ipt
Fig. 11. Simulation and experimental power distribution of a 1-week period in
summer. Electrolyser mostly operates with its nominal power, while the fuel cell’s
operation is highly variable. Typically both devices start once per day (electrolyser at
daytime, fuel cell at night).
Fig. 12. Simulation and experimental hydrogen flow rate distribution of a 1-week
period in summer. Deviations in results are the consequence of the UPS’s battery
charging even after the demand reduces and of the electrolyser’s internal pressure
buffer and hydrogen filtering discharge.

Page 19 of 37
Accep
ted
Man
uscr
ipt

Page 20 of 37
Accep
ted
Man
uscr
ipt

Page 21 of 37
Accep
ted
Man
uscr
ipt

Page 22 of 37
Accep
ted
Man
uscr
ipt

Page 23 of 37
Accep
ted
Man
uscr
ipt

Page 24 of 37
Accep
ted
Man
uscr
ipt
Page 25 of 37
Accep
ted
Man
uscr
ipt

Page 26 of 37
Accep
ted
Man
uscr
ipt

Page 27 of 37
Accep
ted
Man
uscr
ipt

Page 28 of 37
Accep
ted
Man
uscr
ipt

Page 29 of 37
Accep
ted
Man
uscr
ipt

Page 30 of 37
Accep
ted
Man
uscr
ipt

Page 31 of 37
Accep
ted
Man
uscr
ipt
Table 1 Considered input parameters of the components used for optimising the system configuration. Size spans were determined iteratively; capital cost estimations are based on invoices; O&M costs are based on [7].

Page 32 of 37
Accep
ted
Man
uscr
ipt
Table 2 Optimal system configuration, based on lowest net present cost. Significant production capacities (33 kW) are needed in order to meet the load (3.8 kW hourly averaged peak).

Page 33 of 37
Accep
ted
Man
uscr
ipt
Table 3 Optimal system configuration electrical production and consumption.

Page 34 of 37
Accep
ted
Man
uscr
ipt
Table 4 Optimal system configuration characteristics.

Page 35 of 37
Accep
ted
Man
uscr
ipt
Table 5 Simulation and experiment results comparison. Small deviation (3%) experimentally validates the numerical model design and the possibility of alternative use of the currently available industrial hydrogen technology for balancing power production and demand.

Page 36 of 37
Accep
ted
Man
uscr
ipt
Table 6 The accuracy, maximum absolute error and the measurement uncertainty for each individual component in the chain of measurements, as well as the combined measurement uncertainty of the experimental hydrogen energy system, located in Šoštanj.

Page 37 of 37
Accep
ted
Man
uscr
ipt
Highlights
We model the self‐sufficient energy system with renewables and hydrogen storage.
Required large renewable production capacities result in low capacity factors.
The electrolyser operates mostly with its nominal power, while fuel cell’s varies.
Hydrogen energy seasonal storage enables 100% renewable power supply.
Experiment validates model design and alternative use of hydrogen technologies.