hydrologic and water-quality data u.s. … · lac qui parle river watershed ... (international...
TRANSCRIPT

HYDROLOGIC AND WATER-QUALITY DATA
FOR STREAMS AND IMPOUNDMENTS IN THE
COTEAU DES PRAIRIES--UPPER MINNESOTA
RIVER BASIN, 1979-84
By C. J. Smith, G. A. Payne, and L. H. Tornes
U.S. GEOLOGICAL SURVEY
Open-File Report 88-84
Prepared in cooperation with the
U.S. ARMY CORPS OF ENGINEERS
U.S. SOIL CONSERVATION SERVICE
St. Paul, Minnesota
1990

DEPARTMENT OF THE INTERIOR
MANUEL LUJAN, JR., Secretary
U.S. GEOLOGICAL SURVEY
Dallas L. Peck, Director
For additional information write to:
District Chief U.S. Geological Survey 702 Post Office Building St. Paul, Minnesota 55101
Copies of this report can be purchased from:
U.S. Geological SurveyBooks and Open-File Reports SectionFederal Center, Building 41Box 25425Denver, Colorado 80225

CONTENTS
Page
Abstract.................................................................. 1Introduction.............................................................. 2
Purpose and scope.................................................... 2Acknowledgements..................................................... 3
Study area................................................................ 3Climate.............................................................. 3Geology and soil..................................................... 3Sample sites......................................................... 5
Methods of data collection................................................ 7Stream sites.................................................... 7Impoundment sites............................................... 9
References cited.......................................................... 44Tables of data............................................................ 45
ILLUSTRATIONS
Figure 1. Monthly precipitation and departure from normal precipitation at Canby, Minnesota. (Data from National Oceanic and Atmospheric Administration, (1979-84)........................ 4
2. Location of sampling sites..................................... 63-12. Graph showing discharge hydrographs and sample collection at:
3. LaBolt Impoundment inlet near LaBolt, South Dakota......... 104. LaBolt Impoundment outlet near Labolt, South Dakota........ 115. Florida Creek near Burr, Minnesota......................... 126. Lac Qui Parle River near Canby, Minnesota.................. 137. Dillon-Syltie Impoundment inlet near Porter, Minnesota..... 148. Dillon-Syltie Impoundment outlet near Porter, Minnesota.... 169. Lake Laura Impoundment north inlet near Walnut Grove,
Minnesota................................................ 1810. Lake Laura Impoundment south inlet near Walnut Grove,
Minnesota................................................ 1911. Lake Laura Impoundment outlet near Walnut Grove,
Minnesota................................................ 2012. Dry Creek near Jeffers, Minnesota.......................... 21
TABLES
Table 1. Name and drainage area of reconnaissance-sampling sites........ 222. General description of intensively sampled sites............... 333. Type of data collected, 1980-84 water years.................... 414 One-time chemical analyses of bed material at impoundments,
1982-83 water years.......................................... 43
iii
TABLES
Page 5a-5o. La Bolt Impoundment sites (tributary to Yellow Bank River)
La Bolt Impoundment inlet 5a. Water-discharge data........ ̂ ............................. 475b. Water-quality data ......... 4 ............................. 495c. Suspended-sediment data .................................. 535d. Sediment-size data ....................................... 53
La Bolt Impoundment 5e. Monthly stage data ....................................... 545f. Water-quality-profile data ............................... 555g. Water-quality data ....................................... 595h. Bed-material-chemical and partical-size data ............. 655i. Phytoplankton data ....................................... 66
La Bolt Impoundment outlet 5j. Water-discharge data ..................................... 755k. Water-quality data ....................................... 77
- 51. Suspended-sediment data .................................. 815m. Sediment-size data ....................................... 815n. Daily observers rainfall data, (farm upstream of
La Bolt Impoundment inlet) 4 ............................. 825o. Daily observers rainfall data, (farm downstream of
La Bolt Impoundment outlet)............................. 836a-6f. Webber Impoundment sites (tributary to Lac Qui Parle River)
Webber Impoundment inlet 6a. Water-quality data ....................................... 86
Webber Impoundment 6b. Water-quality-profile data . j ............................. 886c. Water-quality data ....................................... 916d. Bed-material-chemical and patftical-size data ............. 956e. Phytoplanton data ........................................ 966f. Daily observers rainfall data, (farm downstream of
Webber Impoundment)....... * ............................. 1027a-7e. West Branch Lac Qui Parle River (l^QP-28)
7a. Maximum annual peak-discharge data........................ 1047b. Water-quality data ....................................... 1057c. Suspended-sediment data................................... 1097d. Sediment-size data........................................ 1097e. Daily observers rainfall data, (farm upstream of gage).... 110
8a-8g. Florida Creek (LQP-3)8a. Water-discharge data...................................... Ill8b. Water-quality data........................................ 1138c. Suspended-sediment data. .... t ............................. 1218d. Sediment-partical-size data............................... 1238e. Daily observers rainfall data, (site 1, upstream of
gaging station) 1248f. Daily observers rainfall data, (site 2, upstream of
gaging station)......................................... 1258g. Daily observers rainfall data, (near gaging station)...... 127
iv

TABLES
Page
9a-9i. Lac Qui Parle River (LQP-8)9a. Water-discharge data...................................... 1299b. Water-quality data........................................ 1329c. Suspended-sediment data................................... 1409d. Sediment-size data........................................ 1439e. Daily observers rainfall data, (site 1, upstream of
gaging station)......................................... 1449f. Daily observers rainfall data, (site 2, upstream of
gaging station)......................................... 1459g. Daily observers rainfall data, (site 3, upstream of
gaging station)......................................... 1469h. Daily observers rainfall data, (site 4, upstream of
gaging station)......................................... 1479i. Daily observer rainfall data, (near gaging station)....... 148
lOa-lOp. Dillon-Syltie Impoundment sites Dillon-Syltie Impoundment inlet lOa. Water-discharge data...................................... 150lOb. Water-quality data........................................ 155lOc. Suspended-sediment data................................... 163lOd. Sediment-size data........................................ 165
Dillon-Syltie Impoundment lOe. Monthly-lake stage data................................... 166lOf. Water-quality-profile data................................ 167lOg. Water-quality data........................................ 171lOh. Bed-material-chemical and partical-size data.............. 181lOi. Phytoplanton data ........................................ 182
Dillon-Syltie Impoundment outlet 10j. Water-discharge data...................................... 19710k. Water-quality data........................................ 202101. Suspended-sediment data................................... 21010m. Sediment-size data........................................ 212lOn. Daily observers rainfall data, (site 1, upstream of
inlet gaging station)................................... 213lOo. Daily observers rainfall data, (site 2, upstream of
inlet gaging station)................................... 217lOp. Daily observers rainfall data, (upstream of
Impoundment)............................................ 220lla-llr. Lake Laura Impoundment sites
Lake Laura Impoundment north inlet lla. Water-discharge data...................................... 222lib. Water-quality data........................................ 223lie. Suspended-sediment data................................... 227lid. Sediment-size data........................................ 228
Lake Laura Impoundment south inlet lie. Water-discharge data...................................... 229llf. Water-quality data........................................ 231llg. Suspended-sediment data................................... 235llh. Sediment-size data........................................ 236

TABLES
Page
Tables lla-llr. Lake Laura Impoundment sites*--Continued Lake Laura Impoundment111. Monthly lake-stage data................................... 237llj. Water-quality-profile data................................ 238Ilk. Water-quality data........................................ 242111. Bed-material-chemical and partical-size data.............. 246llm. Phytoplanton data......................................... 247
Lake Laura Impoundment outletlln. Water-discharge data...................................... 253llo. Water-quality data.......... * ............................. 255lip. Suspended-sediment data..... t ............................. 259llq. Sediment-size data.......... ̂ ............................. 262
12a-12f. Dry Creek (LCW-21)12a. Water-discharge data...................................... 26312b. Water-quality data........................................ 26512c. Suspended-sediment data................................... 26812d. Sediment-size data........................................ 27012e. Daily observers rainfall data, (downstream of
gaging station)......................................... 27112f. Daily observers rainfall data, (farm near gaging
station).................. \ ............................. 27313a-13g. Miscellaneous water-quality iites
13a. Whetstone River watershed... 1 ............................. 27413b. Yellow Bank River watershed............................... 27513c. Lac Qui Parle River watershed............................. 27813d. Yellow Medicine River watershed........................... 28113e. Redwood River watershed................................... 28413f. Cottonwood River watershed................................ 28613g. Lower Cottonwood River watershed.......................... 289
VI

CONVERSION FACTORS AND ABBREVIATIONS
Readers who prefer to use metric (International System) units rather than inch-pound units can make conversions by using the following ^actors:
Multiply inch-pound unit
inch (in.)
foot (ft)
mile (mi)
acre
2square mile (mi )
acre-feet (acre-ft)
ocubic feet per second ft /s
tons (short)
Bv
25.4
0.3084
1.609
4,047
2.59
1,233
0.02832
0.9072
____To obtain metric unit
millimeter (mm)
meter (m)
kilometer (km)
2 square meter (m )
2 square kilometer (km )
ocubic meter (m )
3 cubic meters per second m /s
Megagrams (Mg) or metric tons
(tonne)
VII
HYDROLOGIC AND WATER-QUALITY DATA FOR STREAMS AND IMPOUNDMENTS
IN THE COTEAU DES PRAIRIES-UPPER MINNESOTA RIVER BASIN,
1979-84
By C. J. Smith, G. A. Payne, and L. H. Tornes
ABSTRACT
Water-quality and streamflow data were collected in the Coteau des Prairies region of southwestern Minnesota and eastern South Dakota from 1979- 84. Data were collected to (1) document the water-quality characteristics of streams and impoundments in the Coteau area, (2) predict the impact of proposed impoundments, (3) define the amount of dissolved and suspended material transported, and (4) determine the differences in water quality between the impoundment inflows and outflows.
Streamflow and water-quality data were collected at 12 stream and four impoundment sites. Continuous-record gages, set to collect data at 15-minute intervals, and readings taken by local observers were used to complete discharge records at 10 stream sites and stage records at three impoundment sites. Automatic samplers and local observers collected storm runoff, sediment, and nutrient samples at 10 stream sites. Water-quality samples were collected at various time and stage intervals during high flow and periodically during low flow. Primary emphasis in the stream-sampling program was on analysis of samples for nutrients in 1980-82, and on analysis of suspended sediment and nutrients in 1983-84. Field measurements were made of pH, water temperature, dissolved oxygen, specific conductance, alkalinity, and bacteria. Secondary emphasis was on analysis of major dissolved substances. Primary emphasis in the impoundments was on analysis of samples for phosphorus and chlorophyll and on the measurement of transparency. Temperature and dissolved-oxygen concentrations were measured to determine the degree of stratification.
All data collected during the study are given in tables 4-13 of this report. The tables list mean-daily stream discharge, mean-daily suspended- sediment concentration, daily suspended-sediment discharge, results of water- quality analyses, and bed-material particle-size analyses at stream sites. The tables also list information on pool stage, water temperature, and transparency, on dissolved-oxygen, chlorophyll a, phytoplankton, and nutrient concentrations, and on chemical and partical-size analyses of bed material at impoundment sites.

INTRODUCTION
In recent years, losses of soil to streams have increased as a result of flooding, bank sloughing, and soil movement from farm fields in the predominantly agricultural watersheds of the Coteau des Prairies (Coteau). The Coteau, a linear upland plateau extending from southwestern Minnesota into eastern South Dakota, lies along and above the steep slopes of the Minnesota River valley and is the headwaters of five principal tributaries of the Minnesota River. Soil losses to these streams may have been accelerated by drainage of wetlands and by bringing marginal lands into production. These actions resulted in increased peak flows and sediment transport.
To determine the extent that streams are being affected by land-use practices, the upper Minnesota subbasin study (Public Law 87-639) was begun by the U.S. Army Corps of Engineers and the U.S. Soil Conservation Service. Control or reduction of the increasing peak flows and sediment discharge is expensive, and various alternatives for improving the quality of water of streams draining the Coteau are being considered by local, State and Federal agencies.
A commonly used method for improving water quality is to construct a series of small in-stream impoundments. Impoundments have been constructed at several locations along the Coteau since the 1930's by the U.S. Soil Conservation Service in cooperation with local landowners and Watershed Conservation Districts. The use of impoundments in the Coteau area is increasing, but their effectiveness in reducing sediment loading of streams has not been evaluated.
Purpose and Scope
This report presents hydrologic data Survey during 1979-84 and describes the
collected by the U.S. Geological approach and methods used. The
analysis of these data is presented in a separate report titled "Water quality assessment of existing and planned impoundments in the Coteau des Prairies - Upper Minnesota River basin."

Acknowledgments
Assistance by the following people is gratefully acknowledged: Marilyn Johnson (rainfall observer and landowner for LaBolt inlet stream-gaging station) and Adolf Peterson (landowner for recording-rainfall station), of LaBolt, South Dakota; Robert Weber (rainfall observer and landowner for recording-rainfall station) of Strandburg, South Dakota; Loye January (rainfall observer and landowner for recording-rainfall station) and William Webber (rainfall observer and landowner for Webber impoundment sites) of Gary, South Dakota; Henry Fairchild and family (rainfall and sediment observers, and landowner for Florida Creek stream-gaging and recording-rainfall stations) of Burr, Minnesota; Richard Olson (rainfall observer), and Duane Nordseth and family (rainfall and sediment observers and landowner for Lac Qui Parle stream-gaging and recording-rainfall stations) of Canby, Minnesota; Mark Syltie (rainfall observer and landowner at Dillon-Syltie inlet stream-gaging and recording-rainfall station), Raymond Lozinskii, (rainfall observer and landowner for recording-rainfall station), Yellow Medicine River Watershed District (landowner of Dillon-Syltie Impoundment) of Porter, Minnesota; Ruth Morud (rainfall observer) of Brandt, South Dakota; Charles Dahl (rainfall observer) of Astoria, South Dakota; Marlow and Conrad Freeburg (rainfall and sediment observer and landowner for Lake Laura south inlet recording-rainfall and stream-gaging station) of Walnut Grove, Minnesota; Donald Swenson (sediment observer) of Walnut Grove, Minnesota and Redwood County Board of Commissioners (landowner for Lake Laura Impoundment stream-gaging station and pool site) of Redwood Falls, Minnesota; Palmer Bush (sediment and rainfall observer and landowner for Dry Creek stream-gaging station) of Jeffers, Minnesota.
STUDY AREA
Climate
Minnesota has a continental-type climate with cold, dry winters and warm, wet summers (Kuehnast and Baker, 1978). Two-thirds of the annual precipitation occurs in the five months of May to September. Precipitation during winter is as snow and during summer is as showers or thunderstorms. Monthly precipitation at Canby, Minnesota, is shown in figure 1 for 1979-84. Figure 1 shows that the 1980-82 open-water periods were preceded and followed by dry winters; dry conditions continued throughout the spring and summer seasons; zero flows occurred at most of the study sites during the summer- winter period. The 1983-84 open-water periods were wetter with increased spring and summer flows.
Geology and Soils
The topography of the Coteau is gently undulating, resulting from deposition and erosion of glacial till that underlies most of the study area. The till is underlain by rocks of Cretaceous age. Headwaters of the western streams are in the Altamont recessional ground moraine left after the Wisconsin glaciation (Thiel, 1944). Data-collection sites are pn the Coteau slope, which forms the northeast flank of the Coteau des Prairies.

ccffiCO
= 3
I
1981-1982
1 3 Z
1983-1984
I I I
-3 9
JFMAMJ JASONDJFMAMJ JASONDMONTH i
EXPLANATION
-3
iPrecipitation
Departure from normal
FIGURE 1. Monthly precipitation and departure from normal precipitation at Canby, Minnesota. (Data from National Oceanic and Atmospheric Administration, 1979-1984)

A soil-association map (Arneman, 1963) shows that soils in the Yellow Bank, Lac Qui Parle, and Yellow Medicine River basins and in the headwaters of the Redwood River basin are medium-fine- to fine-textured prairie and prairie- border soils characteristic of western Minnesota. In the lower parts of the Redwood River and Cottonwood River basins, the soils are medium- to fine- textured prairie soils characteristic of south-central Minnesota. In these areas, the topography varies from nearly flat to hilly, and the dark-colored soils developed from calcareous glacial till. Some prominent soil groups developed from calcareous gravel of Wisconsin age. The dark color of the soil is closely related to organic matter derived from the decay of shallow rooted plants with extensive root systems. Erosion control and water conservation are major problems.
Sample Sites
Four impoundments, inlets and outlets to the impoundments, and four streams were chosen for investigation based on information gathered during a reconnaissance in June 1979. During the reconnaissance, 66 proposed impoundment sites on streams, 24 impoundments, and 21 inlets and outlets were sampled. Sites for intensive sampling were selected from the reconnaissance sites on the basis of drainage area, accessibility, location in study area, and feasibility studies prepared by the U.S. Army Corps of Engineers (1980) and U.S. Soil Conservation Service. These sites were selected to represent areas where impoundment of streams is most likely.
The location and drainage area of the reconnaissance-sampling sites are given in table 1. Sites that were selected for intensive sampling are noted in table 1 also. The location of sites studied is shown in figure 2.
Three of the four impoundments, LaBolt, Dillon-Syltie, and Lake Laura, are used frequently by the public for recreational purposes. Drainage areas above the impoundments ranged from 1.4 to 17.1 mi2 (square miles). Drainage areas above the stream sites ranged from 3.1 to 186 mi2 . The primary land use in the watersheds is agricultural. Row crops are grown on the flatter slopes; pasture is common on steeper slopes adjacent to the streams.
Table 2 summarizes watershed characteristics at each intensively studied site. Land-use characteristics are based on information provided by the U.S. Soil Conservation Service (SCS) (written Comm., 1984). Drainage areas, stream length, slope, and wetland areas were measured from U.S. Geological Survey topographic maps and from aerial photographs provided by SCS. Normal impoundment volume was determined from field surveys in spring 1983. Estimates of peak discharge for the listed frequencies at each impoundment inlet and at each proposed impoundment site were based on regional flood-frequency equations determined by Jacques and Lorenz (1987). Estimates of 7-day 2-year and 7-day 10-year low-flow discharge were based on observations of zero flow or correlation of base-flow measurements with an index station (Stedinger and Thomas, 1985).

,96°
45'
(La
bolt
EX
PL
AN
AT
ION
T Sa
mpl
ing
site
s~
Stu
dy
are
a
bo
un
dar
y
...
Wate
rsh
ed
bo
un
dar
y
NO
TE:
Riv
er n
ames
re
fere
nce
d i
n T
able
1
LOW
Lo
wer
Cot
ton w
ood
Riv
er b
asin
WH
W
hets
tone
Riv
er b
asin
YB
Yello
w B
ank
Riv
er b
asin
LQP
Lac
Out
Par
te r
aver
bas
tnR
W
Red
woo
d R
iver
bas
inC
W
Cot
tonw
ood
Riv
er b
asin
YB
-A,B
&!
_L
QP
-28
(W
.B.
Lac
Qu
(Web
ber
. L
OP
-3 (
Flo
rid
a
~2%
<0ti»
mi-^
8yH
le:Im
poun
dmen
t)
ri°- ^M
-^^n
RW
-2a|
CW
-27
(Cak
e L
aura
Im
po
un
dm
ent
«il
rriL
;;i
J-^
ffer
,
y^
wru
wi
/ r,
w_
/
IL
CW
-A
(Dry
Cre
ek)
^-4
4°
0 5
10
15 M
ILE
S
i 0
5 10
15
20
K
ILO
ME
TE
RS
Bas
e fr
om U
.S.
Geo
logi
cal
Surv
ey
I S
tate
bas
e m
ap,
1:1,
000,
000
(196
5)
96°
95'
FIG
UR
E 2. L
ocati
on
of
sam
plin
g si
tes.

METHODS OF DATA COLLECTION
Collection of repetitive physical, chemical, and biological data began in March 1980. During 1980, three impoundment sites, Dillon-Syltie, LaBolt, and Webber, and their respective inlets and outlets were sampled monthly. Tables 3 and 4 list the type of data collected in 1980-84.
In February 1981, the three impoundments and their inlets and outlets were sampled during a period of ice cover. Sampling of all sites at LaBolt and Webber impoundments then was discontinued for the remainder of 1981. Termination of sampling did not result in significant lost record because the 1981 spring breakup was gradual. Only one significant runoff event occurred during the latter part of the year; inlets were dry much of the time and the pool stages were low. A reduced number of samples also was collected from the Dillon-Syltie inlet and outlet sites due to zero flows.
In 1982, sampling was resumed at the LaBolt and Webber impoundment sites and three new stream sites (Florida Creek, West Branch Lac qui Parle River, and Lac qui Parle River) were added. The sites were sampled monthly from early spring through October. The impoundments were sampled every two weeks from May to September.
In May 1983, the Lake Laura impoundment, its two inlets, and its outlet were added to the study. As in 1982, the impoundments were sampled at 2-week intervals. In September 1983, sampling at the Webber impoundment sites and in the LaBolt impoundment was discontinued; the LaBolt impoundment inlet was continued with a reduced sampling schedule.
In 1984, a new site on Dry Creek was added to the study and sampling in the impoundments was reduced to monthly from May through September.
At various times during the study, schedules were modified to adjust to special conditions. These conditions included lack of flow, equipment malfunctions, or the need to reallocate resources to streams having more significant runoff.
Stream Sites
During the study, 11 sites were instrumented with continuous-record-stage recorders (15-minute recorder interval), and three sites were instrumented with simple pipe gages to determine peaks. Of the 11 sites with continuous recorders, 9 were established to obtain streamflow records, one was established to obtain both impoundment stage and a streamflow record, and another was used for impoundment stage. At Lake Laura, the impoundment stage was recorded by a local observer.
Periodic streamflow measurements were made at stream sites according to techniques described by Buchanan and Somers (1969) . These measurements were used to define the stage-discharge relationship for each station. The stage- discharge relationship and stage record were used to define the daily mean discharge at each station.

During scheduled visits, water temperature, pH, dissolved oxygen, specific conductance and alkalinity were measured in situ according to the methods of Skougstad and others (1979). These measurements were made most often using a Hydrolab 1 four-parameter meter. Single-constituent meters were used as backups and periodically for quality-assurance checks.
Fecal coliform and fecal Streptococci bacteria were determined in the field by the membrane-filter method described by Greeson and others (1979a). During runoff, water temperature, pH, dissolved oxygen, and specific conductance were measured periodically and sediment samples were collected using the methods described in Guy and Norman (1970).
From 1982-84, local observers were hired and automatic samplers were installed to assist in the collection of samples. Stage-activated automatic samplers were installed at inlets and outlets of the LaBolt and Dillon-Syltie impoundments, the two inlets of Lake Laura impoundment, and on Florida Creek, Lac qui Parle River, and Dry Creek. In 1982-83, the automatic samplers were set to collect samples at specified time intervals. The time intervals were manually set and varied from 15-minutes to 24 hours, depending on how rapidly stage rose or fell. In 1984, the samplers were set to initially activate abovea predetermined stage, and above this stage were set to be activated by eithera half-foot rise or fall in stage, or at the end of a 24-hour time interval.
At the time observers collected sediment samples, water temperature and stage were measured. Samples were collected weekly by observers during periods of base flow. During periods of rising stage, observers collected samples once or twice daily; during periods of falling stage, samples were collected daily until the stage fell below a predetermined level. Observers collected samples at Dillon-Syltie inlet, LaBolt inlet, Florida Creek, Lac qui Parle River, Lake Laura (north inlet, south inlet, and outlet,) and Dry Creek.
Two suspended-sediment samples and one bed-material sample were collectedat each site and analyzed for particle-size and Guy, 1969). During most runoff events
distribution (Guy and Norman, 1970, flow-weighted-composite samples
(Pickering, 1980) were collected and analy2:ed. Daily sediment concentration and load were determined by the methods of Porterfield (1972).
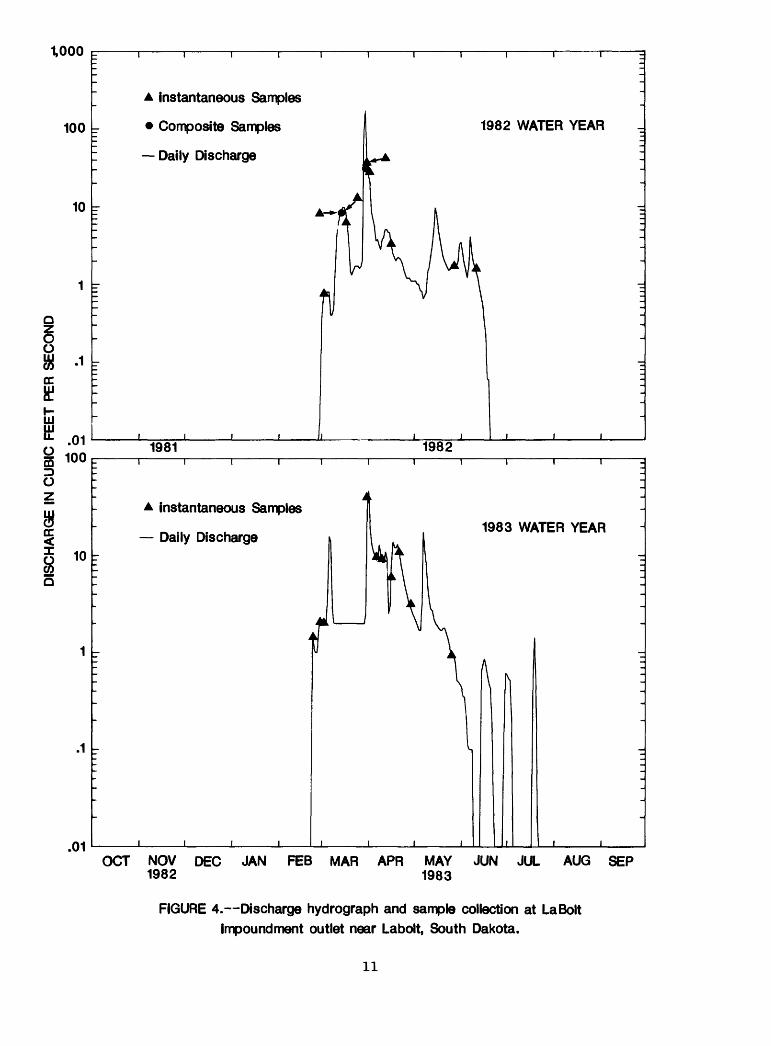
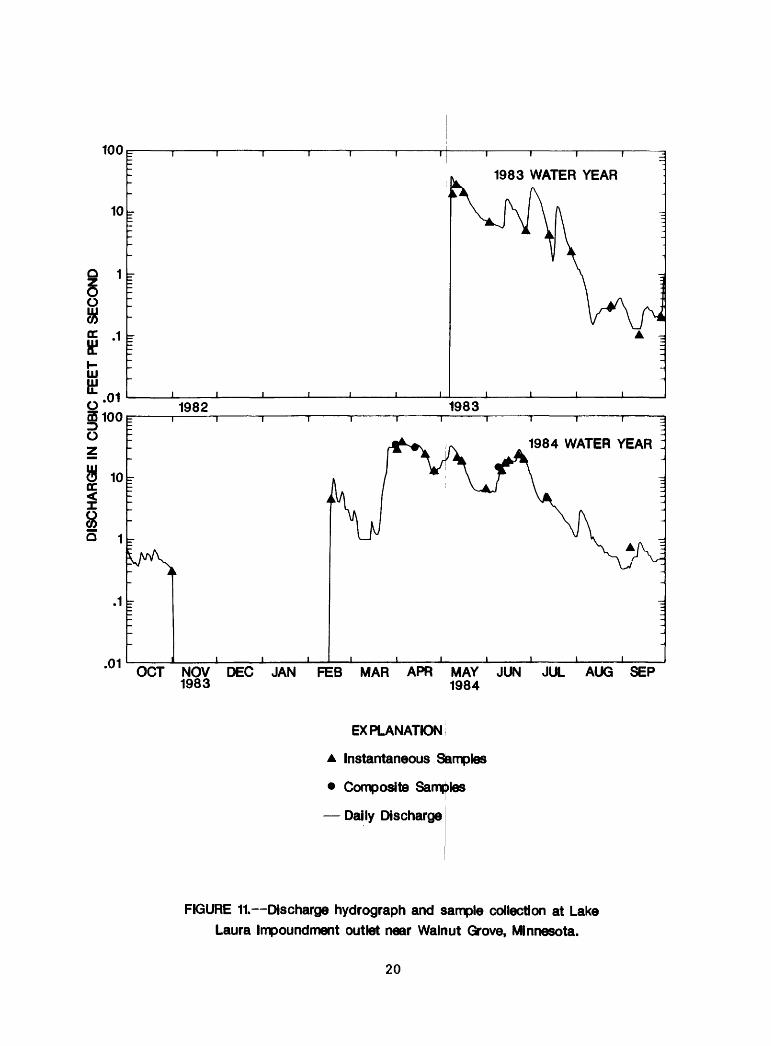
The annual discharge hydrographs for the impoundment inlets and outlets and the points on the hydrographs when either an instantaneous or composite water-quality sample was collected are shown in figures 3-12.
Use of trade names in this report is for identification purposes only and
does not constitute endorsement by the U.S. Geological Survey.

Impoundment Sites
Impoundment sites were sampled for chemical and biological analyses once in February or March each year. In 1980-81 and in 1984, the impoundments were sampled monthly from May through September. Only Dillon-Syltie impoundment was sampled during 1981. During 1982 and 1983, a two-week sampling interval was used. During scheduled visits, vertical profiles of water temperature, pH, dissolved oxygen, and specific conductance were obtained. Transparency and depth were measured at the sampling sites during each visit. Composite samples were collected from the euphotic zone 1 using a horizontal Van Dorn sampler during 1980-81, and a 2-inch plastic pipe during 1982-84. Phytoplankton and chlorophyll concentrations were determined using the methods described in Greeson and others (1979a and 1979b). Phytoplankton samples collected during 1981-83 were analyzed by the U.S. Geological Survey Laboratory, Doraville, Georgia. Phytoplankton samples collected during 1984 were analyzed by Aquatic Analysts, Portland, Oregon.
One bed-material sample was collected from the center of each impoundment and analyzed for nutrients, trace metals, organic carbon, volatile solids, and particle size. Supplemental bed-material samples for determination of particle size and volatile solids also were collected in the pools near the mouth of each inlet. At Lake Laura, the supplemental samples also were analyzed for nutrient and trace-metal concentrations.
The types of analyses of the water samples are summarized in table 3.
The euphotic zone was assumed to be 1.5 times the Secchi-disk transparency.

1,000
100
10
.1
.01100 P-
A Instantaneous Samples
Composite Samples
Daily Discharge
1982 WATER YEAR
1981 1982
10
oD 1 Oz
I -1
.01tooOpr
A Instantaneous Samples
Composite Samples
Daily Discharge
1982 1983
100
10
.1
.01
A Instantaneous Samples
Daily Discharge1984 WATER YEAR =
OCT NOV DEC JAN FEB MAR APR 1983
MAY JUN JUL AUG SEP 1984
FIGURE 3. Discharge hydrograph and sample collection at La Bolt Impoundment Inlet near Labolt, South Dakota
10
1,000 ii i i i i i i i r
100
10
^ ^a -1cca;UJ
D O
5
.01100
A Instantaneous Samples
Composite Samples
Daily Discharge
J______I_______I_______I
1982 WATER YEAR
I______I I______I______I
1981 1982
.01
Instantaneous Samples
Daily Discharge1983 WATER YEAR
OCT NOV DEC JAN FEB MAR APR MAY JUN JUL AUG SEP 1982 1983
FIGURE 4. Discharge hydrograph and sample collection at La Bolt Impoundment outlet near Labolt, South Dakota.
11

1,000
100 -
^^a!ccffUJa;o
Instantaneous Samples
Composite Samples
Daily Discharge
100
10
.1
.01
A Instantaneous Samples
Composite Samples
Daily Discharge
1984 WATER YEAR
OCT NOV DEC JAN FEB MAR APR
I______I______I______I
1983MAY JUN JUL AUG SEP 1984
FIGURE 5. Discharge hydrograph and sample collection at Florida Creek near Burr, Minnesota.
12

1,000
100
10
i r
.1
A Instantaneous Samples
Composite Samples
Daily Discharge
1983 WATER YEARA Instantaneous Samples
Composite Samples
Daily Discharge
1984 WATER YEAR :
A Instantaneous Samples
Composite Samples
Daily Discharge
OCT NOV DEC JAN FEB MAR APR MAY JUN JUL AUG SEP 1983 1984
FIGURE 6. Discharge hydrograph and sample collection at Lac Qui Parte River near Canby, Minnesota.
13

DIS
CH
AR
GE
IN
CU
BIC
FE
ET
PE
R S
EC
ON
D

100 F
I I I I I I I I I
OCT NOV DEC JAN FEB MAR APR MAY JUN JUL AUG SEP 1983 1984
EXPLANATION
A Instantaneous Samples
Composite Samples
Daily Discharge
at Dillon-Syltie Impoundment inlet near Porter Minnesota.
15

DIS
CH
AR
GE
IN
CU
BIC
FE
ET
PER
SE
CO
ND
0 b
o :i
o
oo
o
CO
00
25 5
m 00 *i 2 CO o
s CD
O
(O 0>
<O
00
10 I m 3D
TT
1T
TT
T1
^
7
<O
00 1
CO
00 o I m 3D >
3D

100 E
OCT NOV DEC JAN FEB MAR APR MAY JUN JUL AUG SEP 1983 1984
EXPLANATION
A Instantaneous Samples
Composite Samples
Daily Discharge
at Dillon-Syltie Impoundment outlet near Porter, Minnesota.
17

100 F
OCT NOV DEC JAN FEB MAR APR MAY JUN JUL AUG SEP 1983 1984
EXPLANATION
A Instantaneous Samples
Composite Samples
Daily Discharge
FIGURE 9. Discharge hydrograph and sample collection at Lake Laura Impoundment north inlet near Walnut Grove, Minnesota.
18

OCT NOV DEC JAN FEB MAR APR MAY JUN JUL AUG SEP 1983 1984
EXPLANATION
A Instantaneous Samples
Composite Samples
Daily Discharge
FIGURE 10. Discharge hydrograph and sample collection at Lake Laura Impoundment south inlet near Walnut Grove, Minnesota.
19
100 F
OCT NOV DEC JAN FEB MAR APR MAY JUN JUL AUG SEP 1983 1984
EXPLANATION
A Instantaneous Samples
Composite Samples
Daily Discharge
FIGURE 11. Discharge hydrograph and sample collection at Lake Laura Impoundment outlet near Walnut Grove, Minnesota.
20

DIS
CH
AR
GE
IN
CU
BIC
FE
ET
PE
R S
EC
ON
D
o
oo
.
§2
O oO
O oo
o
n O 5 m
M
"! 8
If ° 5 0) a CO
0> i B
<o
oo O)
| CD >
i i
11 in
] r
* 5"
| CO s? I
<0
00
10 I 31 i* >
i i
i i i
nil
i
i i
i i I
II
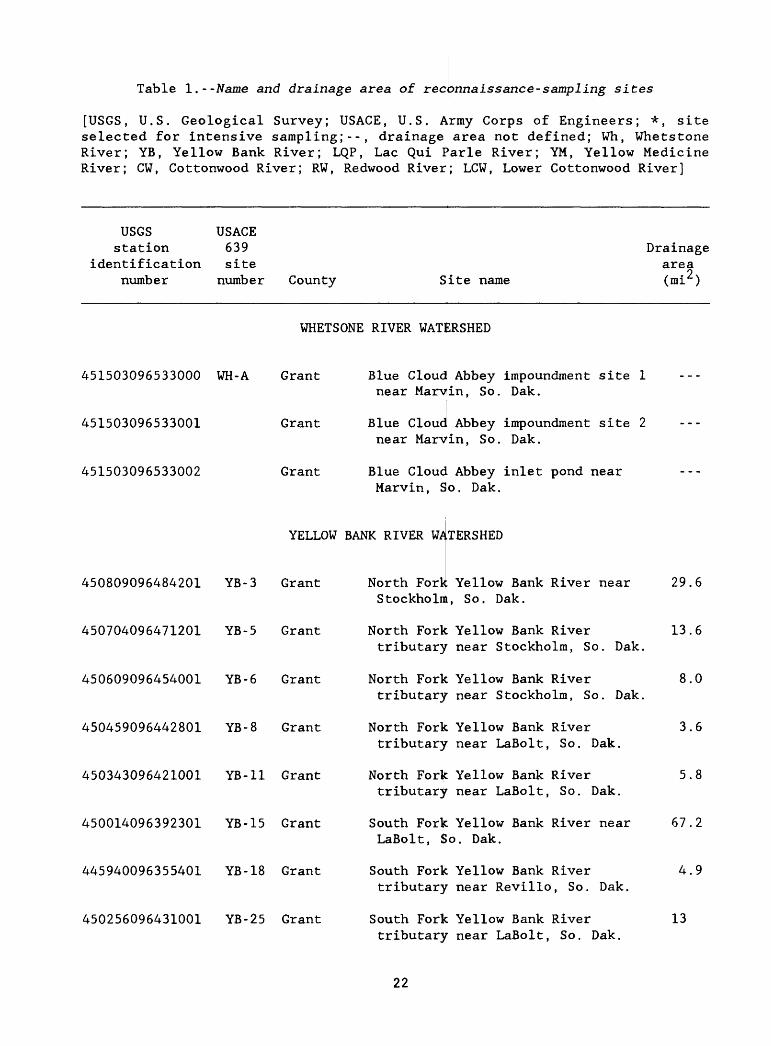
Table I.--Name and drainage area of reconnaissance-sampling sites
[USGS, U.S. Geological Survey; USAGE, U.S. Army Corps of Engineers; *, site selected for intensive sampling;--, drainage area not defined; Wh, Whetstone River; YB, Yellow Bank River; LQP, Lac Qui Parle River; YM, Yellow Medicine River; CW, Cottonwood River; RW, Redwood River; LCW, Lower Cottonwood River]
USGS USAGEstation 639
identification sitenumber number County Site name
Drainage area (mi2 )
WHETSONE RIVER WATERSHED
451503096533000 WH-A Grant
451503096533001
451503096533002
Grant
Grant
Blue Cloud Abbey impoundment site 1 near Marvin, So. Dak.
Blue Cloud Abbey impoundment site 2 near Marvin, So. Dak.
Blue Cloud Abbey inlet pond near Marvin, So. Dak.
YELLOW BANK RIVER WATERSHED
450809096484201 YB-3 Grant
450704096471201 YB-5 Grant
450609096454001 YB-6 Grant
450459096442801 YB-8 Grant
450343096421001 YB-11 Grant
450014096392301 YB-15 Grant
445940096355401 YB-18 Grant
450256096431001 YB-25 Grant
North Fork Yellow Bank River near 29.6 Stockholm, So. Dak.
North Fork Yellow Bank River 13.6 tributary near Stockholm, So. Dak.
North Fork Yellow Bank River 8.0 tributary near Stockholm, So. Dak.
North Fork Yellow Bank River 3.6 tributary near LaBolt, So. Dak.
North Fork Yellow Bank River 5.8 tributary near LaBolt, So. Dak.
South Fork Yellow Bank River near 67.2 LaBolt, So. Dak.
South Fork Yellow Bank River 4.9 tributary near Revillo, So. Dak.
South Fork Yellow Bank River 13 tributary near LaBolt, So. Dak.
22

Table I.--Name and drainage area of reconnaissance-sampling sites--Continued
USGS USAGEstation 639
identification sitenumber number County Site name
Drainage area (mi2 )
YELLOW BANK RIVER WATERSHED--Continued
450210096381601 YB-30 Grant
450317096412100
450317096412102
Grant
South Fork Yellow Bank River near 2.6 LaBolt, So. Dak.
*LaBolt impoundment near 17.4 LaBolt, So. Dak.
Grant *LaBolt inlet near LaBolt, So. Dak. 17.1
450317096412104 Grant *LaBolt outlet near LaBolt, So. Dak. 17.4
445808096355900 YB-A Deuel
445846096345600 YB-B Grant
445846096345604
445912096363904
450006096461502
Grant
445912096363900 YB-C Grant
Grant
450006096461500 YB-D Grant
Grant
Gene Brondenbuiger impoundment near Revillo, So. Dak.
Mud Creek impoundment near Revillo, So. Dak.
Mud Creek outlet near Revillo, So. Dak.
Daniel Schafer impoundment near Revillo, So. Dak.
Daniel Schafer impoundment outlet near Revillo, So. Dak.
Edwin Swenson impoundment near Strandburg, So. Dak.
Edwin Swenson inlet near Strandburg, So. Dak.
23

Table I.--Name and drainage area of reconnaissance-sampling sites--Continued
USGS USAGEstation 639 Drainage
identification site areaonumber number County Site name (mi )
LAC QUI PARLE RIVER WATERSHED
444417096322701 LQP-2 Deuel North Branch Cobb Creek (So. Dak.) 17headwaters to Florida Creek near Brandt, So. Dak.
444410096251001 LQP-3 Yellow *Florida Creek near Burr, Minn. 28Medicine
445609096192101 LQP-4 Lac qui Florida Ctfeek near Dawson, Minn. 150Parle
443638096275401 LQP-5 Deuel Fish LakeSo. Dak.
outlet near Astoria, 72
443916096174801 LQP-8 Yellow *Lac qui Piirle River near Canby, 186Medicine Minn.
443751096315101 LQP-10 Deuel Cobb Creek (So. Dak.) headwatersat Florida Creek near Astoria, So. Dak.
444754096224501 LQP-12 Yellow Cobb Creek (Minn.) tributary near 4.9Medicine Gary, So. Dak.
444812096235901 LQP-13 Yellow Cobb Creek (Minn.) near Gary, Minn. 3.0Medicine
444125096243501 LQP-25 Yellow Lazarus Creek near Canby, Minn. 25Medicine
444911096270601 LQP-26 Deuel Monighan Creek near Gary, Minn. 30
444726096274201 LQP-28 Deuel *West Branch Lac qui Parle River 50near Gary, So. Dak.
24

Table 1.--Name and drainage area of reconnaissance-sampling sites--Continued
USGS USAGEstation 639
identification sitenumber number County Site name
Drainage area (mi2 )
LAC QUI PARLE RIVER WATERSHED--Continued
445108096284501 LQP-29 Deuel West Branch Lac qui Parle River near Gary, Minn.
2.2
445146096305401 LQP-30 Deuel Crow Creek near Gary, So. Dak. 10.8
445329096294601 LQP-32 Deuel
445509096312201 LQP-34 Deuel
445600096344301 LQP-38 Deuel
445754096332601 LQP-40 Deuel
444900096240000
444900096240002
444900096240004
Lac qui Parle
Lac qui Parle
Lac qui Parle
443634096281700 LQP-A Deuel
444249096234600 LQP-B YellowMedicine
Crow Creek tributary near Gary, 10.8 So. Dak.
Crow Timber Creek near Revillo, 6.5 So. Dak.
Lost Creek tributary near Revillo, 5.3 So. Dak.
West Branch Lac qui Parle River 2.8 near Revillo, So. Dak.
*Webber impoundment near Gary, 1.4 So. Dak.
*Webber inlet near Gary, So. Dak. 1.4
*Webber outlet near Gary, So. Dak. 1.4
Fish Lake near Astoria, approx. 72 So. Dak.
Knutson impoundment near Burr, Minn.
25

Table I.--Name and drainage area of reconnaissance-sampling sites--Continued
USGS USAGEstation 639
identification sitenumber number County Site name
Drainage area (mi2 )
444249096234602
LAC QUI PARLE RIVER WATERSHED--Continued
Yellow Knutson inlet near Burr, Minn. Medicine
444506096222400 LQP-C Yellow Full impoundment near Burr, Minn.Medicine
YELLOW MEDICINE RIVER
443330096105301 YM-21 Lincoln
443203096164001 YM-24 Lincoln
443538096140701 YM-25 Lincoln
443617096080101 YM-27 Lincoln
WATERSHED
Yellow Medicine River above Wilno, 61 Minn.
North Branch Yellow Medicine River 34 near Ivanhoe, Minn.
North Branch Yellow Medicine River 6.4 near Porter, Minn.
North Branch Yellow Medicine River 2.8 near Porter, Minn.
26

Table I.--Name and drainage area of reconnaissance-sampling sites--Continued
usesstation
identification number
443845096124401
443752096115601
443328096053801
443329096040201
443211096033601
442826096043001
442914096004501
442909096055901
443636096095400
443636096095402
443636096095404
USAGE 639 site
number County
YELLOW MEDICINE
YM-30 Yellow Medicine
YM-31 Lincoln
YM-34 Lincoln
YM-35 Lyon
YM-37 Lyon
YM-47 Lyon
YM-50 Lincoln
YM-60 Lincoln
YM-23 Lincoln,
Lincoln,
Lincoln,
Drainage area
0Site name (mi )
RIVER WATERSHED- -Continued
Mud Creek tributary near Porter, Minn.
Mud Creek tributary near Porter, Minn.
Yellow Medicine River tributary near Taunton, Minn.
Yellow Medicine River tributary near Taunton, Minn.
Yellow Medicine River tributary near Minneota, Minn.
South Branch Yellow Medicine River near Arco, Minn.
Yellow Medicine River tributary near Ghent, Minn.
South Branch Yellow Medicine Rivernear Taunton, Minn.
*Dillon-Syltie impoundment near Porter, Minn.
*Dillon-Syltie inlet near Porter, Minn.
*Dillon-Syltie outlet near Porter,
6.4
3.7
74
4.8
3.5
3.5
6.9
60
4.8
4.78
4.8Minn.
27

Table I.--Name and drainage area of reconnaissance-sampling sites--Continued
USGS USAGEstation 639
identification sitenumber number County Site name
Drainage area (mi2 )
YELLOW MEDICINE RIVER WATERSHED--Continued
443839096120400 YM-A
443839096120402
443351096073300 YM-B
443606091700001 YM-C
Yellow Tibbetts impoundment near Medicine Porter, Minn.
Yellow Tibbetts inlet near Porter, Minn. Medicine
Lincoln Van Over Beke impoundment near Minneota,, Minn.
Lincoln Miller Estate impoundment near Taunton, Minn.
REDWOOD RIVER WATERSHED
442008096020800
442008096020802
441512096074501
440841096054401
441325095595101
442708095573101
442914095563301
442600095523601
RW-10 Lyon
Lyon
Coon Creek! DNR impoundment near Russell, Minn.
Coon Creek DNR impoundment inlet near Russell, Minn.
44
RW-17 Lincoln County ditch 7 near Tyler, Minn.
RW-20 Pipes tone Redwood Rijver tributary nearRuthton,
RW-22 Lyon
RW-30 Lyon
RW-31 Lyon
RW-37 Lyon
Redwood River near Florence, Minn,
Three Mile Creek tributary near Ghent, Minn.
Three Mile Creek tributary near Ghent, Minn.
Redwood Ri|ver tributary near Marshall,! Minn.
2.9
50
3.2
4.0
9.1
28

Table I.--Name and drainage area of reconnaissance-sampling sites--Continued
USGS USAGEstation 639
identification sitenumber number County Site name
Drainage area (mi 2 )
REDWOOD RIVER WATERSHED--Continued
442324095565800 RW-A Lyon
442324095565802
442324095565804
Lyon
Lyon
Banks impoundment near Marshall, Minn.
Banks inlet near Marshall, Minn.
Banks outlet near Marshall, Minn.
COTTONWOOD RIVER WATERSHED
442116095440601 CW-5 Lyon
442029095425301 CW-6 Lyon
442028095414001 CW-7 Lyon
442158095455001 CW-10 Lyon
441751095415901 CW-16 Lyon
441657095354801 CW-19 Lyon
441421095343101 CW-22 Redwood
440909095362101 CW-24 Murray
Meadow Creek tributary near 53 Amiret, Minn.
Meadow Creek tributary near 3.1 Amiret, Minn.
Meadow Creek tributary near 4.1 Amiret, Minn.
Meadow Creek tributary above Lake 6.0 Marshall near Marshall, Minn.
Cottonwood River near Amiret, Minn. 48
Cottonwood River tributary near 7.2 Tracy, Minn.
Cottonwood River tributary near 3.8 Tracy, Minn.
Plum Creek tributary below Robbins 6.1 slough near Kelly, Minn.
441228095292101 CW-26 Redwood Plum Creek near Walnut Grove, Minn. 61
29

Table I.--Name and drainage area of reconnaissance-sampling sites--Continued
USGS USAGEstation 639
identification sitenumber number County Site name
Drainage area (mi2 )
COTTONWOOD RIVER WATERSHED--Continued
441357095315801 CW-28 Redwood Plum Creek tributary near Tracy, Minn.
4.5
441146095265801
441049095242401
CW-31 Cotton- wood
CW-33 Cotton- wood
441246096274200 CW-27 Redwood
441246096274201
441246096274202
441246096274204
441252095340100
441252095340102
441252095340104
441417095405500
441417095405502
441749095251700
Redwood
Redwood
Redwood
CW-A Redwood
Redwood
Redwood
CW-B Lyon
Lyon
CW-C Redwood
Pell Creek near Walnut Grove, Minn. 4.7
5.5
7.0
5.0
2.0
17.0
Pell Creek tributary near Revere, Minn.
*Lake Laura impoundment near Walnut Grove, Minn.
*Lake Laur£ south inlet near Walnut Grove, Mxnn.
*Lake Laura north inlet near Walnut Grove, Mtnn.
*Lake Laura outlet near Walnut Grove Minn.
Drayum impoundment near Tracy, Minn.
Drayum inlet near Tracy, Minn.
Drayum outlet near Tracy, Minn.
Kass impoundment near Tracy, Minn.
Kass Tile inlet near Tracy, Minn.
Knott impoundment near Lamberton, Minn.
30

Table I.--Name and drainage area of reconnaissance-sampling sites--Continued
USGS USAGEstation 639
identification sitenumber number County Site name
Drainage area (mi2 )
COTTONWOOD RIVER WATERSHED--Continued
441749095251702 Redwood Knott inlet near Lamberton, Minn.
444222409551400 CW-D Lyon Pagel impoundment near Marshall, Minn.
LOWER COTTONWOOD RIVER WATERSHED
440907095212901
440630095212201
05316900
LCW-10 Cotton- wood
LCW-18 Cotton- wood
LCW-21 Cotton- wood
Dutch Charley Creek tributary 10.6 near Lamberton, Minn.
Dutch Charley Creek near Storden, 42 Minn.
*Dry Creek near Jeffers, Minn. 3.13
440538095114101 LCW-22 Cotton- wood
Dry Creek tributary near Jeffers, Minn.
3.2
440814095114501 LCW-25A Cotton- wood
Dry Creek near Sanborn, Minn.
440831095120501 LCW-25B Cotton- wood
Dry Creek near Sanborn, Minn.
440750095052001 LCW-26 Brown Mound Creek tributary near Sanborn, 14.0 Minn.
440720095051501 LCW-27 Brown Mound Creek near Sanborn, Minn. 13.5
31

Table I.--Name and drainage area of reconnaissance-sampling sites--Continued
USGS USAGEstation 639
identification sitenumber number County Site name
Drainage area (mi2 )
LOWER COTTONWOOD RIVER WATERSHED--Continued
440839095012601 LCW-28 Brown Mound Creek tributary near Sanborn, Minn.
3.8
440524095164000 LCW-A Cotton- wood
440524095164002 Cotton- wood
Swenson impoundment near Jeffers, Minn.
Swenson Tile inlet to impoundment near Jeffers, Minn.
32

Table 2.--General description of intensively sampled sites
f\ O
[ft, feet; mi, mile; mi , square miles; in., inch; f t /s, cubic feet per second; ft/mi, feet per mile]
Site name General watershed characteristics
YELLOW BANK RIVER WATERSHED
LaBolt impoundment near LaBolt, So. Dak,
LaBolt inlet near LaBolt, So. Dak.
Outlet structure - ogee wier width......26.8 ftResidual storage volume................. 36.7 acresSurface area at normal pool elev.........6.8 acresDepth at sampling point (approx)........ 10 ftLength...............................1,030 ftWidth..................................350 ft
9 Drainage Area........................... 17.1 miLength of main channel...................9.8 miSlope................................... 49 ft/miPercent of lakes and swamps .............. 5.4 percentMean annual runoff.......................2.0 in.Peak-flow o
Estimate of 2-year peak discharge...90 ft /s Estimate of 5-year peak discharge..206 ft3/5 Estimate of 10-yearpeak discharge................... 310 ft /s
Estimate of 25-yearpeak discharge...................478 ft /s
Estimate of 100-yearpeak discharge................... 784 ft /s
Low-flowEstimate of 7-day 2-year
low discharge...................... 0 ft /sEstimate of 7-day 10-year
low discharge...................... 0 ft3/s
Land UseCropland............................42 percentPasture............................. 54 percentWoods................................ 1 percentOther................................ 3 percent
LaBolt outlet near LaBolt, So. Dak.
Drainage area...........................17.4 mi,2
33

Table 2.--General description of intensively sampled sites--Continued
Site name General watershed characteristics
LAC QUI PARLE RIVER WATERSHED
Webber impoundment near Gary, So. Dak.
Webber inlet near Gary, So. Dak.
Drainage area............................1.4 mi'
Drainage area............................1.4 mi'
West BranchLac qui Parle Rivernear Gary, So. Dak.
2 Drainage area........................... 14.4 miLength of main channel..................11.7 miSlope...................................17.6 ft/miPercent of lakes and swamps..............7.8 percentMean annual runoff....................... 2 in.Peak-flow o
Estimate of 2-ye!ar peak discharge. .. 51 ftj/sEstimate of 5-ye[ar peak discharge. . 115 ft /sEstimate of 10-year opeak discharge^................... 171 f tj/s
Estimate of 25-y.ear opeak discharge................... 260 f tj/s
Estimate of 100-yearpeak discharge:................... 419 ft3/3
Low-flowEstimate of 7-day 2-year
low discharge......................0.9 ft^/sEstimate of 7-day 10-year
low discharge J..................... 0.6 ft /s
Land useCropland....... 4 .................... 51 percentPasture............................. 45 percentWoodland............................. 1 percentOther................................ 3 percent
34
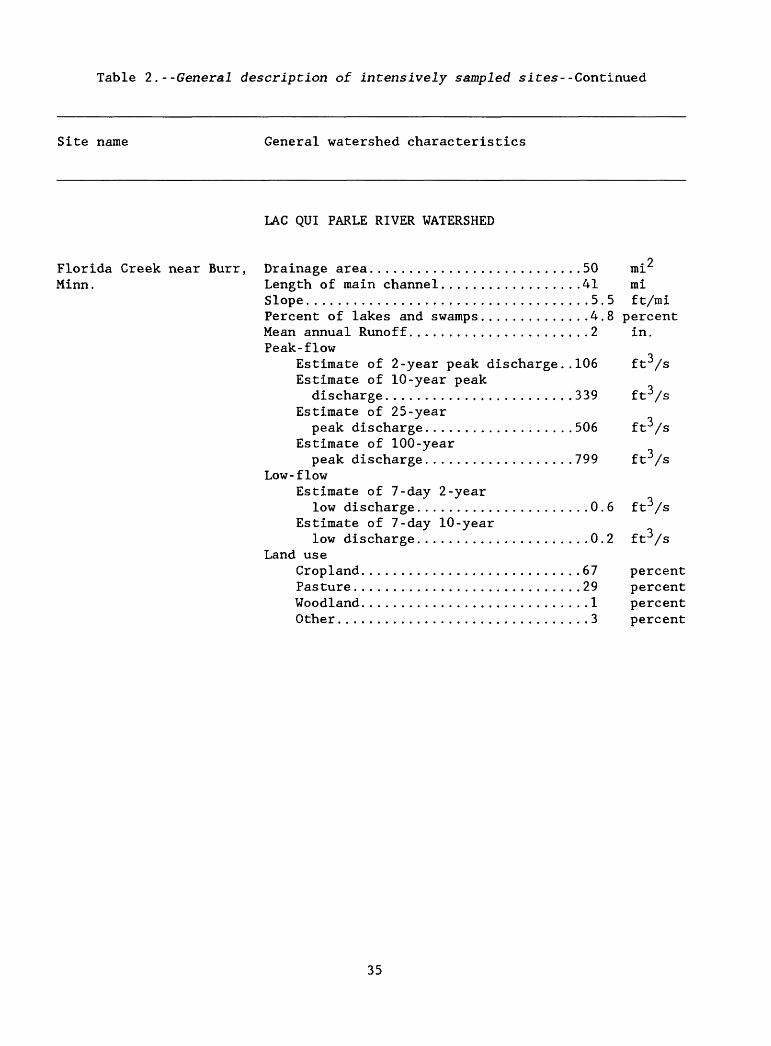
Table 2.--General description of intensively sampled sites--Continued
Site name General watershed characteristics
LAC QUI PARLE RIVER WATERSHED
oFlorida Creek near Burr, Drainage area........................... 50 miMinn. Length of main channel..................41 mi
Slope....................................5.5 ft/miPercent of lakes and swamps..............4.8 percentMean annual Runoff....................... 2 in.Peak-flow
oEstimate of 2-year peak discharge..106 ft /s Estimate of 10-year peak
discharge........................ 339 ft3/sEstimate of 25-yearpeak discharge................... 506 ft /s
Estimate of 100-yearpeak discharge................... 799 f t /s
Low-flowEstimate of 7-day 2-year
low discharge......................0.6 ft /sEstimate of 7-day 10-year
low discharge......................0.2 ft /sLand use
Cropland............................ 67 percentPasture............................. 29 percentWoodland............................. 1 percentOther................................ 3 percent
35

Table 2. --General description of intensively sampled sites--Continued
Site name General watershed characteristics
IAC QUI PARLE RIVER WATERSHED
Lac qui Parle River near Canby, Minn.
Drainage area.......................... 186Length of main channel..................47Slope 10.7Percent of Lakes and Swamps .............. 5,Mean annual Runoff....................... 2Peak-flow
Estimate of 2-ydar peak discharge..325 Estimate of 5-year peak discharge..715 Estimate of 10-yearpeak discharge................. 1,050
Estimate of 25-yearpeak discharge................. 1,560
Estimate of 100-yearpeak discharge.................2,470
Low-flowEstimate of 7-day 2-year
low discharge...................... 0Estimate of 10-clay 10-year
low discharge...................... 0Land use
Cropland............................ 75Pasture........,.................... 20Woodland............................. 1Other................................ 4
mift/mi percent in.
ft3/s ft3/s
ft3/s
ft3/s
ft3/s
ft3/s
ft3/s
percent percent percent percent
36

Table 2.--General description of intensively sampled sites--Continued
Site name General watershed characteristics
YELLOW MEDICINE RIVER WATERSHED
Dillon-Syltie Outlet structure - drop inlet at edgeimpoundment near of poolPorter, Minn. Residual storage volume...............117 acre-feet
Surface area at normal pool elev.......15.5 acresLength of shore line................ 5,300 ftLength..............................1,730 ftWidth................................. 570 ft
2 Dillon-Syltie inlet Drainage area...........................4.78 minear Porter, Minn. Length of main channel.................. 5.55 mi
Slope.................................. 43 ft/miPercent of lakes and swamps.............0.5 percentMean annual Runoff...................... 2 in.Peak-flow o
Estimate of 2-year peak discharge..58 ft /s Estimate of 5-yearpeak discharge.................. 138 ft3/s
Estimate of 10-yearpeak discharge.................. 210 f t /s
Estimate of 25-yearpeak discharge.................. 329 ft /s
Estimate of 100-yearpeak discharge.................. 552 ft /s
Low-flowEstimate of 7-day 2-year
low discharge..................... 0 ft sEstimate of 7-day 10-year
low discharge..................... 0 ft /s
Land useCropland........................... 85 percentPasture............................. 7 percentWoodland............................ 3 percentOther............................... 5 percent
Dillon-Syltie outlet near Porter, Minn.
Drainage area............................4.8 mi2
37

Table 2.--General description of intensively sampled sites--Continued
Site name General watershed characteristics
COTTONWOOD RIVER WATERSHED
Lake Laura impoundment near Walnut Grove, Minn.
Lake Laura south inlet near Walnut Grove, Minn.
Outlet structure - tower with drop inletin pool
Residual storage volume................221 acre-feetLength of shore line................ 10,800 ftSurface area at normal pool elev........21.3 acresLength............................... 2,480 ftWidth.................................. 550 ftLand use
Cropland............................ 79 percentPasture..........j................... 2 percentWoodland.............................6 percentOther............................... 13 percent
2 Drainage area.............................5.0 miLength of main channel.................... 2.46 miSlope.................i.................. 32 ft/miPercent of lakes and swamps...............0.2 percentMean annual runoff.......................3.5 in.Peak-flow o
Estimate of 2-year peak discharge...109 ft /s Estimate of 5-year peak discharge... 238 ft /s Estimate of 10-yeafpeak discharge.................... 350 ft3/s
Estimate of 25-yearpeak discharge.................... 526 ft3/s
Estimate of 100-yearpeak discharge.. h ................. 843 ft /s
Low-flow ;Estimate of 7-day 2-year
low discharge...^................... 0 ft 3/3Estimate of 7-day JLO-year
low discharge....................... 0 ft /s
38

Table 2.--General description of intensively sampled sites--Continued
Site name General watershed characteristics
COTTONWOOD RIVER WATERSHED
oLake Laura north inlet Drainage area............................ 1.12 minear Walnut Grove, Minn. Length of main channel...................2.5 mi
Slope................................... 54 ft/miPercent of lakes and swamps..............0.5 percentMean annual runoff.......................3.5 in.Peak-flow
oEstimate of 2-year peak discharge...39 ft /s Estimate of 5-year peak discharge...86 ft /s Estimate of 10-yearpeak discharge................... 128 ft3/s
Estimate of 25-yearpeak discharge................... 195 ft /s
Estimate of 100-yearpeak discharge.................. 317 ft3/8
Low-flowEstimate of 7-day 2-year
low discharge...................... 0 ft /sEstimate of 7-day 10-year
low discharge...................... 0 ft Vs
9 Lake Laura outlet near Drainage area............................ 6.83 miWalnut Grove, Minn.
39

Table 2. --General description of intensively sampled sites--Continued
Site name General watershed characteristics
LOWER COTTONWOOD RIVER
Dry Creek near Jeffers, Minn.
oDrainage area............................3.13 miLength of main channel...................4.62 miSlope...................................61.4 ft/miPercent of lakes and swamps .............. 0 percentMean annual runoff.^..................... 4.0 in.Peak-flow
oEstimate of 2-year peak discharge..127 ft /s Estimate of 5-year peak discharge..280 ft /s Estimate of 10-yearpeak discharge...................416 ft3/s
Estimate of 25-yearpeak discharge................... 802 ft 3/s
Estimate of lOoLyearpeak discharge................. 1,000 ft3/5
Low-flowEstimate of 7-day 2-year
low discharge...................... 0 f t /sEstimate of 7-day 10-year
low discharge...................... 0 ft /sLand use
Cropland............................ 90 percentPasture.............................. 5 percentWoodland............................. 1 percentOther................................4 percent
40

Table 3.--Type, of data collected, 1980-84 water years
[X indicates stream sites; P indicates impoundment site;--, data not collected]
1980
Water Years
1981 1982 1983 1984
Streamflow........................... X X X X XSuspended sedimentDaily ............................. --- --- X X XInstantaneous...................... X X X X X
Suspended particle size............. --- --- X X XBed-material size.................... --- --- X X X
Vertical profile..................... P P P P PWater temperature............... PX PX PX PX PXpH.............................. PX PX PX PX PXSpecific conductance............ PX PX PX PX PXDissolved oxygen................ PX PX PX PX PX
Secchi-disk transparency............. P P P P PStage................................ PX PX PX PX PXDepth at sampling point.............. P P P P PAir temperature...................... PX PX PX PX PXBarometric pressure.................. - - - - - - PX PX PX
Phosphorus, total.................... PX PX PX PX PXDissolved phosphorus................. --- --- P P PDissolved ortho phosphorus........... --- --- P P P
Nitrite plus nitrate, total.......... P P --- --- ---Ammonia nitrogen, total.............. P P --- --- ---Organic nitrogen, total.............. P P --- --- ---Ammonia plus organic nitrogen, total. P P XXXNitrogen, total...................... P P --- --- ---Dissolved nitrite plusnitrate nitrogen................... - - - - - - PX PX PX
Dissolved ammonia nitrogen........... --- --- P P PDissolved ammonia plus
organic nitrogen................... --- --- P P P
Dissolved calcium.................... --- --- PX PX PXDissolved magnesium.................. - - - - - - PX PX PXDissolved potassium.................. --- --- X X X
41

Table 3. --Type of data collected, 1980-&4 water years--Continued
Water Years
1980 1981 1982 1983 1984
Dissolved silica...................Dissolved sodium...................Dissolved chloride..................Dissolved fluoride.................Dissolved sulfate..................Dissolved suspended solids at 180° C Bicarbonate........................Carbonate..........................Total alkalinity...................Fecal coliform.....................Fecal Streptococci.................
Chlorophyll a and b, Phytoplankton.......
PXXPXXXPXPXPXPXPXPX
P P
PXXPXXXPXPXPXPXPXPX
P P
PXXPXXXPXPXPXPXPXPX
P P
42

Table 4.- -One-time chemical analyses of bed material at impoundments,1982-83 water years
[Analyses made for LaBolt, Webber, and Dillon-Syltie impoundments 1982 water year; Analyses made for Lake Laura impoundment 1983 water year]
Phosphorus, total
Nitrite plus nitrate, totalAmmonia, totalAmmonia plus organic nitrogen, total
Arsenic, total Barium, total recoverable Beryllium, total recoverable Cadmium, total recoverable Chromium, total recoverable Copper, total recoverable Iron, total recoverable Lead, total recoverable Manganese, total recoverable Mercury, total recoverable Nickel, total recoverable Zinc, total recoverable
Carbon, total organic Carbon, total inorganic
Cyanide, total
Volatile solids, total
43

REFERENCES CITED
Arneman, H. F., 1963, Soils of Minnesota: Agricultural Experiment Station,University of Minnesota, Extension Bulletin 278, 8 p.
Buchanan, T. J., and Somers, W. P., 1969, Discharge measurements at gagingstations: U.S. Geological Survey Techniques of Water-ResourcesInvestigations, Book 3, Chapter A8, 65 p.
Greeson, P. E. , Ehlke, T. A., Irwin, G. A., Lium, B. W. , and Slack, K. V.,1979a, Methods for the collection and analysis of aquatic biological andmicrobiological samples: U.S. Geological Survey Techniques of Water- Resources Investigations, Book 5, Chapter A4, 332 p.
Greeson, P. E., Ehlke, T. A., Lium, B. W., Shoaf, W. T., Radtke, D. B., andSohn, I. G., 1979b, A supplement to methods for collection and analysis ofaquatic biological and microbiological samples (U.S. Geological SurveyTechniques of Water-Resources Investigations, Book 5, Chapter A4) : U.S.Geological Survey Open-File Report 79-1279,| 92 p.
Guy, H. P., 1969, Laboratory theory and methods for sediment analysis: U.S.Geological Survey Techniques of Water-Resources Investigations, Book 5,Chapter Cl, 58 p.
Guy, H. P. , and Norman, V. W. , 1970, Field methods for measurement of fluvialsediment: U.S. Geological Survey Techniques of Water-ResourcesInvestigations, Book 3, Chapter C2, 59 p.
Jacques, J. E., and Lorenz, D. L., 1987 (in review), Techniques for estimatingthe magnitude and frequency of floods of ungaged streams in Minnesota: U.S.Geological Survey Techniques of Water-Resources Investigations Report 87.
Kuehnast, E. L., and Baker, D. G., 1978, Climate of Minnesota-Precipitationnormals: Agricultural Experiment Station, University of Minnesota,Technical Bulletin 314-1978, 16 p.
National Oceanic and Atmospheric Administration, 1979-84, MonthlyClimatological Data for Minnesota: National Oceanic and AtmosphericAdministration.
Pickering, R. J., 1980, Manual compositini methods for urban storm-runoffsamples: U.S. Geological Survey, Quality of Water Branch TechnicalMemorandum No. 81.03, 8 p.
Porterfield, George, 1972, Computation of fluvial-sediment discharge: U.S.Geological Survey Techniques of Water-Resources Investigations, Book 3,Chapter C3, 66 p.
Skougstad, M. W., Fishman, M. J., Friedman, L. C., Erdmann, D. E., andDuncan, S. S., 1979, Methods for analysis of inorganic substances in waterand fluvial sediments: U.S. Geological Sutvey Techniques of Water-ResourcesInvestigations, Book 5, Chapter Al, 1,006 p.
Stedinger, J. R., and Thomas, W. 0., 1985, Lbw-flow frequency estimation usingbase-flow measurements: U.S. Geological Survey Open-File Report 85-95, 22P-
Theil, G. A., 1944, The geological and Minnesota: University of Minnesota Press,
U.S. Army Corps of Engineers, 1980, Stage '... Alternatives Report for UpperMinnesota River Subbasin Study (Public
underground waters of southern 505 p.
,aw 87-639): U.S. Army Corps ofEngineers and U.S. Soil Conservation Service, 444 p.
44

TABLES OF DATA
Tables given in this section of the report are a compilation of streamflow and water-quality data collected for this study. Mean daily discharge data (5a, 5j, 8a, 9a, lOa, 10J, lla, lie, lln, and 12a), water-quality data (tables 5b, 5f, 5k, 6a, 6c, 7b, 8b, 9b, lOb, lOg, 10k, lib, llf, Ilk, llo, and 12b), water-quality-profile data (5f, 6b, lOf, and llj), and suspended-sediment data 5c, 5m, 7c, 8c, 9c, lOc, 101, lie, llg, lip, and 12d) are stored in the U.S. Geological Survey WATSTORE system in Reston, Virginia, and on the Minnesota District's Prime Computer. The water-quality data also are stored in the U.S. Environmental Protection Agency STORET system; figures 3-13 present the annual discharge hydrographs and points on the hydrograph when either a composite or instantaneous water-quality sample was collected.
45

Tables 5a to 13g are on the microfiche.
46
U.S. GOVERNMENT PRINTING OFFICE 1990-756-251/00150