hydrologic modeling of final cover - us department of … · system, lateral drainage ......
TRANSCRIPT
Document ID: EDF-ER-279 Revision ID: 2 Effective Date: 0511 4/02
Engineering Design File
Hydrologic Modeling of Final Cover
I and Enuironmerital Laboraton
Form 412.14 07/24/2001 Rev. 03

431 -02 06/20/2001 Rev. 09
ENGINEERING DESIGN FILE EDF- ER-279 Rev. No. 2
Page 1 of 2
- Title: Hydrologic Modeling of Final Cover !. Project File No.: NA I. Site Area and Building No.: NA i. Summary:
14. SSC Identification/Equipment Tag No.: NA
The long-term infiltration rates through the proposed landfill cover section for the INEEL CERCLA Disposal Facility (ICDF) were estimated to determine percolation from the base of the cover. Hydrologic modeling was conducted to simulate extreme climatic scenarios that could result in infiltration through the cover. Climatic parameters used during hydrologic modeling were based on site data from 10 years representing average conditions (1 967 to 1976) followed by four years with precipitation greater than the 90th percentile of recorded annual precipitation (1 957, 1963,1964, and 1995) to represent an extreme climatic scenario. The modeling effort evaluated the performance of the cover by determining surface run-off, infiltration through the upper soil component of the cover system, lateral drainage, and cover defects. The performance of the soil cover was evaluated based on the water flux at a node located at the base of the ICDF landfill cover. Sensitivity analyses were performed to determine the optimum water storage layer thickness and upper precipitation bound.
Based on the results from the simulations reported in this engineering design file for the ICDF landfill cover, results from experimental studies at the INEEL, and experimental and modeling results from other sites in the western United States, it is believed that the cover design proposed for the ICDF landfill represents a state-of-the-practice design for a landfill cover that minimizes infiltration into the waste. Any leakage that occurs through the cover is likely to be intercepted by the lateral drainage layers at the base of the cover. A conservative estimate of 0.1 mm/year of percolation from the base of the cover was determined based on the estimated break through from the upper section of the cover. Based on the results reported in this engineering design file (EDF). it is believed that the cover design, which incorporates a store and release soil cover underlain by a capillary break and composite liner system, represents the best technology for minimizing infiltration into the landfill given site-specific climatic conditions.
j. Review (R) and Approval (A) and Acceptance (Ac) Signatures:
qeviewer
7. Distribution: (Name and Mail Stop)
3. Records Management Uniform File Code (UFC): Disposition Authority: I Retention Period:
M. Doornbos, MS 3930; D. Vernon, MS 3930; T. Borschel, MS 3930
431 -02 06/20/200 1 Rev. 09
ENGINEERING DESIGN FILE EDF- ER-279 Rev. No. 2
Page 2 of 2
19. Registered Professional Engineer’s Stamp (if required)

ABSTRACT
The long-term infiltration rates through the proposed landfill cover section for the INEEL CERCLA Disposal Facility were estimated to determine percolation from the base of the cover. Hydrologic modeling was conducted to simulate extreme climatic scenarios that could result in infiltration through the cover. Climatic parameters used during hydrologic modeling were based on site data from 10 years representing average conditions (1967 to 1976) followed by four years with precipitation greater than the 90th percentile of recorded annual precipitation (1957, 1963, 1964, and 1995) to represent an extreme climatic scenario. The modeling effort evaluated the performance of the cover by determining surface run-off, infiltration through the upper soil component of the cover system, lateral drainage, and cover defects. The performance of the soil cover was evaluated based on the water flux at a node located at the base of the INEEL CERCLA Disposal Facility landfill cover. Sensitivity analyses were performed to determine the optimum water storage layer thickness, upper precipitation bound, and effect of long-term climate changes.
._. 111

iv

CONTENTS ... ABSTRACT ................................................................................................................................................ 111
ACRONYMS .............................................................................................................................................. vi1
1 . INTRODUCTION ........................................................................................................................... 1-1
2 . METHODS ..................................................................................................................................... 2-1
3 . INPUT DATA ................................................................................................................................. 3-1
3.1 Climatological Data .............................................................................................................. 3-1
3.2 Snow Pack and Vegetation ................................................................................................... 3-3
3.3 Soil Data ............................................................................................................................... 3-3
3.3.1 Upper and Middle Cover Sections ............................................................................. 3-3 3.3.2 Lower Cover Section .................................................................................................. 3-5
..
4 . HYDROLOGIC ANALYSIS .......................................................................................................... 4-1
4.1
4.2
4.3
4.4
4.5
Surface Water Run.off .......................................................................................................... 4-1
Upper Cover Section Break Through ................................................................................... 4-2
Infiltration Due To Biological Intrusion ............................................................................... 4-3
Lateral Drainage ................................................................................................................... 4-5
4.4.1 Dupuit Analytical Method .......................................................................................... 4-5 4.4.2 SEEP/W Finite Element Method ................................................................................ 4-6
Percolation at Base of Cover ................................................................................................ 4-8
4.5.1 HELP Analysis ........................................................................................................... 4-8 4.5.2 Two-Dimensional SEEP/W Verification Analysis .................................................... 4-9 4.5.3 Percolation Due to a Depression in the SBL .............................................................. 4-9
5 . SENSITIVITY ANALYSES ........................................................................................................... 5-1
5.1 Thickness Sensitivity of Water Storage Layer ...................................................................... 5-1
5.2 Precipitation Sensitivity ........................................................................................................ 5-1
. . 5.3 Evaporation Sensitivity ......................................................................................................... 5-2
5.4 Lateral Drainage and SBL Percolation Sensitivity Analysis ................................................ 5-3
6 . RESULTS ....................................................................................................................................... 6-1
V

7 .
8 . REFERENCES ................................................................................................................................ 8-1
SUMMARY AND CONCLUSIONS .............................................................................................. 7-1
Appendix A-Unsaturated Flow Computer Model SoilCover 2000
Appendix B-Climatological Data
Appendix C-Soil Data
Appendix D-Run-off, Water Storage Layer Infiltration, Bio-intrusion, and Lateral Drainage Calculation
Appendix E-Sensitivity Analysis
Appendix F-Lower Cover Section Two-Dimensional SEEPN Seepage Analysis
1.1 .
2.1 .
3.1 .
3.2 .
4.1 .
5.1 .
6.1 .
3.1 .
3.2 .
3.3 .
4.1 .
4.2 .
4.3 .
5.1 .
6.1 .
6.2 .
FIGURES
Schematic of modeled cover section ............................................................................................... 1-1
Hydrologic model geometry and location of layers ........................................................................ 2-1
INEEL annual precipitation ............................................................................................................ 3-1
........................................................................................................... Extreme precipitation events 3-2
Defect schematic ............................................................................................................................. 4-4
. . . SEEP/W sensitivity analysis results ................................................................................................ 5-4
Hydrologic model geometry and location of observation points .................................................... 6-1
TABLES
Snow pack information ................................................................................................................... 3-3
Upper section soil properties ........................................................................................................... 3-4
Lower section soil properties .......................................................................................................... 3-5
Average annual flux at base of water storage layer ......................................................................... 4-2
Lower cover section lateral drainage .............................................................................................. 4-7
Lower cover section vertical drainage ............................................................................................ 4-9
Reduction in evaporation due to long-term climate change ............................................................ 5-2
Summary of water movement from upper and middle cover sections ............................................ 6-1
Summary of water movement from base of cover .......................................................................... 6-2
vi

ACRONYMS
AMC
CERCLA
CFA
CFR
CN
EDF
EBTF
ET
ICDF
IDAPA
INEEL
Wa
NOAA
RAO
RCRA
SBL
scs swcc WGEN
antecedent moisture condition
Comprehensive Environmental Response, Compensation, and Liability Act
Central Facilities Area
Code of Federal Regulations
curve number
engineering design file
Engineered Barriers Test Facility
Evapotranspiration
INEEL CERCLA Disposal Facility
Idaho Administration Procedures Act
Idaho National Engineering and Environmental Laboratory
kilopascals
National Oceanographic and Atmospheric Administration
remedial action objectives
Resource Conservation Recovery Act
soil bentonite layer
Soil Conservation Service
soil water characteristic curve
Weather Generation Program
vii

... VI11

Hydrologic Modeling of Final Cover
1. INTRODUCTION
The INEEL CERCLA Disposal Facility (ICDF) landfill will be capped with a robust, state-of-the practice cover to minimize long-term infiltration. The cover system must meet the remedial action objectives (RAOs) to minimize infiltration and maximize run-off and protect against inadvertent intrusion for greater than 1,OOO years (DOE-ID 1999). The cover system must also meet applicable or relevant and appropriate requirements under the Idaho Administration Procedures Act (LDAPA) and Resource Conservation and Recovery Act (RCRA) Subtitle C requirements for closure of a hazardous waste landfill.
The cover system will minimize infiltration and maximize run-off by maintaining a sloped surface, storing water for latter release to the atmosphere, lateral drainage, and providing a low-permeability composite liner barrier system. Each component in the cover profile is shown in Figure 1-1.
I MGETAllON 7
I I I
Figure 1-1. Schematic of modeled cover section.
The cover can be divided by function into three main sections. Each section and its function are listed below :
0 Upper section: The upper water storage component provides water storage during wet periods for latter release into the atmosphere during dry periods.
Middle section: The biointrusion provides protection from burrowing animals and a capillary break.
0 Lower section: The lower section includes a composite liner system that has a permeability less than or equal to the permeability of the landfill bottom liner system that complies with IDAPA
1-1

Lower section: The lower section includes a composite liner system that has a permeability less than or equal to the permeability of the landfill bottom liner system that complies with IDAPA 58.01.05.008 (Code of Federal Regulation [CFR] Part 264.310). Lateral drainage can occur above the composite liner system through a high-permeability drainage material.
The 30% hydrologic modeling of the final cover study PDF-ER-279) demonstrated that the upper and middle landfill cover sections alone were effective in reducing the infiltration. Using conservative estimates of long-term base and extreme cases of climatological conditions and a flat landfill cover surface, the model predicted that 0.37 and 0.49 millimeters (mm) average annual infiltration, respectively, could occur in the long term through the upper water storage component of the cover. Since the cover will be sloped, infiltration will be further reduced due to surface water run-off. Moreover, drainage from the upper and middle sections will be intercepted by the lower landfill cover composite liner system and diverted through the lateral drainage layer.
The 60% hydrologic modeling of the final cover study (EDF-ER-279) expanded the 30% hydrologic model to include the lower section of the cover and the two-dimensional (e.g., vertical and lateral) drainage paths to determine the ultimate long-term percolation from the base of the soil bentonite liner (SBL) (i.e., compacted clay) and into the waste mass. It also determined the increase in infiltration due to cover defects (e.g., burrowing animals and silt migration clogging drain layers). Lastly, it evaluated the sensitivity of the upper landfill cover section to optimize the water storage layer thickness and provide an upper bound of precipitation to determine the effectiveness of the upper section for storing large volumes of water without break through into the underlying cover sections. Using the same conservative estimates of long-term base and extreme cases of climatological conditions, 0.1 mm average annual percolation was predicted from the base of the SBL and into the waste. The remainder of the infiltration from the upper componen! of the cover would drain from the lateral drainage layer overlying the SBL.
This 90% hydrologic modeling of the final cover study further expanded the hydrologic model to include two-dimensional finite element modeling to verify the twoSdimensional flow in the lower cover section. Infiltration from the upper component of the cover was used to define a range of steady-state inflows that were used as input into the two-dimensional finite element seepage model. This seepage modeling determined what amount of the vertical seepage from the upper cover component would become lateral and vertical flow in the lower cover component and what amount would seep through the SBL.
1-2

2. METHODS
Methods used for hydrologic modeling include a combination of an unsaturated flow models and analytical solutions. One-dimensional flow through the upper cover component was determined using the unsaturated hydrologic model SoilCover 2000, Version 5, developed by the University of Saskatchewan (Geo-Analysis 2000). Surface water run-off from the sloped cover surface was determined using the curve number method developed by the U.S. Soil Conservation Service (SCS) (Soil Conservation Service 1972). Lateral drainage was determined using Dupuit unconfined groundwater flow equations (Fetter 1994). Percolation through the base of the SBL was based on the ratio of lateral drainage and SBL percolation determined in published studies. This ratio of lateral and vertical drainage of the lower cover component was further verified using the two-dimensional finite element model SEEP/W, Version 4 developed by Geo-Slope International, Ltd.
Figure 2-1 shows the overall cover system model configuration. The arrows in Figure 2-1 represent the layers that were evaluated to determine the ultimate percolation from the base of the SBL, Point F. The layers are represented by observation points and are referenced throughout this engineering design file (EDF) to provide a point of reference for the analyses. Each point is described below:
Point A Precipitation on the cover surface
Point B: Evapotranspiration (ET) from the cover surface
Point C: Surface water run-off from the cover surface
0 Point D: Break through from the base of the water storage layer
Point E: Lateral drainage
0 Point F Percolation from the base of the SBL.
Note: Percolation was determined at the base of the layer across the cover not at a specific point.
~ ++ E r
Surface Water Run-Off 0 Precipitation 0 Sutface Water R u n m
Figure 2-1. Hydrologic model geometry and location of layers.
2- 1

For purposes of the analyses, it was assumed that the flexible membrane liner and other synthetic materials overlying the SBL deteriorate in the long term, leaving only the earthen materials in the cover to reduce infiltration. The results from the analytical solutions and unsaturated flow model were also combined on a daily basis and reported as an average annual value. A detailed description of the unsaturated flow computer program SoilCover 2000 and the description of the model geometry are provided in Appendix A. A detailed description of the two-dimensional finite element seepage modeling completed using SEEP/W is presented in Appendix F.
2-2

3. INPUTDATA
3.1 Climatological Data
The ICDF landfill cover will be subjected to long-term climatological conditions, including the following:
Ambient air temperature
Net radiation
Relative humidity
Wind
Precipitation.
Selection of representative conservative weather data sets to be used for the overall hydrologic model was based on annual precipitation. The 30 and 60% hydrologic modeling of the final cover studies evaluated two climate scenarios that included a 10-year period having the conditions that most likely would break through the upper section at Point D shown in Figure 2-1 and an extreme condition to address potential long-term climate changes. The extreme condition included back-to-back years that had precipitation amounts greater than the 90th percentile. Figure 3-1 shows the period of climate data and the selected 10-year base case period. The 10-year period selected was from October 1, 1967, through September 30, 1976, with an average annual precipitation of 237 mm. This period provides the most likely chance of cover break through from the upper section since the 10-year average annual precipitation (237 mm) is greater than the average annual precipitation (218 mm) for the period of record. Moreover, the selected 10-year period includes higher-than-normal precipitation events during the initial years that “load” the water storage cover layer with moisture, allowing the model to simulate the cover’s recovery capability after large precipitation events.
INEEL Annual Precipitation
-Annual Preapltalwn - 10 Year Moving Average Overall Average ^ - -
1955 1959 1963 1967 1971 1975 1979 1983 1987 1991 1995 1999
Y-r
Figure 3-1. INEEL annual precipitation.
3-1

Figure 3-2 shows the years selected for the extreme scenario. The 90th percentile for the period of record was 306 mm per year. As shown, the years with precipitation greater than the 90th percentile were 1957, 1963, 1964, 1968, and 1995. These years, back-to-back (with the exception of 1968, which was included in the average climatic scenario), were used to determine break through from the upper section for long-term, worst-case climate conditions.
963 Years With Precipitation Greater than 90% Used for the Extreme Scenrio
400
350
- f 300 L
.- E - - .- 5 250 E
m g -
200 e n
E 150 a m e B 100
- m
0
50
was included in the base case yearn so it was not dupibcaled in Ihe extreme case
0 1955 1959 1963 1967 1971 1975 1979 1983 1987 1991 1995 1999
Year
Figure 3-2. Extreme precipitation events.
Maximum and minimum daily temperatures for the simulated years were included in the input data sets for the unsaturated flow model, SoilCover 2000. Daily precipitation, maximum and minimum relative humidity, and wind speed data from these years were also input to the model. As a result of the lack of relative humidity data for the years simulated (only two years of data were available), monthly averages for minimum and maximum relative humidity were used in the model.
Global solar radiation data were synthetically generated using the Weather Generating Program (WGEN) computer code, which takes into account observed precipitation and temperature data (Martian 1995). These data were converted to net radiation using the method provided in the Handbook of Hydrology (Maidment 1993). The calculations and assumptions used are shown in Appendix B. This conversion required the mean daily temperature, mean daily vapor pressure, and the latitude of the site. The daily weather data used in the simulations are provided in Table 1-1 in Appendix B.
The climatological data for the extreme case was used in this study to determine the worst-case percolation through the base of the cover. Additionally, typical storms for Idaho Falls are of short duration (i.e., less than six hours) with high intensity resulting in run-off with little time for infiltration. Storm events for the hydrologic cover model were distributed over 12 hours, maximizing infiltration.
3 -2

3.2 Snow Pack and Vegetation
The winter snow pack was determined from weather information gathered at the site. Average snow pack and snow melt dates from 1970 to 2000 were used in the model. For the years modeled, the snow pack was entered as rain during the run-off period. Table 3-1, Snow Pack Information, shows the dates used for each period. The analysis assumed that all the water generated from melting snow infiltrates into the water storage layer. The annual quantities of melted water from the snow pack that are available for infiltration are included in Appendix B.
Table 3-1. Snow pack information.
Parameter Date Start of snow pack Nov. 29
Start of snow melt Jan. 30
End of snow melt Feb. 20
Parameters representative of vegetation for the site were estimated from available information. For each scenario, the growing season ran from April 15 through October 1. Vegetation on the soil cover surface was assumed to be a poor stand of grass comparable with existing IIWEL native vegetation. The hydrologic model represents the vegetative cover through the use of the leaf area index in the model and SCS curve number. The moisture limiting point and wilting point of the plants were estimated at 100 and 1,500 kilopascals (Wa), respectively, and a rooting depth for the vegetation was estimated at 0.3 1 m. The curve number was determined from tables developed by the SCS. The base curve number used was 79. This represents pasture or range land with no mechanical treatment. The land is assumed to be in poor condition, which is representative of less than 50% vegetative ground cover. The runoff from the cover system was modeled to promote infiltration. If a good stand of grass is established, it would decrease the infiltration due to increased evapotranspiration. The silt loam soil used for the cover belongs to hydrologic soil group B. The antecedent moisture condition (AMC) was assumed to be 11.
3.3 Soil Data
The material properties used in the hydrologic model are estimated representative materials to be used during construction (engineered materials) of the ICDF landfill cover. The actual hydraulic properties of the materials used during construction will be tested during final design of the cover to confirm that the soil properties used in the model agree with the soil properties used in construction of the cover. A description of each soil layer and properties are provided in the following subsections.
3.3.1 Upper and Middle Cover Sections
The upper and middle cover sections consist of a water storage layer, sand filters, and a biointrusion layer. The water storage layer consists of a 2-meter (m)-thick fine-grained soil (silt loam) over a capillary break consisting of 0.3 1 m of fine sand overlying 0.3 1 m of coarse sand. Its function is to provide water storage and release back to the atmosphere. The upper cover section includes sand layers that provide a capillary break and are graded to prevent migration of fines into the underlying layers. Soil covers employing capillary breaks have been shown to be effective in minimizing infiltration into underlying waste in arid and semi-arid regions (Khire et al. 2000). In its most simple form, this concept consists of a fine-grained soil overlying a coarser layer. The contrast in unsaturated hydraulic properties between the layers restricts water movement across the interface of the layers. Store and release covers that incorporate a capiflary break are designed to release the moisture retained in the upper, fine-grained layer through evaporative processes.
3-3

The following soil properties were determined for the water storage layer and underlying sand layers:
0 Porosity
0 Specific gravity
0 Saturated hydraulic conductivity
0 Coefficient of volume change
0 Soil water characteristics curve
Relative conductivity function (unsaturated hydraulic conductivity)
0 Thermal conductivity function
0 Volumetric specific heat function.
SoilVision Systems Ltd. (SoilVision) provided soil hydraulic data from its database of representative soils that have been collected from educational institutes, government organizations, and private companies. These data were selected to be representative of the soil water characteristic curve (SWCC), saturated conductivity, and porosity for a silt-loam (cover soil) and a fine and coarse sand (capillary break material) of the soils locally available at INEEL or could be engineered from local available soils. For the silt-loam SWCC, soil number 10825 was selected as a representative average of the 23 different sift-loam soils provided by SoilVision. SoilVision soil numbers 12463 and 11062 for the fine and coarse sand layers, respectively, were selected from the data set to provide a good capillary break with the silt-loam. SoilVision provided the saturated hydraulic conductivity for each of the soil numbers selected. The soils data and SWCC of the selected soil numbers are provided in Appendix C.
The middle landfill cover section consists of a layer of cobbles to prevent burrowing animals from penetrating the lower section of the cover and waste materials. The properties for the cobbles were provided by Geo-Analysis 2000, the developers of SoilCover. Porosity values of a variety of similar materials ranging in USCS classification from GW to GP are presented in Appendix C. Table 3-2, Soil Properties, shows the properties for each material used in the simulation.
Table 3-2. Upper section soil properties.
Parameter Silt Loam Fine Sand Coarse Sand Cobbles Porosity (%) 44.1 38.7 26.5 26.5 Specific gravity 2.65 2.63 2.65 2.65
(cdsec) Saturated hydraulic conductivity 5 x 2 x 1 x 1 x 10.'
The relative permeability, thermal conductivity, and the volumetric-specific heat functions were estimated using the functions included in SoilCover. The SWCCs and unsaturated permeability curves for each soil are shown in Appendix C.
3-4

3.3.2 Lower Cover Section
The lower cover section consists of a 60-cm-thick layer of drainage sand underlain by a flexible membrane liner (e.g., highdensity polyethylene [HDPE] liner) and low-permeability SBL in accordance with RCRA Subtitle C requirements. Only the earthen-type materials were included in the hydrologic model. The SBL will have a slightly lower permeability than the SBL used in the bottom liner system of the ICDF landfill, so it was assumed to have a maximum saturated hydraulic conductivity of 1 x lo-’ cdsec. The cap barrier materials will be selected many years in the future and will be required to meet this minimum hydraulic conductivity. A new test pad will be required for the cover SBL to demonstrate through Boutwell tests or other large scale permeability tests that the material will meet this minimum hydraulic conductivity.
Geo-Slope International, Ltd. provided SWCCs from its database of representative soils that have been collected from educational institutes, government organizations, and private companies. These data were selected to be representative of the SWCC, saturated conductivity, and porosity for the lateral drainage layers overlying the SBL and the SBL itself. These types of soils are locally available at INEEL or could be engineered from local available soils. The soils data and SWCC of the lower cover section are provided in Appendix C. The porosity, specific gravity, and saturated hydraulic conductivity for each soil are provided in Table 3-3.
.
Table 3-3. Lower section soil DroDerties.
Parameter Earth Fill Siltv Fine Sand Medium Sand SBL Porosity (%) 30 45 30 34
Saturated Hydraulic 2 x 10⁻³ 5 x 2 x 10” 7 x lo-*
Specific Gravity 2.65 2.65 2.65 2.65
Conductivity (cdsec)
The silty fine and medium-grained sand used for the SEEPrW modeling are similar materials to those used for the modeling used for the upper section of the cover. The soil suction-permeability curves were modified slightly for the SEEPNV analysis to optimize the performance of the lateral drainage layer in minimizing percolation through the bottom of the SBL for the given input flux.
3 -5

4. HYDROLOGIC ANALYSIS
Two-dimensional infiltration analysis of the proposed cover was conducted to account for the additional reduction in infiltration provided by surface water run-off, and lateral drainage above the compacted SBL. The cover was assumed to be sloped at a minimum of 3% after settlement (EDF-ER-267). The analyses were conducted for both the base case and extreme scenarios as described in Section 3.1.
4.1 Surface Water Run-off
The surface water run-off component of the model is shown as Point C in Figure 2-1. Surface water run-off was calculated using the curve number method developed by the SCS. The curve number method developed by the SCS uses the equation (1) given below to determine the daily run-off.
( P -0.2sy P + 0.8s Q =
Where
Q = storm run-off in in.
P = storm rainfall in in.
S = potential maximum retention in in.
1000 CN -- - -
CN = curve number.
The curve number is based on soil type, land use, and AMC for the ground surface. The higher the curve number, the greater the run-off. The curve number was determined from tables developed by the SCS. The base curve number used was 79 as described in Section 3.2.
This base curve number was adjusted for the slope of the cover using the method utilized by the HELP model (EPA 1994). This method adjusts the curve number based on the slope of the surface and the length of the slope using the equation (2) below.
cN -0.8 1
CN, = l o o - ( l o o - c N ~ ~ )
Where
CN, = adjusted curve number
CN = base curve number
L* = standardized dimensionless length (US00 ft)
4- 1

S* = standardized dimensionless slope (U0.04).
By the SCS curve number equation, a storm event must exceed a certain amount of precipitation before run-off will begin. This initial abstraction is estimated using the equation (3):
I* = 0.2 s (3)
Where
I, = initial abstraction in in.
S = potential maximum retention in in.
Total run-off during the base case simulation period was calculated using the SCS method as 1.3 mm per year, which represents approximately 0.6% of the total annual precipitation. The run-off for the extreme case simulation was 3.33 mm per year, which is approximately 1% of the total annual precipitation. To account for the run-off in the hydrologic model, the daily precipitation values were adjusted by subtracting the run-off from the recorded precipitation. The observation point location in the model for run-off is shown at Point C in Figure 2-1. The run-off and resulting adjusted precipitation values are provided in Table D-2 and D-3 in Appendix D for the base and extreme climate scenarios, respectively.
4.2 Upper Cover Section Break Through
The upper cover section break through is shown as Point D in Figure 2-1. The one-dimensional hydrologic model SoilCover 2000 was used to determine the daily flux at the base of the water storage cover layer. SoilCover is a onedimensional, finiteelement package that models transient flow and energy conditions within a soil section. The model uses physically based methods for predicting the exchange of water and energy between the atmosphere and a soil surface and movement of water within a soil profile. The theory is based on the well-known principles of Darcy’s and Fick’s Laws, which describe the flow of liquid and vapor, and Fourier’s Law, which describes conductive heat flow in the soil profile below the soil-atmosphere boundary. SoilCover predicts the evaporative flux from a saturated or an unsaturated soil surface on the basis of site-specific atmospheric conditions, vegetative cover, and soil properties and conditions. A detailed description of SoilCover is provided in Appendix A.
The adjusted precipitation described in Section 4.1 was input into the SoilCover 2000 computer program, along with the other climatological and soil properties described in Section 3. The SoilCover 2000 computer program approximates run-off using a method that includes a small inherent error. Precipitation events that created run-off by the computer program were extended to eliminate run-off. Run-off amounts were calculated as described in Section 4.1.
The average annual infiltration at Point D (located at the base of the water storage layer shown in Figure 2-1) for the base and extreme climatic scenario with the adjusted precipitation is given in Table 4. I .
Table 4-1. Average annual flux at base of water storage layer.
Base Climatic Scenario Extreme Climatic Scenario Adjusted precipitation (&year) 236 335 Evapotranspiration ( d y e a r ) 235 334
Infiltration at base of water storage 0.40 0.46 layer (mdyear)
4-2

The break through flux at the base of the water storage layer is assumed to be the same near the crest of the cover as at the downslope regions. A higher flux at the downslope region and a lower flux at the upslope region could occur due to lateral movement of moisture along the interface between the water storage layer and underlying gravel layers. The same effect could occur on the surface of the cover. A regulatory concern is that lateral movement will create an overall increase in the downward break through flux from the water storage layer.
Two-dimensional modeling studies and field tests have been performed (Morris and Stormont 2000) to evaluate the lateral movement of moisture in sloping ET cover systems. The modeling and field tests show a trend in increasing break through in the downslope direction when the cover is near saturated conditions. There is little increase in the downslope condition when the moisture content is below saturation. Very little run-off (less than 1% of the average annual precipitation) was determined in Section 4.1; therefore, downslope effects will be minimal due to surface run-off. Based on this analysis, neither lateral movement nor surface run-off will increase the overall percolation from the base of the water storage layer.
The daily infiltration amounts are provided in Tables D-2 and D-3 in Appendix D for the base and extreme climate scenarios, respectively. The computer model simulation summary sheets using the adjusted precipitation are also included at the end of Appendix D.
4.3 Infiltration Due To Biological Intrusion
Studies performed at INEEL and the Hanford facility have shown that small mammals can burrow into the cover and in some cases potentially deep enough to reach waste materials. Waste can be transported upward and holes left behind can increase infiltration into the cover. Observed burrow depths based on biointrusion studies were 1.47 m for pocket gophers, 1.40 m for pocket mice, and 1.14 m for the Townsend ground squirrel. A report cited in the Handford study indicates that the Great basin pocket mouse can burrow as deep as 1.93 m (CH2M HILL 2002). Biobarrier demonstration plots at INEEL showed that 1- to 2-in. size cobbles were effective in preventing animals from burrowing to underlying soil layers (Laundre 1996).
Of the animals that may introduce penetrating burrows to engineered soil structures such as the ICDF final cover, mammals such as badgers (Taxidea t a u s ) and coyotes (Canis latrans) may produce the largest diameter burrows. These animals, however, are not likely to present dense populations on a structure such as the ICDF cover. Badgers tend to be solitary and excavated coyote dens tend to not be closely spaced. Both badgers and coyotes may create substantial excavations when hunting for smaller mammalian prey (Audubon Society 1992).
Small mammals such as the Great Basin pocket mouse (Perognathus pumus) and the Northern pocket gopher (Thornornys tulpoides) are expected to be common residents of the INEEL and may be expected, over time, to establish residence within disturbed areas of the ICDF Complex (Audubon Society 1992). An in-depth review was conducted to identify studies that quantify burrow attributes for species that may inhabit buried waste sites at the INEEL (Hampton 2001). Studies conducted at the INEEL and at DOE’S Hanford Site in Washington State confirmed the presence of both species on, and near, retired waste sites. One study reported a pocket mouse burrow frequency of 2.9 burrows per 100 meters (m) along study transects. Pocket gopher burrows were observed at a frequency of 1.9 borrows per 100 m along the same transects (Smallwood 1996). The same study also reported observation of harvester ant colonies at a frequency of 1.2 colonies per 100 m. Another study of a pocket gopher population on a retired waste site at Hanford reported an average gopher density of 25.3 gophers per hectare over a two- year study (Hedlund and Rogers 1976).
4-3

The characteristics and habits of common burrowing animals indicate that the potential exists for such animals to populate an unmaintained engineered soil structure. In addition, the nature of the burrows produced by these populations could possibly increase water infiltration through the ICDF final cover to an unacceptable rate. Control (Le., eviction and/or eradication) of burrowing animals should be incorporated as an essential element of operation and maintenance activities for the ICDF after closure.
The increase in infiltration through the upper section water storage layer from a burrow was determined assuming a mammal left a hole that could be flooded during precipitation events. It was assumed that the animal created one hole in the cover with a diameter of 20 cm that went through the upper section of the cover to the bio-intrusion layer. This hole drained an area 10 times the diameter of the hole, 200 cm. All precipitation contacting this area was added to the infiltration at Point D of Figure 2.1 as determined from the SoilCover model. A schematic of the defect is shown in Figure 4-1.
200 cm
Drainage Area
Figure 4-1. Defect schematic.
The area drained by the burrow is given by the equation (4):
n ( D H ~ 1 0 ) ~ 4
A, = (4)
Where
AD = area drained by the burrow
DH = diameter of the burrow
The volume of precipitation infiltrating to the waste assuming the animal completely penetrates the upper water storage layer is given by the equation (5) :
V , = P X A,
4-4

V, = P x A ,
Where
VI = volume of infiltration
P = annual precipitation.
The volume of precipitation infiltrating to the waste assuming the animal partially penetrates the upper water storage layer is given by the equation (6):
VI(^^^^,) = VI x Borrow DeptWCover Thickness
Where
VI(partial) = volume of infiltration for a burrow that partially penetrates water storage layer
Burrow Depth = average burrow depth of pocket gophers, mice, Townsend ground squirrel and the Great Basin pocket mouse
Cover Thickness = Cover thickness used in model (note, does not include additional thickness for erosion).
The annual infiltration per unit area of the landfill is given by the equation (7):
Where
Iayg = average annual infiltration
A = the area of the landfill.
The infiltration through the water storage layer resulting from one hole through the upper portion of the cover was computed as 0.01 &year for the base case and 0.02 &year for the extreme case. The infiltration through the water storage layer due to a hole that partially penetrates the upper portion of the cover was computed as 0.005 d y e a r for the base case and 0.01 &year for the extreme case. The infiltration at Point D shown in Figure 2-1 through the water storage layer due to animal burrows was 0.015 &year and 0.03 &year for the base and extreme cases, respectively.
Considering the burrow density of the pocket mouse, the additional infiltration through the water storage layer would only be 0.16 d y r . The pocket mouse density of 2.9 burrows per 100 m would produce a total number of burrow holes on the landfill of approximately 16. Based on an infiltration through each burrow hole of 0.01 &yr, the total additional infiltration through the water storage layer would be 0.16 d y r , which would provide a total infiltration rate of 0.62 d y r through the water storage layer. This infiltration rate is less than the infiltration rate required to produce total breakthrough at the bottom of the clay barrier of 0.1 &yr.
4-5
Where
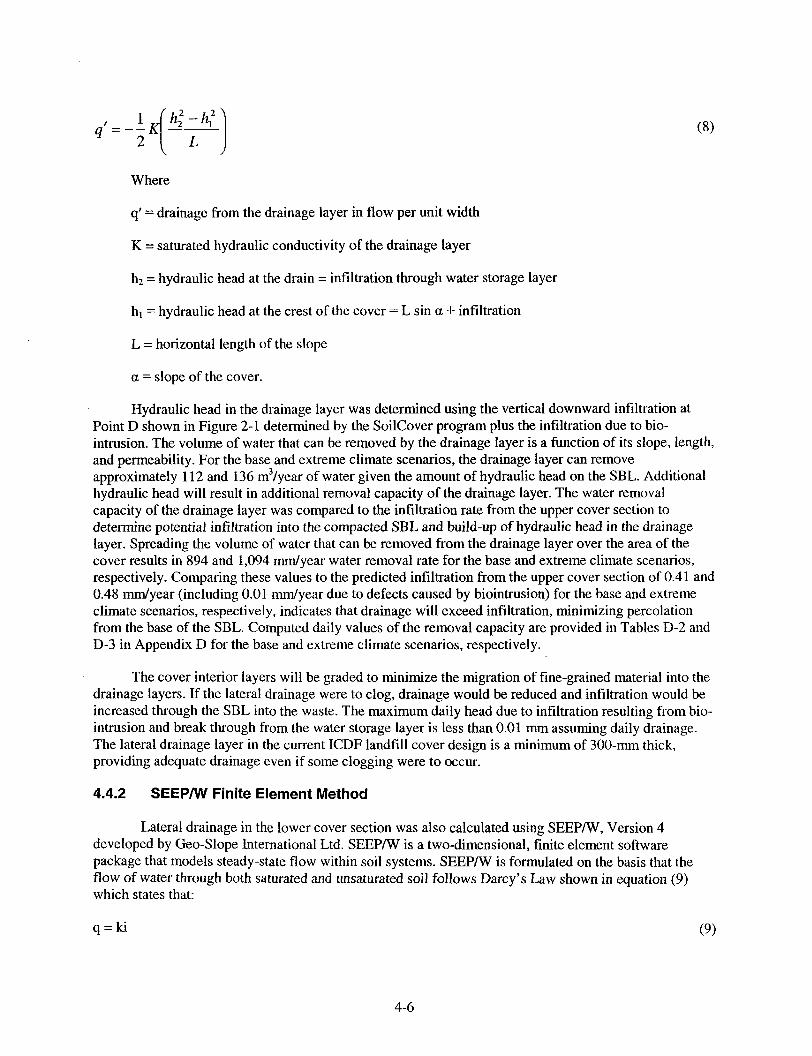
q' = drainage from the drainage .Jyer in flow per unit width
K = saturated hydraulic conductivity of the drainage layer
hz = hydraulic head at the drain = infiltration through water storage layer
hl = hydraulic head at the crest of the cover = L sin a f infiltration
L = horizontal length of the slope
a = slope of the cover.
Hydraulic head in the drainage layer was determined using the vertical downward infiltration at Point D shown in Figure 2-1 determined by the SoilCover program plus the infiltration due to bio- intrusion. The volume of water that can be removed by the drainage layer is a function of its slope, length, and permeability. For the base and extreme climate scenarios, the drainage layer can remove approximately 112 and 136 m3/year of water given the amount of hydraulic head on the SBL. Additional hydraulic head will result in additional removal capacity of the drainage layer. The water removal capacity of the drainage layer was compared to the infiltration rate from the upper cover section to determine potential infiltration into the compacted SBL and build-up of hydraulic head in the drainage layer. Spreading the volume of water that can be removed from the drainage layer over the area of the cover results in 894 and 1,094 d y e a r water removal rate for the base and extreme climate scenarios, respectively. Comparing these values to the predicted infiltration from the upper cover section of 0.41 and 0.48 d y e a r (including 0.01 d y e a r due to defects caused by biointrusion) for the base and extreme climate scenarios, respectively, indicates that drainage will exceed infiltration, minimizing percolation from the base of the SBL. Computed daily values of the removal capacity are provided in Tables D-2 and D-3 in Appendix D for the base and extreme climate scenarios, respectively.
The cover interior layers will be graded to minimize the migration of fine-grained material into the drainage layers. If the lateral drainage were to clog, drainage would be reduced and infiltration would be increased through the SBL into the waste. The maximum daily head due to infiltration resulting from bio- intrusion and break through from the water storage layer is less than 0.01 mm assuming daily drainage. The lateral drainage layer in the current ICDF landfill cover design is a minimum of 300-mm thick, providing adequate drainage even if some clogging were to occur.
4.4.2 SEEPMl Finite Element Method
Lateral drainage in the lower cover section was also calculated using SEEP/W, Version 4 developed by Geo-Slope International Ltd. SEEP/W is a two-dimensional, finite element software package that models steady-state flow within soil systems. SEEP/W is formulated on the basis that the flow of water through both saturated and unsaturated soil follows Darcy's Law shown in equation (9) which states that:
q = k i
4-6
(9)
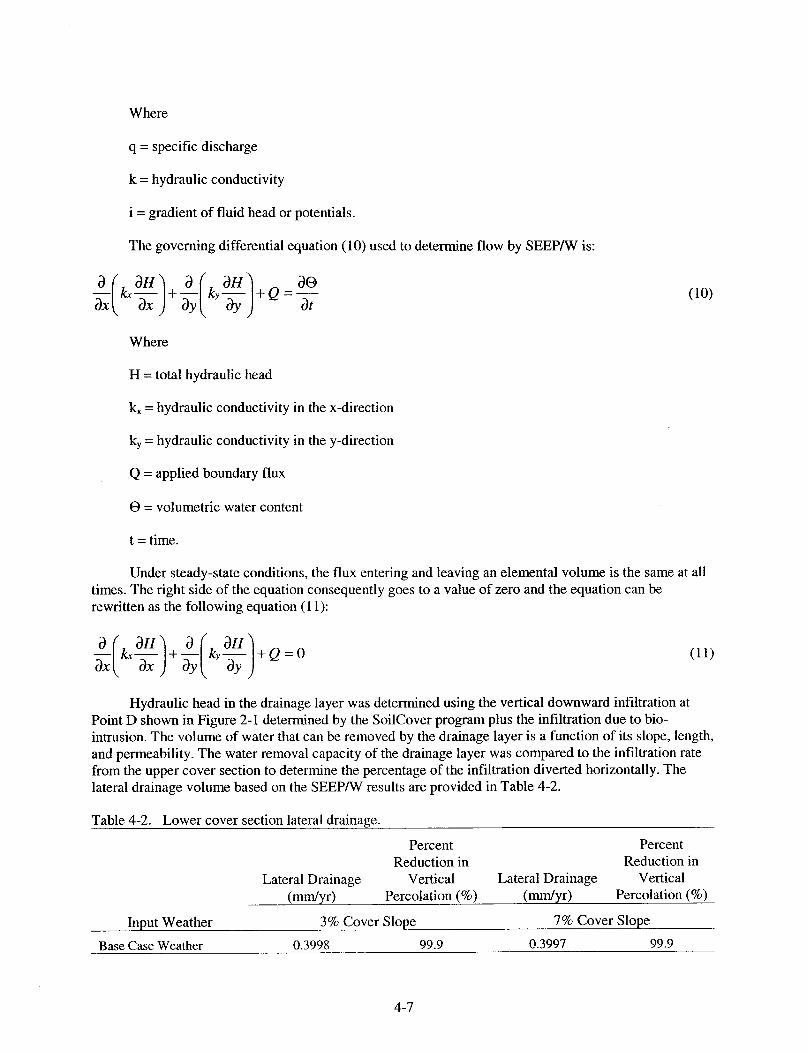
Where
q = specific discharge
k = hydraulic conductivity
i = gradient of fluid head or potentials.
The governing differential equation (10) used to determine flow by SEEP/W is:
ao
Where
H = total hydraulic head
k, = hydraulic conductivity in the x-direction
ky = hydraulic conductivity in the y-direction
Q = applied boundary flux
0 = volumetric water content
t = time.
Under steady-state conditions, the flux entering and leaving an elemental volume is the same at all times. The right side of the equation consequently goes to a value of zero and the equation can be rewritten as the following equation (1 1):
Hydraulic head in the drainage layer was determined using the vertical downward infiltration at Point D shown in Figure 2-1 determined by the SoilCover program plus the infiltration due to bio- intrusion. The volume of water that can be removed by the drainage layer is a function of its slope, length, and permeability. The water removal capacity of the drainage layer was compared to the infiltration rate from the upper cover section to determine the percentage of the infiltration diverted horizontally. The lateral drainage volume based on the SEEPrW results are provided in Table 4-2.
Table 4-2. Lower cover section lateral drainage.
Percent Percent Reduction in Reduction in
Lateral Drainage Vertical Lateral Drainage Vertical Percolation (%) 9 ( W Y r) (d 1)
Input Weather 3% Cover Slope 7% Cover Slope
Base Case Weather 0.3998 99.9 @.3997 99.9
4-7

Extreme Case Weather 0.4597 99.4 0.4596 99.9
A detailed description of the SEEPN modeling completed to determine lateral drainage is presented in Appendix F.
4.5 Percolation at Base of Cover
4.5.1 HELP Analysis
The percolation at the base of the cover in the lower cover section of the model is shown as Point F in Figure 2-1. Infiltration at this point can enter the waste mass, potentially generating leachate and migration of contaminants in the waste.
More than 99.9% of the infiltration is reduced by the upper section of the cover. The lateral drainage and other porous layers in the middle and lower section of the cover will further reduce the remaining 0.1 percentage of infiltration to near zero. The small remaining fraction could infiltrate through leaks in the geomembrane and through the low-permeability compacted SBL in the short term. In the long term, the geomembrane may degrade, allowing infiltration directly through the low-permeability SBL.
Hydrologic simulations of landfill bottom liner systems using EPA’s HELP model have been performed by researchers to determine the effectiveness of bottom liner systems. Correlations between infiltration and percolation through landfill liner systems were developed to determine the minimum saturated permeability requirement of I x the percentage of infiltration that results in percolation at the base of the liner system. For a low- permeability SBL (e.g., without a geomembrane), a maximum 20% of the infiltration resulted in percolation through the SBL. The remaining 80% resulted in lateral drainage (Peyton and Schroeder 1990). Applying this relationship for the ICDF landfill cover provides a conservative estimate of percolation from the base of the SBL. The percolation at Point F shown in Figure 2-1 is shown in the equation (12):
cdsec. These correlations also provide good estimates of
Q = Water Storage Layer Flux x 20%/100
Where
Water Storage Layer Flux = 0.4 1 &year for the base climate scenario and 0.48 for the extreme climate scenario including infiltration due to cover defects
Qbase = 0.41 &year x 0.20 = 0.08 - 0. I &year
and,
Qext = 0.48 d y e a r x 0.20 = 0.09 - 0.1 &year
therefore,
Q = 0.1 &year of percolation from the base of the SBL.
4-8

so,
Qbase = 0.41 &year x 0.20 = 0.08 - 0.1 &year
and,
Qext = 0.48 &year x 0.20 = 0.09 - 0.1 &year
therefore,
Q = 0.1 &year of percolation from the base of the SBL.
Based on the above analysis, an average annual percolation rate of 0.1 &year is estimated to drain from the base of the ICDF landfill cover and contact the underlying waste mass. Although a small value, the average annual percolation rate of 0.1 &year is conservative since it would require a near steady source of infiltrating water through the landfill cover system.
4.5.2 Two-Dimensional SEEPNV Verification Analysis
Two-dimensional finite element modeling was completed using SEEP/W to determine the percolation at the base of the lower cover section shown as Point F in Figure 2-1. Steady-state simulations were performed using three inflow rates into the drainage layer in the range of the vertical downward infiltration at Point D shown in Figure 2-1 determined by the SoilCover program plus the infiltration due to bio-intrusion. The volume of water exiting the based of the compacted SBL is a function of its slope, length, and permeability. The amount of water exiting the base of the compacted SBL was compared to the infiltration rate from the upper cover section to determine the percentage of the infiltration travelling vertically through the SBL base. Comparing these values to the predicted infiltration from the upper cover section of 0.40 and 0.46 &year, the percolation from the SBL is provided in Table 4-3.
Table 4-3. Lower cover section vertical drainage.
3% Slope 7% Slope
Percent SBL Percolation Percent SBL Percolation Input Weather (&year) Reduction (&year) Reduction
Base Case Weather 0.0002 99.9% 0.0003 99.9%
Extreme Case Weather 0.0003 99.9% 0.0003 99.9%
A detailed description of the SEEP/W modeling completed to determine seepage at the base of the SBL is presented in Appendix F.
Based on the SEEP/W modeling, the SBL can reduce the unsaturated inflow by 99.9%. The 20% reduction in percolation estimated in Section 4.5.1 using the HELP studies is approximately an order of magnitude higher, thereby simulating a conservatively larger volume of water to percolate through the SBL.
4.5.3 Percolation Due to a Depression in the SBL
Percolation from the base of the cover was determined due to localized settlement caused by a decaying object located in the waste near the base of the cover. The void space left behind by the
4-9

decayed object may cause a depression in the SBL allowing water to pool and infiltration through the SBL.
The object was assumed to have a volume of 1Sm3 with the dimensions of 0.9 m wide by 1.8 m long by 0.9 m wide. Once the object decayed, settlement would propagate upward at an assumed 2: 1 projection of the size of the void space. The dimensions of the depression would be 6.6 m by 5.7 m assuming that the object was buried 1.2 m below the top of the SBL. The depth of the depression was assumed to be half the thickness of the object or 0.45 rn
Assuming steady-state, saturated conditions, the infiltration of pooled water in the depression was calculated using Darcy's law equation (13).
Where
qdep = Infiltration flux at the depression
k = Permeability of the SBL
i = hydraulic gradient.
Using a permeability of 1 ~ 1 0 ' ~ cdsec for the SBL, the infiltration rate of pooled water in the depression was 55.1 mm per year. Spreading the infiltration over the entire area of the cover results in an annual percolation rate from the base of the cover of 0.03 mm per year due to the settlement caused by the decayed object.
4-10

5. SENSITIVITY ANALYSES
Sensitivity analyses were conducted to determine effects of changes in thickness of the silt loam layer, increased precipitation, and changing climatic conditions on the cover’s performance. This section specifically addresses sensitivity of the cover to the variations mentioned above. Long-term cover performance issues to which these analyses also apply are addressed in other studies including the “Landfill CompactiodSubsidence Study” (EDF-ER-267) and the “Liner and Final Cover Long-Term Performance Evaluation and Final Cover Life Cycle Expectation” (EDF-ER-28 1).
To increase computational efficiency, the sensitivity was performed using only the upper portion of the middle section of the cover system. One-dimensional unsaturated flow conditions on a flat landfill cover surface were assumed to allow use of the SoilCover computer program and analytical solutions to determine sensitivity. Observation Point D was used as the point of interest for evaluating infiltration. A summary of the sensitivity is provided below. The detailed analyses are provided in Appendix E.
5.1 Thickness Sensitivity of Water Storage Layer
Changes in thickness of the silt loam layer of the water storage section were evaluated using the base and extreme climate scenarios. The modeling methodology was the same as was used to determine the infiltration at Point D in previous models. The silt loam water storage layer thickness was varied from 0.25 to 3.5 m. The results of the computer simulations are provided in Appendix E.
At a thickness of 0.25 m, average annual infiltration was reduced to approximately 18 &year. Increasing the cover thickness to 0.5 m reduced the average annual infiltration to approximately 10 &year. A cover thickness of 1.5 m reduced infiltration to less than 2 &year. Average annual infiltration was less than 1 &year for cover thickness of 2 m and greater.
The sensitivity analysis shows clearly that increasing the water storage thickness beyond the optimal thickness does not provide added water storage. Based on the analysis, the optimal water storage layer thickness is between 1.5 and 2 m. Insignificant changes in infiltration occur for the water storage layer thickness beyond 2 m. A minimum water storage layer thickness of 2 m is recommended for the ICDF landfill cover. Additional material may be required to address erosion control and aeolian effects. A thicker water storage layer may be needed so that the minimum thickness is maintained after long-term erosion. These studies are provided in the Liner and Final Cover Long-Term Performance Evaluation and Final Cover Life Cycle Expectation (EDF-ER-28 1). The detailed computer model simulation summary sheets are provided in Appendix E.
5.2 Precipitation Sensitivity
The effect of increased precipitation on infiltration through the water storage layer of the cover was analyzed using an average year of weather and multiples of the average year’s precipitation. The weather data for the year was repeated until the soil profile reached a quasi-steady state. The year with total precipitation closest to average was 1975, which had 269 mm of precipitation including 5 1 mm of water- equivalent snowfall. The average precipitation for the period of record is 218 mm per year including 37 mm of water-equivalent snowfall. This weather set is included in the base case scenario and included in Appendix B.
The onedimensional computer was run using one, two, three, and four times the 1975 precipitation. Twenty years were modeled for each precipitation interval using two 10-year simulations. Initial conditions for the first simulation were the same as used for the base case simulation described in
5-1

Section 3. Final conditions from the first simulation were used as the initial conditions for the second simulation.
The quasi-steady state was determined by the change in the sum of the infiltration through the silt loam and the ET at the end of each year modeled. When the annual change in this sum approximated the water balance error for the model, the system was determined to be in a quasi-steady state.
Based on the analysis, the upper cover may become ineffective when exposed to an average annual precipitation of greater than 8 10 &year. This also assumes all other climate parameters remain constant. The resulting infiltration at the Point D layer is 0.17 &year at 3 times the average annual precipitation, which is less than the 0.46 &year infiltration based on the extreme climatological scenario. The four times precipitation resulted in significant breakthrough from the water storage cover. However, there was some uncertainty in the model results, as described in Appendix E.
5.3 Evaporation Sensitivity
The effect of decreased evaporation on infiltration through the water storage layer of the cover was analyzed using the Penman equation. The Penman equation determines potential evaporation from the soil surface based on temperature, net radiant energy, wind speed, and relative humidity. Changes in these climate conditions at the ICDF in the long term could potentially reduce evaporation from the surface of the cover increasing infiltration.
Evaporation is most sensitive to changes in net radiant energy. At low potential evaporation rates, the next most sensitive parameter is temperature, then wind speed, and finally relative humidity. Evaporation becomes more sensitive to relative humidity and less sensitive to temperature at higher potential evaporation rates. Average annual temperature, net radiant energy, and wind speed were reduced by a factor of three to determine the reduction in potential evaporation as worst-case long-term climate conditions. Relative humidity was increased to 75%, similar to that observed in Seattle, Washington, to determine the reduction in evaporation due to a worst-case change in climate. The average percent reductions in potential evaporation due to the climate changes are listed in Table 5-1.
Table 5-1. Reduction in evaporation due to long-term climate change.
Reduced Potential Average Percent INEEL Potential Evaporation Due to a Reduction in
Parameter (&day 1 Change ( d d a y ) Evaporation Meteorological Evaporation Long-Term Climate Potential
Temperature 3.62 3.13 14%
Net Radiant Energy 3.62 2.60 28% Wind Speed 3.62 2.67 26% Relative Humidity 3.62 2.83 22%
Based on the analysis, long-term climate changes could reduce evaporation from the cover between 14 to 28% of the potential evaporation determined from the hydrologic model. The resulting infiltration at the Point D layer would then increase between 14 and 28% from what was predicted by the hydrological model, conservatively assuming that a change in potential evaporation is directly proportional to the change in infiltration. For the base case climate scenario used in the hydrologic model, the infiltration could increase between 0.45 to 0.5 1 &year. For the extreme case climate scenario, the infiltration could increase between 0.52 to 0.60 &year.
5 -2

5.4 Lateral Drainage and SBL Percolation Sensitivity Analysis
Eight different steady-state models were run for this exercise using the SEEP/W. Four models were run with a cover slope of 3%, which is a worst-case cover slope scenario and 7%, which is the design cover slope. All the models utilized the same geometry and materials types with a range of inflow fluxes in the lateral drainage layer.
The 3% cover flux input to the top of the cover model was as follows:
0.4 d y r (0.001096 &day), the average percolation through the water storage layer based on soil cover modeling using the base case weather data
0.46 d y r (0.00126 d d a y ) , the average percolation through water storage layer based on soil cover modeling using the worst-case weather data
0.8468 d y r (0.00232 d d a y ) , an arbitrary percolation value chosen to determine the sensitivity of cover surface influx with flux through the bottom of the SBL
1 .OO d y r (0.00279 d d a y ) , an arbitrary upper bound percolation picked to determine the sensitivity of cover influx to flux through the bottom of the SBL.
The 7% cover flux input to the top of the cover model was as follows:
0.4 d y r (0.001096 d d a y ) , the average percolation through the water storage layer based on Soil Cover modeling using the base case weather data
1 .OO d y r (0.00274 d d a y ) , an arbitrary value chosen to determine the sensitivity of cover influx to flux through the bottom of the SBL
1.25 d y r (0.00342 d d a y ) , an arbitrary value chosen to determine the sensitivity of cover influx to flux through the bottom of the SBL
1.50 d y r (0.0041 1 d d a y ) , an arbitrary upper bound percolation picked to determine the sensitivity of cover influx to flux through the bottom of the SBL.
The results of these various model surface flux rates are presented in Figure 5-1.
5-3

0.30
0.25
- f o-20
b 8 6 0.15 D m
2 i-= 5 0.10
C
E
0.05
0.00 0.00 0.20 0.40 0.60 0.80 1.00 1 20 1 .a 1.60
Inflow Into Lateral Drainage Layer ( m q r )
Figure 5-1. SEEP/W sensitivity analysis results.
The graph for the 3% cover (worst-case) model output indicates that a steady influx into the lateral drainage layer of approximately 0.85 d y e a r or greater is required to obtain a percolation rate of more than 0.1 &year from the bottom of the SBL. The value of 0.1 &year is used as input into the fate and transport model.
5-4

6. RESULTS
Water movement was calculated from the cover layer represented by the observation points shown in Figure 6-1. A summary of the average annual infiltration for the upper and middle sections of the cover are provided in Table 6-1. The average annual percolation from the base of the cover is provided in Table 6-2.
Evapotranspiration
Surface Water Run- Precipitation Surface Water Run-Off
Figure 6-1. Hydrologic model geometry and location of observation points.
Table 6-1. Summary of water movement from upper and middle cover sections. -~
Base Case Extreme Case
Point Description Value Direction Value Direction A Average annual precipitation (mdyear) 237 Downward 338 Downward
A Adjusted average annual precipitationa (mdyear) 236 Downward 335 Downward
Upward C Surface run-off (mdyear) 1.33 Lateral 3.33 Lateral
D Water storage layer break through (mdyear) 0.40 Downward 0.46 Downward
D Bio-intrusionb (&year) 0.015 Downward 0.03 Downward
Influx Into Lateral Drainage Layer (&year) 0.42 Downward 0.49 Downward
a. Precipitation adjusted based on surface run-off. b. Bio-intrusion includes a hole in the water storage layer caused by a burrowing animal.
B Evapotranspiration (&year) 235 Upward 334
6- 1

Table 6-2. Summary of water movement from base of cover.
Extreme Case Base Case
Point Description Value Direction Value Direction
D Influx into lateral drainage layer (mdyear) 0.42 Downward 0.49 Downward
E Lateral drainage (&year) 0.4 1 Lateral 0.40 Lateral
F Percolation due to depression in SBL (mdyear) 0.03 Downward 0.03 Downward
F Percolation due to upper cover section influx 0.003 Downward 0.009 Downward (&year)
Total Percolation from base of cover (&year) 0.033 Downward 0.039 Downward
The values listed in Tables 6-1 and 6-2 represent average annual flow from the main components of the cover system. The flux or break through from the water storage layer represented by Point D is assumed to be the same at the crest and downslope areas. The difference between the flux at the crest and downslope portion of the cover is expected to be small, since surface run-off is small and the lateral movement of water within the water storage layer will be minimal, due to its low saturated permeability and gradual slope.
The silt loam water storage layer thickness was varied from 0.25 to 3.5 m to determine the optimum water storage layer thickness. The results of the sensitivity analysis indicate that the minimum recommended thickness of the silt loam layer is 2 m. Increasing the water storage layer thickness may provide additional protection for erosion and other aeolian effects, however it will not further reduce infiltration.
The effect of increased precipitation on infiltration through the water storage layer of the cover was analyzed using an average year of weather and repeating that weather scenario until the soil profile reached a quasi-steady state. The year with total precipitation closest to average was 1975, which had 269 mtr~ of precipitation including 5 1 mm of water equivalent snowfall. The onedimensional computer model wassimulated one, two, three, and four times the 1975 precipitation. Twenty years were modeled for each precipitation interval using two 10-year simulations to determine the quasi-steady state. Based on the analysis, the upper cover section remains effective to three times the average annual precipitation, which is 810 &year. The resulting infiltration at Point D is 0.17 mmlyear, which is less than the model output of 0.49 &year determined in Section 4.2. Precipitation of four times the average annual precipitation saturates the water storage layer rendering it ineffective for reducing infiltration.
Changes to evaporation were evaluated by reducing the average annual temperature, net radiant energy, and wind speed with an increase in humidity. Break through from the upper section of the cover could increase between 14 and 28% assuming a worst-case scenario. This could result in an increase between 0.45 to 0.5 1 &year for the base case climate scenario. For the extreme case climate scenario, the infiltration could increase between 0.52 to 0.60 d y e a r . For a cover slope of 3% (worst-case), the SEEPW model output indicates that a steady influx into the lateral drainage layer of approximately 0.85 d y e a r or greater is required to obtain a percolation rate of more than 0.1 d y e a r from the bottom of the SBL. An influx less than 0.85 &year caused by long-term climate changes will result in a percolation rate of less than 0.1 mmlyear from the bottom of the SBL.
The results of the modeling were verified using the following equation (14), from (Selker et. al):
6-2

This equation gives the vertical precipitation flux required to create breakthrough between the upper section of the cover and the Bio-intrusion Layer. Appendix E presents the calculation and assumptions used in development of parameters and application of the equation. The calculation in Appendix E shows that breakthrough should occur at a vertical precipitation flux of 63 d y r , which supports the modeling conclusion that breakthrough would occur at more than three times the recorded precipitation.
6-3

7. SUMMARY AND CONCLUSIONS
The current hydrologic landfill cover model showed that the upper and middle landfill cover sections alone for a flat surface were effective in reducing the infiltration using conservative estimates of long-term base and extreme cases of climatological conditions to less than 0.4 and 0.5 mm average annual infiltration, respectively (EDF-ER-279). The results of this study show that infiltration is further reduced by surface run-off and lateral drainage to less than 0.1 mm per year at the base of the cover system including defects in the cover.
Two climatic scenarios were used for the analyses. The base scenario consisted of a 10-year period with an average annual precipitation near the long-term average for the site. The extreme scenario included the four years with precipitation above the 90th percentile value. The weather data used were provided by INEEL and covered the years 1950 through 1994. Weather data for 1995 was supplied by NOAA from data collected at the INEEL site. The soil data used for the silt loam cover material and the fine and coarse sands of the capillary break came from Soil Vision, Ltd. and included saturated hydraulic conductivity, porosity, and a SWCC. The soil properties for the cobbles were provided by Geo-Analysis 2000 Ltd. The material properties used in the simulations are representative of materials that may be found near the site and will be used during construction of the ICDF landfill cover.
The results of the analyses indicate 0.1 &year of infiltration through the lower section of the soil cover into the waste. This is considered reasonably conservative for the reasons listed below:
All snow was assumed to melt in a 22day period each year, stressing the cover’s water storage capacity.
A poor stand of grass was assumed to simulate drought or post-fire conditions.
The daily precipitation was distributed over 12 hours increasing infiltration into the cover.
The years selected for the weather data included large precipitation events early on in the simulation to stress the recovery capacity of the cover.
An extreme case was modeled that assumed four years of back-to-back precipitation events that were above the 90th percentile based on the period of record.
Bio-intrusion does not account for increased evaporation from lower depths of the soil resulting from increased air circulation or for evaporation and dispersion resulting from precipitation moving through the soil.
The 20% of the break through that percolates from the base of the SBL is an order of magnitude higher than two-dimensional modeling results using SEEPN.
The two-dimensional modeling was based on a steady-state inflow versus less conservative transient conditions.
The sensitivity results show that the cover will perform as modeled for precipitation up to three times the annual average. Increasing the water storage layer thicknzss greater than 2 m results in minimal improvement in hydraulic performance. Extreme changes in temperature, net solar radiation, wind speed, and humidity could increase influx into the lateral drainage layer, resulting in a percolation from the base of the SBL of less than 0.1 &year.
7- 1

The results presented for infiltration through the ICDF landfill cover are consistent with results from other studies of comparable cover systems under similar climatic conditions. Previous studies have been conducted to evaluate the moisture movement in engineered barriers at the INEEL (Magnuson 1993). One of the barriers evaluated by Magnuson included a 1.5-m soil cover over a gravel (0.15 m) and cobble (0.76 m) capillary break. This cover design is similar to that proposed for the ICDF landfill, in that it was designed as a store and release cover over a capillary break. Simulations indicated that drainage through the upper soil layer for this cover was extremely low, on the order of the mass balance error of the simulations (Magnuson 1993). Drainage through the soil layer was believed to be associated with drainage of the initial moisture in the profile.
Engineered barriers of two designs are being tested at the Engineered Barriers Test Facility (EBTF) at INEEL. The first design consists of a thick, vegetated soil cover. The second design incorporates a capillaryhio-barrier within the soil cover. Each test plot is instrumented to monitor soil-water movement within the barrier profile. Wetting tests were designed to stress the test plots to conditions that resulted in drainage and to monitor the recovery of the systems under ambient conditions. Results from these studies are reported in Porro and Keck (1998) and Porro (2000).
Recovery of the capillary barrier to break through from infiltration was evaluated by Porro (2000). The capillary barrier was similar in design to that evaluated in the simulations conducted by Magnuson (1993) (i.e., a 1.45 m silt loam soil over 0.15 m gravel and 0.76 m cobble). Neither test plot (thick soil or soil with a capillary break) produced drainage as a result of exposure to ambient conditions, however the internal distribution of water within the plots indicated that the capillary barrier was more effective in limiting the downward movement of water. Both test plots were irrigated to induce break through in 1997. As a result, infiltration of melting snow the following spring produced drainage in all plots. The drainage through the capillary barrier was less in total volume than drainage from the thick soil cover. Evaporation alone (without transpiration) was sufficient to restore the functioning capacity of the capillary barrier within two years following the intentionally induced break through events. These results are consistent with studies conducted by Anderson et al. (1997) as part of the Protective CaplBiobarrier Experiment at the INEEL Experimental Field Station, which indicated that ambient precipitation and supplemental irrigation treatments did not produce drainage through 2 m soil profiles.
Capillary barriers have also been evaluated at other sites for inclusion in landfill cover systems, especially for sites in the western United States where potential evaporation tends to exceed precipitation. At the DOE Hanford Site, a field-scale prototype surface barrier was constructed in 1994 over an existing waste site (Gee et al. 1997). This barrier was subjected to three times the annual average precipitation for two consecutive years including one storm event representing the 1,000-year return storm, which was applied in March when soil-water storage was at a maximum. The 2.0 m silt-loam soil cover has not drained in response to these stresses. Capillary barriers have also been evaluated using computer simulations for climatic conditions indicative of the arid western U.S. (i.e., Salt Lake City, Utah, and Albuquerque, New Mexico). These studies have found that the barriers are effective in producing no drainage during 10-year simulations that included a 5-year period with the highest recorded precipitation rates (Moms and Stormont 1997).
Based on the results from the simulations reported in this EDF for the ICDF landfill cover, results from experimental studies at the INEEL, and experimental and modeling results from other sites in the western U.S., it is believed that the cover design proposed for the ICDF landfill represents a state-of-the- practice design for a landfill cover that minimizes infiltration into the waste. Any leakage that occurs through the cover due to defects are extreme changes in climate is likely to be intercepted by the lateral drainage layers at the base of the cover. A conservative estimate of 0.1 &year of percolation from the base of the cover was determined based on the estimated break through from the upper section of the cover. Based on the results reported in this EDF, it is believed that the cover design, which incorporates a
7-2

store and release soil cover underlain by a capillary break and composite liner system, represents the best technology for minimizing infiltration into the landfill given site-specific climatic conditions.
7-3

8. REFERENCES
40 CFR 264, “Standards for Owners and Operators of Hazardous Waste Treatment, Storage, and Disposal Facilities,” Section 3 10, “Closure and post-closure care,” Code of Federal Regulations, Office of the Federal Register, July 1, 1999.
Anderson, Jay, Teresa Ratzlaff, Eric Duffin, and Micha Miller, 1997, Comparison of Four Protective Cap Designs for Burial of Hazardous Waste at the Idaho National Engineering and Environmental Laboratory, Environmental Science and Research Foundation, Annual Technical Report Calendar Year 1996, Environmental Science and Research Foundation, Idaho Falls, Idaho.
Audubon Society, 1992, The Audubon Society Field Guide to North American Mammals, Alfred A. Knopf, New York, New York, 1992.
CH2M HILL, 2002, Hanford Biological Intrusion Questions for CapIBarrier Alternative Formulation and Analysis, Unpublished study provided by CH2M HILL, Hanford.
DOE-ID, 1999, Final Record of Decision, Idaho Nuclear Technology and Engineering Center, Operable Unit 3-1 3, DOEAD- 10660, Rev. 0, Department of Energy Idaho Operations Office, Idaho Falls, Idaho, U.S. Environmental Protection Agency Region 10, and State of Idaho Department of Health and We 1 fare.
EDF-ER-267,20@2, “Landfill Compaction Subsidence Study,” Rev. 1, Environmental Restoration Program, Idaho National Engineering and Environmental Laboratory, May 2002.
EDF-ER-279,2@02, “Hydrologic Modeling of Final Cover,” Rev. 2, Environmental Restoration Program, Idaho National Engineering and Environmental Laboratory, May 2002.
EDF-ER-28 1,2002, “Liner and Final Cover Long-Term Performance Evaluation and Final Cover Life Cycle Expectation,” Rev. 1, Environmental Restoration Program, Idaho National Engineering and Environmental Laboratory, May 2002.
EPA, 1994, Final Draft RCRA Subtitle D (258) Seismic Design Guidance for Municipal Solid Waste Landfill Facilities, U.S. Environmental Protection Agency, Risk Reduction Engineering Laboratory, Cincinnati, Ohio.
Fetter, C.W., 1994, Applied Hydrogeology, Macmillan College Publishing Company, Inc., New York, New York.
Fredlund, D.G. and A. Xing, 1994, “Equation for the Soil-Water Characteristic Curve,” Canadian Geotechnical Journal, Vol. 31, pp. 521-532.
Fredlund, D.G., Xing, A., and S. Huang, 1994, “Predicting the Permeability Function for Unsaturated Soils Using the Soil-Water Characteristic Curve,” Canadian Geotechnical Journal, Vol. 3 1, pp. 533-546.
Gee G.W., A.L. Ward, and M.J. Fayer, 1997, “Surface Barrier Research at the Hanford Site,” Proceedings of the International Containment Technology Conference and Exhibition, February 9- 12, 1997, St. Petersburg, Florida.
8- I

Geo-Analysis 2000 Ltd., 2000, “SoilCover User’s Manual,” 202 Kerr Rd., Saskatoon, Saskatchewan, Canada.
Hampton, N.L., 2001, Biological Data to Support Operable Unit 7-13/14 Modeling of Plant and Animal Intrusion at Buried Waste Sites, INEEWEXT-01-00273, Rev. 0, Idaho National Engineering and Environmental Laboratory, Idaho Falls, Idaho, June 2001.
Hedlund, J.D. and L.E. Rogers, 1976, Characterization of Small Mammal Populations Inhabiting the B-C Cribs Environs, Battelle Pacific Northwest Laboratory, Richland, Washington, BNWL-218 1, December 1976.
Khire, Milind, Craig Benson, and Peter Bosscher, 2000, “Capillary Barriers: Design Variables and Water Balance,” Journal of Geotechnical and Geoenvironmental Engineering, August 2000.
Laundre, J. W., 1996, Mitigating Long Term Impacts of Small Mammal Burrowing on the Closure of Hazardous Waste Areas, Idaho State University, Pocatello, Idaho.
Magnuson, S., 1993, Simulation Study of Moisture Movement in Proposed Barriers for the Subsu$ace Disposal A rea, INEEL, EGG-WM- 10974, Idaho National Engineering Laboratory, EG&G Idaho, Inc, Idaho Falls, Idaho.
Maidment, 1993, Handbook of Hydrology, McGraw-Hill, Inc., San Francisco, California.
Martian, P., 1995, UNSATH Infiltration Model Calibration at the Subsurface Disposal Area, INEL- 95/0596, Idaho National Engineering Laboratory, Idaho Falls, Idaho.
Morris and Stormont, 1997, “Capillary Barriers and Subtitle D Covers: Estimating Equivalency,” Journal of Environmental Engineering, American Society of Civil Engineers, Vol. 123, No. 1.
Peyton R.L. and P.R. Schroeder, 1990, “Evaluation of Landfill-Liner Designs,” Journal of Environmental Engineering, American Society of Civil Engineers, Vol. 116, No. 3.
Porro I. and K.N. Keck, 1998, Engineered Barrier Testing at the INEEL Engineered Barriers Test Facility: FY-I 997 and FY-1998, INEELEXT-98-00964, Idaho National Engineering and Environmental Laboratory, RWMC Operations Department, Idaho Falls, Idaho.
Porro I., 2000, Hydrologic Behavior of Two Engineered Barriers Following Extreme Wetting, LNEEL/EXT-2000-00602, Idaho National Engineering and Environmental Laboratory Applied Geosciences Department, Idaho Falls, Idaho.
Schroeder, P.R., T.S. Dozier, P.A. Zappi, B.M. McEnroe, J.W. Sjostrom, and R.L. Peyton, 1994, The Hydrologic Evaluation of Landfill Performance (HELP) Model: Engineering Documentation for Version 3, EPA/600/R-94/168b, U.S. Environmental Protection Agency, Office of Research and Development, Washington D.C.
Selker et. al, Vadose Zone Processes, Lewis Publishers, Boca Raton, Florida, 1999.
Smallwood, K.S., 1996, Second Assessment of the BIOPORT Model’s Parameter Values for Pocket Gopher Burrowing Characteristics and other Relevant Wildlife Observations, Letter Report, Davis, California, August 1996.
8-2

Soil Conservation Service, 1972, SCS National Engineering Handbook, Section 4, “Hydrology,” US. Department of Agriculture, Washington, D.C.
8-3