hydrologic/hydraulic assessment report - home - …€¦ · hydrologic/hydraulic assessment report...
TRANSCRIPT

GUNNEDAH SECOND ROAD OVER RAIL BRIDGE
Hydrologic/Hydraulic Assessment Report
Prepared for:
Roads and Maritime Services – Northern Region
31 Victoria Street Grafton, NSW, 2460 Telephone 02 6640 1078
Prepared by:
Kellogg Brown & Root Pty Ltd
ABN 91 007 660 317 Level 13, 201 Kent Street Sydney, NSW, 2000 Telephone 02 8284 2000, Facsimile 02 8284 2200
12 December 2013
SEC143-TD-HY-REP-0001 Rev A

Kellogg Brown & Root Pty Ltd, 2013
Limitations Statement
The sole purpose of this report and the associated services performed by Kellogg Brown & Root Pty Ltd (KBR) is to provide a Hydrologic/Hydraulic Assessment in accordance with the scope of services set out in the contract between KBR and Roads and Maritime Services – Northern Division (‘the Client’). That scope of services was defined by the requests of the Client, by the time and budgetary constraints imposed by the Client, and by the availability of access to the site.
KBR derived the data in this report primarily from visual inspections, examination of records in the public domain, interviews with individuals with information about the site and previous assessments undertaken by others. The passage of time, manifestation of latent conditions or impacts of future events may require further exploration at the site and subsequent data analysis, and re-evaluation of the findings, observations and conclusions expressed in this report.
In preparing this report, KBR has relied upon and presumed accurate certain information (or absence thereof) relative to the site provided by government officials and authorities, the Client and others identified herein. Except as otherwise stated in the report, KBR has not attempted to verify the accuracy or completeness of any such information.
This report has been prepared on behalf of and for the exclusive use of the Client, and is subject to and issued in connection with the provisions of the agreement between KBR and the Client. KBR accepts no liability or responsibility whatsoever for or in respect of any use of or reliance upon this report by any third party.
Revision History
Revision Date Comment
Signatures
Originated by
Checked by
Approved by
A 12/12/2013 Issue for Review M Kang Z Lepojevic W Zborowski
SEC143-TD-HY-REP-0001 Rev. A ii 12 December 2013

CONTENTS
Section Page
1 INTRODUCTION 1
2 PREVIOUS STUDIES & INFORMATION SOURCES 4
3 INPUT DATA 6
12
4 METHODOLOGY
5 RESULTS
6 CONCLUSION
7 REFERENCES
APPENDICES
A RORB Result Table
B HEC-RAS Result Table
C Pier Arrangement
8
14
15
D HEC-RAS Longitudinal Section
E HEC-RAS Perspective Plot
F Ashford Watercourse Catchment
G RORB Plan
H HEC-RAS Plan
SEC143-TD-HY-REP-0001 Rev A iii 12 December 2013

1
1.2
Introduction
1.1 BACKGROUND
Kellogg Brown and Root (KBR) Pty Ltd has been engaged by Roads and Maritime Services (RMS) to identify a preferred option for a new road over rail bridge in Gunnedah, New South Wales.
The Oxley Highway is a main route which connects Tamworth and Coonabaran via Gunnedah and is predicted to receive an increase in traffic due to major coal developments in the Gunnedah Basin.
An increase in frequency of trains and also the longer length of coal trains cause significant delays at the existing rail crossings within Gunnedah. A grade separation to replace the New Street level crossing will assist in alleviating traffic pressures, facilitate efficiency and improve safety for both vehicles and pedestrians and assist council in improving local transport infrastructure.
This report has been prepared to assist in the investigation of the flooding impacts of the shortlisted options in the vicinity of Blackjack Creek.
GENERAL DESCRIPTION OF THE STUDY AREA
Blackjack Creek drains runoff from a catchment area of approximately 24km2
to the south of the Oxley Highway over a length of 8km between the upper reach catchment boundary to the cross drainage structures at the Oxley Highway. Between the Oxley Highway and the railway culvert bridge, Ashfords Watercourse (refer to Appendix F) which consists of a rectangular concrete channel joins the eastern side of the Blackjack Creek bank (refer to Figure 1).
Figure 1: Blackjack Creek Catchment Area (Lyall, 2005)
SEC143-TD-HY-REP-0001 Rev A 1 12 December 2013

The creek then discharges to the floodplain of the Namoi River, which is a significant floodplain impacting the township of Gunnedah and directly impacting the study area.
1.3 SCOPE AND OBJECTIVES OF THIS ASSESSMENT
Whilst various flood related studies have been completed in the past, the purpose of this study is to:
1. Estimate changes in water levels (afflux) upstream and downstream of the proposed alignment options for a 100 year Average Recurrence Interval (ARI) and
2. Calculate velocities around the proposed bridge piers for a 100 year
Option B/C and potential for scour and erosion. ARI in Blackjack Creek as a result of construction of Option B and
Providing a flood extent and flood levels for pre/post construction of the proposed road alignment is not part of the scope.
The three (3) options shortlisted at the time of the Preferred Option Report dated September 2013 are illustrated in Figure 1 below.
Option A, being geographically removed from Blackjack Creek, does not contribute any impact to flooding. Therefore Option A was excluded in this assessment.
Option B and B/C have a similar tie-in configuration at Warrabungle Street. The major difference between the options is the departure angle from the Oxley Highway roundabout. Both options are located on the top of the existing embankment.
SEC143-TD-HY-REP-0001 Rev A 2 12 December 2013
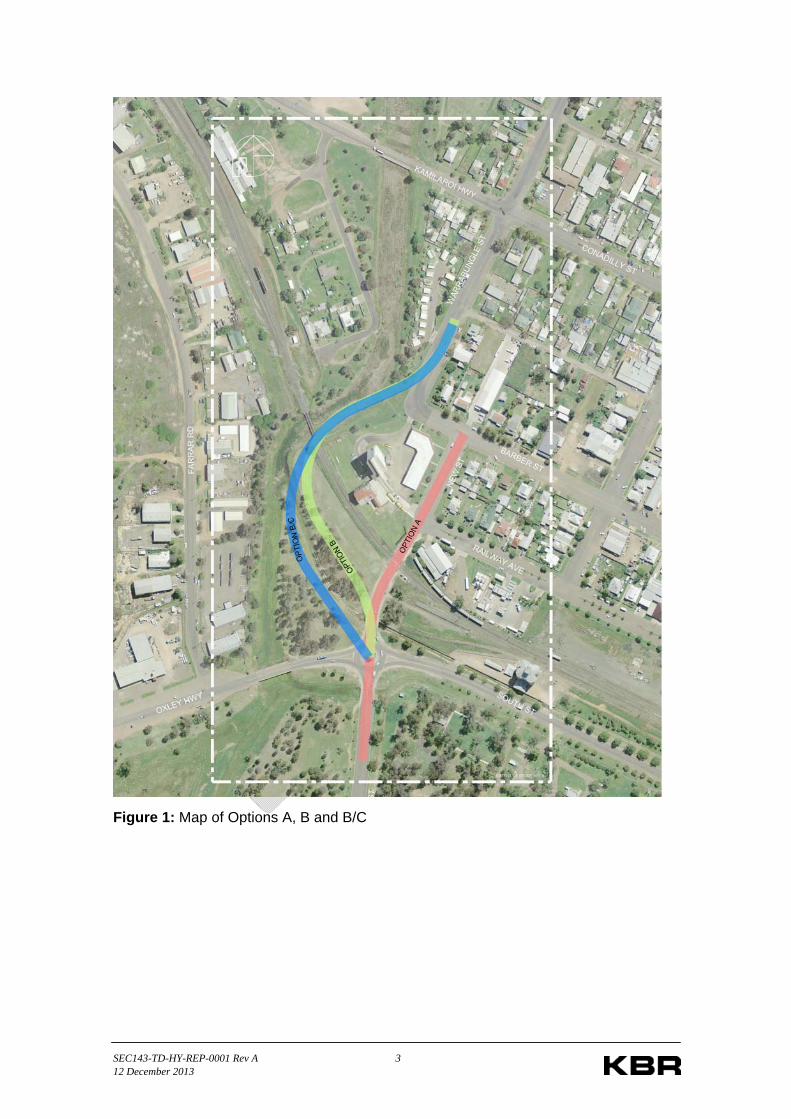
Figure 1: Map of Options A, B and B/C
SEC143-TD-HY-REP-0001 Rev A 3 12 December 2013

2
Lyall & Associates undertook a flood study for Blackjack Creek which drains the catchment of 24km2 upstream of the Oxley Highway culverts. This flood
Previous Studies & Information Sources
2.1 FLOOD INUNDATION MAP: NAMOI RIVER AT GUNNEDAH (NSW WATER RESOURCES COMMISSION, 1978)
This map only includes the flood extent of the Namoi River. As it was produced 35 years ago, the condition of Blackjack Creek would have changed
Water Resources Commission, 1978).
The study found that the flood elevation of Namoi River in the vicinity of the study area is RL 264.4m (Australian Height Datum, AHD) for the 100 year ARI. This flood elevation has been linearly interpolated by KBR between cross sections (the hydraulics model by SMEC) at Kelvin Road and upstream of the confluence of Blackjack Creek and Namoi River.
The KBR’s topographic model shows that the Blackjack Creek invert level upstream of the railway bridge is approximately RL 260.0m. This suggests that the flood waters from Namoi River would introduce a backwater effect.
This study has been used to assess downstream condition for the proposed HEC-RAS model.
BLACKJACK CREEK FLOOD STUDY (LYALL & ASSOCIATES, 2005)
and this may expand the flood extent further upstream of the Blackjack Creek corridor.
2.2 FLOOD STUDY REPORT GUNNEDAH AND CARROLL (SMEC, 1996)
The flood study report for Gunnedah prepared by SMEC in 1996 describes the results of a detailed flood study of the surrounding area of Gunnedah and the village of Carroll. This report superseded the Flood Inundation Map (NSW
2.3
study includes report, hydrologic (RORB) and hydraulics (HEC-RAS) models.
The purpose of this flood study was to define flood behaviour in the streams in terms of flows, levels and flooding behaviour for flood frequencies between 5 and 100 years ARI and the Probable Maximum Flood (PMF).
This report can be summarised as follows;
The small difference in flood levels between the 5 and 100 year ARI events where the flow velocities are generally less than 1m/s.
Floodwaters extend over a width of floodplain up to 400m downstream of High Street at the 20 year ARI.
The capacity of the culvert bridge at Oxley Highway would be sufficient for only up to a 20 year ARI.
SEC143-TD-HY-REP-0001 Rev A 4 12 December 2013
The hydrologic and hydraulics models created by Lyall & Associates were utilised as a partial base model for this assessment.
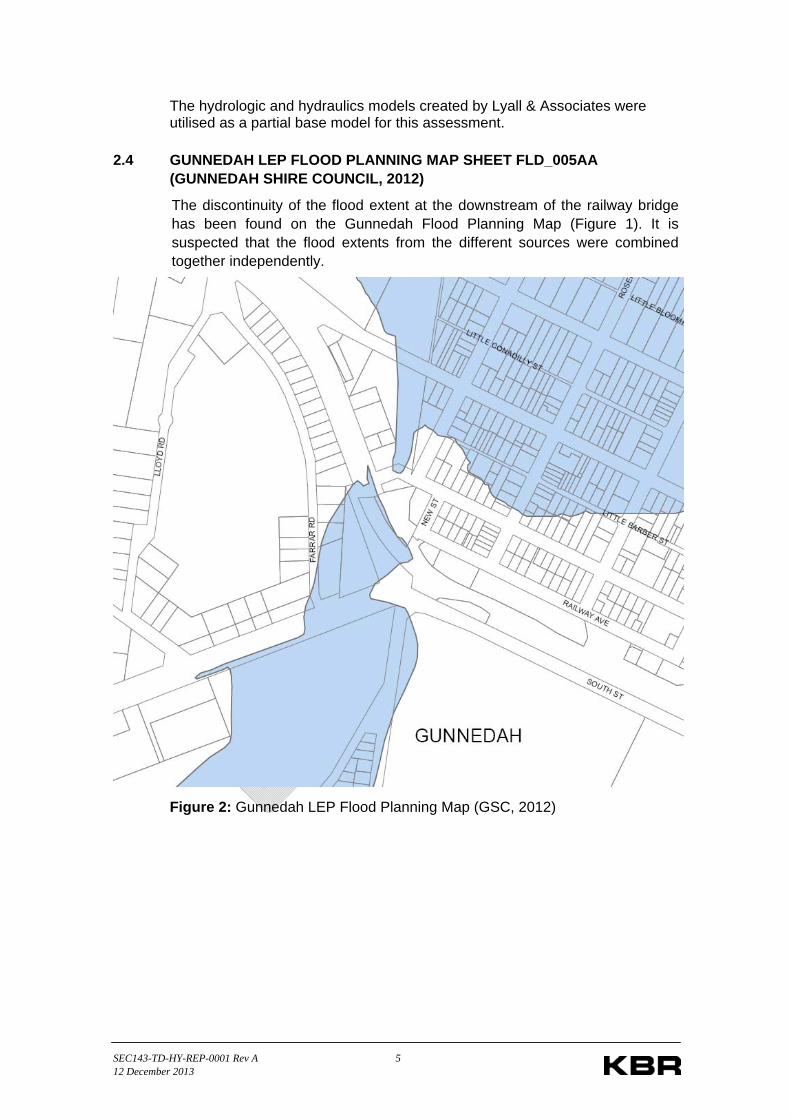
2.4 GUNNEDAH LEP FLOOD PLANNING MAP SHEET FLD_005AA (GUNNEDAH SHIRE COUNCIL, 2012)
The discontinuity of the flood extent at the downstream of the railway bridge has been found on the Gunnedah Flood Planning Map (Figure 1). It is suspected that the flood extents from the different sources were combined together independently.
Figure 2: Gunnedah LEP Flood Planning Map (GSC, 2012)
SEC143-TD-HY-REP-0001 Rev A 5 12 December 2013

3 Input Data
3.1 SITE INVESTIGATION
A site investigation was carried out on 18 July 2013 to inspect the study area including:
Creek geometry and local topography to assess Manning’s n coefficients
Culvert crossings including measurements
Other drainage infrastructures such as concrete open channel and swales
Spot levels of the creek invert. Leica Viva NetRover (GPS) was used to obtain additional cross sections outside of the topographic survey.
The inspection proceeded from downstream of the Oxley Highway culverts to
3.2
3.3
3.3.1
The following modelling information has been obtained from Lyall & Associates.
the Kamilaroi Highway culverts. The vegetation in the vicinity of the railway culvert bridge was found to be extremely dense. The creek channel is well defined although there were areas where the water was ponding locally, particularly upstream and downstream of the culverts.
TOPOGRAPHIC SURVEY INFORMATION
The 3-dimensional topographic ground survey information of the study area was produced by Moultrie Group on 6 November 2012.
EXISTING HYDROLOGIC/HYDRAULIC MODELS BY LYALL & ASSOCIATES (2005)
Existing hydrologic/hydraulic models
Hydrology: RORB catchment file
o It contains 12 sub-catchments.
o A catchment for Ashfords Watercourse is missing.
o A storm file was not provided.
o The report was used to confirm the parameters used and the modelling philosophy.
SEC143-TD-HY-REP-0001 Rev A 6 12 December 2013

Hydraulics: HEC-RAS model (steady)
o It does not cover the entire Blackjack Creek main streams and their tributaries.
o It was found that the railway bridge was replaced with a culvert crossing after the modelling and the Kamilaroi Highway culvert crossing was not included in the model.
3.3.2 Discrepancy in peak discharges between models and report
The RORB model supplied by Lyall & Associates which only includes a catchment model has been reviewed and it was found that the reproduced peak discharges from the RORB model and Lyall’s report were not identical.
RORB requires a catchment file, storm file and model parameters to run a hydrologic model. As a catchment file was only provided for this assessment,
RORB model would the missing information of the have caused the discrepancy in peak discharges.
Section 4 provides details on verifying peak discharges for the new model.
SEC143-TD-HY-REP-0001 Rev A 7 12 December 2013

4
RORB storm file: new project specific storm file has been created.
Methodology
This flood assessment focuses on the rise in water levels (afflux) in Blackjack Creek affected by the proposed alignments and bridges in the floodplain.
It consists of hydrology and hydraulics design components. The existing hydrologic and hydraulic models developed by Lyall & Associates have been reviewed and reused where possible.
4.1 HYDROLOGY
4.1.1 Assumptions and parameters
The RORB catchment model provided by Lyall & Associates has been used as a base model and then developed for this assessment
The catchment characteristics of the Lyall’s hydrologic model (catchment
4.1.2
As a project specific storm file was not provided, a
delineation, impervious and pervious area percentages) were adopted.
Model parameters including coefficients of storage equation and rainfall losses were specified from the report (Lyall & Associates, 2005).
Modelling
The original RORB model provided by Lyall & Associates was reviewed and the new hydrologic model was developed on the basis of the following information.
Blackjack Creek Flood Study report by Lyall & Associates (2005)
The RORB catchment file for the flood study (Lyall, 2005)
It was found that the original RORB model provided by Lyall & Associates required to incorporate the following missing information.
The rainfall Intensity-Duration-Frequency (IFD) data was extracted from Bureau of Meteorology (BoM) website. The 9 parameters extracted from BoM are:
I2y, 12h: 27.43 4.93 1.31 54.57 10.04 2.95
Skew= 0.33, F2 = 4.33 and F50 = 15.94
The additional Ashford Watercourse catchment (3.2km2) was added into the existing RORB catchment file.
SEC143-TD-HY-REP-0001 Rev A 8 12 December 2013

The peak discharge results from the following sources below are described in Table 1.
The peak discharges provided in the Lyall’s flood study report (2005)
The peak discharges produced with the catchment file provided by Lyall & Associates, a new storm file created by KBR and the parameter values specified in the Lyall’s report (2005).
The peak discharges produced with the revised catchment file by KBR, a new storm file created by KBR and the parameter values specified in the Lyall’s report (2005).
Table 1: Comparison of design peak discharges for the critical storm duration
Location
100yr ARI
Lyall’s Report
Existing Lyall
RORB
Revised model with Ashfords by KBR
(m3/s) (m3/s) (m3/s)
Main Arm at Lincoln Street 66 70 67 Tributary at Lincoln Street 45 46.5 44.5
Junction of Main Arm and Tributary d/s Lincoln Street
115 123 117
High Street 117 126 120 Short Street 126 137.5 131
Oxley Highway 127 139.5 132.5
D/S Oxley (D/S Ashfords) 144 Not
modelled 147.5
The results from the different sources are very similar and the revised model with an additional catchment from Ashfords watercourse has been adopted as inflows for HEC-RAS modelling.
SEC143-TD-HY-REP-0001 Rev A 9 12 December 2013

4.2 HYDRAULICS
4.2.1 Modification of the original HEC-RAS model by Lyall
The HEC-RAS model provided by Lyall & Associates covers approximately 4.5km (from the railway culvert bridge downstream to Hunts St upstream) of the mainstreams and tributaries of Blackjack Creek.
This original HEC-RAS model then was utilised as a base model (pre-construction of the proposed road alignment) to incorporate the following changes.
locations have been determined by new proposed bridge pier locations.
Manning’s n coefficients
The Manning’s ‘n’ coefficients have been amended based on the site visit, photos, experience and also to incorporate new viaduct piers.
Viaduct and Wall Scenarios for Each Option
The following scenarios were modelled for each option for post-construction of the proposed viaduct and road alignment.
Viaduct (30m span) construction allowing with reinforced soil walls provided up to 4.5m height
Reinforced soil wall construction allowing only the minimum opening for the ARTC rail clearances (17m minimum horizontal clearance).
The railway bridge in the original HEC-RAS model has been updated due to the replacement of the railway bridge with a culvert crossing after the flood study was undertaken by Lyall & Associates
The original HEC-RAS model has been extended approximately 70m downstream to incorporate Kamilaroi Highway culverts and additional cross sections downstream.
Extra cross sections have been included from the topographic survey information in the vicinity of the alignment options. The cross section
4.2.2
4.2.3
4.2.4 Boundary Condition & Sensitivity Analysis
Downstream boundary
The original HEC-RAS model has been extended 70m downstream to incorporate the Kamilaroi Highway culverts and additional cross sections.
Normal flow has been used for the downstream boundary condition in this study. The longitudinal slope of 0.53% was specified for downstream boundary, as an extrapolation of the existing channel slope.
Upstream boundary
It remains the same as the original Lyall’s model which peak flows derived from RORB provided the boundary conditions at the upstream end of the model.
SEC143-TD-HY-REP-0001 Rev A 10 12 December 2013

The upstream normal depth slopes specified by Lyall & Associates are as follows.
Blackjack Creek = 0.42%
Blackjack Creek tributary 1 = 1.53%
Blackjack Creek tributary 2 = 6.98%
4.2.5 Sensitivity Analysis
It is anticipated there would be a backwater effect from Namoi River (refer Section 2.2) which would change the downstream boundary condition. As a sensitivity check, the water level at the downstream boundary was set to RL 264.4m (AHD) as per the flood study undertaken by SMEC (1996). However, it did not influence the afflux in the vicinity of proposed alignments.
A joint probability analysis of Blackjack Creek and Namoi River flooding behaviours is beyond the scope of this assessment.
The railway culvert bridge creates an obstruction in Blackjack Creek which would cause the flood water to back up behind of it. Therefore the railway culvert bridge works as a dam or weir to obstruct the flood waters to act as a lake upstream of the bridge. The velocities are less than 1.5 m/s and any piers or obstruction would have little effect on water afflux levels.
SEC143-TD-HY-REP-0001 Rev A 11 12 December 2013

5 Results
The pre-construction HEC-RAS model has been adopted as a base model to identify the rise in water levels and the change in velocity for two (2) scenarios (viaduct and wall) for two (2) proposed road alignment options (Option B and Option B/C). In this assessment, the 100 year ARI was only considered.
5.1 REINFORCED SOIL WALL SCENARIO
It was found that the flood waters of the 100 year ARI for the reinforced soil wall scenario would overtop the existing levee and the railway line. From the
5.2 VIADUCT SCENARIO
drainage perspective, it is not a preferred scenario.
The results of the viaduct scenario for each option at River Station (RS) 1.6 and RS 1.7 from this modelling are tabulated as below.
RS1.6: Pier
RS1.7: Upstream embankment
For the results and the locations of each River Station, refer to Appendix B and Appendix H.
Table 2: Afflux and velocity at RS 1.6 & 1.7
100yr ARI
Afflux (mm) Velocity (m/s)
Option B
Option B/C
Existing Option
B Option
B/C
RS1.6 (Pier) 10 7 1.4 1.01 1.02
RS1.7 (Upstream Embankment)
20 40 1.57 1.54 1.43
5.2.1 Afflux
The afflux for Option B/C is 20mm higher that Option B at the upstream embankment. The Option B/C embankment is located between Blackjack Creek and the Ashfords Watercouse channel whereas the Option B embankment is further away from the Ashfords Watercourse channel. The embankment of Option B/C near the Oxley Highway takes a larger cross section area than Option B which would slightly reduce the capacity of the floodplain.
SEC143-TD-HY-REP-0001 Rev A 12 12 December 2013

5.2.2 Velocities
The results show that the velocities of Option B and Option B/C are very similar at the pier (approximately 0.01 m/s difference) and the velocity for Option B is slightly higher than Option B/C, 0.1 m/s around the embankment. The velocities of each option appear to be very slow (~1.54 m/s). The existing railway bridge acts as a dam or weir which makes the floodplain as a retention basin upstream of the railway bridge. This demonstrates velocities are not a critical problem for a 100 year ARI event.
SEC143-TD-HY-REP-0001 Rev A 13 12 December 2013

6 Conclusion
The hydraulic modelling results show that the flood impact of each option for the viaduct scenario would be insignificant as the afflux values for the Option B and Option B/C viaduct options are less than 10mm around piers. This is due in part to the viaduct approach with long spans between piers, so that the extent of obstruction and adjacent to the creeks is minimised.
However the afflux values in the vicinity of the Option B/C embankment near the Oxley Highway roundabout is approximately 40mm. The afflux of Option B/C is greater than Option B by 20mm because the embankment of the Option B/C alignment is in the middle of Blackjack Creek and the concrete dish drain. This would reduce the capacity of the floodplain.
These afflux values for the viaduct scenario for the both options appear to be manageable and would require a minor reinstatement works for the existing creek and channel.
The afflux values for the reinforced soil wall options were approximately 120mm. It appears that flood waters would overtop the existing levee and the railway line. This is not a preferred scenario from a drainage perspective as it would have a significant impact on the existing infrastructure.
The flow velocity is used primarily to identify potential scour issues at bridge and embankment support structures. A value exceeding 2 m/s is typically enough to produce scour.
This assessment demonstrates that the afflux values and the velocities produced from the modelling would have no significant issue for the proposed viaduct and road alignment construction and operation phases.
This report only covers the assessment of the rise in water levels in Blackjack Creek affected by the proposed alignments and bridges in the floodplain. In order to determine flood water levels and flood extent, two-dimensional hydraulic modelling should be considered in future project stages.
SEC143-TD-HY-REP-0001 Rev A 14 12 December 2013

7 References
1. Pilgrim D. H. (Editor in Chief), 1987, Australian Rainfall and Runoff – A Guide to Flood Estimation, Institution of Engineers, Australia.
2. Flood inundation map: Namoi River at Gunnedah, 1978, 1:10,000, Water Resources Commission, N.S.W.
3. SMEC, Flood Study Report Gunnedah and Carroll, 1996, Gunnedah Shire Council.
4. SMEC, Gunnedah and Carroll Floodplain Management Study, 1999, Gunnedah Shire Council.
5. Lyall & Associates, 2005, Blackjack Creek Flood Study, Gunnedah Shire Council
6. Lyall & Associates, 2005, Blackjack Creek Floodplain Risk Management Study and Plan, Gunnedah Shire Council
7. Gunnedah LEP Flood Planning Map Sheet FLD_005AA, 2012, 1:40,000, Gunnedah Shire Council
SEC143-TD-HY-REP-0001 Rev A 15 12 December 2013

Appendix A
RORB RESULT TABLE
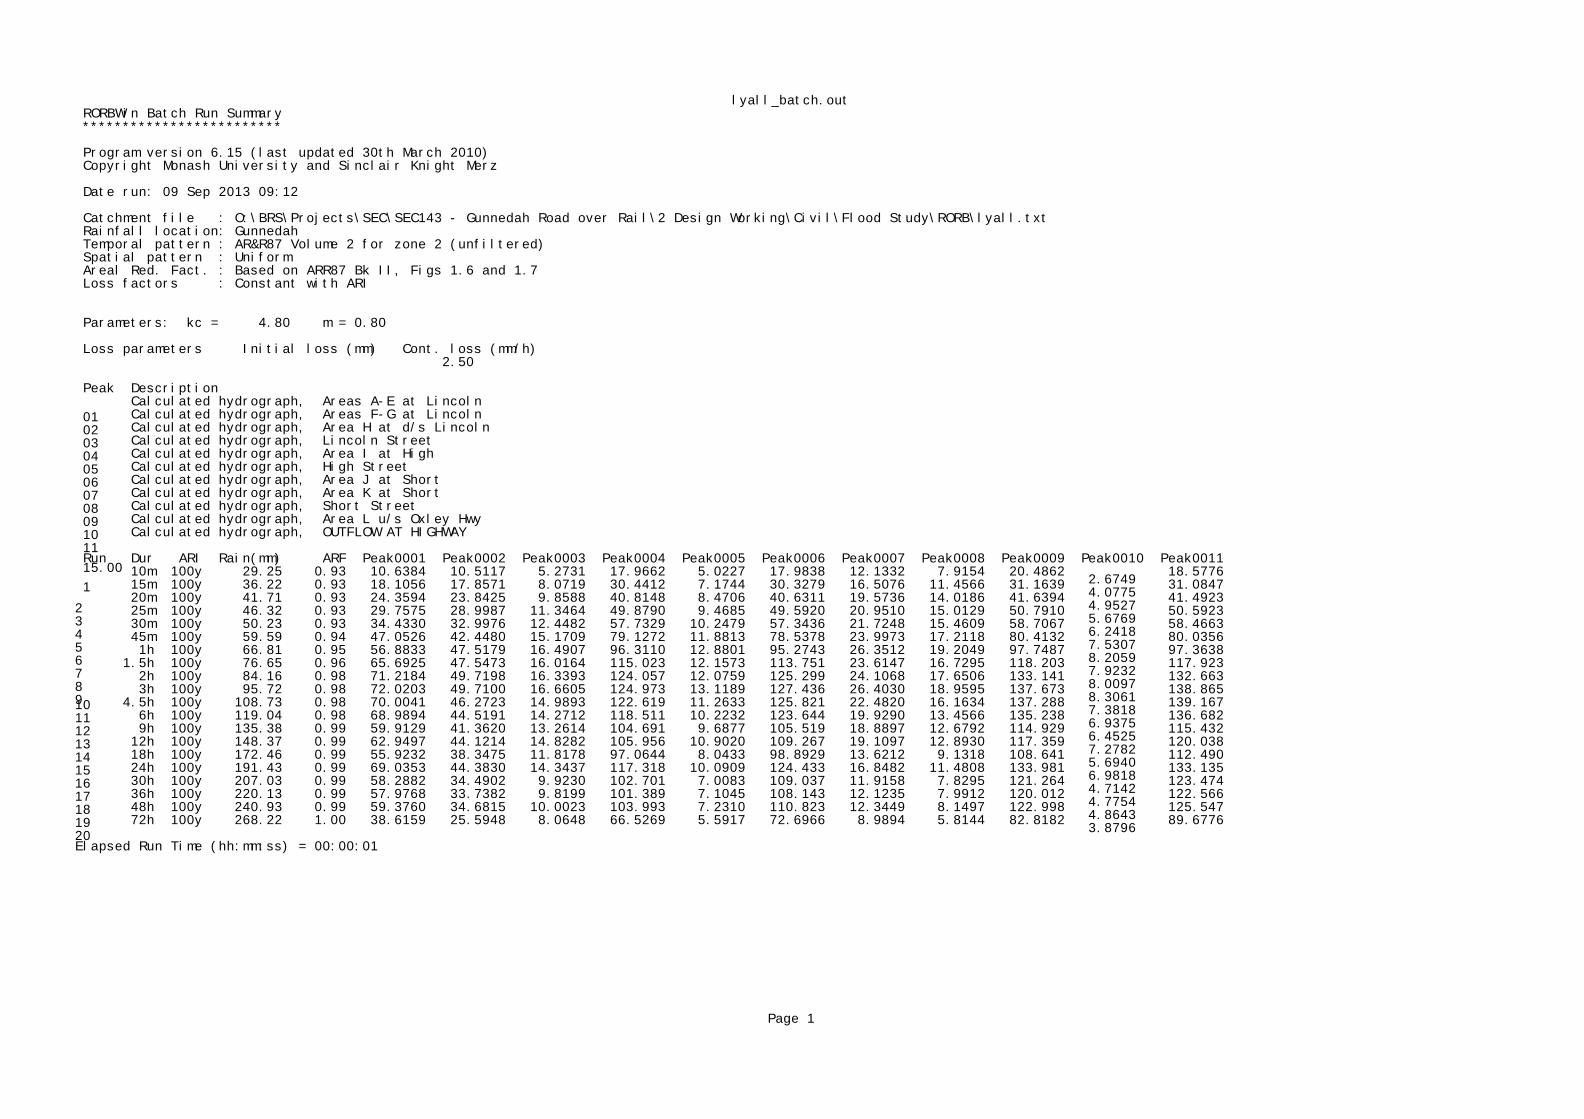
lyall_batch.out RORBWin Batch Run Summary *************************
Program version 6.15 (last updated 30th March 2010) Copyright Monash University and Sinclair Knight Merz
Date run: 09 Sep 2013 09:12
Catchment file : O:\BRS\Projects\SEC\SEC143 - Gunnedah Road over Rail\2 Design Working\Civil\Flood Study\RORB\lyall.txt Rainfall location: Gunnedah Temporal pattern : AR&R87 Volume 2 for zone 2 (unfiltered) Spatial pattern : Uniform Areal Red. Fact. : Based on ARR87 Bk II, Figs 1.6 and 1.7 Loss factors : Constant with ARI
Parameters: kc = 4.80 m = 0.80
Loss parameters Initial loss (mm) Cont. loss (mm/h)
15.00
2.50
Peak Description
01 Calculated hydrograph, Areas A-E at Lincoln
02 Calculated hydrograph, Areas F-G at Lincoln
03 Calculated hydrograph, Area H at d/s Lincoln
04 Calculated hydrograph, Lincoln Street
05 Calculated hydrograph, Area I at High
06 Calculated hydrograph, High Street
07 Calculated hydrograph, Area J at Short
08 Calculated hydrograph, Area K at Short
09 Calculated hydrograph, Short Street
10 Calculated hydrograph, Area L u/s Oxley Hwy
11 Calculated hydrograph, OUTFLOW AT HIGHWAY
Run Dur ARI Rain(mm) ARF Peak0001 Peak0002 Peak0003 Peak0004 Peak0005 Peak0006 Peak0007 Peak0008 Peak0009 Peak0010 Peak0011
1 10m 100y 29.25 0.93 10.6384 10.5117 5.2731 17.9662 5.0227 17.9838 12.1332 7.9154 20.4862
2.6749 18.5776
2
15m 100y 36.22 0.93 18.1056 17.8571 8.0719 30.4412 7.1744 30.3279 16.5076 11.4566 31.1639 4.0775
31.0847
3
20m 100y 41.71 0.93 24.3594 23.8425 9.8588 40.8148 8.4706 40.6311 19.5736 14.0186 41.6394 4.9527
41.4923
4
25m 100y 46.32 0.93 29.7575 28.9987 11.3464 49.8790 9.4685 49.5920 20.9510 15.0129 50.7910 5.6769
50.5923
5
30m 100y 50.23 0.93 34.4330 32.9976 12.4482 57.7329 10.2479 57.3436 21.7248 15.4609 58.7067 6.2418
58.4663
6
45m 100y 59.59 0.94 47.0526 42.4480 15.1709 79.1272 11.8813 78.5378 23.9973 17.2118 80.4132 7.5307
80.0356
7
1h 100y 66.81 0.95 56.8833 47.5179 16.4907 96.3110 12.8801 95.2743 26.3512 19.2049 97.7487 8.2059
97.3638
8
1.5h 100y 76.65 0.96 65.6925 47.5473 16.0164 115.023 12.1573 113.751 23.6147 16.7295 118.203 7.9232
117.923
9
2h 100y 84.16 0.98 71.2184 49.7198 16.3393 124.057 12.0759 125.299 24.1068 17.6506 133.141 8.0097
132.663
10 3h 100y 95.72 0.98 72.0203 49.7100 16.6605 124.973 13.1189 127.436 26.4030 18.9595 137.673
8.3061 138.865
11 4.5h 100y 108.73 0.98 70.0041 46.2723 14.9893 122.619 11.2633 125.821 22.4820 16.1634 137.288
7.3818 139.167
12 6h 100y 119.04 0.98 68.9894 44.5191 14.2712 118.511 10.2232 123.644 19.9290 13.4566 135.238
6.9375 136.682
13 9h 100y 135.38 0.99 59.9129 41.3620 13.2614 104.691 9.6877 105.519 18.8897 12.6792 114.929
6.4525 115.432
14 12h 100y 148.37 0.99 62.9497 44.1214 14.8282 105.956 10.9020 109.267 19.1097 12.8930 117.359
7.2782 120.038
15 18h 100y 172.46 0.99 55.9232 38.3475 11.8178 97.0644 8.0433 98.8929 13.6212 9.1318 108.641
5.6940 112.490
16 24h 100y 191.43 0.99 69.0353 44.3830 14.3437 117.318 10.0909 124.433 16.8482 11.4808 133.981
6.9818 133.135
17 30h 100y 207.03 0.99 58.2882 34.4902 9.9230 102.701 7.0083 109.037 11.9158 7.8295 121.264
4.7142 123.474
18 36h 100y 220.13 0.99 57.9768 33.7382 9.8199 101.389 7.1045 108.143 12.1235 7.9912 120.012
4.7754 122.566
19 48h 100y 240.93 0.99 59.3760 34.6815 10.0023 103.993 7.2310 110.823 12.3449 8.1497 122.998
4.8643 125.547
20 72h 100y 268.22 1.00 38.6159 25.5948 8.0648 66.5269 5.5917 72.6966 8.9894 5.8144 82.8182
3.8796 89.6776
Elapsed Run Time (hh:mm:ss) = 00:00:01
Page 1

Ashford water course added2_batch.out RORBWin Batch Run Summary *************************
Program version 6.15 (last updated 30th March 2010) Copyright Monash University and Sinclair Knight Merz
Date run: 11 Sep 2013 17:24
Catchment file : O:\BRS\Projects\SEC\SEC143 - Gunnedah Road over Rail\2 Design Working\Civil\Flood Study\RORB\Ashford water course added2.catg Rainfall location: Gunnedah Temporal pattern : AR&R87 Volume 2 for zone 2 (unfiltered) Spatial pattern : Uniform Areal Red. Fact. : Based on ARR87 Bk II, Figs 1.6 and 1.7 Loss factors : Constant with ARI
Parameters: kc = 4.80 m = 0.80
Loss parameters Initial loss (mm) Cont. loss (mm/h)
15.00
2.50
Peak Description
01 Calculated hydrograph, Areas A-E at Lincoln
02 Calculated hydrograph, Areas F-G at Lincoln
03 Calculated hydrograph, Area H at d/s Lincoln
04 Calculated hydrograph, Lincoln Street
05 Calculated hydrograph, Area I at High
06 Calculated hydrograph, High Street
07 Calculated hydrograph, Area J at Short
08 Calculated hydrograph, Area K at Short
09 Calculated hydrograph, Short Street
10 Calculated hydrograph, Area L u/s Oxley Hwy
11 Calculated hydrograph, total flow at Oxley
12 Calculated hydrograph, Ashford Water Course
13 Calculated hydrograph, OUTFLOW before railway bridg
Run Dur ARI Rain(mm) ARF Peak0001 Peak0002 Peak0003 Peak0004 Peak0005 Peak0006 Peak0007 Peak0008 Peak0009 Peak0010 Peak0011 Peak0012 Peak0013
1 10m 100y 29.25 0.92 9.5781 9.4664 4.7839 16.1788 4.5815 16.2002 11.1176 7.2176 18.6900
2.4276 16.7524 17.3215 22.0309
2
15m 100y 36.22 0.92 16.3713 16.1486 7.3783 27.5312 6.5922 27.4355 15.2880 10.6185 28.2031 3.7296
28.1359 23.1223 31.6282
3
20m 100y 41.71 0.92 22.0784 21.6104 9.0730 36.9880 7.7851 36.8088 18.1216 12.9923 37.7368 4.5653
37.6209 26.1937 41.1954
4
25m 100y 46.32 0.92 27.0449 26.4126 10.5022 45.2937 8.7579 45.0250 19.5919 14.0823 46.1062 5.2641
45.9520 26.7484 50.3078
5
30m 100y 50.23 0.92 31.3042 30.2032 11.5031 52.4541 9.5314 52.0913 20.4676 14.6426 53.3195 5.7747
53.1209 25.9290 58.1709
6
45m 100y 59.59 0.93 43.0371 39.2682 14.2348 72.3313 11.1695 71.7846 22.7742 16.3813 73.4895 7.0784
73.1618 26.2172 80.1000
7
1h 100y 66.81 0.95 52.3412 44.5070 15.5509 88.4391 12.1833 87.5418 25.1042 18.2193 89.7047 7.7165
89.3161 30.7991 97.9343
8
1.5h 100y 76.65 0.96 61.2231 45.0734 15.1730 106.868 11.5994 105.446 22.6229 16.1300 109.207 7.5112
108.935 24.3568 119.784
9
2h 100y 84.16 0.97 67.0421 47.3144 15.6367 116.879 11.6146 117.459 23.0056 16.7572 123.762 7.6824
123.398 29.2614 136.299
10 3h 100y 95.72 0.98 68.2078 46.9807 15.8299 118.270 12.4392 120.194 25.3680 18.3288 130.831
7.8381 132.038 29.4619 146.429
11 4.5h 100y 108.73 0.98 67.0615 44.2473 14.4513 117.172 10.8256 119.802 21.5365 15.5605 130.522
7.0672 132.287 25.1299 147.151
12 6h 100y 119.04 0.98 66.1809 42.6513 13.8033 113.332 9.9273 118.053 19.2365 13.0741 127.896
6.7314 131.341 22.9224 145.346
13 9h 100y 135.38 0.98 57.6681 39.5927 12.8429 98.9395 9.2617 101.046 18.2394 12.3232 108.835
6.2570 109.849 21.6872 121.297
14 12h 100y 148.37 0.99 59.5830 41.8563 14.2277 99.4433 10.5432 103.476 18.7786 12.7491 111.933
6.9930 114.303 22.7608 127.337
15 18h 100y 172.46 0.99 54.5452 37.1969 11.5619 91.7728 7.9437 96.2277 13.2143 8.8875 104.860
5.5831 107.219 18.2667 118.737
16 24h 100y 191.43 0.99 65.7512 42.5701 13.8859 113.747 9.8485 118.821 16.6559 11.3937 127.010
6.7715 125.809 22.6398 142.072
17 30h 100y 207.03 0.99 56.7158 34.2315 9.9062 100.853 6.8371 106.119 11.7242 7.7203 117.612
4.6958 118.769 16.1739 134.942
18 36h 100y 220.13 0.99 56.4156 33.5565 9.6692 99.6413 6.9278 105.295 11.9230 7.8761 116.429
4.6358 117.910 16.2986 133.625
19 48h 100y 240.93 0.99 57.7693 34.4487 9.9283 102.146 7.0503 107.861 12.1391 8.0313 119.289
4.7216 120.747 16.6061 136.896
20 72h 100y 268.22 1.00 38.9445 24.9964 7.9154 64.4955 5.5111 73.2041 8.9069 5.7662 83.2034
3.8108 89.7441 13.3493 98.7070
Elapsed Run Time (hh:mm:ss) = 00:00:01
Page 1

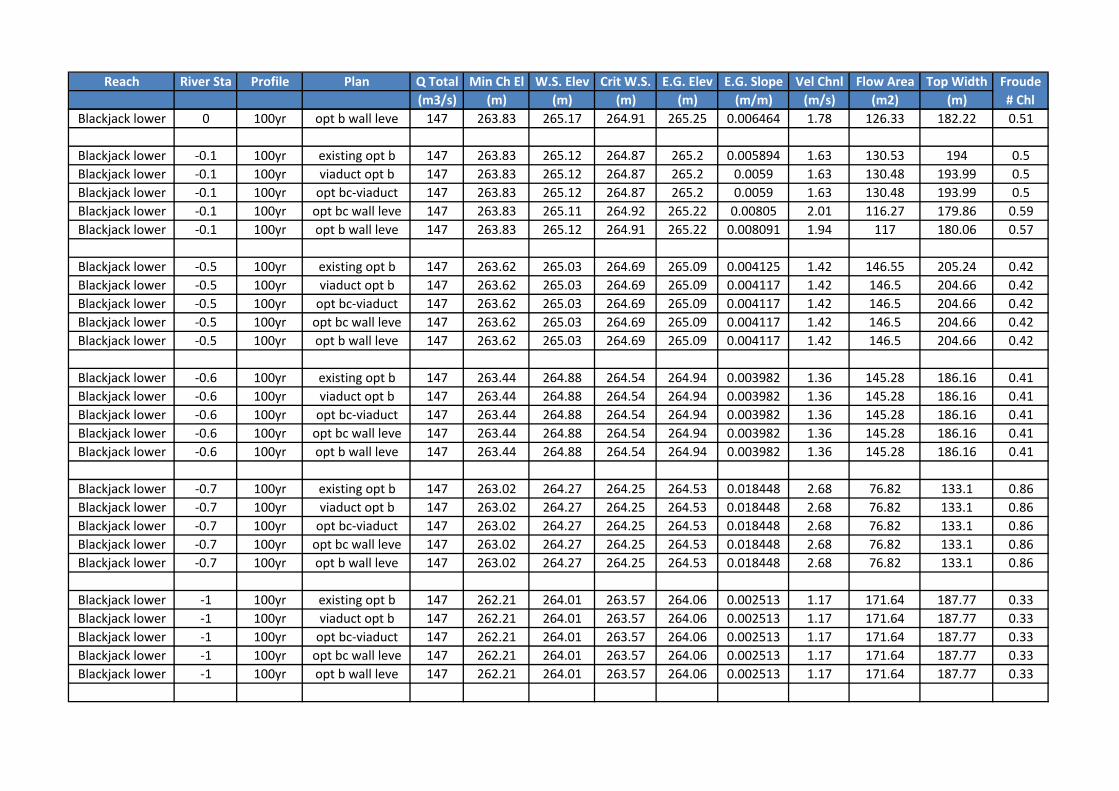
Appendix B
HEC-RAS RESULT TABLE

Reach River Sta Profile Plan Q Total Min Ch El W.S. Elev Crit W.S. E.G. Elev E.G. Slope Vel Chnl Flow Area Top Width Froude # Chl (m3/s) (m) (m) (m) (m) (m/m) (m/s) (m2) (m)
Blackjack lower 1.7 100yr existing opt b 147 265.09 267.28 266.25 267.37 0.003139 1.57 130.92 158.18 0.39 Blackjack lower 1.7 100yr viaduct opt b 147 265.09 267.3 266.25 267.39 0.002985 1.54 133.62 160.08 0.38 Blackjack lower 1.7 100yr opt bc‐viaduct 147 265.09 267.32 266.26 267.4 0.002491 1.43 125.75 151.71 0.35 Blackjack lower 1.7 100yr opt bc wall leve 147 265.09 267.43 266.26 267.49 0.002035 1.34 141.52 157.3 0.32 Blackjack lower 1.7 100yr opt b wall leve 147 265.09 267.4 266.25 267.47 0.002206 1.38 151.77 171.35 0.33
Blackjack lower 1.65 100yr existing opt b 147 265.03 267.21 266.23 267.28 0.002605 1.4 143.8 162.54 0.35 Blackjack lower 1.65 100yr viaduct opt b 147 265.03 267.23 266.23 267.3 0.002463 1.37 147.24 165.64 0.34 Blackjack lower 1.65 100yr opt bc‐viaduct 147 265.03 267.23 266.32 267.32 0.003108 1.54 125.46 149.67 0.38 Blackjack lower 1.65 100yr opt bc wall leve 147 265.03 267.36 266.32 267.43 0.002268 1.37 146.18 162.58 0.33 Blackjack lower 1.65 100yr opt b wall leve 147 265.03 267.36 266.23 267.41 0.001767 1.21 169.43 177.24 0.29
Blackjack lower 1.63 100yr existing opt b 147 264.64 267.14 265.9 267.17 0.000806 0.95 202.18 122.84 0.21 Blackjack lower 1.63 100yr viaduct opt b 147 264.64 267.15 265.9 267.18 0.000925 1.02 184.37 107.97 0.22 Blackjack lower 1.63 100yr opt bc‐viaduct 147 264.64 267.14 265.93 267.18 0.001011 1.09 177.23 105.54 0.23 Blackjack lower 1.63 100yr opt bc wall leve 147 264.64 267.29 265.93 267.33 0.00078 1 193.32 108.27 0.21 Blackjack lower 1.63 100yr opt b wall leve 147 264.64 267.29 265.9 267.32 0.00072 0.94 200.36 110.53 0.2
Blackjack lower 1.62 100yr existing opt b 147 264.41 267.12 265.76 267.15 0.000761 0.93 190.44 96.86 0.2 Blackjack lower 1.62 100yr viaduct opt b 147 264.41 267.13 265.76 267.16 0.000747 0.93 191.57 96.96 0.2 Blackjack lower 1.62 100yr opt bc‐viaduct 147 264.41 267.13 265.76 267.16 0.00075 0.93 191.35 96.94 0.2 Blackjack lower 1.62 100yr opt bc wall leve 147 264.41 267.27 265.82 267.3 0.00083 1.02 176.32 85.02 0.21 Blackjack lower 1.62 100yr opt b wall leve 147 264.41 267.26 265.75 267.3 0.000815 1.01 176.04 82.95 0.21
Blackjack lower 1.61615 100yr existing opt b 147 264.41 267.11 265.76 267.14 0.000766 0.94 190.06 96.82 0.2 Blackjack lower 1.61615 100yr viaduct opt b 147 264.41 267.12 265.76 267.15 0.000754 0.93 190.99 96.91 0.2 Blackjack lower 1.61615 100yr opt bc‐viaduct 147 264.41 267.12 265.76 267.15 0.000757 0.93 190.72 96.88 0.2 Blackjack lower 1.61615 100yr opt bc wall leve 147 264.41 267.26 265.82 267.3 0.000835 1.02 175.94 84.98 0.21 Blackjack lower 1.61615 100yr opt b wall leve 147 264.41 267.26 265.75 267.3 0.00082 1.01 175.69 82.91 0.21
Blackjack lower 1.6 100yr existing opt b 147 264.16 267.08 265.64 267.13 0.000805 1.02 166.29 78.54 0.21 Blackjack lower 1.6 100yr viaduct opt b 147 264.16 267.09 265.64 267.13 0.000794 1.01 167.07 78.6 0.21

Reach River Sta Profile Plan Q Total Min Ch El W.S. Elev Crit W.S. E.G. Elev E.G. Slope Vel Chnl Flow Area Top Width Froude # Chl (m3/s) (m) (m) (m) (m) (m/m) (m/s) (m2) (m)
Blackjack lower 1.6 100yr opt bc‐viaduct 147 264.16 267.09 265.64 267.13 0.000797 1.02 166.85 78.58 0.21 Blackjack lower 1.6 100yr opt bc wall leve 147 264.16 267.21 265.76 267.28 0.0012 1.21 139.39 63.3 0.24 Blackjack lower 1.6 100yr opt b wall leve 147 264.16 267.22 265.65 267.28 0.000923 1.13 148.75 65.69 0.22
Blackjack lower 1.59 100yr existing opt b 147 264.16 267.08 265.64 267.12 0.00081 1.02 165.96 78.52 0.21 Blackjack lower 1.59 100yr viaduct opt b 147 264.16 267.08 265.64 267.13 0.000804 1.02 166.35 78.55 0.21 Blackjack lower 1.59 100yr opt bc‐viaduct 147 264.16 267.08 265.64 267.12 0.000806 1.02 166.27 78.54 0.21 Blackjack lower 1.59 100yr opt bc wall leve 147 264.16 267.21 265.76 267.27 0.001129 1.23 138.89 63.25 0.25 Blackjack lower 1.59 100yr opt b wall leve 147 264.16 267.22 265.65 267.27 0.000929 1.13 148.43 65.66 0.23
Blackjack lower 1.55 100yr existing opt b 147 264.08 267.04 265.63 267.08 0.000857 1.08 163.18 79.5 0.22 Blackjack lower 1.55 100yr viaduct opt b 147 264.08 267.04 265.63 267.09 0.00085 1.07 163.6 79.54 0.22 Blackjack lower 1.55 100yr opt bc‐viaduct 147 264.08 267.04 265.63 267.09 0.000851 1.07 163.52 79.53 0.22 Blackjack lower 1.55 100yr opt bc wall leve 147 264.08 267.15 265.77 267.22 0.001126 1.27 138.38 66.33 0.25 Blackjack lower 1.55 100yr opt b wall leve 147 264.08 267.16 265.71 267.22 0.001093 1.25 140.11 66.06 0.25
Blackjack lower 1.54 100yr existing opt b 147 264.08 267.03 265.63 267.08 0.000862 1.08 162.82 79.46 0.22 Blackjack lower 1.54 100yr viaduct opt b 147 264.08 267.03 265.63 267.08 0.000864 1.08 162.72 79.45 0.22 Blackjack lower 1.54 100yr opt bc‐viaduct 147 264.08 267.03 265.63 267.08 0.000864 1.08 162.72 79.45 0.22 Blackjack lower 1.54 100yr opt bc wall leve 147 264.08 267.14 265.77 267.21 0.001135 1.27 137.99 66.28 0.25 Blackjack lower 1.54 100yr opt b wall leve 147 264.08 267.15 265.71 267.22 0.001101 1.26 139.73 66.01 0.25
Blackjack lower 1.1 100yr existing opt b 147 264.09 266.85 265.69 267.05 0.000317 1.99 75.97 44.1 0.4 Blackjack lower 1.1 100yr viaduct opt b 147 264.09 266.85 265.69 267.05 0.000317 1.99 75.9 44.03 0.4 Blackjack lower 1.1 100yr opt bc‐viaduct 147 264.09 266.85 265.69 267.05 0.000317 1.99 75.9 44.03 0.4 Blackjack lower 1.1 100yr opt bc wall leve 147 264.09 267.02 265.69 267.19 0.00025 1.85 84.03 51.63 0.36 Blackjack lower 1.1 100yr opt b wall leve 147 264.09 267.03 265.69 267.2 0.000247 1.84 84.5 52.08 0.36
Blackjack lower 1 Culvert
Blackjack lower 0.5 100yr existing opt b 147 264.07 265.89 265.67 266.41 0.015841 3.21 45.86 28.57 0.81 Blackjack lower 0.5 100yr viaduct opt b 147 264.07 266.11 265.67 266.51 0.01042 2.81 52.29 28.6 0.66

Reach River Sta Profile Plan Q Total Min Ch El W.S. Elev Crit W.S. E.G. Elev E.G. Slope Vel Chnl Flow Area Top Width Froude # Chl (m3/s) (m) (m) (m) (m) (m/m) (m/s) (m2) (m)
Blackjack lower 0.5 100yr opt bc‐viaduct 147 264.07 266.11 265.67 266.51 0.01042 2.81 52.29 28.6 0.66 Blackjack lower 0.5 100yr opt bc wall leve 147 264.07 266.61 265.67 266.85 0.004729 2.2 68.01 33.76 0.46 Blackjack lower 0.5 100yr opt b wall leve 147 264.07 266.62 265.67 266.86 0.004616 2.18 68.56 33.83 0.46
Blackjack lower 0.495 100yr existing opt b 147 264.07 265.87 265.67 266.4 0.016336 3.24 45.42 28.57 0.82 Blackjack lower 0.495 100yr viaduct opt b 147 264.07 266.1 265.67 266.5 0.01069 2.83 51.87 28.6 0.67 Blackjack lower 0.495 100yr opt bc‐viaduct 147 264.07 266.1 265.67 266.5 0.01069 2.83 51.87 28.6 0.67 Blackjack lower 0.495 100yr opt bc wall leve 147 264.07 266.1 265.88 266.8 0.017344 3.71 39.6 19.9 0.84 Blackjack lower 0.495 100yr opt b wall leve 147 264.07 266.1 265.89 266.81 0.016281 3.75 39.58 19.9 0.85
Blackjack lower 0.49 100yr existing opt b 147 264.07 265.67 265.67 266.37 0.025058 3.7 39.75 28.54 1 Blackjack lower 0.49 100yr viaduct opt b 147 264.07 265.45 265.67 266.44 0.044056 4.41 33.37 28.51 1.3 Blackjack lower 0.49 100yr opt bc‐viaduct 147 264.07 265.45 265.67 266.44 0.044056 4.41 33.37 28.51 1.3 Blackjack lower 0.49 100yr opt bc wall leve 147 264.07 265.88 265.88 266.77 0.024928 4.17 35.25 19.88 1 Blackjack lower 0.49 100yr opt b wall leve 147 264.07 265.89 265.89 266.78 0.023375 4.2 35.34 19.88 1
Blackjack lower 0.4 100yr existing opt b 147 263.86 265.31 265.06 265.39 0.005245 1.67 135.77 193.96 0.48 Blackjack lower 0.4 100yr viaduct opt b 147 263.86 265.33 264.99 265.41 0.004946 1.63 138.51 194.49 0.46 Blackjack lower 0.4 100yr opt bc‐viaduct 147 263.86 265.33 264.99 265.41 0.004946 1.63 138.51 194.49 0.46 Blackjack lower 0.4 100yr opt bc wall leve 147 263.89 265.38 265.13 265.46 0.006271 1.81 130.54 183 0.51 Blackjack lower 0.4 100yr opt b wall leve 147 263.89 265.39 265.13 265.46 0.006356 1.72 130.56 182.31 0.48
Blackjack lower 0.35 100yr existing opt b 147 263.86 265.27 265.06 265.37 0.006229 1.78 128.01 192.46 0.52 Blackjack lower 0.35 100yr viaduct opt b 147 263.86 265.28 265.06 265.37 0.006112 1.77 128.84 192.62 0.51 Blackjack lower 0.35 100yr opt bc‐viaduct 147 263.86 265.28 265.06 265.37 0.006112 1.77 128.84 192.62 0.51 Blackjack lower 0.35 100yr opt bc wall leve 147 263.89 265.33 265.13 265.42 0.007746 1.96 121.72 181.18 0.56 Blackjack lower 0.35 100yr opt b wall leve 147 263.89 265.34 265.13 265.43 0.007834 1.87 121.8 180.49 0.54
Blackjack lower 0 100yr existing opt b 147 263.83 265.15 264.87 265.23 0.00506 1.54 137.61 195.69 0.46 Blackjack lower 0 100yr viaduct opt b 147 263.83 265.16 264.87 265.23 0.00489 1.52 139.24 196.07 0.45 Blackjack lower 0 100yr opt bc‐viaduct 147 263.83 265.16 264.87 265.23 0.00489 1.52 139.24 196.07 0.45 Blackjack lower 0 100yr opt bc wall leve 147 263.83 265.17 264.92 265.26 0.006407 1.85 125.7 182.05 0.53
Reach River Sta Profile Plan Q Total Min Ch El W.S. Elev Crit W.S. E.G. Elev E.G. Slope Vel Chnl Flow Area Top Width Froude # Chl (m3/s) (m) (m) (m) (m) (m/m) (m/s) (m2) (m)
Blackjack lower 0 100yr opt b wall leve 147 263.83 265.17 264.91 265.25 0.006464 1.78 126.33 182.22 0.51
Blackjack lower ‐0.1 100yr existing opt b 147 263.83 265.12 264.87 265.2 0.005894 1.63 130.53 194 0.5 Blackjack lower ‐0.1 100yr viaduct opt b 147 263.83 265.12 264.87 265.2 0.0059 1.63 130.48 193.99 0.5 Blackjack lower ‐0.1 100yr opt bc‐viaduct 147 263.83 265.12 264.87 265.2 0.0059 1.63 130.48 193.99 0.5 Blackjack lower ‐0.1 100yr opt bc wall leve 147 263.83 265.11 264.92 265.22 0.00805 2.01 116.27 179.86 0.59 Blackjack lower ‐0.1 100yr opt b wall leve 147 263.83 265.12 264.91 265.22 0.008091 1.94 117 180.06 0.57
Blackjack lower ‐0.5 100yr existing opt b 147 263.62 265.03 264.69 265.09 0.004125 1.42 146.55 205.24 0.42 Blackjack lower ‐0.5 100yr viaduct opt b 147 263.62 265.03 264.69 265.09 0.004117 1.42 146.5 204.66 0.42 Blackjack lower ‐0.5 100yr opt bc‐viaduct 147 263.62 265.03 264.69 265.09 0.004117 1.42 146.5 204.66 0.42 Blackjack lower ‐0.5 100yr opt bc wall leve 147 263.62 265.03 264.69 265.09 0.004117 1.42 146.5 204.66 0.42 Blackjack lower ‐0.5 100yr opt b wall leve 147 263.62 265.03 264.69 265.09 0.004117 1.42 146.5 204.66 0.42
Blackjack lower ‐0.6 100yr existing opt b 147 263.44 264.88 264.54 264.94 0.003982 1.36 145.28 186.16 0.41 Blackjack lower ‐0.6 100yr viaduct opt b 147 263.44 264.88 264.54 264.94 0.003982 1.36 145.28 186.16 0.41 Blackjack lower ‐0.6 100yr opt bc‐viaduct 147 263.44 264.88 264.54 264.94 0.003982 1.36 145.28 186.16 0.41 Blackjack lower ‐0.6 100yr opt bc wall leve 147 263.44 264.88 264.54 264.94 0.003982 1.36 145.28 186.16 0.41 Blackjack lower ‐0.6 100yr opt b wall leve 147 263.44 264.88 264.54 264.94 0.003982 1.36 145.28 186.16 0.41
Blackjack lower ‐0.7 100yr existing opt b 147 263.02 264.27 264.25 264.53 0.018448 2.68 76.82 133.1 0.86 Blackjack lower ‐0.7 100yr viaduct opt b 147 263.02 264.27 264.25 264.53 0.018448 2.68 76.82 133.1 0.86 Blackjack lower ‐0.7 100yr opt bc‐viaduct 147 263.02 264.27 264.25 264.53 0.018448 2.68 76.82 133.1 0.86 Blackjack lower ‐0.7 100yr opt bc wall leve 147 263.02 264.27 264.25 264.53 0.018448 2.68 76.82 133.1 0.86 Blackjack lower ‐0.7 100yr opt b wall leve 147 263.02 264.27 264.25 264.53 0.018448 2.68 76.82 133.1 0.86
Blackjack lower ‐1 100yr existing opt b 147 262.21 264.01 263.57 264.06 0.002513 1.17 171.64 187.77 0.33 Blackjack lower ‐1 100yr viaduct opt b 147 262.21 264.01 263.57 264.06 0.002513 1.17 171.64 187.77 0.33 Blackjack lower ‐1 100yr opt bc‐viaduct 147 262.21 264.01 263.57 264.06 0.002513 1.17 171.64 187.77 0.33 Blackjack lower ‐1 100yr opt bc wall leve 147 262.21 264.01 263.57 264.06 0.002513 1.17 171.64 187.77 0.33 Blackjack lower ‐1 100yr opt b wall leve 147 262.21 264.01 263.57 264.06 0.002513 1.17 171.64 187.77 0.33

Reach River Sta Profile Plan Q Total Min Ch El W.S. Elev Crit W.S. E.G. Elev E.G. Slope Vel Chnl Flow Area Top Width Froude # Chl (m3/s) (m) (m) (m) (m) (m/m) (m/s) (m2) (m)
Blackjack lower ‐2 100yr existing opt b 147 262.21 263.55 263.55 263.78 0.0123 2.37 91.71 193.49 0.72 Blackjack lower ‐2 100yr viaduct opt b 147 262.21 263.55 263.55 263.78 0.0123 2.37 91.71 193.49 0.72 Blackjack lower ‐2 100yr opt bc‐viaduct 147 262.21 263.55 263.55 263.78 0.0123 2.37 91.71 193.49 0.72 Blackjack lower ‐2 100yr opt bc wall leve 147 262.21 263.55 263.55 263.78 0.0123 2.37 91.71 193.49 0.72 Blackjack lower ‐2 100yr opt b wall leve 147 262.21 263.55 263.55 263.78 0.0123 2.37 91.71 193.49 0.72
Blackjack lower ‐2.5 Culvert
Blackjack lower ‐3 100yr existing opt b 147 262.12 263.34 263.34 263.61 0.015845 2.64 77.44 134.02 0.8 Blackjack lower ‐3 100yr viaduct opt b 147 262.12 263.34 263.34 263.61 0.015845 2.64 77.44 134.02 0.8 Blackjack lower ‐3 100yr opt bc‐viaduct 147 262.12 263.34 263.34 263.61 0.015845 2.64 77.44 134.02 0.8 Blackjack lower ‐3 100yr opt bc wall leve 147 262.12 263.34 263.34 263.61 0.015845 2.64 77.44 134.02 0.8 Blackjack lower ‐3 100yr opt b wall leve 147 262.12 263.34 263.34 263.61 0.015845 2.64 77.44 134.02 0.8
Blackjack lower ‐4 100yr existing opt b 147 261.76 262.91 262.5 262.98 0.005317 1.38 127.79 152.99 0.46 Blackjack lower ‐4 100yr viaduct opt b 147 261.76 262.91 262.5 262.98 0.005317 1.38 127.79 152.99 0.46 Blackjack lower ‐4 100yr opt bc‐viaduct 147 261.76 262.91 262.5 262.98 0.005317 1.38 127.79 152.99 0.46 Blackjack lower ‐4 100yr opt bc wall leve 147 261.76 262.91 262.5 262.98 0.005317 1.38 127.79 152.99 0.46 Blackjack lower ‐4 100yr opt b wall leve 147 261.76 262.91 262.5 262.98 0.005317 1.38 127.79 152.99 0.46

Appendix C
PIER ARRANGEMENT


Appendix D
HEC-RAS LONGITUDINAL SECTION

100 200 300 400 500 600 700
262
264
266
268
270
272
Blackjack Creek Flood Study KBR 2 Plan: 1) existing opt b 20/11/2013 2) viaduct opt b 19/11/2013 3) opt bc-viaduc t 20/11/2013 4) opt bc wall leve 20/11 /2013 5) opt b wall le ve 20/11/2013
Main Channel Distance (m)
Ele
vatio
n (
m)
Legend
WS 100yr - existing opt b
WS 100yr - viaduct opt b
WS 100yr - opt bc-viaduct
WS 100yr - opt bc wall leve
WS 100yr - opt b wall leve
Crit 100yr - opt bc wall leve
Crit 100yr - opt b wall leve
Crit 100yr - opt bc-viaduct
Crit 100yr - viaduct opt b
Crit 100yr - existing opt b
Ground
Blackj ack Creek Blackjacklower
400 450 500 550 600 650 264
265
266
267
268
Blackjack Creek Flood Study KBR 2 Plan: 1) existing opt b 20/11/2013 2) viaduct opt b 19/11/2013 3) opt bc-viaduc t 20/11/2013 4) opt bc wall leve 20/11 /2013 5) opt b wall le ve 20/11/2013
Main Channel Distance (m)
Ele
vatio
n (
m)
Blackj ack Creek Blackjacklower
Legend
WS 100yr - existing opt b
WS 100yr - viaduct opt b
WS 100yr - opt bc-viaduct
WS 100yr - opt bc wall leve
WS 100yr - opt b wall leve
Crit 100yr - opt bc wall leve
Crit 100yr - opt b wall leve
Crit 100yr - opt bc-viaduct
Crit 100yr - viaduct opt b
Crit 100yr - existing opt b
Ground

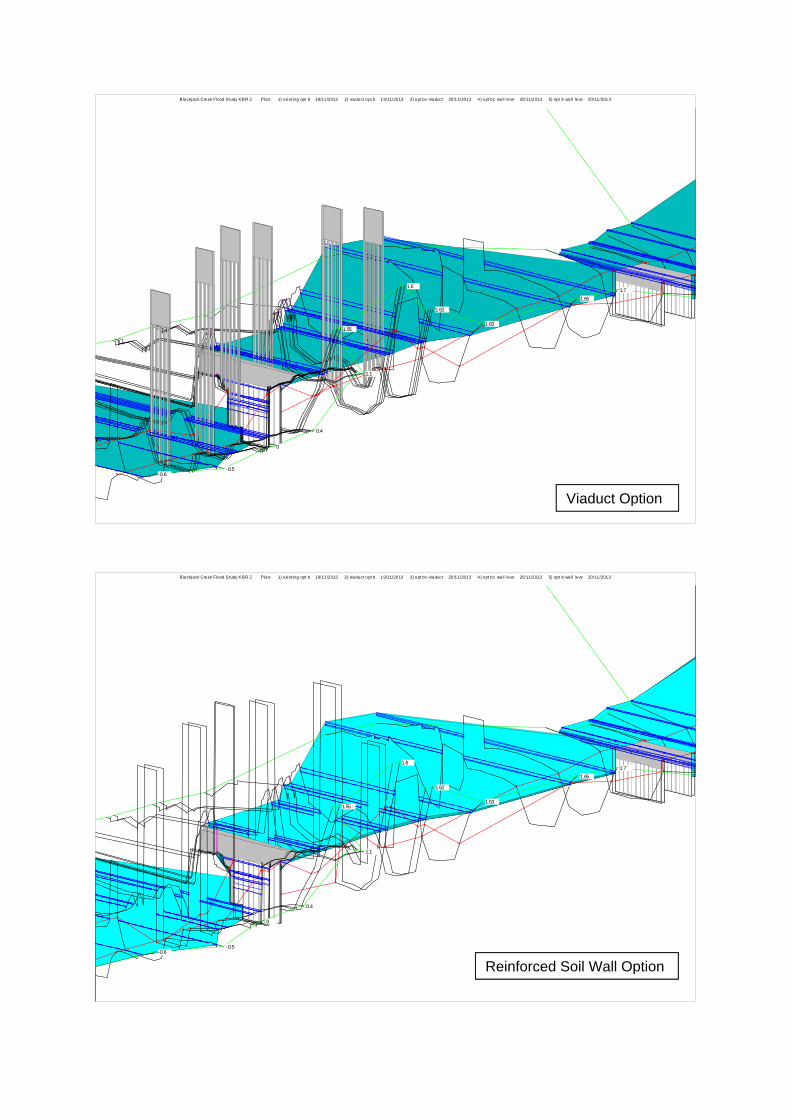
Appendix E
HEC-RAS PERSPECTIVE PLOT
VIADUCT OPTIONS
-0.6
Blackjack Creek Flood Study KBR 2 Plan: 1) existing opt b 19/11/2013 2) viaduct opt b 19/11/2013 3) opt bc-viaduc t 20/11/2013 4) opt bc wall leve 20/11/2013 5) opt b wa ll leve 20/11/2013
1.6 1.7
1.65
1.62
1.63 1.55
1.1
0.4
0
-0.5
Viaduct Option
Blackjack Creek Flood Study KBR 2 Plan: 1) existing opt b 19/11/2013 2) viaduct opt b 19/11/2013 3) opt bc-viaduc t 20/11/2013 4) opt bc wall leve 20/11/2013 5) opt b wa ll leve 20/11/2013
1.6 1.7
1.65
1.62
1.63 1.55
1.1
0.4
0
-0.5 -0.6
Reinforced Soil Wall Option

Appendix F
ASHFORD WATERCOURSE CATCHMENT


Appendix G
RORB PLAN

P
P
P
P
P
PP
P
P
P
P
RORB model by Lyall
P
P
P
P
P
PP
P
P
P
P
P
RORB model by KBR
Ashford
Watercourse
added

Appendix H
HEC-RAS PLAN

Blackjacktriuppe
11.5 10.7
Blackjacktrib2
13
11
10.5
Blackjack Creek
Blackjack upper
10
9.7
Blackjacktriblo
10.5
10.15*
10
Blackjack Creek
Blackjack lower
9
8.5
8
7.5*
7
6 5.5
5
4
3.5*
3
2.5 1.95
1.65 1.63 1.595
1.1 0
-0.6
-1 -2.5
-4
Bla
ck
jac
kC
re
ek
blackjack
blackjacktri
