hydrology 4 - report
TRANSCRIPT

Catchment Hydrology - Practical 4 Report Cobain Schofield
1 | Page
Assessing the extent to which phosphorus is impacting the trophic status of Loweswater, Cumbria
Introduction
This report aims to assess the extent to which phosphorus is impacting on the trophic status of Loweswater
Lake in Cumbria, UK as shown in Figure 1.
Figure 1 - Location of Loweswater within the United Kingdom
Loweswater Lake is situated at 54.6 degrees latitude and at approximately 130m altitude, in an area of the
UK which has an annual average temperature of 9 degrees Celsius and receives an average of 1500mm of
rainfall per year. According to Figure 2, this places Loweswater within the range of a dimictic lake.
Figure 2 – The global distribution of thermal lake types in relation to latitude and altitude (Wetzel, 1975) from Chowdrey et al (2014).
The dimictic nature of Loweswater means that it should theoretically stratify twice each year; once in
summer and once in winter, whilst full mixing of the lake will occur in spring and autumn at which point the
lake is isothermal. The implication of this is that particles which are washed into the lake become trapped in
200m
N
Google Maps
Loweswater

Catchment Hydrology - Practical 4 Report Cobain Schofield
2 | Page
greater quantities during stratification, whilst particles are largely held in suspension during mixing. The
lake can therefore be viewed as a particle trap during stratification, and during mixing the particles in
suspension are able to chemically trap freely available phosphate ions in the water. This effectively
removes the trapped ions from the system once the particles settle into the sediment after the lake
stratifies. In abstract, this means that Loweswater has the potential to remove phosphorus from the water
as it flows through. In the case of most lakes, and in the case of Loweswater, phosphorus is the limiting
nutrient of primary production (Elser et al, 2007). According to Elser et al, phosphorus levels have been
‘massively altered’ by anthropogenic activities and land use. Given the status of phosphorus as a limiting
nutrient, varying levels of phosphorus in the lake could potentially cause primary production to be too low if
phosphorus is present in low concentrations, or it could cause primary production to occur beyond the
lake’s ecological limits if it is present in high enough concentrations (Søndergaard et al, 2003). It is
therefore imperative that phosphorus levels in Loweswater are monitored so as to assess the trophic status
of the lake and to work out potential management strategies to mitigate any negative effects that occur.
Methods Employed
In order to establish the trophic status of Loweswater, data must be obtained or produced. First, water
sampled at each inflow stream into Loweswater was measured using methods outlined in Carlson and
Simpson (1996) in order to obtain values for the total phosphorus content of each sample. Once these
values are obtained, they could be applied to a basic box model to work out how much phosphorus enters
the lake, is trapped as sediment, and leaves the lake in the outflow stream(s). The box model is shown
below in Figure 3. Table 1 shows the parameters used in and produced by the box model.
Figure 3 - A basic phosphorus box model outlined in Imboden (1974)
L A K E
Lin = Lsed + Lout
(inflow loading = sediment loading + outflow loading) Lin = qin * TPin
(qin is the water influx and
TPin is the TP conc. of
inflow water)
Lout = qout * TPout
(qout is the water influx and
TPout is the TP conc. of
outflow water)
Lsed = Psed burial flux * Alake
(where Psed is the sediment
phosphorus burial rate)
Lin
Lout
Lsed
The box model assumes a
closed system, so everything
that enters must either leave
the system or stay within it.

Catchment Hydrology - Practical 4 Report Cobain Schofield
3 | Page
Table 1 – Parameter dictionary and data origins
Parameter Origin of the data Description Units *
Lin
Box Model
= Lout + Lsed kg/yr
Lout = qout * TPout kg/yr
Lsed = Psed burial flux * Alake kg/yr
Alake Calculated using maps
Area of the lake km2
Acatchment Area of the catchment km2
qin Calculated from climatic data
Water inflow m3/yr
qout Water outflow m3/yr
qs,in Calculated using qin/qout and Alake Normalised water fluxes m/yr
qs,out
TPin
Measured from water samples
Total phosphorus entering lake mg/L (g/m3)
TPsed Total phosphorus in sediment mg/L (g/m3)
TPout Total phosphorus leaving lake mg/L (g/m3)
MAR Calculated using the Turc (1954) equation, requires MAP and MAT
Mean Annual Runoff mm/yr
MAE = (MAP/[0.9 + (MAP/k)2]0.5) Mean Annual Actual Evaporation mm/yr
k = 300 + 25MAT + 0.05MAT3 Empirical coefficient
MAP Values provided; Met Office
Mean Annual Precipitation mm/yr
MAT Mean Annual Temperature degrees Celsius
Rp Calculated using methods outlined by Kirchner and Dillon (1975)
Phosphorus Retention Coefficient
*parameter values may not necessarily be in these units; conversions may be necessary for certain calculations.
When using the box model it is important to remember that this is a simple base model for understanding a
much more complex system. As such, there are some large uncertainties associated with values,
particularly Lin, which has a number of factors affecting it (each with potential for large variation) and
cannot be measured all of the time.
Using parameters from Table 1, it is possible to work out the retention coefficient of phosphorus within
Loweswater using the Kirchner and Dillon (1975) equation:
𝑅𝑝 = 0.426 exp(−0.271𝑞𝑠,𝑜𝑢𝑡) + 0.574 exp (−0.00949𝑞𝑠,𝑜𝑢𝑡)
The numbers calculated or provided for Loweswater (see appendix 1) can be substituted into the above
equation to give an estimated value for phosphorus retention for the lake:
𝑅𝑝 = 0.426 exp(−0.271 ∗ 14.5) + 0.574 exp (−0.00949 ∗ 14.5)
𝑅𝑝 = 0.509
Now that Rp has been established it is possible to check whether the values from the box model are within
the acceptable range considering uncertainties. To do this, the following equation can be used:
𝐿𝑠𝑒𝑑 = 𝐿𝑖𝑛 ∗ 𝑅𝑝
𝐿𝑠𝑒𝑑 = 268 ∗ 0.509
𝑳𝒔𝒆𝒅 = 𝟏𝟑𝟔 𝒌𝒈/𝒚𝒓
(Calculated Lsed = 160kg/yr from Appendix 1)

Catchment Hydrology - Practical 4 Report Cobain Schofield
4 | Page
𝐿𝑜𝑢𝑡 = (1 − 𝑅𝑝) ∗ 𝐿𝑖𝑛
𝐿𝑜𝑢𝑡 = (1 − 0.509) ∗ 268
𝑳𝒐𝒖𝒕 = 𝟏𝟑𝟐 𝒌𝒈/𝒚𝒓
(Calculated Lout = 120kg/yr from Appendix 1)
For the purpose of this report, the value for Lin will be taken from the mass balance of the lake (Lout+Lsed),
the values of which will be those produced by the box model and included in Appendix 1. Using this data,
the Lin value is calculated to be 280kg/yr (labelled in Appendix 1 as [Lin (mass balance)]), which is very
close to the box model output of 268kg/yr considering the uncertainties involved.
Trophic status of Loweswater
The trophic status of a lake describes its metabolism and is based on the nutrient supply from both the
catchment of the lake and from within the lake itself. In the case of Loweswater, it has already been
established that phosphorus is the limiting nutrient, so the lake’s metabolism is dependent on phosphorus
more so than any other nutrient.
Figure 4 - Phosphorus boundary values for fixed trophic classification system (P in µg/L == mg/m3) based on Ryding and Rast (1992, Chapter 7).
The trophic status of the lake is given by the value of TPlake. A back-of-the-envelope value can be obtained
by simply calculating TPin - TPout to work out what is left behind, and is based on the data in Appendix 1.
This gives a value of 0.018mg/L, or 155kg/year of phosphorus at lake scale. This value has been included
on Figure 4 and marked ‘A’ (18µg/L). However, this value represents only a single-framed snapshot of the
phosphorus entering the lake and is based upon assumptions and calculations from a variety of academic
texts. To give a more representative value of TPlake multiple measurements of water influx should be used
where possible. Data was provided for Dub Beck (Inflow stream 10 on Appendix 2) at Loweswater. The
average TPlake value was calculated across the year 2012 - 2013 as 12.6mg/m3 and is included on the
Figure 4 as line ‘B’ (12.6µg/L). The data is available in its raw form in Appendix 3. While this reflects a truer
value for the lake, the data point resolution is still low (Figure 5). This means that large storm events, or
times of low flow could see positive and negative spikes away the mean amount of phosphorus entering the
lake, affecting the overall mean and therefore the interpretation of the lake’s trophic state. This is a
limitation which is only rectifiable by increasing the amount of measuring points around the lake and the
frequency at which they are measured at.
Ultra-oligotrophic Oligotrophic Mesotrophic Eutrophic Hypertrophic
<4.0
<10
.00
10 -
35
35 -
10
0
>10
0
A B

Catchment Hydrology - Practical 4 Report Cobain Schofield
5 | Page
Figure 5 - A graph showing the individual data points set out in Appendix 3, showing TPlake values across the year 2012 – 2013 with the trend line y=0.0024x-86.352 centered on 12.6mg/m3 (point B on Figure 4)
The approximated TPlake value of 12.6mg/m3 still supports the box model TPlake value of 18mg/m3 in that
they both fall comfortably within the range of mesotrophic on the diagram in Figure 4 (Ryding and Rast,
1974 [Chapter 7]).
Managing Eutrophication in Loweswater
Given the limited scope of the data available to produce the graphs in Figures 4 and 5, and to eventually
deduce that Loweswater is a mesotrophic lake, it is important to take larger datasets into account when
considering the wider picture. Boyle et al (2000) took measurements of phosphorus and phytoplankton
during their study which gives a more complete picture of lake quality based on findings by Riding and Rast
(1992). Their report found - based on their own data and other published data - that Loweswater is a
mesotrophic to mildly eutrophic lake, and that it has experienced “slight nutrient enrichment over the last
century”. It is reasonable to assume that this nutrient enrichment is the result of anthropogenic activity as
described by Elser et al (2007). Therefore, management strategies might be considered in order to prevent
the lake exceeding the natural productivity allowed by its catchment.
One approach could be to create a pre-reservoir which would have the sole purpose of capturing as much
phosphorus as possible from inflow streams prior to draining into Loweswater. The box model outlined in
Figure 3 can be re-run for the new reservoir after its boundaries and catchment have been established and
areas calculated using OS maps. It is then possible to reassess the trophic conditions within Loweswater
after the pre-reservoir has been built.
Firstly it is necessary to establish possible locations for pre-reservoirs. These must be able to cover a
sizable portion of the overall catchment in order to intercept as much phosphorus as possible (Figure 6).
y = 0.0024x - 86.352R² = 0.0108
10
12
14
16
18
20
29/0
8/2
01
2
18/1
0/2
01
2
07/1
2/2
01
2
26/0
1/2
01
3
17/0
3/2
01
3
06/0
5/2
01
3
25/0
6/2
01
3
14/0
8/2
01
3
03/1
0/2
01
3
22/1
1/2
01
3
11/0
1/2
01
4
TP
lake
(mg
/m3)
Date of water sample

Catchment Hydrology - Practical 4 Report Cobain Schofield
6 | Page
Figure 6 - Potential locations for pre-reservoirs within the Loweswater Catchment
(all maps in Figure 6 © Crown Copyright and Database Right 2014. Ordnance Survey (Digimap Licence))
Figure 6.a – Pre-reservoir 1 (North)
Figure 6.b – Pre-reservoir 2 (East)
Figure 6.b – Pre-reservoir 2 (East)
Table i – Pre reservoir 1 parameter values
Catchment Area (km2) 4.32
Reservoir Area (km2) 0.10
MAR (m/yr) 0.97
TP (mg/m3) 30.4
Lsed (kg/yr) 49.3
Loweswater Lin Change (%)
-17.6
Table ii – Pre reservoir 2 parameter values
Catchment Area (km2) 0.6
Reservoir Area (km2) 0.07
MAR (m/yr) 0.97
TP (mg/m3) 30.4
Lsed (kg/yr) 10.0
Loweswater Lin Change (%)
-3.6
1000m
N
N
1000m

Catchment Hydrology - Practical 4 Report Cobain Schofield
7 | Page
Figure 6.c – Pre-reservoir 3 (West)
Now that the potential sites have been established, the current land uses of the Loweswater catchment
must be considered in order to properly assess the advantages and disadvantages associated with the
proposed pre-reservoirs. Figure 7 shows a generalised land use summary of the catchment.
Figure 7 - Generalised land use summary for Loweswater catchment, based on OS Mastermap data displayed in Table 2.
Table iii – Pre reservoir 3 parameter values
Catchment Area (km2) 1.3
Reservoir Area (km2) 0.20
MAR (m/yr) 0.97
TP (mg/m3) 30.4
Lsed (kg/yr) 23.7
Loweswater Lin Change (%)
-8.4 1000m
N
Catchment Hydrology - Practical 4 Report Cobain Schofield
8 | Page
Table 2 - Generalised land use summary for Loweswater from OS Mastermap data, used to make Figure 7 in ArcGIS
Total Area (km2)
P Loadings (kg/P/yr/m2)
TP (kg/P/yr) (area * loading)
Percentage of Catchment
Improved Pasture 2.04 30 61.2 44
Unimproved Pasture 1.04 5 5.2 4
Forest 0.63 35 22.0 16
Idle land 5.16 10 51.6 37
Atmospheric (Forested) 0.63 20 12.6 11
Atmospheric (Rural) 8.27 12 99.24 89
Catchment Sum 8.9 112 140.05 100
Loadings used in Table 2 (and pre-reservoir summaries included in Appendix 4) have been estimated using
chapter 7 of Ryding and Rast (1992), shown in Figure 8 below.
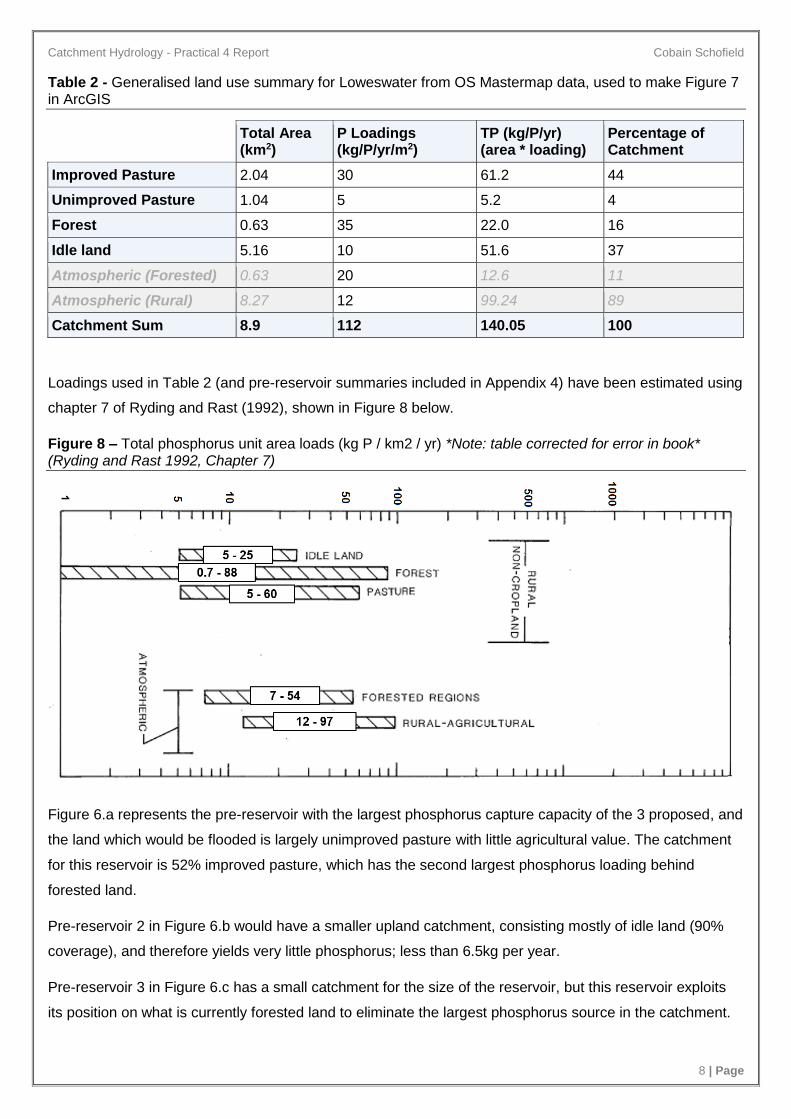
Figure 8 – Total phosphorus unit area loads (kg P / km2 / yr) *Note: table corrected for error in book* (Ryding and Rast 1992, Chapter 7)
Figure 6.a represents the pre-reservoir with the largest phosphorus capture capacity of the 3 proposed, and
the land which would be flooded is largely unimproved pasture with little agricultural value. The catchment
for this reservoir is 52% improved pasture, which has the second largest phosphorus loading behind
forested land.
Pre-reservoir 2 in Figure 6.b would have a smaller upland catchment, consisting mostly of idle land (90%
coverage), and therefore yields very little phosphorus; less than 6.5kg per year.
Pre-reservoir 3 in Figure 6.c has a small catchment for the size of the reservoir, but this reservoir exploits
its position on what is currently forested land to eliminate the largest phosphorus source in the catchment.

Catchment Hydrology - Practical 4 Report Cobain Schofield
9 | Page
However, given the status of the forested land, this makes building a pre-reservoir here ecologically
unsustainable.
Conclusion
Based on the results of the box model and the subsequent analysis of the Loweswater catchment, the
optimal solution given the restrictive nature of the data would be to build a pre-reservoir at site 1 (Figure
6.a) to reduce the phosphorus loading of Loweswater by 17.6%. This site is best suited over the alternative
sites because it encompasses the largest collection of high-phosphorus producing land within its catchment
and therefore will have the highest phosphorus:catchment-area ratio of the 3 reservoirs. The trophic status
of the lake would not change, but the fixed-trophic classification number (Figure 4) would reduce from 12.6
to 11.3, making the lake border-line oligotrophic-mesotrophic. However, the flooding of this land would
impact at least 5 collections of buildings (Appendix 5) which would incur economic and social issues
associated with relocation agreements, and the pre-reservoir might have a negative ecological impact on
the environment since the problem of eutrophication is not being dealt with per se, but rather is being
moved elsewhere on a smaller scale. This new pre-reservoir would require dredging to remove phosphorus
to ensure that it did not end up becoming a eutrophic lake (or higher up the scale in Figure 4) or that the
excess phosphorus in solution during mixing did not simply wash out into Loweswater, rendering the pre-
reservoir pointless. Providing this pre-reservoir was well-managed, the effects that it has on Loweswater
would be seen very quickly, whereas land use management changes within the catchment could take much
longer to establish, and longer again before quantifiable results are available. Therefore, considering the
limitations of the data made available in this report, it is recommended that pre-reservoir 1 (north) should be
built to the specification detailed in Figure 6.a Table i as the principle management solution for Loweswater.

Catchment Hydrology - Practical 4 Report Cobain Schofield
10 | Page
References
Boyle. J, Bennion. H, Appleby. P, Carvalho. L, Luckes. S, Henderson, A (2000). “Water Quality Investigation of Loweswater, Cumbria”. Final report to the Environment Agency; May 2000. Environmental Change Research Centre, London.
Carlson, R.E. and J. Simpson. (1996). “A Coordinator’s Guide to Volunteer Lake Monitoring Methods”. North American Lake Management Society. 96 pp.
Chowdrey S, Hasan K, Alam K. (2014). “The Use of an Aeration to Prevent Thermal Stratification of Water Bodies: Pond, Lake and Water Supply Reservior”. Applied Ecology and Enivornmental Sciences Journal. 2014 Volume 2, No. 1. Page 3. DOI: 10.12691/AEES-2-1-1
Elser J, Matthew E, S. Bracken, Elsa E. Cleland, Daniel S. Gruner, W. Stanley Harpole, Helmut Hillebrand, Jacqueline T. Ngai, Eric W. Seabloom, Jonathan B. Shurin and Jennifer E. Smith. (2007). “Global analysis of nitrogen and phosphorus limitation of primary producers in freshwater, marine and terrestrial ecosystems”. Ecology Letters. Vol 10, issue 12, p1135-1142. DOI: 10.1111/j.1461-0248.2007.01113.x
Imboden, D. M. (1974). “Phosphorus model of Lake Eutrophication”. Swiss Federal Institute for Water Resrouces and Water Pollution Control (EAWAG), Dübendorf.
Met Office. (2014). “What are seasons?”. UK Met Office. Available online at: http://www.metoffice.gov.uk/learning/learn-about-the-weather/how-weather-works/seasons. Last Accessed: 12th December 2014.
Ryding S and Rast W. (1992). “The control of eutrophication of lakes and reservoirs”. Paris. Unesco and the Parthenon Publishing group.
Søndergaard, M., Jensen, J., Jeppesen, E. (2003). “Role of sediment and internal loading of phosphorus in shallow lakes”. Hydrobiologia 506. p135-145. Kluwer Academic Publishing, Netherlands.
Turc, L. 1954: “Calcul du bilan de l’eau evaluation en fonction des precipitations et des temperatures”. IASH Symposium, Rome 188-202.
Wetzel, R. G. (1975). “Limnology”. 743 pp. WB Saunders Co., Philadelphia

Catchment Hydrology - Practical 4 Report Cobain Schofield
11 | Page
Appendices
Appendix 1 :: Parameter values for parameters listed in Table 1
Appendix 2 :: Inflow stream locations for Loweswater
Appendix 3 :: Temporal Variation of Phosphorus Influx
Appendix 4 :: Land use summaries for proposed pre-reservoirs for Loweswater
Appendix 5 :: Buildings impacted by building Pre-reservoir 1

Catchment Hydrology - Practical 4 Report Cobain Schofield
12 | Page
Appendix 1 :: Parameter values for parameters listed in Table 1
This table contains the initial dataset after running the box model for Loweswater
Parameter Value Units *
Lin 268 kg/yr
Lout 120 kg/yr
Lsed 160 kg/yr
Lin (mass balance) 280 kg/yr
Alake 0.6 km2
Acatchment 8.9 km2
qin 8641154 m3/yr
qout 9262541 m3/yr
qs,in 13.5 m/yr
qs,out 14.5
TPin 0.031 mg/L (g/m3)
TPout 0.013 mg/L (g/m3)
TPsed 0.018 mg/L (g/m3)
MAR 970 mm/yr
MAE 529 mm/yr
k 561
MAP 1500 mm/yr
MAT 9 degrees Celsius
Rp 0.509
*parameter values may not necessarily be in these units; conversions may be necessary for certain calculations.

Catchment Hydrology - Practical 4 Report Cobain Schofield
13 | Page
Appendix 2 :: Inflow Stream locations for Loweswater
Stream ID Latitude Longitude Flow litre/s
Catchment area km2
1 54.57715 -3.340821 90 8.2237
2 54.5782 -3.352949 0.5 0.118
3 54.58044 -3.357977 0.6 0.118
4 54.58325 -3.359232 1.5 0.975
5a 54.58445 -3.36425 0.4 0.047
5 54.58425 -3.36496 0.6 0.047
6 54.58487 -3.365802 2 0.463
7 54.58556 -3.366054 0.3 0.008
8 54.58618 -3.367279 0.05 0.024
9 54.5879 -3.366591 0.01 0.01
10 54.58949 -3.368307 2.5 3.243
11 54.58865 -3.363671 0.1 0.0215
12a 54.58849 -3.361044 0.025 0.037
12 54.58834 -3.360375 0.05 0.0103
15a 54.58261 -3.349123 0.1 0.044
15 54.58177 -3.347776 3 0.892
N

Catchment Hydrology - Practical 4 Report Cobain Schofield
14 | Page
Appendix 3 :: Temporal Variation of Phosphorus Influx at Dub Beck
** NOTE: Dub Beck is listed in Appendix 2 as stream 10 ** - Seasonal definitions obtained from Met Office (Met Office, 2014).
Inflow # Inflow # Lake Lake Outflow Outflow
TP SRP TP SRP TP SRP
mg/m3 mg/m3 mg/m3 mg/m3 mg/m3 mg/m3
DATE
Avg season mg/m3
(P measured in mg/m3)
Winter 22/01/2013 7.6 2.6 13.8 1.4 11.4 1.1 In 6.95 0.0070
Winter Inflow 0.007
26/02/2013 6.3 2.8 12.5 1.8 10.6 1 Out 11.00 0.0110 Outflow 0.011
Spring 18/03/2013 20.1 6.3 10.2 1.4 11 1 In 14.40 0.0144
Spring Inflow 0.014
23/04/2013 11.8 3.7 10.3 1.7 11.7 3 Out 13.30 0.0133 Outflow 0.013
29/04/2013 10.7 1.1
Summer Inflow 0.011
20/05/2013 11.3 3.7 10.5 1.1 17.2 3.2 Outflow 0.014
Summer 25/06/2013 12.3 3.1 11.8 1.8 12.7 2 In 11.37 0.0114
Autumn Inflow 0.063
17/07/2013 9.5 5.4 19.2 3.3 19.8 5.4 Out 13.90 0.0139 Outflow 0.013
19/07/2013 17.2 6.2
29/08/2013 12.3 4.5 14.7 2.3 9.2 1
Autumn 26/09/2013 56.4 19.1 10.3 1.7 10.6 1 In 63.64 0.0636
22/10/2013 163 23.3 10.4 1.2 14.7 2 Out 13.43 0.0134
18/11/2013 44.6 6.9 11.4 1 12.5 1
10/12/2013 9.6 3.2 13.7 1.2 15.9 1.3
16/10/2012 44.6 12 1.8
Average (mg/m3) 30.4 7.05 12.6 1.942857 13.10833 1.916667
Average (g/m3) 0.0304 0.00705 0.012 0.001943 0.013108 0.001917

Catchment Hydrology - Practical 4 Report Cobain Schofield
15 | Page
Appendix 4 :: Land use summaries for proposed pre-reservoirs for Loweswater
Pre reservoir 1 – Figure 6.a (plus Table i)
Total Area (km2)
P Loadings (kg/P/yr/m2)
TP (kg/P/yr/m2) (area * loading)
Percentage of Catchment
Improved Pasture 1.44 30 43.2 52
Unimproved Pasture 0.9 5 4.5 5
Forest 0.63 35 22.0 26
Idle land 1.35 10 13.5 16
Atmospheric (Forested) 0 0 0 0
Atmospheric (Rural) 4.32 12 51.84 100
Catchment Sum 4.32 92 140.05 100
Pre reservoir 2 – Figure 6.b (plus Table ii)
Total Area (km2)
P Loadings (kg/P/yr/m2)
TP (kg/P/yr/m2) (area * loading)
Percentage of Catchment
Improved Pasture 0 0 0 0
Unimproved Pasture 0 0 0 0
Forest 0.018 35 0.63 10
Idle land 0.582 10 5.82 90
Atmospheric (Forested) 0.018 20 0.36 5
Atmospheric (Rural) 0.582 12 6.98 95
Catchment Sum 0.6 77 6.45 100
Pre reservoir 3 – Figure 6.c (plus Table iii)
Total Area (km2)
P Loadings (kg/P/yr/m2)
TP (kg/P/yr/m2) (area * loading)
Percentage of Catchment
Improved Pasture 0 0 0 0
Unimproved Pasture 0 0 0 0
Forest 0.354 35 12.39 83
Idle land 0.846 10 2.49 17
Atmospheric (Forested) 0.354 20 7.08 71
Atmospheric (Rural) 0.846 12 2.95 29
Catchment Sum 1.3 77 14.85 100

Catchment Hydrology - Practical 4 Report Cobain Schofield
16 | Page
Appendix 5 :: Buildings affected by building pre-reservoir 1
N
300m
Pre-reservoir 1 outline
Buildings impacted by the reservoir