hydrology of the u.s. army pinon canyon maneuver … · 2011-01-12 · hydrology of the u.s. army...
TRANSCRIPT
HYDROLOGY OF THE U.S. ARMY PINON CANYON MANEUVER SITE,
LAS ANIMAS COUNTY, COLORADO
By Paul von Guerard, P.O. Abbott, and Raymond C. Nickless
U.S. GEOLOGICAL SURVEY
Water-Resources Investigations Report 87-4227
Prepared in cooperation with the
U.S. DEPARTMENT OF THE ARMY
FORT CARSON MILITARY RESERVATION
Denver, Colorado 1987
DEPARTMENT OF THE INTERIOR
DONALD PAUL MODEL, Secretary
U.S. GEOLOGICAL SURVEY
Dallas L. Peck, Director
For additional information write to:
District Chief U.S. Geological Survey Box 25046, Mail Stop 415 Denver Federal Center Denver, CO 80225-0046
Copies of this report can be purchased from:
U.S. Geological Survey Books and Open-File Reports Federal Center, Bldg. 810 Box 25425 Denver, CO 80225-0425
CONTENTS
Page Glossary----------------------------------------------------------------- viiiAbstract----------------------------------------------------------------- 1Introduction------------------------------------------------------------- 2
Purpose and scope--------------------------------------------------- 3Description of study area------------------------------------------- 6
Geologic setting--------------------------------------------------------- 9Geologic formations------------------------------------------------- 9Geologic structures------------------------------------------------- 12
Ground water------------------------------------------------------------- 14Dakota-Purgatoire aquifer------------------------------------------- 18
Hydraulic properties------------------------------------------- 20Well yields 21Water levels--------------------------------------------------- 21
Other aquifers------------------------------------------------------ 21Ground-water quality------------------------------------------------ 21
Specific conductance------------------------------------------- 26Major ions and dissolved solids-------------------------------- 27Iron and manganese--------------------------------------------- 29Selenium --- 29Radiochemicals------------------------------------------------- 30
Development considerations------------------------------------------ 31Surface water------------------------------------------------------------ 31
Streamflow characteristics------------------------------------------ 32
Contributions of tributary streamflow to the Purgatoire River-- 33Flow-duration analysis----------------------------------------- 35Historical floods---------------------------------------------- 36Flood-frequency analysis--------------------------------------- 36
Instream transit loss in Taylor Arroyo and its effects onstreamflow reaching the Purgatoire River--------------------- 41
Inflow to stock-watering reservoirs---------------------------- 43Surface-water rights------------------------------------------------ 45Surface-water quality----------------------------------------------- 56
Instream water-quality standards for the Purgatoire River------ 46Summary statistics of water-quality data----------------------- 47Dissolved solids----------------------------------------------- 48
Relations of dissolved solids and major ions to specificconductance--------------------------------------------- 50
Daily mean specific conductance for the Purgatoire River-- 52Dissolved-solids and suspended-sediment loads------------------ 52
Dissolved solids------------------------------------------ 53Suspended sediment---------------------------------------- 57
Sediment yields---------------------------------------------------------- 61Sediment yields measured from stock-watering reservoirs------------- 62Estimating sediment yields------------------------------------------ 64
Estimating sediment yields using drainage-basin characteristics 64 Estimating sediment yields using the Pacific Southwest Inter-
Agency Committee method-------------------------------------- 66Summary------------------------------------------------------------------ 70References cited--------------------------------------------------------- 72Supplemental information------------------------------------------------- 77
System of numbering streamflow-gaging stations---------------------- 78System of numbering well locations---------------------------------- 78
iii
PLATES
Plate 1. Map showing locations of surface-water, water-quality, andprecipitation data-collection network------------------In pocket
Plate 2. Map showing locations of inventoried wells, springs, andwater pipelines----------------------------------------In pocket
FIGURES
Page Figure 1. Map showing location of the Pinon Canyon Maneuver Site------- 3
2. Graph showing mean monthly precipitation at the Pinon CanyonManeuver Site for water years 1984 and 1985---------------- 7
3-7. Maps showing:3. Generalized soils--------------------------------------- 84. Generalized geology------------------------------------- 10
5. Major tectonic features in southeastern Colorado-------- 126. Structure contours of the top of the Cheyenne Sandstone
Member of the Purgatoire Formation-------------------- 137. Potentiometric level and direction of movement of water
in the Dakota-Purgatoire aquifer for water years 1984 and 1985 19
8. Graph showing water levels for eight selected wells at thePinon Canyon Maneuver Site for water year 1985------------- 22
9. Map showing areal distribution of ground-water samplescollected from the Dakota-Purgatoire aquifer--------------- 23
10-16. Graphs showing:10. Relation of specific conductance to concentrations of
dissolved solids in water from selected wells in the Dakota-Purgatoire aquifer at the Pinon Canyon Maneuver Site----------------------------------------- 27
11. Major water type and major-ion composition of water samples from 20 wells at the Pinon Canyon Maneuver Site 28
12. Concentrations of dissolved gross alpha radiation and dissolved radium-226 for three wells and a spring used for domestic water supply------------------------ 30
13. Monthly streamflow for the streamflow-gaging stations, Purgatoire River near Thatcher and Purgatoire River at Rock Crossing near Timpas, for water years 1984 and 1985 32
14. Flow-duration curves for the streamflow-gaging stations, Van Bremer Arroyo near Model and Purgatoire River near Thatcher -- 35
15. Estimated flood magnitude and frequency for thestreamflow-gaging station Van Bremer Arroyo near Model 37
16. Estimated flood magnitude and frequency for thestreamflow-gaging station Purgatoire River nearThatcher 38
IV
Page Figure 17. Map showing surface runoff for storm of August 19-22, 1984,
at the Pinon Canyon Maneuver Site -- - ---- - 43 18-28. Graphs showing:
18. Number of periods of surface runoff and total monthly surface runoff for the stock-watering reservoir network at the Pinon Canyon Maneuver Site for water years 1984 and 1985 44
19. Comparison of proportions of major ions for the stream- flow-gaging stations Van Bremer Arroyo near Model; Purgatoire River near Thatcher; Taylor Arroyo below Rock Crossing, near Thatcher; and Purgatoire River at Rock Crossing, near Timpas - --- - 49
20. Correlations and regressions of concentrations ofcalcium and sulfate to specific conductance at thestreamflow-gaging station Purgatoire River nearThatcher 51
21. Monthly dissolved-solids load for the 1985 water year at the streamflow-gaging stations Purgatoire River near Thatcher and Purgatoire River at Rock Crossing, near Timpas --- -- -- - 54
22. Relation between cumulative dissolved-solids load and daily mean streamflow for the streamflow-gaging stations Purgatoire River near Thatcher and Purgatoire River at Rock Crossing, near Timpas---- --- - - 55
23. Monthly dissolved-solids load for the streamflow- gaging station Van Bremer Arroyo near Model for water year 1985 56
24. Monthly suspended-sediment load for the streamflow- gaging station Purgatoire River near Thatcher for water years 1984 and 1985 58
25. Monthly suspended-sediment load for the streamflow- gaging station Purgatoire River at Rock Crossing, near Timpas for water years 1984 and 1985 - - 59
26. Relation between cumulative suspended-sediment load and daily mean streamflow for the streamflow-gaging stations Purgatoire River near Thatcher and Purgatoire River at Rock Crossing, near Timpas-- - --- - - 60
27. Variation of sediment yield with precipitation---- 6128. Relation between measured annual mean sediment yields
and estimated annual mean sediment yields using the Pacific Southwest Inter-Agency Committee (PSIAC) method ---- - - - -- -___ - 68
29. Diagram showing system of numbering wells, using township,range, and section - --- - 79
30-37. Graphs showing monthly streamflow for the streamflow-gaging station:
30. Big Arroyo near Thatcher, for water years 1984-85 8231. Van Bremer Arroyo near Tyrone, for water year 1985-- 8332. Van Bremer Arroyo near Model, for water years 1984-85- 8433. Taylor Arroyo below Rock Crossing, near Thatcher, for
water years 1984-85 8534. Lockwood Canyon Creek near Thatcher, for water years
1984-85 86
v
PageFigures 30-37. Graphs showing monthly streamflow for the streamflow-
gaging stations Continued:35. Red Rock Canyon Creek at mouth, near Thatcher, for
water years 1984-85 8736. Chacuaco Creek at mouth, near Timpas, for water
years 1984-85 88
37. Bent Canyon Creek at mouth, near Timpas, for wateryears 1984-85 89
38. Graph showing selected chemical properties and constitu ents with instream water-quality standards for the streamflow-gaging station Purgatoire River near Thatcher, for water years 1983-85 ---- 108
39. Graph showing selected chemical properties and constitu ents with instream water-quality standards for the streamflow-gaging station Purgatoire River at Rock Crossing, near Timpas, for water years 1983-85--------- 110
40-43. Graphs showing monthly suspended-sediment load for the streamflow-gaging station:
40. Big Arroyo near Thatcher, for water years 1984-85--- 11441. Taylor Arroyo below Rock Crossing, near Thatcher,
for water years 1984-85-- -- 115
42. Chacuaco Creek at mouth, near Timpas, for wateryears 1984-85- 116
43. Bent Canyon Creek at mouth, near Timpas, for wateryears 1984-85 117
TABLES
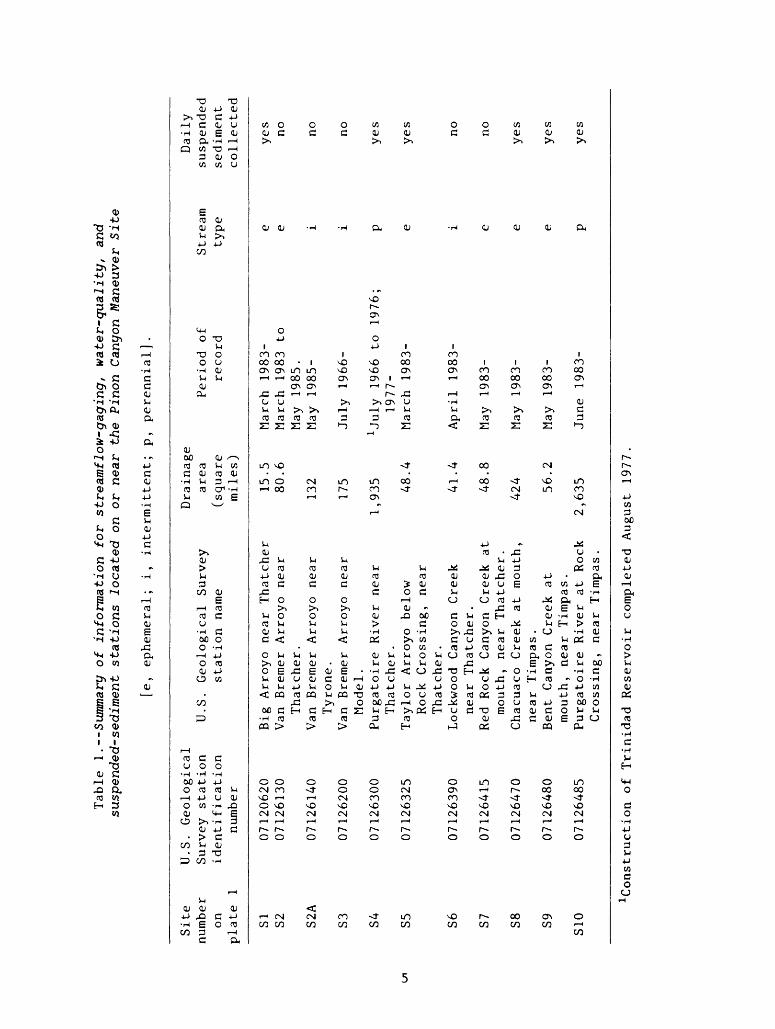
Table 1. Summary of information for streamflow-gaging, water-quality,and suspended-sediment stations located on or near the Pinon Canyon Maneuver Site----------------------------------------
2. The generalized stratigraphy and water-supply potential at the Pinon Canyon Maneuver Site----------------------------------
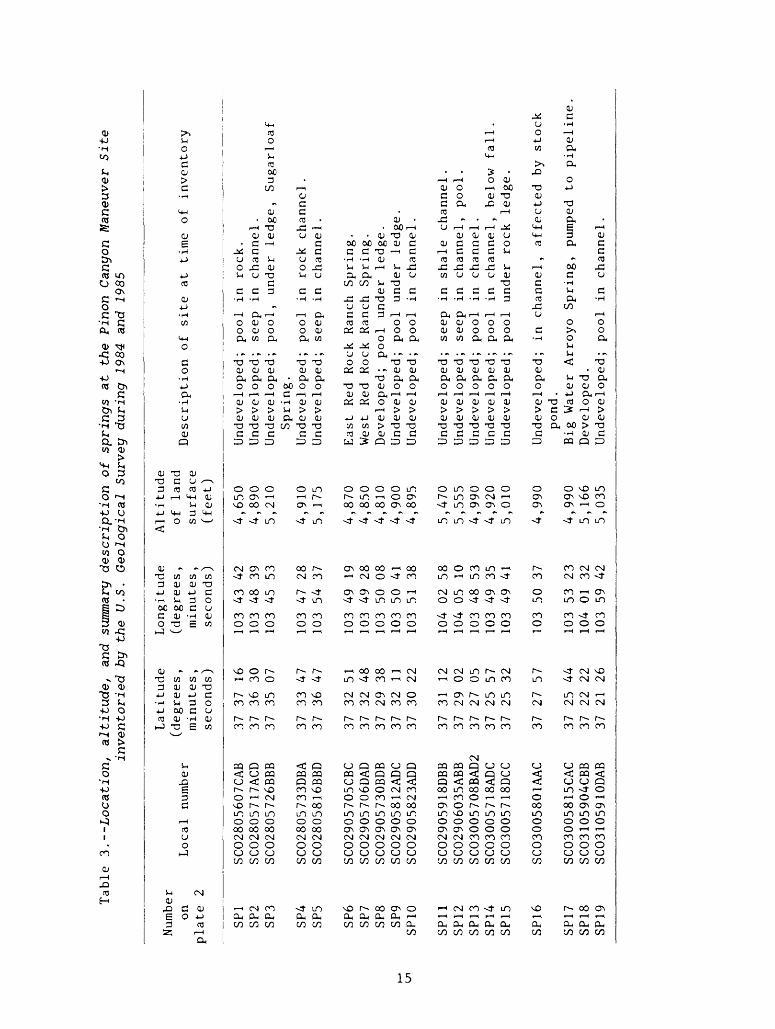
3. Location, altitude, and summary description of springs at the Pinon Canyon Maneuver Site inventoried by the U.S. Geological Survey during 1984 and 1985----------------------
4. Location, altitude, water level, and summary description of wells at the Pinon Canyon Maneuver Site inventoried by the U.S. Geological Survey during 1984 and 1985---
5. Name, location, decreed quantity, and appropriation date ofadjudicated wells at the Pinon Canyon Maneuver Site---------
6. Aquifer test results Dakota-Purgatoire aquifer, southeasternColorado----------------------------------------------------
7. Summary of ground-water-quality data for the Pinon CanyonManeuver Site-----------------------------------------------
8. Water-quality standards for selected constituents-------------9. Percent of ground-water sites from which water samples
exceeded water-quality standards for domestic or public- supply use--------------------------------------------------
Page
11
15
16
18
20
2425
26
VI
Page Table 10. Streamflow at streamflow-gaging stations in and near the Pinon
Canyon Maneuver Site for water years 1984 and 1985---------- 3411. Regression equations and corresponding standard error of
estimate used to estimate peak streamflows for selected recurrence-interval floods---------------------------------- 39
12. Selected drainage-basin characteristics, estimates of flood magnitude for selected recurrence intervals, and recorded peak discharges of period of record for streamflow-gaging stations in and near the Pinon Canyon Maneuver Site--------- 40
13. Selected drainage-basin characteristics, estimates of floodmagnitudes and volumes having a 25-year recurrence interval,and estimated volume of streamflow reaching the PurgatoireRiver at selected sites in the Taylor Arroyo drainage basin- 42
14. Decreed surface-water rights at the Pinon Canyon ManeuverSite 45
15. Instream standards for water-quality properties and consti tuents analyzed for the Purgatoire River in the vicinity of the Pinon Canyon Maneuver Site------------------------------ 46
16. Comparison of concentrations of major ions at streamflow-gaging station Purgatoire River near Thatcher, for periodsof base streamflow and rainfall and snowmelt runoff--------- 48
17. Calculated and estimated dissolved-solids load for the 1985 water year at streamflow-gaging stations in and near the Pinon Canyon Maneuver Site---------------------------------- 53
18. Suspended-sediment load transported during the 1984 and 1985 water years for streamflow-gaging stations in and near the Pinon Canyon Maneuver Site---------------------------------- 57
19. Characteristics of selected stock-watering reservoirs in andnear the Pinon Canyon Maneuver Site------------------------- 63
20. Factors for estimating annual mean sediment yield------------- 6721. Rating conversions used for estimating annual mean sediment
yield 6822. Values used for estimating annual mean sediment yields using
the Pacific Southwest Inter-Agency Committee method in small drainage basins in and near the Pinon Canyon Maneuver Site-- 69
23. Results of chemical analysis of ground water from wells and aspring at the Pinon Canyon Maneuver Site-------------------- 80
24. Stock-watering reservoirs and inflow record for water years1984 and 1985 90
25. Summary of water-quality data for surface-water stations inand near the Pinon Canyon Maneuver Site--------------------- 103
26. Regression equations and statistics for major ions compared tospecific conductance in surface water----------------------- 112
VII
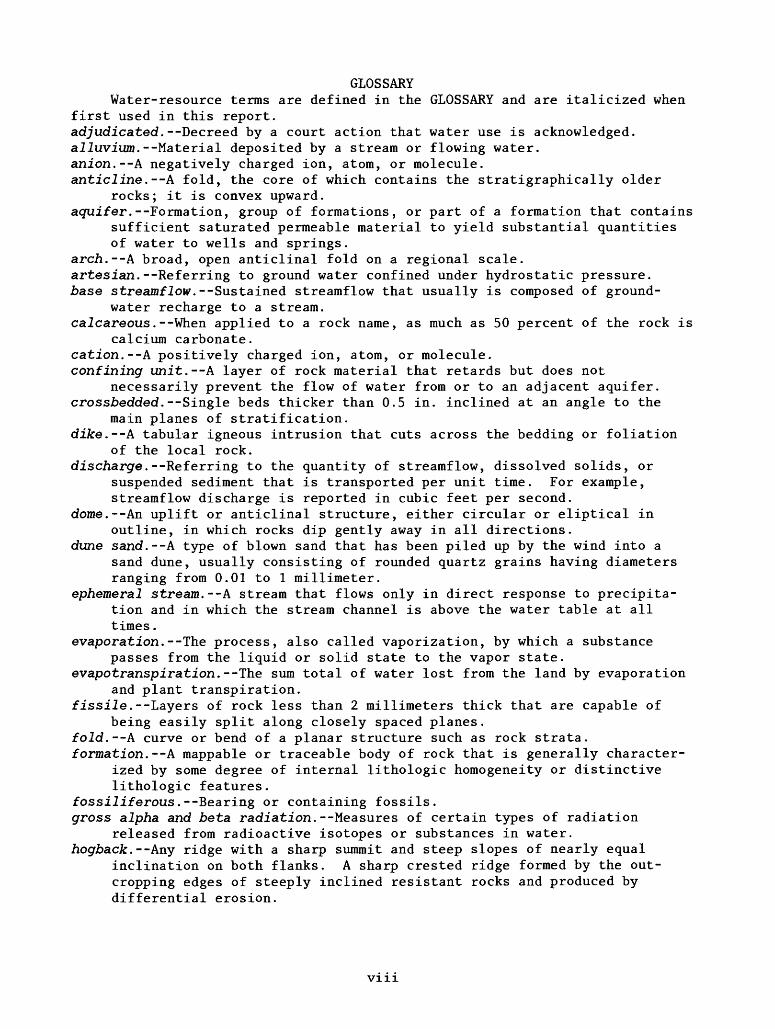
GLOSSARY Water-resource terms are defined in the GLOSSARY and are italicized when
first used in this report.adjudicated.--Decreed by a court action that water use is acknowledged.alluvium.--Material deposited by a stream or flowing water.anion.--A negatively charged ion, atom, or molecule.anticline.--A fold, the core of which contains the stratigraphically older
rocks; it is convex upward.aquifer. --Formation, group of formations, or part of a formation that contains
sufficient saturated permeable material to yield substantial quantities of water to wells and springs.
arch.--A broad, open anticlinal fold on a regional scale.artesian.--Referring to ground water confined under hydrostatic pressure.base streamflow.--Sustained streamflow that usually is composed of ground-
water recharge to a stream.calcareous.--When applied to a rock name, as much as 50 percent of the rock is
calcium carbonate.cation.--A positively charged ion, atom, or molecule.confining unit.--A layer of rock material that retards but does not
necessarily prevent the flow of water from or to an adjacent aquifer.crossjbedded.--Single beds thicker than 0.5 in. inclined at an angle to the
main planes of stratification.di£e.--A tabular igneous intrusion that cuts across the bedding or foliation
of the local rock.discharge.--Referring to the quantity of streamflow, dissolved solids, or
suspended sediment that is transported per unit time. For example, streamflow discharge is reported in cubic feet per second.
dome.--An uplift or anticlinal structure, either circular or eliptical in outline, in which rocks dip gently away in all directions.
dune sand.--A type of blown sand that has been piled up by the wind into asand dune, usually consisting of rounded quartz grains having diameters ranging from 0.01 to 1 millimeter.
ephemeral stream.--A stream that flows only in direct response to precipita tion and in which the stream channel is above the water table at all times.
evaporation.--The process, also called vaporization, by which a substance passes from the liquid or solid state to the vapor state.
evapotranspiration.--The sum total of water lost from the land by evaporation and plant transpiration.
fissile.--Layers of rock less than 2 millimeters thick that are capable of being easily split along closely spaced planes.
fo.Zd.--A curve or bend of a planar structure such as rock strata.formation.--A mappable or traceable body of rock that is generally character
ized by some degree of internal lithologic homogeneity or distinctive lithologic features.
fossiliferous.--Bearing or containing fossils.gross alpha and jbeta radiation.--Measures of certain types of radiation
released from radioactive isotopes or substances in water.hogjbacfc.--Any ridge with a sharp summit and steep slopes of nearly equal
inclination on both flanks. A sharp crested ridge formed by the out cropping edges of steeply inclined resistant rocks and produced by differential erosion.
Vlll
hydrograph .--A graph showing stage, flow, velocity, or other property of waterwith respect to time,
inter&edded.--Beds lying between or alternating with others of differentcharacter,
intermittent stream.--A stream that flows only at certain times of the yearwhen it receives water from springs or from surface sources,
ironstone.--Any rock containing a substantial proportion of an iron compound.Customarily applied to a hard, coarsely bonded or nonbonded and non-cherty sedimentary rock of post Precambrian age.
load.--The annual load of material that is transported by a stream, such asdissolved-solids load, in tons,
mi Hi equivalents.--The concentration of a given constituent, in milligrams perliter, multiplied by its equivalent weight (formula weight of ion/ioniccharge).
nonmetallic element.--A naturally occurring substance that does not havemetallic properties such as luster, conductivity, opaqueness, andmalleability.
plug.--A vertical, pipelike body of magma that represents the conduit to aformer volcanic vent,
potentiometric surface.--An imaginary surface representing the static head ofground water, defined by the levels to which water will rise in tightlycased wells.
radium-226.--The disintegration product of uranium-238, the dominant radiumisotope in natural waters.
radium-228.--A disintegration product of thorium.riparian.--Pertaining to, or situated on the bank of a river or body of water, saline water.--Water with dissolved-solids concentration greater than
1,000 mg/L. sill.--A tabular intrusive structure that parallels the planar structure of
the surrounding rock, storage coefficient.--Volume of water that an aquifer releases from or takes
into storage per unit surface area of the aquifer per unit change inhydraulic head.
stratigraphy.--The science of rock strata, streamflow-gaging station.--A selected cross section of a stream channel where
one or more variables are measured continuously or periodically to indexwater discharge and/or other properties or constituents.
subsurface water.--Water in the lithosphere in solid, liquid, or gaseous form, tectonic.--The regional assembly of structural or deform?tional features. transpiration.--The loss of water in vapor form from a plant, mostly through
the stomata and lentices.trap efficiency.--The proportion of the sediment retained by a reservoir. water table.--The potentiometric surface in an unconfined aquifer at which the
water pressure is atmospheric. The surface is defined by the levels atwhich water stands in wells that penetrate the aquifer enough to holdstanding water.
WATSTORE. --The national water-data storage and retrieval system of the U.S.Geological Survey.
IX
METRIC CONVERSION FACTORS
The inch-pound units used in this report may be converted to metric (International System) units by use of the following conversion factors:
Multiply inch-pound unit
acre-foot (acre-ft)acre-foot per mile (acre-ft/mi)
acre-foot per square mile(acre-ft/mi 2 )
acre-foot per year (acre-ft/yr) cubic foot per second (ft 3 /s) foot (ft)foot per mile (ft/mi) foot squared per day (ft 2 /d) gallon per minute (gal/min) inch (in.) mile (mi) square mile (mi 2 ) ton (short) ton per acre-foot (ton/acre-ft)
ton per square mile (ton/mi 2 )
By
0.0012330.000764
0.000476
0.0012330.028320.30480.1894
25.93.785
25.401.6092.5900.9072
735.77
0.3503
To obtain metric unit
cubic hectometer cubic hectometer perkilometer
cubic hectometer per squarekilometer
cubic hectometer per year cubic meter per second metermeter per kilometer meter squared per day liter per minute millimeter kilometer square kilometer megagram megagram per cubic
hectometer megagram per square
kilometer
To convert degrees Celsius (°C) to degrees Fahrenheit (°F) use the following formula:
°F = (°C x 9/5) + 32.
To convert degrees Fahrenheit (°F) to degrees Celsius (°C) use the following formula:
°C = (°F - 32) x 5/9.
The following terms and abbreviations also are used in this report: milligrams per liter (mg/L), micrograms per liter ((Jg/L),microsiemens per centimeter at 25 °Celsius ((jS/cm at 25 °C), and picocuries per liter (pCi/L).
Suspended-sediment concentrations are given only in milligrams per liter (mg/L) because these values are (within the range of values presented) numer ically equal to concentrations expressed in parts per million.
Sea level: In this report "sea level" refers to the National Geodetic Vertical Datum of 1929 (NGVD of 1929)--a geodetic datum derived from a general adjustment of the first-order level nets of both the United States and Canada, formerly called "Mean Sea Level."
HYDROLOGY OF THE U.S. ARMY PINON CANYON MANEUVER SITE,
LAS ANIMAS COUNTY, COLORADO
by Paul von Guerard, P.O. Abbott, and Raymond C. Nickless
ABSTRACT
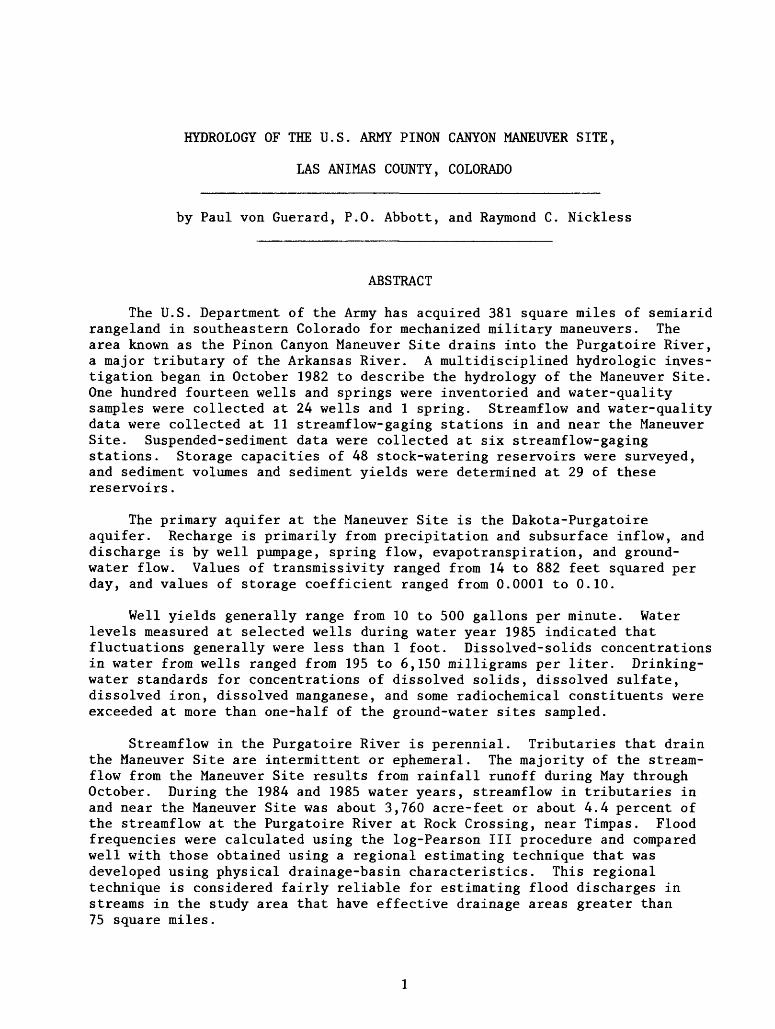
The U.S. Department of the Army has acquired 381 square miles of semiarid rangeland in southeastern Colorado for mechanized military maneuvers. The area known as the Pinon Canyon Maneuver Site drains into the Purgatoire River, a major tributary of the Arkansas River. A multidisciplined hydrologic inves tigation began in October 1982 to describe the hydrology of the Maneuver Site. One hundred fourteen wells and springs were inventoried and water-quality samples were collected at 24 wells and 1 spring. Streamflow and water-quality data were collected at 11 streamflow-gaging stations in and near the Maneuver Site. Suspended-sediment data were collected at six streamflow-gaging stations. Storage capacities of 48 stock-watering reservoirs were surveyed, and sediment volumes and sediment yields were determined at 29 of these reservoirs.
The primary aquifer at the Maneuver Site is the Dakota-Purgatoire aquifer. Recharge is primarily from precipitation and subsurface inflow, and discharge is by well pumpage, spring flow, evapotranspiration, and ground- water flow. Values of transmissivity ranged from 14 to 882 feet squared per day, and values of storage coefficient ranged from 0.0001 to 0.10.
Well yields generally range from 10 to 500 gallons per minute. Water levels measured at selected wells during water year 1985 indicated that fluctuations generally were less than 1 foot. Dissolved-solids concentrations in water from wells ranged from 195 to 6,150 milligrams per liter. Drinking- water standards for concentrations of dissolved solids, dissolved sulfate, dissolved iron, dissolved manganese, and some radiochemical constituents were exceeded at more than one-half of the ground-water sites sampled.
Streamflow in the Purgatoire River is perennial. Tributaries that drain the Maneuver Site are intermittent or ephemeral. The majority of the stream- flow from the Maneuver Site results from rainfall runoff during May through October. During the 1984 and 1985 water years, Streamflow in tributaries in and near the Maneuver Site was about 3,760 acre-feet or about 4.4 percent of the Streamflow at the Purgatoire River at Rock Crossing, near Timpas. Flood frequencies were calculated using the log-Pearson III procedure and compared well with those obtained using a regional estimating technique that was developed using physical drainage-basin characteristics. This regional technique is considered fairly reliable for estimating flood discharges in streams in the study area that have effective drainage areas greater than 75 square miles.
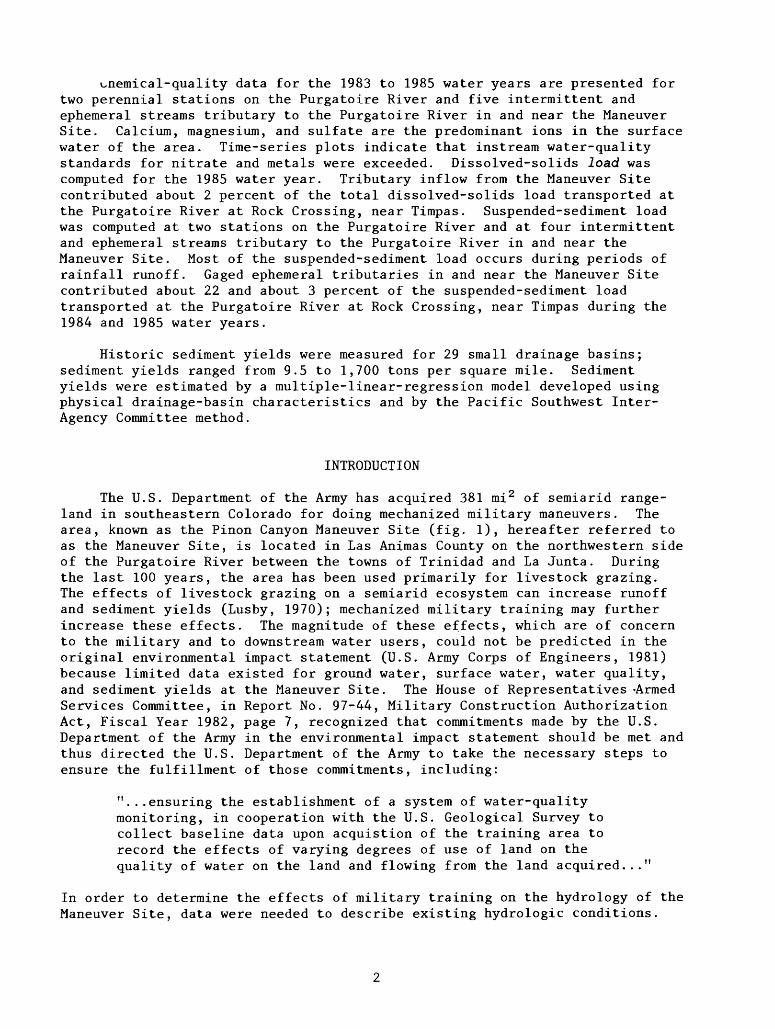
v^nemical-quality data for the 1983 to 1985 water years are presented for two perennial stations on the Purgatoire River and five intermittent and ephemeral streams tributary to the Purgatoire River in and near the Maneuver Site. Calcium, magnesium, and sulfate are the predominant ions in the surface water of the area. Time-series plots indicate that instream water-quality standards for nitrate and metals were exceeded. Dissolved-solids load was computed for the 1985 water year. Tributary inflow from the Maneuver Site contributed about 2 percent of the total dissolved-solids load transported at the Purgatoire River at Rock Crossing, near Timpas. Suspended-sediment load was computed at two stations on the Purgatoire River and at four intermittent and ephemeral streams tributary to the Purgatoire River in and near the Maneuver Site. Most of the suspended-sediment load occurs during periods of rainfall runoff. Gaged ephemeral tributaries in and near the Maneuver Site contributed about 22 and about 3 percent of the suspended-sediment load transported at the Purgatoire River at Rock Crossing, near Timpas during the 1984 and 1985 water years.
Historic sediment yields were measured for 29 small drainage basins; sediment yields ranged from 9.5 to 1,700 tons per square mile. Sediment yields were estimated by a multiple-linear-regression model developed using physical drainage-basin characteristics and by the Pacific Southwest Inter- Agency Committee method.
INTRODUCTION
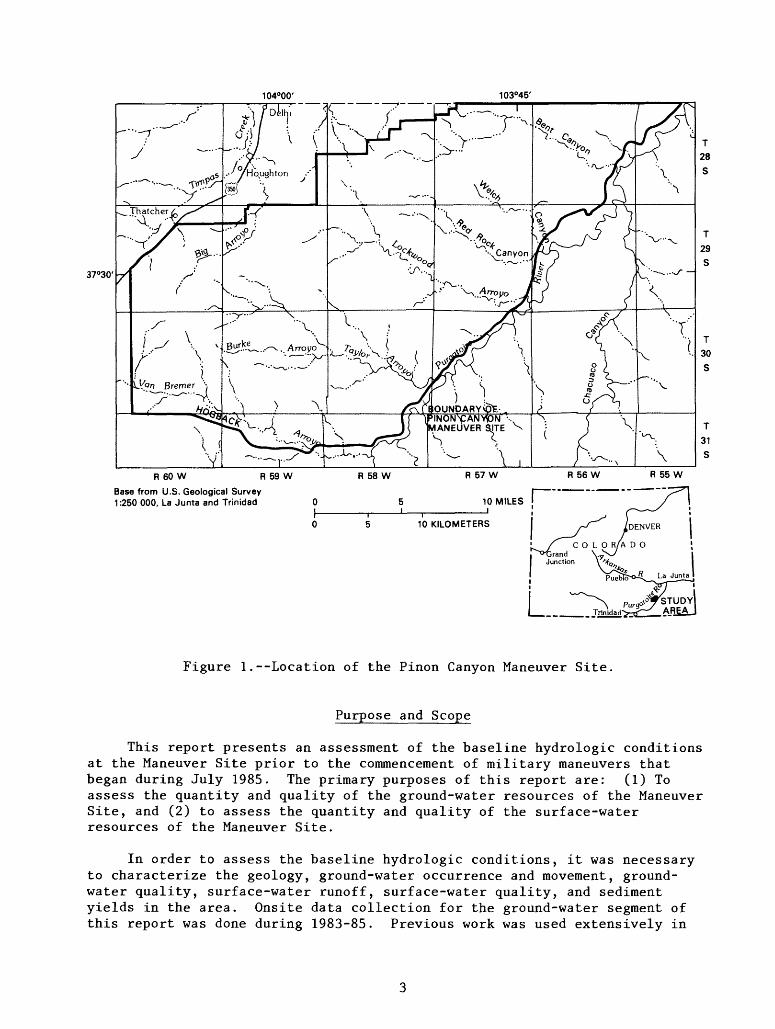
The U.S. Department of the Army has acquired 381 mi 2 of semiarid range- land in southeastern Colorado for doing mechanized military maneuvers. The area, known as the Pinon Canyon Maneuver Site (fig. 1), hereafter referred to as the Maneuver Site, is located in Las Animas County on the northwestern side of the Purgatoire River between the towns of Trinidad and La Junta. During the last 100 years, the area has been used primarily for livestock grazing. The effects of livestock grazing on a semiarid ecosystem can increase runoff and sediment yields (Lusby, 1970); mechanized military training may further increase these effects. The magnitude of these effects, which are of concern to the military and to downstream water users, could not be predicted in the original environmental impact statement (U.S. Army Corps of Engineers, 1981) because limited data existed for ground water, surface water, water quality, and sediment yields at the Maneuver Site. The House of Representatives -Armed Services Committee, in Report No. 97-44, Military Construction Authorization Act, Fiscal Year 1982, page 7, recognized that commitments made by the U.S. Department of the Army in the environmental impact statement should be met and thus directed the U.S. Department of the Army to take the necessary steps to ensure the fulfillment of those commitments, including:
"...ensuring the establishment of a system of water-quality monitoring, in cooperation with the U.S. Geological Survey to collect baseline data upon acquistion of the training area to record the effects of varying degrees of use of land on the quality of water on the land and flowing from the land acquired..."
In order to determine the effects of military training on the hydrology of the Maneuver Site, data were needed to describe existing hydrologic conditions.
104°00' 103°45'
37°30'
Base from U.S. Geological Survey 1:250 000, La Junta and Trinidad
Figure 1.--Location of the Pinon Canyon Maneuver Site.
Purpose and Scope
This report presents an assessment of the baseline hydrologic conditions at the Maneuver Site prior to the commencement of military maneuvers that began during July 1985. The primary purposes of this report are: (1) To assess the quantity and quality of the ground-water resources of the Maneuver Site, and (2) to assess the quantity and quality of the surface-water resources of the Maneuver Site.
In order to assess the baseline hydrologic conditions, it was necessary to characterize the geology, ground-water occurrence and movement, ground- water quality, surface-water runoff, surface-water quality, and sediment yields in the area. Onsite data collection for the ground-water segment of this report was done during 1983-85. Previous work was used extensively in
describing the geology of the area. Geology of parts of the Maneuver Site has been described by Bass (1947), Scott (1968), and Johnson (1969). Geology and ground-water .resource studies of nearby areas include: Baca County (McLaughlin, 1954); Huerfano County (McLaughlin, 1966); Otero County and the southern part of Crowley County (Weist and others, 1965); and Prowers County (Voegeli and Hershey, 1965). Geologic mapping at the Maneuver Site was based on the above sources, inspection of aerial photographs and drillers logs, and onsite verification. Geohydrologic information was collected from 114 exist ing wells and springs, but no tests were made to determine the water-bearing characteristics of the aquifers. Water-quality samples were collected and analyzed from 24 wells and 1 spring.
Onsite collection of surface-water data began during the 1983 water year (October 1982 to September 1983), and is scheduled to continue through the 1988 water year. Only data collected through the 1985 water year are presented in this report. Existing streamflow-gaging stations 07126200, Van Bremer Arroyo near Model (site S3, table 1, pi. 1), and 07126300, Purgatoire River near Thatcher (site S4), were incorporated into a network of 11 stream- flow-gaging stations (table 1, pi. 1); 8 of these 11 streamflow-gaging stations were installed during the 1983 water year. In order to monitor irrigation-return flows entering the Maneuver Site from the southwest, the streamflow-gaging station 07126130, Van Bremer Arroyo near Thatcher (site S2, pi. 1) was moved downstream during the 1985 water year to its present loca tion, station 07126140, Van Bremer Arroyo near Tyrone (site 2A). Data col lected at these stations include: (1) Continuous streamflow, (2) continuous specific conductance and water temperature, and (3) periodic chemical water quality. Daily suspended-sediment data were collected only at six streamflow- gaging stations (pi. 1). Precipitation data were collected from a network of four annual recording precipitation sites (pi. 1). The system of numbering streamflow-gaging stations is described in the "System of Numbering Streamflow-Gaging Stations" subsection in the "Supplemental Information" section at the back of the report.
Most of the 381-mi 2 Maneuver Site drains from the northwest directly into the Purgatoire River. The streamflow-gaging station at the Purgatoire River near Thatcher (site S4) monitors streamflow of the Purgatoire River upstream from the Maneuver Site, with the exception of Van Bremer Arroyo, which enters the Purgatoire River upstream from site S4. The streamflow-gaging station Purgatoire River at Rock Crossing, near Timpas (site S10), located approxi mately 40 river miles downstream from the streamflow-gaging station near Thatcher, monitors streamflow of the Purgatoire River downstream from the Maneuver Site.
Streamflow-gaging stations are located on all major tributaries that drain the Maneuver Site, including the streamflow-gaging station Big Arroyo near Thatcher (site SI) that drains 15.5 mi 2 north into Timpas Creek (pi. 1). In order to monitor streamflow that enters the Purgatoire River between site S4 and site S10 other than that which flows from the Maneuver Site, a streamflow gaging station is located at Chacuaco Creek at mouth, near Timpas (site S8). Chacuaco Creek drains 424 mi 2 , an area comparable in size to the Maneuver Site. Chacuaco Creek (site S8) enters the Purgatoire River from the south approximately 12.5 mi upstream from the Purgatoire River at Rock Crossing, near Timpas (site S10).
Tabl
e 1.
--Su
mmar
y of
in
form
atio
n fo
r streamflow-gaging, water-quality, and
suspended-sediment stations located
on or ne
ar the
Pinon
Canyon Ma
neuv
er Si
te
[e,
ephemeral;
i, intermittent;
p, perennial].
Site
number
on
plat
e 1
SI S2 S2A
S3 S4 S5 S6 S7 S8 S9
S10
U.S. Geological
Survey station
identification
number
0712
0620
07126130
07126140
07126200
07126300
07126325
0712
6390
07126415
0712
6470
07126480
07126485
U.S. Ge
olog
ical
Su
rvey
station
name
Big
Arroyo near Thatcher
Van
Bremer Ar
royo
near
Thatch
er.
Van
Bremer Ar
royo
near
Tyro
ne .
Van
Bremer Ar
royo
ne
arMo
del.
Purgatoire River
near
Thatch
er.
Taylor Ar
royo
below
Rock Cr
ossi
ng,
near
Thatcher.
Lockwood Canyon Creek
near
Thatcher.
Red
Rock Canyon Creek
atmouth, ne
ar Th
atch
er.
Chacuaco Creek
at mo
uth,
near Timpas.
Bent Canyon Creek
atmouth, ne
ar Timpas.
Purgatoire River at Rock
Cros
sing
, near Timpas.
Drainage
area
(s
quar
e mi
les)
15.5
80.6
132
175
1,935 48.4
41.4
48.8
424 56.2
2,63
5
Period of
reco
rd
March 1983-
March 19
83 to
May 19
85.
May 1985-
July 1966-
^uly 19
66 to
19
76;
1977-
March 1983-
Apri
l 1983-
May 1983-
May
1983-
May 1983-
June 1983-
Stream
type e e i i P e i e e e P
Daily
susp
ende
d sediment
coll
ecte
d
yes no no no
yes
yes no no
yes
yes
yes
Construction of Trinidad Reservoir completed
August 1977
Many stock-watering reservoirs had been constructed in the area prior to its acquisition by the U.S. Department of the Army. A network of 49 reser voirs, 39 on the Maneuver Site and 10 offsite, was established for this study during the 1983 and 1984 water years (pi. 1). Current contents of each reser voir were surveyed. In order to determine historic sediment yields, volume of accumulated sediments was measured at 29 of these reservoirs (pi. 1).
Description of Study Area
The Maneuver Site (fig. 1) is in the Great Plains province of the Interior Plains. It is located on the divide between the Raton section to the southwest and the Colorado Piedmont to the northeast (Fenneman, 1931). Structurally, the crest of this divide is the Apishapa arch. On the west and north, the Maneuver Site generally is bounded by uplands, by the Big Arroyo Hills on the west, and by the Bear Springs Hills on the north. A hogback, a difee-supported range of hills, occurs along the southern boundary of the Maneuver Site. The eastern boundary is the canyon of the Purgatoire River. Between the uplands and the canyons are rolling plains. Structural folds that are associated with the Apishapa arch form the prominent northwest-southeast trending Black Hills across the northeastern one-third of the site (pi. 2).
Altitude of the Maneuver Site ranges from 5,905 ft at the highest point on Big Arroyo Hills to about 4,350 ft where the Purgatoire River flows out of the area. Depths of the Purgatoire River canyon range from 400 to 500 ft. The hogback has a maximum altitude of 5,668 ft and a relief of about 450 ft. The highest point on the Black Hills is 5,363 ft.
The uplands, Big Arroyo Hills, Bear Springs Hills, and the Black Hills are forested with pinon pine and juniper trees. Short-grass prairie occupies the area between the uplands and the canyons. Riparian vegetation occurs in the canyons.
The Maneuver Site is entirely within the Arkansas River drainage basin. The streams in the study area originate on the slopes of the highlands and flow eastward to the Purgatoire River, except for Van Bremer Arroyo that originates west of the study area and Big Arroyo that flows north from the north side of Big Arroyo Hills. The streams are ephemeral and occur in shal low valleys across the rolling plains of the area. Near the confluence with the Purgatoire River, the tributary stream channels become entrenched into the sandstone of the canyon rim and form side canyons to the main canyon. Near the upper end of the canyon, the channels of many of the tributary streams intersect the water table, and the streams become perennial or intermittent downstream from that point.
The climate at the Maneuver Site is semiarid; mean annual precipitation for 1951-80 was about 12 in. (Colorado Climate Center, 1984). Precipitation measured at the precipitation-network sites (pi. 1) during the 1984 and 1985 water years averaged 10.4 in. Warm daytime temperatures and minimal relative humidity cause large evaporation rates at the Maneuver Site. From 1972 through 1984, evaporation rates were measured during the months of April through October at Springfield, Colo., 70 mi east of the Maneuver Site, and these rates averaged 70 in.
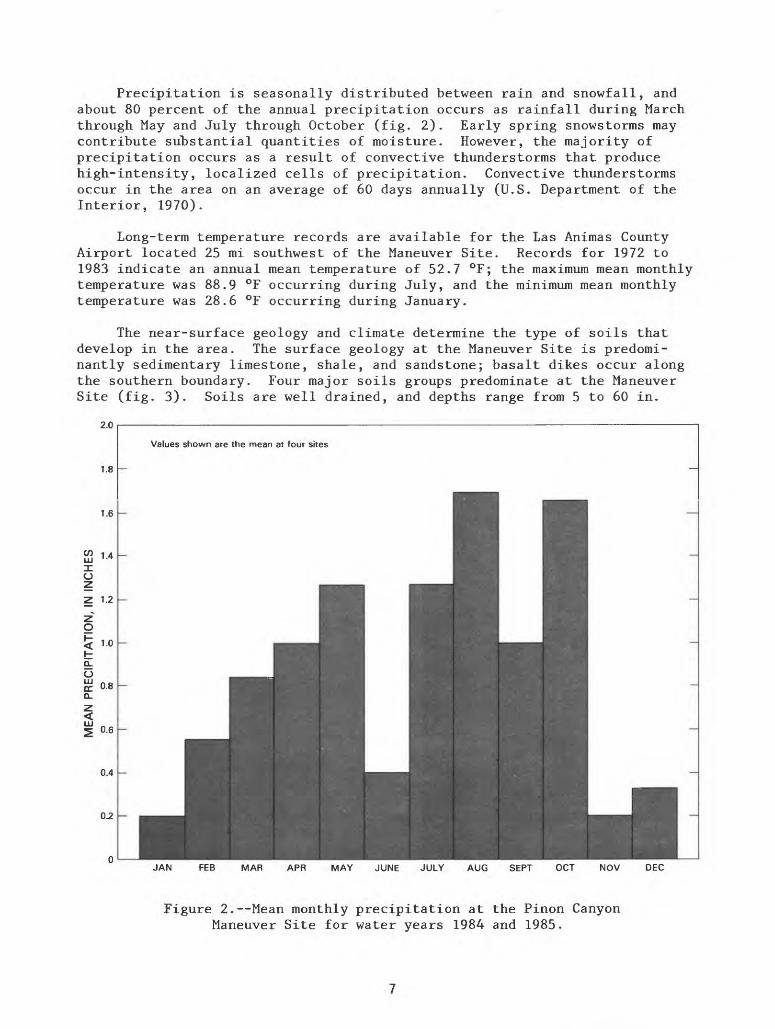
Precipitation is seasonally distributed between rain and snowfall, and about 80 percent of the annual precipitation occurs as rainfall during March through May and July through October (fig. 2). Early spring snowstorms may contribute substantial quantities of moisture. However, the majority of precipitation occurs as a result of convective thunderstorms that produce high-intensity, localized cells of precipitation. Convective thunderstorms occur in the area on an average of 60 days annually (U.S. Department of the Interior, 1970).
Long-term temperature records are available for the Las Animas County Airport located 25 mi southwest of the Maneuver Site. Records for 1972 to 1983 indicate an annual mean temperature of 52.7 °F; the maximum mean monthly temperature was 88.9 °F occurring during July, and the minimum mean monthly temperature was 28.6 °F occurring during January.
The near-surface geology and climate determine the type of soils that develop in the area. The surface geology at the Maneuver Site is predomi nantly sedimentary limestone, shale, and sandstone; basalt dikes occur along the southern boundary. Four major soils groups predominate at the Maneuver Site (fig. 3). Soils are well drained, and depths range from 5 to 60 in.
2.0
1.8
1.6
u
1.2
u
O_
Z
0.8
0.6
0.4
0.2
Values shown are the mean at four sites
JAN FEB MAR APR MAY JUNE JULY AUG SEPT OCT NOV DEC
Figure 2.--Mean monthly precipitation at the Pinon Canyon Maneuver Site for water years 1984 and 1985.
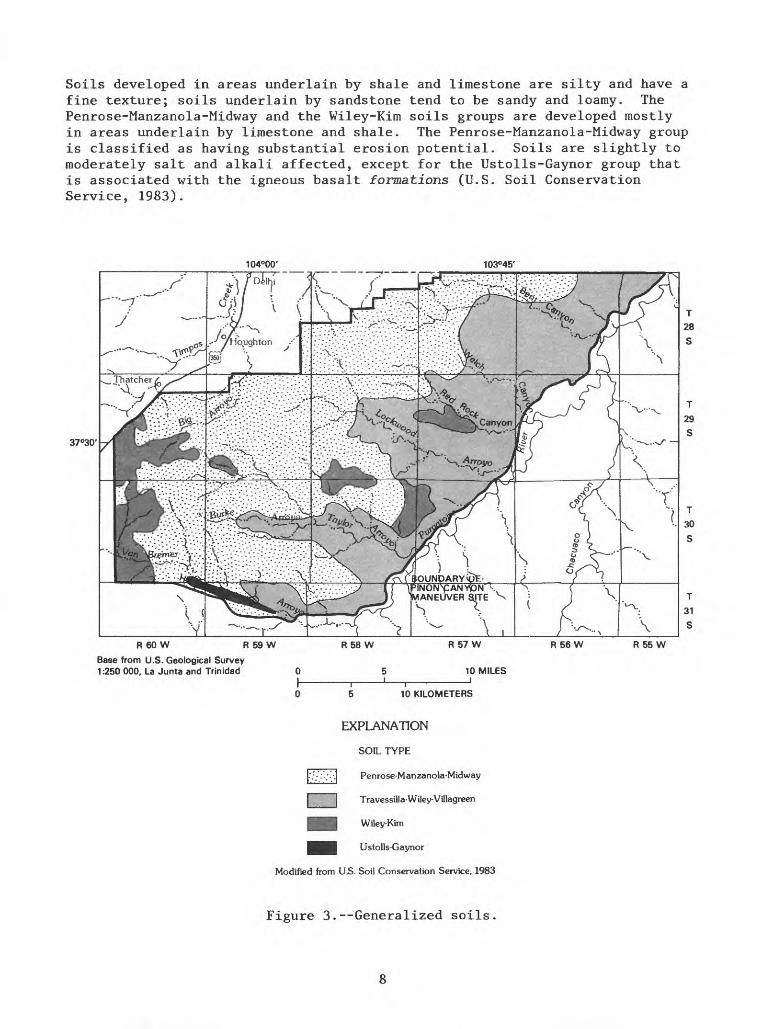
Soils developed in areas underlain by shale and limestone are silty and have a fine texture; soils underlain by sandstone tend to be sandy and loamy. The Penrose-Manzanola-Midway and the Wiley-Kim soils groups are developed mostly in areas underlain by limestone and shale. The Penrose-Manzanola-Midway group is classified as having substantial erosion potential. Soils are slightly to moderately salt and alkali affected, except for the Ustolls-Gaynor group that is associated with the igneous basalt formations (U.S. Soil Conservation Service, 1983).
104°00' 103°45'
37°30'
R 60 W R 59 W
Base from U.S. Geological Survey 1:250 000, La Junta and Trinidad
R 55 W
10 KILOMETERS
EXPLANATION
SOIL TYPE
|-'.:: '.' ;.] Penrose-Manzanola-Midway
[ | Travessilla-Wiley-Villagreen
m Wiley-Kim
HIH Ustolls-Gaynor
Modified from U.S. Soil Conservation Service, 1983
Figure 3. Generalized soils.
GEOLOGIC SETTING
Geologic maps of the Maneuver Site at a scale of 1:250,000 (Scott, 1968; Johnson, 1969) provide a regional overview of the geologic formations and structure of the Maneuver Site. Site-specific descriptions of geologic forma tions and structure were available for the western part of the Maneuver Site (Bass, 1947). These descriptions and onsite measurements and observations made during the study, provide additional detail about the geologic setting of the study area.
Geologic Formations
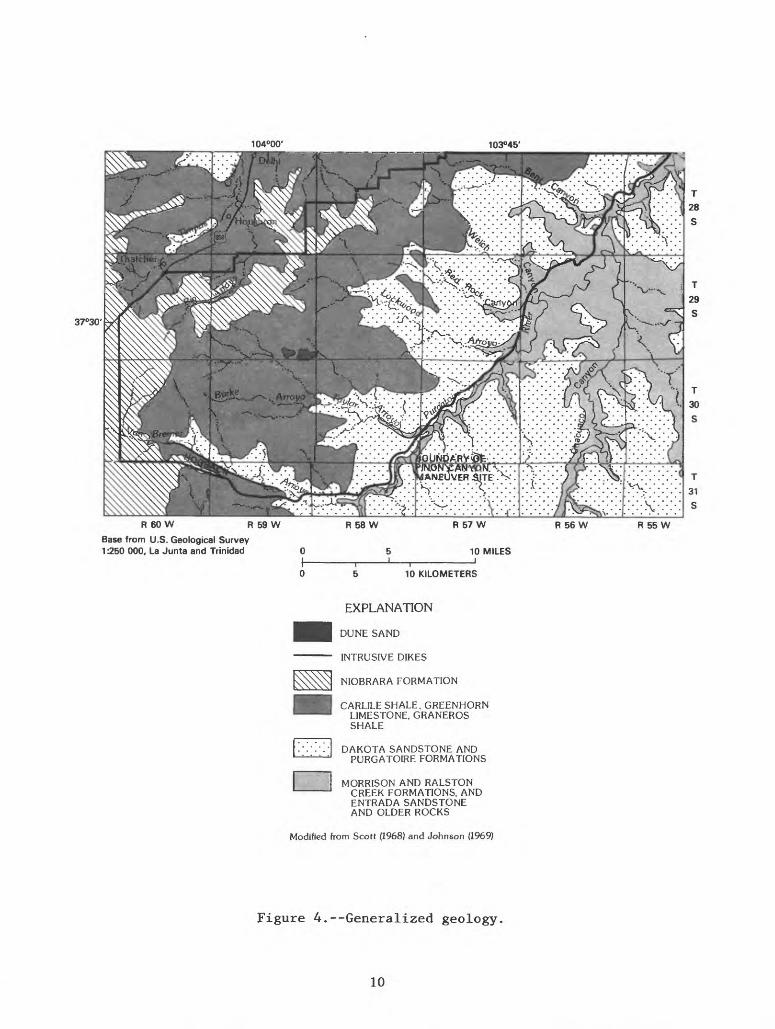
The generalized surficial geology of the Maneuver Site is shown in figure 4. The primary formations exposed at the land surface in descending order are the Niobrara Formation, Carlile Shale, Greenhorn Limestone, Graneros Shale, Dakota Sandstone, and Purgatoire Formation. The generalized stratigraphy of the rocks that crop out at the Maneuver Site, and their approximate thicknesses, physical descriptions, and water-supply potential are listed in table 2. Other formations that crop out are of limited extent and are associated with the canyon areas along the eastern border of the Maneuver Site. Rocks of the Permian, Triassic, and Jurassic Systems are the oldest within the geologic section and are exposed only along the deeper canyon walls of the Purgatoire River.
The Dakota Sandstone and the Purgatoire Formation occur throughout a large part of the Maneuver Site and are the principal source of ground water in the area. The Dakota-Purgatoire aquifer is discussed further in the "Ground Water" section. The Purgatoire Formation consists of the Cheyenne Sandstone Member and the Kiowa Shale Member. The Cheyenne Sandstone Member, often called "Second Dakota" in the logs of local well drillers, is a massive, white-to-yellowish-brown, crossbedded sandstone, from 70 to 110 ft thick. It forms white cliffs along the Purgatoire River canyon and is distinguishable from the Dakota Sandstone, which occurs near the rim of the canyon, by the whiter color and more rounded, weathered form of the Cheyenne Sandstone. The Kiowa Shale Member consists of fossil iferous, marine, dark-gray claystone, siltstone, and sandstone (Scott, 1968), and is about 40 to 70 ft thick in the study area. In the canyon of the Purgatoire River, the Kiowa Shale Member is concealed beneath debris originated by slope wash.
At the Maneuver Site, the Dakota Sandstone is a yellowish-brown, cross- bedded sandstone. The weathered surface generally is coated with a thin film of iron and manganese oxides called desert varnish. In many places, the Dakota Sandstone contains layers and nodules of hard, dark-brown ironstone. The formation has weathered into steep ledges and cliffs that form the rim of the Purgatoire River canyon in many places. The Dakota Sandstone ranges from 75 to 140 ft thick, although on the canyon rim and in some other areas, its thickness has been decreased by erosion.
The Carlile Shale, Greenhorn Limestone, and Graneros Shale Formations overlie the Dakota Sandstone and the Purgatoire Formation and occupy all but the highest areas in the western half of the Maneuver Site. The youngest consolidated sedimentary unit is the Niobrara Formation that forms the higher ridges in the northwestern part of the study area. It yields only small quantities of water to wells. Intrusive dikes, dune sand, and alluvium are present in the study area to a more limited extent.
104°00' 103°45'
37°30'
R 60 W R 59 W
Base from U.S. Geological Survey 1:250 000. La Junta and Trinidad
R 58 W R 57 W
10 MILES
R 56 W R 55 W
5 10 KILOMETERS
EXPLANATION
DUNE SAND
INTRUSIVE DIKES
NIOBRARA FORMATION
CARLILE SHALE. GREENHORN LIMESTONE, GRANEROS SHALE
DAKOTA SANDSTONE AND PURGATOIRE FORMATIONS
MORRISON AND RALSTON CREEK FORMATIONS, AND ENTRADA SANDSTONE AND OLDER ROCKS
Modified from Scott (1968) and Johnson (1969)
Figure 4.--Generalized geology.
10
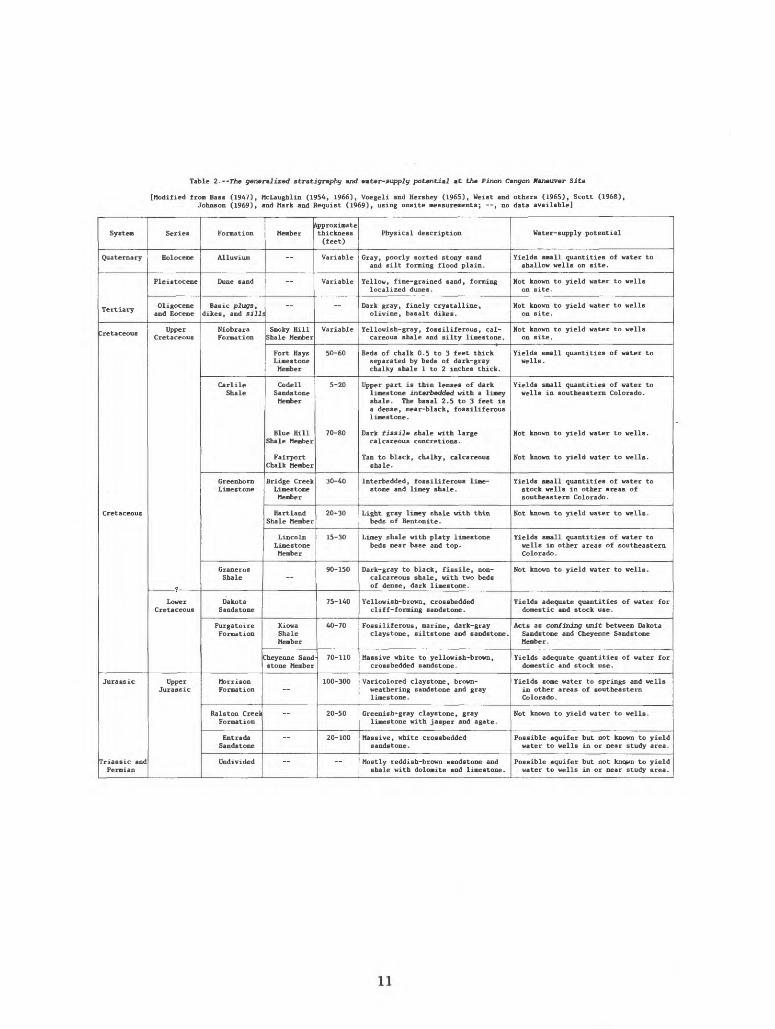
Table 2. The generalized stratigraphy and water-supply potential at the Pinon Canyon Maneuver Site
[Modified from Bass (1947), McLaughlin (1954, 1966), Voegeli and Hershey (1965), Weist and others (1965), Scott (1968), Johnson (1969), and Hark and Requist (1969), using onsite measurements; , no data available]
System
Quaternary
Tertiary
Cretaceous
Cretaceous
Jurassic
Iriassic and Permian
Series
Holocene
Pleistocene
Oligocene and Eocene
Upper
Lower Cretaceous
Upper Jurassic
Formation
Alluvium
Dune sand
Basic plugs, dikes, and S2ll
Niobrara
Carlile Shale
Greenhorn Limestone
Graneros Shale
Dakota Sandstone
Purgatoire Formation
Morrison Formation
Ralston Creel Formation
Entrada Sandstone
Undivided
Member
"
--
Smoky Hill Shale Member
Fort Hays Limestone Member
Codell Sandstone Member
Blue Hill Shale Member
Fairport Chalk Member
Bridge Creek Limestone Member
Hartland Shale Member
Lincoln Limestone Member
"
Kiowa Shale Member
Cheyenne Sand stone Member
-
pproxinate thickness (feet)
Variable
Variable
-
Variable
50-60
5-20
70-80
30-40
20-30
15-30
90-150
75-140
40-70
70-110
100-300
20-50
20-100
~
Physical description
Gray, poorly sorted stony sand and silt forming flood plain.
Yellow, fine-grained sand, forming localized dunes.
Dark gray, finely crystalline, olivine, basalt dikes.
Yellowish-gray, fossiliferous, cal careous shale and silty limestone.
Beds of chalk 0.5 to 3 feet thick separated by beds of dark-gray chalky shale 1 to 2 inches thick.
.
limestone interbedded with a limey shale. The basal 2.5 to 3 feet is a dense, near-black, fossiliferous limestone.
Dark fissile shale with large calcareous concretions.
Tan to black, chalky, calcareous shale.
Interbedded, fossiliferous lime stone and limey shale.
Light gray limey shale with thin beds of Bentonite.
Limey shale with platy limestone beds near base and top.
Dark-gray to black, fissile, non- calcareous shale, with two beds of dense, dark limestone.
Yellowish-brown, crossbedded cliff-forming sandstone.
Fossiliferous, marine, dark-gray claystone, siltstone and sandstone.
Massive white to yellowish-brown, crossbedded sandstone.
Varicolored claystone, brown- weathering sandstone and gray limestone.
Greenish-gray claystone, gray limestone with jasper and agate.
Massive, white crossbedded sandstone.
Mostly reddish-brown sandstone and shale with dolomite and limestone.
Water-supply potential
shallow wells on site.
Not known to yield water to wells on site.
Not known to yield water to wells on site.
Not known to yield water to wells on site.
wells.
wells in southeastern Colorado.
Not known to yield water to wells.
Not known to yield water to wells.
Yields small quantities of water to stock wells in other areas of southeastern Colorado.
Not known to yield water to wells.
Yields small quantities of water to wells in other areas of southeastern Colorado.
Not known to yield water to wells.
Yields adequate quantities of water for domestic and stock use.
Acts as confining unit between Dakota Sandstone and Cheyenne Sandstone Member .
Yields adequate quantities of water for domestic and stock use.
Yields some water to springs and wells in other areas of southeastern Colorado.
Not known to yield water to wells.
Possible aquifer but not known to yield water to wells in or near study area.
Possible aquifer but not kncyra to yield water to wells in or near study area.
11
Geologic Structures
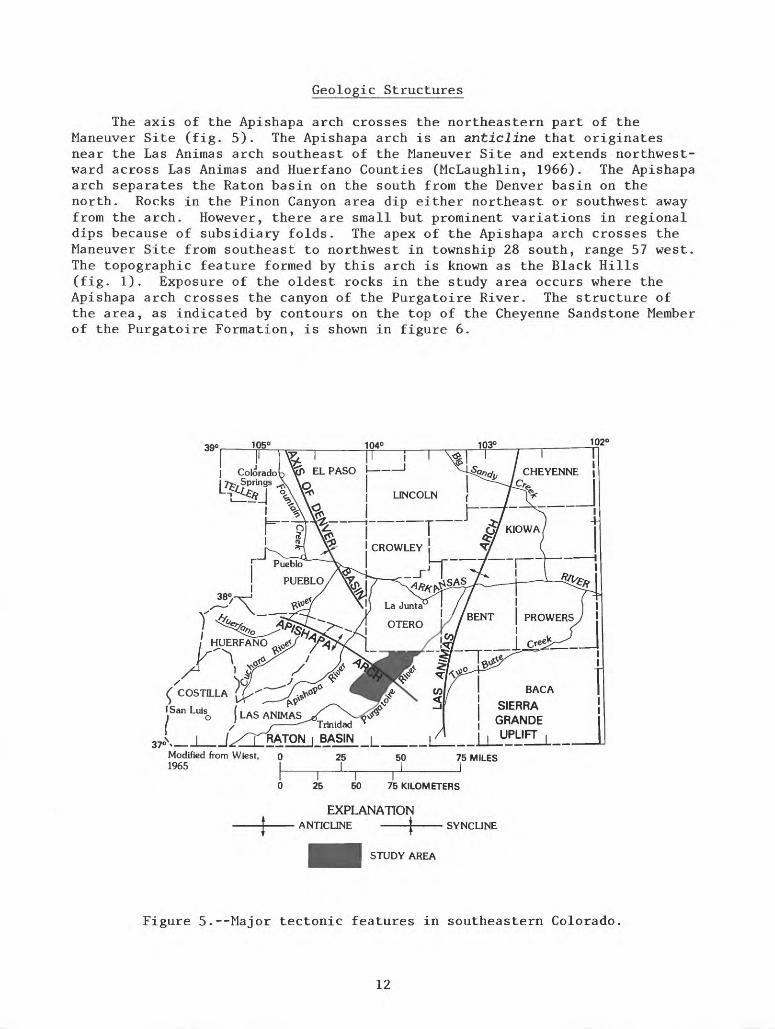
The axis of the Apishapa arch crosses the northeastern part of the Maneuver Site (fig. 5). The Apishapa arch is an anticline that originates near the Las Animas arch southeast of the Maneuver Site and extends northwest ward across Las Animas and Huerfano Counties (McLaughlin, 1966). The Apishapa arch separates the Raton basin on the south from the Denver basin on the north. Rocks in the Pinon Canyon area dip either northeast or southwest away from the arch. However, there are small but prominent variations in regional dips because of subsidiary folds. The apex of the Apishapa arch crosses the Maneuver Site from southeast to northwest in township 28 south, range 57 west. The topographic feature formed by this arch is known as the Black Hills (fig. 1). Exposure of the oldest rocks in the study area occurs where the Apishapa arch crosses the canyon of the Purgatoire River. The structure of the area, as indicated by contours on the top of the Cheyenne Sandstone Member of the Purgatoire Formation, is shown in figure 6.
39
BACA
SIERRA GRANGE UPLIFT
TrinidadRATON | BASIN _
EXPLANATIONANTICLINE |
STUDY AREA
Figure 5.--Major tectonic features in southeastern Colorado
12
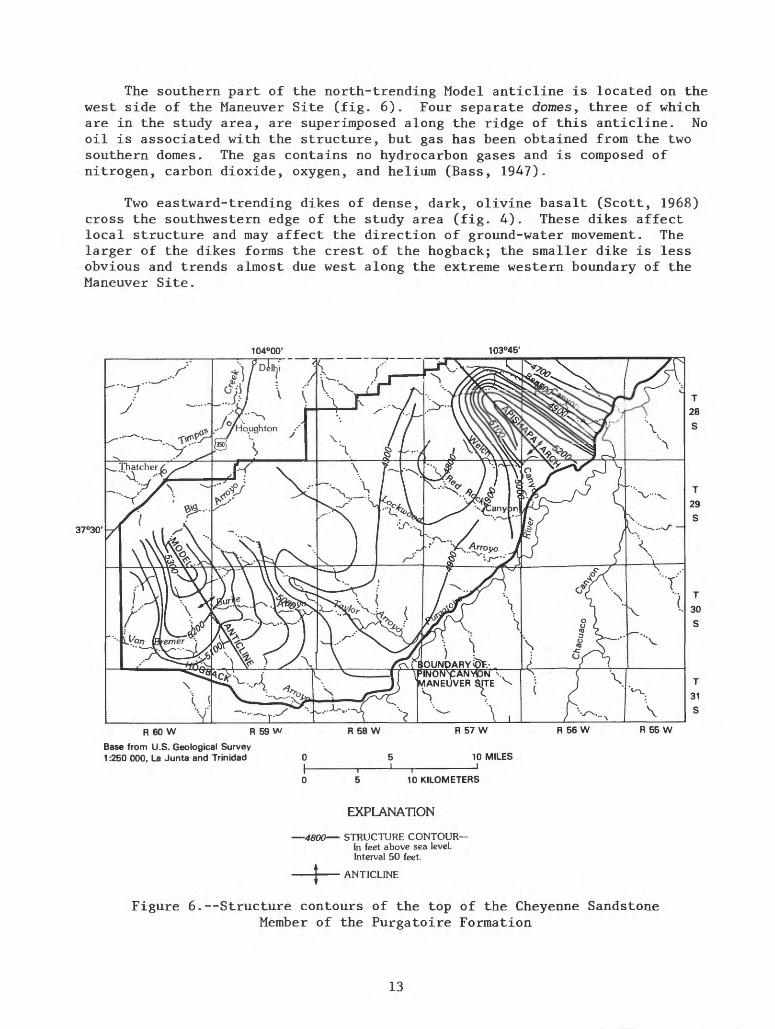
The southern part of the north-trending Model anticline is located on the west side of the Maneuver Site (fig. 6). Four separate domes, three of which are in the study area, are superimposed along the ridge of this anticline. No oil is associated with the structure, but gas has been obtained from the two southern domes. The gas contains no hydrocarbon gases and is composed of nitrogen, carbon dioxide, oxygen, and helium (Bass, 1947).
Two eastward-trending dikes of dense, dark, olivine basalt (Scott, 1968) cross the southwestern edge of the study area (fig. 4). These dikes affect local structure and may affect the direction of ground-water movement. The larger of the dikes forms the crest of the hogback; the smaller dike is less obvious and trends almost due west along the extreme western boundary of the Maneuver Site.
104°00' 103°45'
37°30'
R 60 W R 59 W
Base from U.S. Geological Survey 1£50 000, La Junta and Trinidad
10 KILOMETERS
EXPLANATION
4800 STRUCTURE CONTOUR In feet above sea level. Interval 50 feet.
ANTICLINE
Figure 6. Structure contours of the top of the Cheyenne Sandstone Member of the Purgatoire Formation
13
GROUND WATER
Because surface-water sources typically are unreliable in semiarid climates, ground water historically has been the predominant source of water supply in the study area. This supply, which has been developed primarily for domestic purposes and for livestock watering, was obtained from springs (either natural or improved) and wells (either hand-dug or drilled). Inspection of drillers' logs and onsite inspection during the well inventory indicated that most wells were completed in the Dakota-Purgatoire aquifer. Currently (1987) there are approximately 19 springs (table 3) and 95 wells (table 4) located at the Maneuver Site. Locations of the springs and wells are shown on plate 2. The system of numbering well locations is described in the "System of Numbering Well Locations" subsection and shown in figure 29 in the "Supplemental Information" section at the back of the report. As of July 1984, the Colorado State Engineer listed 13 of these wells as adjudicated; appropriation dates ranged from December 31, 1885, to December 31, 1951. The well number, location, and decreed quantity of flow as reported in the adjudi cation documents are listed in table 5. The number of the nearest well, as determined during the 1984 and 1985 inventory by the U.S. Geological Survey (table 4), also is listed in table 5. The nearest inventoried well is listed because of uncertainty about the exact location of the adjudicated well.
Beginning in 1967 through the early 1980's, a system of pipelines (pi. 2) that would originate at the more productive springs and wells was installed to improve the efficiency and areal distribution of the domestic- and stock-water supply. At that time, less productive wells were abandoned and soon became inoperable because of lack of maintenance. Similarly, many remaining wells will require rehabilitation for operation in the future. The condition of each well during the 1984 to 1985 inventory is described in table 4.
The primary sources of ground water in the study area are the Dakota Sandstone Formation and the Cheyenne Sandstone Member of the Purgatoire Formation (table 2). As previously discussed in the "Geologic Setting" section, these two units commonly are referred to as the Dakota-Purgatoire aquifer and they underlie all of the Maneuver Site. The following sections will: (1) describe the Dakota-Purgatoire aquifer and other potential aquifers in the area; (2) characterize the general chemical quality of the ground water at the Maneuver Site; and (3) discuss appropriate considerations should further ground-water development be contemplated.
14
Tabl
e 3.
--Location,
altitude,
and
summary
description
of springs
at the
Pinon
Canyon Maneuver Site
inventoried by the
U.S.
Ge
olog
ical
Survey during 19
84 and
1985
Number
on
plate 2
SP1
SP2
SP3
SP4
SP5
SP6
SP7
SP8
SP9
SP10
SP11
SP12
SP13
SP14
SP15
SP16
SP17
SP18
SP19
Local number
SC02805607CAB
SC02805717ACD
SC02805726BBB
SC02805733DBA
SC02805816BBD
SC02905705CBC
SC02
9057
06DA
DSC
0290
5730
BDB
SC02905812ADC
SC02905823ADD
SC02
9059
18DB
BSC02906035ABB
SC03005708BAD2
SC03005718ADC
SC03
0057
18DC
C
SC03005801AAC
SC03
0058
15CA
CSC03105904CBB
SC03
1059
10DA
B
Latitude
(deg
rees ,
minutes ,
seconds)
37 37
16
37 36 30
37 35
07
37 33
47
37 36 47
37 32
51
37 32
48
37 29
38
37 32
11
37 30 22
37 31
12
37 29 02
37 27
05
37 25
57
37 25
32
37 27
57
37 25
44
37 22
22
37 21 26
Longitude
(deg
rees
, minutes ,
seco
nds)
103
43 42
103
48 39
103
45 53
103
47 28
103
54 37
103
49 19
103
49 28
103
50 08
103
50 41
103
51 38
104
02 58
104
05 10
103
48 53
103
49 35
103
49 41
103
50 37
103
53 23
104
01 32
103
59 42
Altitude
of la
nd
surface
(feet)
4,650
4,890
5,21
0
4,910
5,17
5
4,87
04,850
4,81
04,900
4,89
5
5,47
05,
555
4,99
04,
920
5,01
0
4,99
0
4,990
5,166
5,03
5
Description of
si
te at ti
me of
inventory
Undeveloped; pool in
rock.
Undeveloped; se
ep in
channel.
Undeveloped; po
ol,
under ledge, Sugarloaf
Spring.
Undeveloped; po
ol in
ro
ck ch
anne
l.Undeveloped; se
ep in ch
anne
l.
East Re
d Rock Ranch Sp
ring
.West Red
Rock Ranch Sp
ring
.Developed; po
ol under ledge.
Undeveloped; po
ol under ledge.
Undeveloped; po
ol in
ch
anne
l.
Undeveloped; se
ep in shale
chan
nel
Undeveloped; seep in
channel, pool
Undeveloped; po
ol in ch
anne
l.Undeveloped; pool in
ch
anne
l, below fall.
Undeveloped; po
ol under ro
ck ledge
Undeveloped; in
channel, affected
pond .
Big
Water Arroyo Spring,
pumped to
Developed.
Undeveloped; pool in ch
anne
l.
by stock
pipeline .
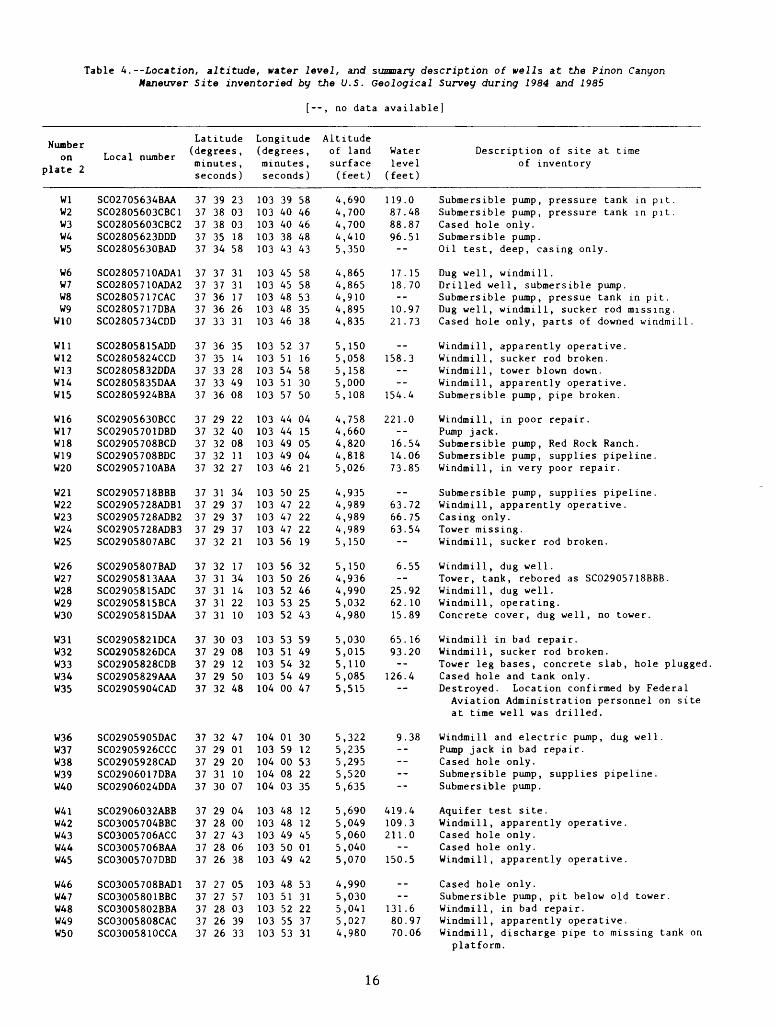
Table 4.--Location, altitude, water level, and stannary description of wells at the Pinon Canyon Maneuver Site inventoried by the U.S. Geological Survey during 1984 and 1985
[--, no data available]
Number on
plate 2
WlW2W3W4W5
W6W7W8W9
W10
WllW12W13W14W15
W16W17W18W19W20
W21W22W23W24W25
W26W27W28W29W30
W31W32W33W34W35
W36W37W38W39W40
W41W42W43W44W45
W46W47W48W49W50
Local number
SC02705634BAASC02805603CBC1SC02805603CBC2SC02805623DDDSC02805630BAD
SC02805710ADA1SC02805710ADA2SC02805717CACSC02805717DBASC02805734CDD
SC02805815ADDSC02805824CCDSC02805832DDASC02805835DAASC02805924BBA
SC02905630BCCSC02905701DBDSC02905708BCDSC02905708BDCSC02905710ABA
SC02905718BBBSC02905728ADB1SC02905728ADB2SC02905728ADB3SC02905807ABC
SC02905807BADSC02905813AAASC02905815ADCSC02905815BCASC02905815DAA
SC02905821DCASC02905826DCASC02905828CDBSC02905829AAASC02905904CAD
SC02905905DACSC02905926CCCSC02905928CADSC02906017DBASC02906024DDA
SC02906032ABBSC03005704BBCSC03005706ACCSC03005706BAASC03005707DBD
SC03005708BAD1SC03005801BBCSC03005802BBASC03005808CACSC03005810CCA
Latitude (degrees, minutes , seconds)
3737373737
3737373737
3737373737
3737373737
3737373737
3737373737
3737373737
3737373737
3737373737
3737373737
3938383534
3737363633
3635333336
2932323232
3129292932
3231313131
3029292932
3229293130
2928272826
2727282626
2303031858
3131172631
3514284908
2240081127
3437373721
1734142210
0308125048
4701201007
0400430638
0557033933
Longitude (degrees , minutes , seconds)
103103103103103
103103103103103
103103103103103
103103103103103
103103103103103
103103103103103
103103103103104
104103104104104
103103103103103
103103103103103
3940403843
4545484846
5251545157
4444494946
5047474756
5650525352
5351545400
0159000803
4848495049
4851525553
5846464843
5858533538
3716583050
0415050421
2522222219
3226462543
5949324947
3012532235
1212450142
5331223731
Altitude of land surface (feet)
44445
44444
55555
44445
44445
54454
55555
55555
55555
45554
,690,700,700,410,350
,865,865,910,895,835
,150,058,158,000,108
,758,660,820,818,026
,935,989,989,989,150
,150,936,990,032,980
,030,015,110,085,515
,322,235,295,520,635
,690,049,060,040,070
,990,030,041,027,980
Water level
(feet)
119.087.4888.8796.51--
17.1518.70--10.9721.73
--
158.3----
154.4
221.0--16.5414.0673.85
--63.7266.7563.54--
6.55--
25.9262.1015.89
65.1693.20--
126.4--
9.38--------
419.4109.3211.0
--
150.5
----
131.680.9770.06
Description of site at time of inventory
Submersible pump, pressure tank in pit.Submersible pump, pressure tank in pit.Cased hole only.Submersible pump.Oil test, deep, casing only.
Dug well, windmill.Drilled well, submersible pump.Submersible pump, pressue tank in pit.Dug well, windmill, sucker rod missing.Cased hole only, parts of downed windmill.
Windmill, apparently operative.Windmill, sucker rod broken.Windmill, tower blown down.Windmill, apparently operative.Submersible pump, pipe broken.
Windmill, in poor repair.Pump jack.Submersible pump, Red Rock Ranch.Submersible pump, supplies pipeline.Windmill, in very poor repair.
Submersible pump, supplies pipeline.Windmill, apparently operative.Casing only.Tower missing.Windmill, sucker rod broken.
Windmill, dug well.Tower, tank, rebored as SC02905718BBB.Windmill, dug well.Windmill, operating.Concrete cover, dug well, no tower.
Windmill in bad repair.Windmill, sucker rod broken.Tower leg bases, concrete slab, hole pluggedCased hole and tank only.Destroyed. Location confirmed by Federal
Aviation Administration personnel on siteat time well was drilled.
Windmill and electric pump, dug well.Pump jack in bad repair.Cased hole only.Submersible pump, supplies pipeline.Submersible pump.
Aquifer test site.Windmill, apparently operative.Cased hole only.Cased hole only.Windmill, apparently operative.
Cased hole only.Submersible pump, pit below old tower.Windmill, in bad repair.Windmill, apparently operative.Windmill, discharge pipe to missing tank on
platform.
16
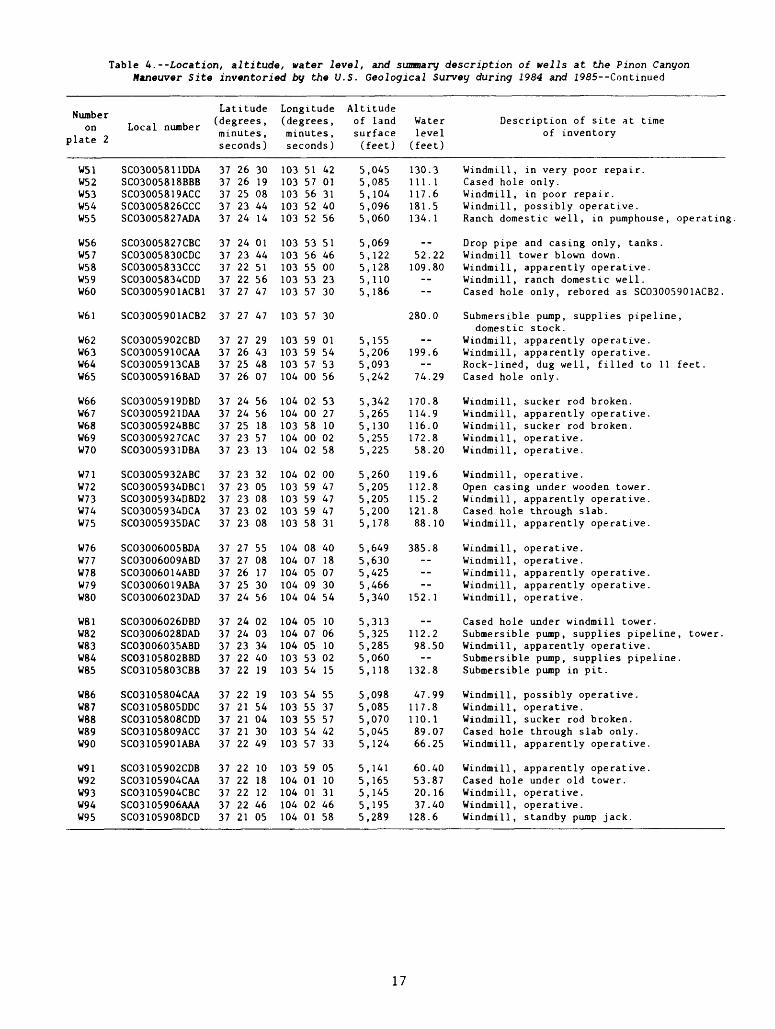
Table 4.--Location, altitude, water level, and summary description of wells at the Pinon Canyon Maneuver Site inventoried by the U.S. Geological Survey during 1984 and 2985--Continued
Number on
plate 2
W51W52W53W54W55
W56W57W58W59W60
W61
W62W63W64W65
W66W67W68W69W70
W71W72W73W74W75
W76W77W78W79W80
W81W82W83W84W85
W86W87W88W89W90
W91W92W93W94W95
Local number
SC03005811DDASC03005818BBBSC03005819ACCSC03005826CCCSC03005827ADA
SC03005827CBCSC03005830CDCSC03005833CCCSC03005834CDDSC03005901ACB1
SC03005901ACB2
SC03005902CBDSC03005910CAASC03005913CABSC03005916BAD
SC03005919DBDSC03005921DAASC03005924BBCSC03005927CACSC03005931DBA
SC03005932ABCSC03005934DBC1SC03005934DBD2SC03005934DCASC03005935DAC
SC03006005BDASC03006009ABDSC03006014ABDSC03006019ABASC03006023DAD
SC03006026DBDSC03006028DADSC03006035ABDSC03105802BBDSC03105803CBB
SC03105804CAASC03105805DDCSC03105808CDDSC03105809ACCSC03105901ABA
SC03105902CDBSC03105904CAASC03105904CBCSC03105906AAASC03105908DCD
Latitude (degrees , minutes, seconds)
3737373737
3737373737
37
37373737
3737373737
3737373737
3737373737
3737373737
3737373737
3737373737
2626252324
2423222227
27
27262526
2424252323
2323232323
2727262524
2424232222
2221212122
2222222221
3019084414
0144515647
47
29434807
5656185713
3205080208
5508173056
0203344019
1954043049
1018124605
Longitude (degrees , minutes, seconds)
103103103103103
103103103103103
103
103103103104
104104103104104
104103103103103
104104104104104
104104104103103
103103103103103
103104104104104
5157565252
5356555357
57
59595700
0200580002
0259595958
0807050904
0507055354
5455555457
5901010201
4201314056
5146002330
30
01545356
5327100258
0047474731
4018073054
1006100215
5537574233
0510314658
Altitude of land surface (feet)
5,0455,0855,1045,0965,060
5,0695,1225,1285,1105,186
5,1555,2065,0935,242
5,3425,2655,1305,2555,225
5,2605,2055,2055,2005,178
5,6495,6305,4255,4665,340
5,3135,3255,2855,0605,118
5,0985,0855,0705,0455,124
5,1415,1655,1455,1955,289
Water level
(feet)
130.3111. 1117.6181.5134.1
--
52.22109.80
--
Description of site at time of inventory
Windmill, in very poor repair.Cased hole only.Windmill, in poor repair.Windmill, possibly operative.Ranch domestic well, in pumphouse,
Drop pipe and casing only, tanks.Windmill tower blown down.Windmill, apparently operative.Windmill, ranch domestic well.
operating
Cased hole only, rebored as SC03005901ACB2 .
280.0
--199.6
--
74.29
170.8114.9116.0172.858.20
119.6112.8115.2121.888.10
385.8------
152.1
--112.298.50--
132.8
47.99117.8110.189.0766.25
60.4053.8720.1637.40128.6
Submersible pump, supplies pipelinedomestic stock.
Windmill, apparently operative.Windmill, apparently operative.Rock-lined, dug well, filled to 11Cased hole only.
Windmill, sucker rod broken.Windmill, apparently operative.Windmill, sucker rod broken.Windmill, operative.Windmill, operative.
Windmill, operative.Open casing under wooden tower.Windmill, apparently operative.Cased hole through slab.Windmill, apparently operative.
Windmill, operative.Windmill, operative.Windmill, apparently operative.Windmill, apparently operative.Windmill, operative.
Cased hole under windmill tower.Submersible pump, supplies pipelineWindmill, apparently operative.Submersible pump, supplies pipelineSubmersible pump in pit.
Windmill, possibly operative.Windmill, operative.Windmill, sucker rod broken.Cased hole through slab only.Windmill, apparently operative.
Windmill, apparently operative.Cased hole under old tower.Windmill, operative.Windmill, operative.Windmill, standby pump jack.
,
feet.
, tower.
17
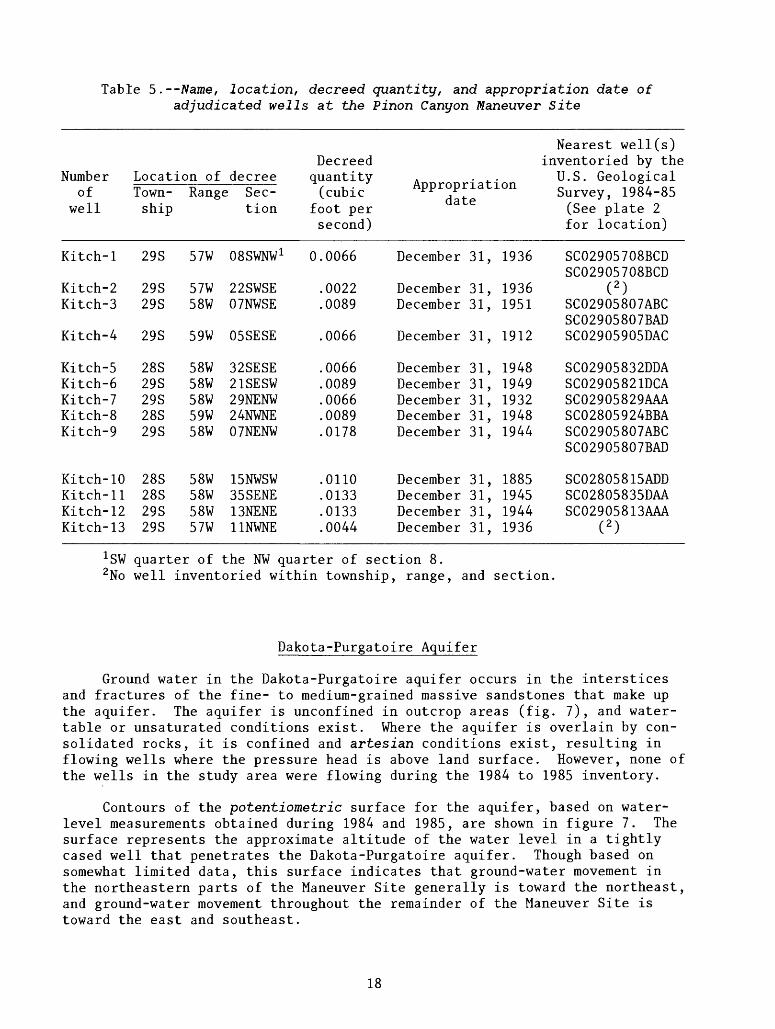
Table 5. --Name, location, decreed quantity, and appropriation date of adjudicated wells at the Pinon Canyon Maneuver Site
Number of
well
Location of decreeTown ship
Range Sec tion
Decreed quantity (cubic
foot per second)
Appropriation date
Nearest well(s) inventoried by the
U.S. Geological Survey, 1984-85 (See plate 2 for location)
Kitch-1 29S 57W 08SWNW 1 0.0066 December 31, 1936
Kitch-2 Kitch-3
29S 29S
57W 22SWSE 58W 07NWSE
Kitch-4 29S 59W 05SESE
Kitch-5 Kitch-6 Kitch-7 Kitch-8 Kitch-9
28S 29S 29S 28S 29S
Kitch-10 28SKitch-11 28SKitch-12 29SKitch-13 29S
58W 32SESE58W 21SESW58W 29NENW59W 24NWNE58W 07NENW
58W 15NWSW58W 35SENE58W 13NENE57W 11NWNE
.0022
.0089
.0066
.0066
.0089
.0066
.0089
.0178
0110013301330044
December 31, 1936December 31, 1951
December 31, 1912
December December December December December
31, 194831, 194931, 193231, 194831, 1944
December 31, 1885December 31, 1945December 31, 1944December 31, 1936
SC02905708BCD SC02905708BCD
( 2 )SC02905807ABC SC02905807BAD SC02905905DAC
SC02905832DDA SC02905821DCA SC02905829AM SC02805924BBA SC02905807ABC SC02905807BAD
SC02805815ADD SC02805835DM SC02905813AM
1 SW quarter of the NW quarter of section 8.2No well inventoried within township, range, and section.
Dakota-Purgatoire Aquifer
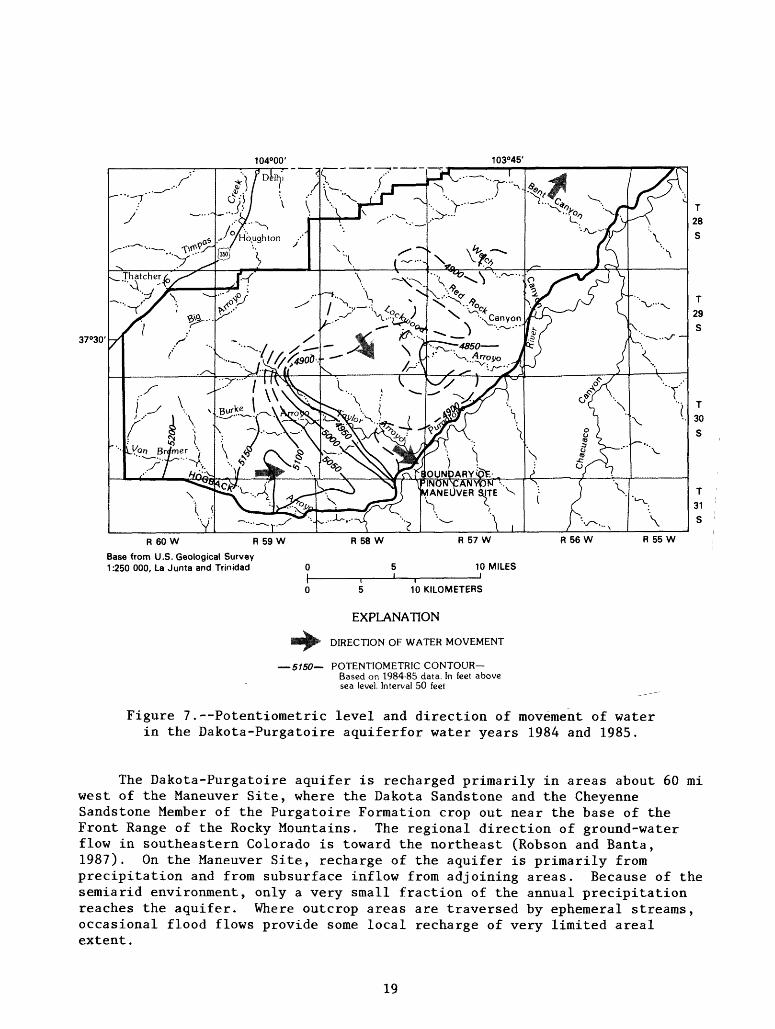
Ground water in the Dakota-Purgatoire aquifer occurs in the interstices and fractures of the fine- to medium-grained massive sandstones that make up the aquifer. The aquifer is unconfined in outcrop areas (fig. 7), and water- table or unsaturated conditions exist. Where the aquifer is overlain by con solidated rocks, it is confined and artesian conditions exist, resulting in flowing wells where the pressure head is above land surface. However, none of the wells in the study area were flowing during the 1984 to 1985 inventory.
Contours of the potentiometric surface for the aquifer, based on water- level measurements obtained during 1984 and 1985, are shown in figure 7. The surface represents the approximate altitude of the water level in a tightly cased well that penetrates the Dakota-Purgatoire aquifer. Though based on somewhat limited data, this surface indicates that ground-water movement in the northeastern parts of the Maneuver Site generally is toward the northeast, and ground-water movement throughout the remainder of the Maneuver Site is toward the east and southeast.
18
104°00' 103°45'
37°30'
Base from U.S. Geological Survey 1:250 000, La Junta and Trinidad
5 10 KILOMETERS
EXPLANATION
DIRECTION OF WATER MOVEMENT
5150 POTENTIOMETRIC CONTOUR Based on 1984-85 data. In feet above sea level. Interval 50 feet
Figure 7. Potentiometric level and direction of movement of water in the Dakota-Purgatoire aquiferfor water years 1984 and 1985.
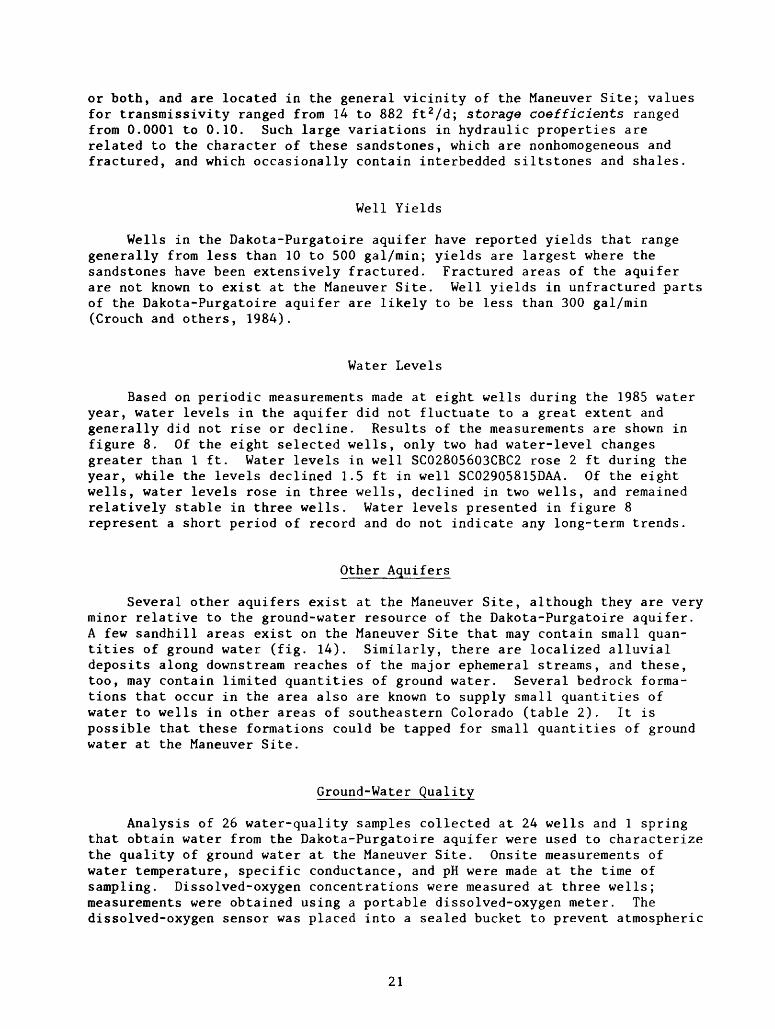
The Dakota-Purgatoire aquifer is recharged primarily in areas about 60 mi west of the Maneuver Site, where the Dakota Sandstone and the Cheyenne Sandstone Member of the Purgatoire Formation crop out near the base of the Front Range of the Rocky Mountains. The regional direction of ground-water flow in southeastern Colorado is toward the northeast (Robson and Banta, 1987). On the Maneuver Site, recharge of the aquifer is primarily from precipitation and from subsurface inflow from adjoining areas. Because of the semiarid environment, only a very small fraction of the annual precipitation reaches the aquifer. Where outcrop areas are traversed by ephemeral streams, occasional flood flows provide some local recharge of very limited areal extent.
19
Discharge from the aquifer is by well pumpage, spring flow, evapotran- spiration, and ground-water flow out of the study area. Because no pumping records are available, quantification of pumpage is not possible. However, on the basis of the number of wells known to exist, and assuming a liberal pumping rate of 5 gal/min, the annual discharge by pumpage is less than 800 acre-ft/yr. Spring flow also is fairly substantial in the study area and occurs in topographically low areas of the Dakota Sandstone and where stream channels intersect the local water table. Discharge by evapotranspiration only occurs in limited areas where water levels are at or near land surface. In these areas, direct evaporation or transpiration by vegetation (grasses, desert plants, cottonwood trees) results in loss of subsurface water.
Hydraulic Properties
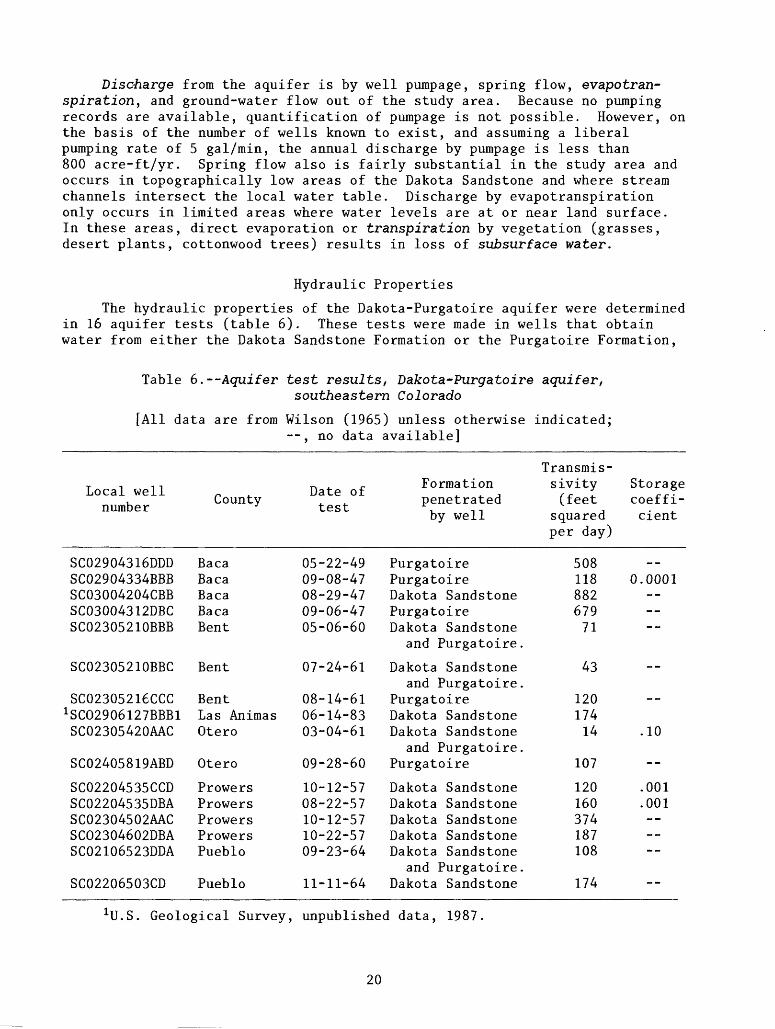
The hydraulic properties of the Dakota-Purgatoire aquifer were determined in 16 aquifer tests (table 6). These tests were made in wells that obtain water from either the Dakota Sandstone Formation or the Purgatoire Formation,
Table 6.--Aquifer test results, Dakota-Purgatoire aquifer,southeastern Colorado
[All data are from Wilson (1965) unless otherwise indicated;--, no data available]
Local well number
SC02904316DDDSC02904334BBBSC03004204CBBSC03004312DBCSC02305210BBB
SC02305210BBC
SC02305216CCC1 SC02906127BBB1SC02305420AAC
SC02405819ABD
SC02204535CCDSC02204535DBASC02304502MCSC02304602DBASC02106523DDA
SC02206503CD
County
BacaBacaBacaBacaBent
Bent
BentLas AnimasOtero
Otero
ProwersProwersProwersProwersPueblo
Pueblo
Date of test
05-22-4909-08-4708-29-4709-06-4705-06-60
07-24-61
08-14-6106-14-8303-04-61
09-28-60
10-12-5708-22-5710-12-5710-22-5709-23-64
11-11-64
Transmis- Formation sivity penetrated (feet by well squared
per day)
PurgatoirePurgatoireDakota SandstonePurgatoireDakota Sandstone
and Purgatoire.
Dakota Sandstoneand Purgatoire.
PurgatoireDakota SandstoneDakota Sandstone
and Purgatoire.Purgatoire
Dakota SandstoneDakota SandstoneDakota SandstoneDakota SandstoneDakota Sandstone
and Purgatoire.Dakota Sandstone
50811888267971
43
12017414
107
120160374187108
174
Storage coeffi cient
--0.0001
------
--
.10
--
.001
.001----
1U.S. Geological Survey, unpublished data, 1987.
20
or both, and are located in the general vicinity of the Maneuver Site; values for transmissivity ranged from 14 to 882 ft 2 /d; storage coefficients ranged from 0.0001 to 0.10. Such large variations in hydraulic properties are related to the character of these sandstones, which are nonhomogeneous and fractured, and which occasionally contain interbedded siltstones and shales.
Well Yields
Wells in the Dakota-Purgatoire aquifer have reported yields that range generally from less than 10 to 500 gal/min; yields are largest where the sandstones have been extensively fractured. Fractured areas of the aquifer are not known to exist at the Maneuver Site. Well yields in unfractured parts of the Dakota-Purgatoire aquifer are likely to be less than 300 gal/min (Crouch and others, 1984).
Water Levels
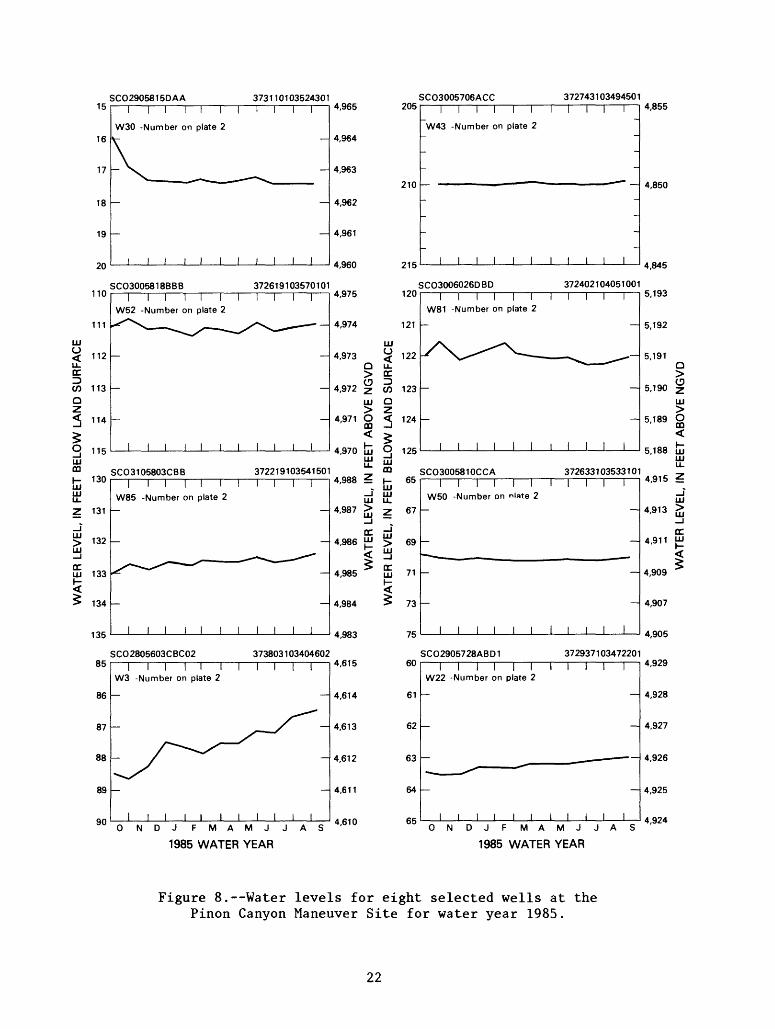
Based on periodic measurements made at eight wells during the 1985 water year, water levels in the aquifer did not fluctuate to a great extent and generally did not rise or decline. Results of the measurements are shown in figure 8. Of the eight selected wells, only two had water-level changes greater than 1 ft. Water levels in well SC02805603CBC2 rose 2 ft during the year, while the levels declined 1.5 ft in well SC02905815DAA. Of the eight wells, water levels rose in three wells, declined in two wells, and remained relatively stable in three wells. Water levels presented in figure 8 represent a short period of record and do not indicate any long-term trends.
Other Aquifers
Several other aquifers exist at the Maneuver Site, although they are very minor relative to the ground-water resource of the Dakota-Purgatoire aquifer. A few sandhill areas exist on the Maneuver Site that may contain small quan tities of ground water (fig. 14). Similarly, there are localized alluvial deposits along downstream reaches of the major ephemeral streams, and these, too, may contain limited quantities of ground water. Several bedrock forma tions that occur in the area also are known to supply small quantities of water to wells in other areas of southeastern Colorado (table 2). It is possible that these formations could be tapped for small quantities of ground water at the Maneuver Site.
Ground-Water Quality
Analysis of 26 water-quality samples collected at 24 wells and 1 spring that obtain water from the Dakota-Purgatoire aquifer were used to characterize the quality of ground water at the Maneuver Site. Onsite measurements of water temperature, specific conductance, and pH were made at the time of sampling. Dissolved-oxygen concentrations were measured at three wells; measurements were obtained using a portable dissolved-oxygen meter. The dissolved-oxygen sensor was placed into a sealed bucket to prevent atmospheric
21
WA
TE
R L
EV
EL,
IN
FE
ET
BE
LOW
LA
ND
SU
RF
AC
E
00
->
H-
00
H- n
>p O
00
p
O
I03
«
P
0><<
rt
o
rtP
n
3 M
03
n>P
<
rt
rtP
M<
tn
n> i-s
t-h
o
CO
hj
H- rt
rofl>
H
- 00
H> t
r o
rt
oo
m
>
5
c
3
WA
TE
R L
EV
EL,
IN
FE
ET
AB
OV
E N
GV
D
WA
TE
R L
EV
EL,
IN
FE
ET
BE
LOW
LA
ND
SU
RF
AC
E
o z 0
i -
<*
-n
^^ H
m
>3
) m
2
5- t_ j> CO
t I
N) _
N
J
" \
t~}
1-
§-l
f _
\I _
1
<t> N3 _
1 1
CO o
0
M cn £> 00
O 00
00 o 00 M M
O
1 1
_ - _
1 1
/
' '
*
§ -
z
c 3 cr
~~
o> 0
~3 3
_
:» (B M
_
1 1
g
8 WA
TE
R L
EV
EL,
IN
FE
ET
AB
OV
E N
GV
D
aeration of the sample (Wood, 1976). Ground water was pumped through the bucket during the measurement of dissolved oxygen. Chemical constituents analyzed included alkalinity, major ions, dissolved solids, and dissolved concentrations of iron, manganese, arsenic, and selenium. Additionally, radiochemicals were analyzed at selected wells because large concentrations of radioactivity are typical of water from the Dakota-Purgatoire aquifer (Femlee and Cadigan, 1979; Leonard, 1984).
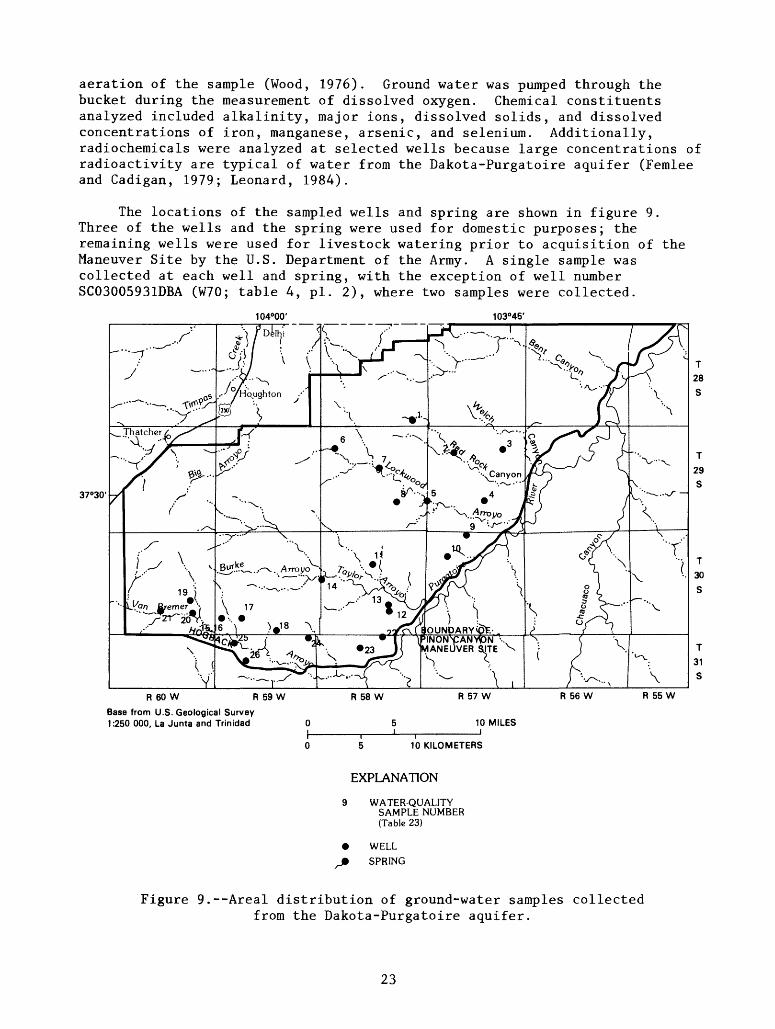
The locations of the sampled wells and spring are shown in figure 9. Three of the wells and the spring were used for domestic purposes; the remaining wells were used for livestock watering prior to acquisition of the Maneuver Site by the U.S. Department of the Army. A single sample was collected at each well and spring, with the exception of well number SC03005931DBA (W70; table 4, pi. 2), where two samples were collected.
104°00' 103°45'
37°30'
R 60 W R 59 W R 58 W R 57 W R 56 W R 55 W
Base from U.S. Geological Survey 1:250 000, La Junta and Trinidad 10 MILES
10 KILOMETERS
EXPLANATION
9 WATER-QUALITYSAMPLE NUMBER (Table 23)
WELL
J* SPRING
Figure 9.--Areal distribution of ground-water samples collected from the Dakota-Purgatoire aquifer.
23
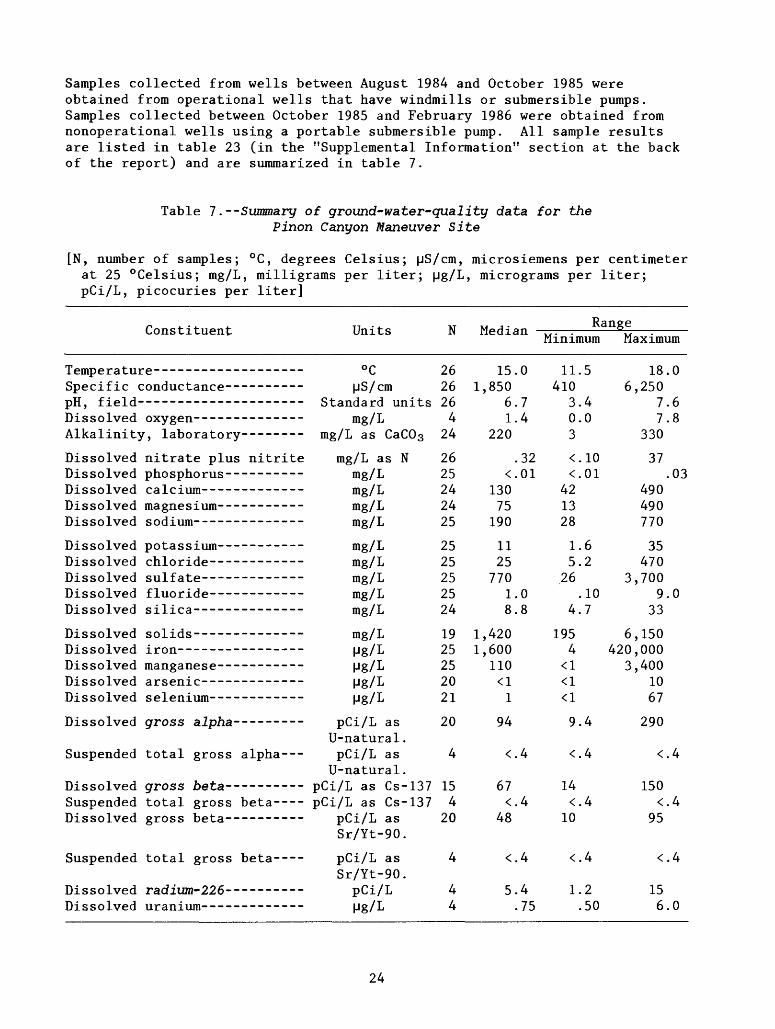
Samples collected from wells between August 1984 and October 1985 were obtained from operational wells that have windmills or submersible pumps. Samples collected between October 1985 and February 1986 were obtained from nonoperational wells using a portable submersible pump. All sample results are listed in table 23 (in the "Supplemental Information" section at the back of the report) and are summarized in table 7.
Table 7.--Summary of ground-water-quality data for the Pinon Canyon Maneuver Site
[N, number of samples; °C, degrees Celsius; pS/cm, microsiemens per centimeter at 25 °Celsius; mg/L, milligrams per liter; pg/L, micrograms per liter; pCi/L, picocuries per liter]
Constituent Units N MedianRange
Minimum Maximum
Temperature----- ------------SpecificpH, fieldDissolved
conductance-- --------
oxygen- -------------Alkalinity, laboratory--- ---
DissolvedDissolvedDissolvedDissolvedDissolved
DissolvedDissolvedDissolvedDissolvedDissolved
DissolvedDissolvedDissolvedDissolvedDissolved
Dissolved
Suspended
DissolvedSuspendedDissolved
Suspended
DissolvedDissolved
nitrate plus nitritephospho rus ----------calcium-- -----------magnesium- --- ---sodium--------- ---
potassium- ----------chlo r i de ------------sulf ate-- -----------f luoride- --------- --silica--------------
solids ------------ --iron- -------------- -manganese-- -------- -ar senic- ------------selenium- -----------
gross alpha -- -- -- -- -
total gross alpha---
gross beta- --- --- -- -total gross beta----gross beta---- ----
total gross beta----
radium-226- ---------ur anium- ------------
°C
pS/cmStandard units
mg/Lmg/L as CaCOs
mg/L as Nmg/Lmg/Lmg/Lmg/L
mg/Lmg/Lmg/Lmg/Lmg/L
mg/LM8/LM8/Lpg/LM8/L
pCi/L asU-natural.pCi/L as
U-natural.pCi/L as Cs-137pCi/L as Cs-137
pCi/L asSr/Yt-90.
pCi/L asSr/Yt-90.pCi/LM8/L
2626264
24
2625242425
2525252524
1925252021
20
4
154
20
4
44
15.1,850
6.1.
220
.<.
13075
190
1125
7701.8.
1,4201,600
110<11
94
<.
67<.
48
<.
5..
0
74
3201
08
4
4
4
475
11410
303
<<
421328
15
26
4
1954
<1<1<1
9
<
14<
10
<
1
.5
.4
.0
.10
.01
.6
.2
.10
.7
.4
.4
.4
.4
.2
.50
186,250
77
330
37
490490770
35470
3,7009
33
6,150420,000
3,4001067
290
<
150<
95
<
156
.0
.6
.8
.03
.0
.4
.4
.4
.0
24
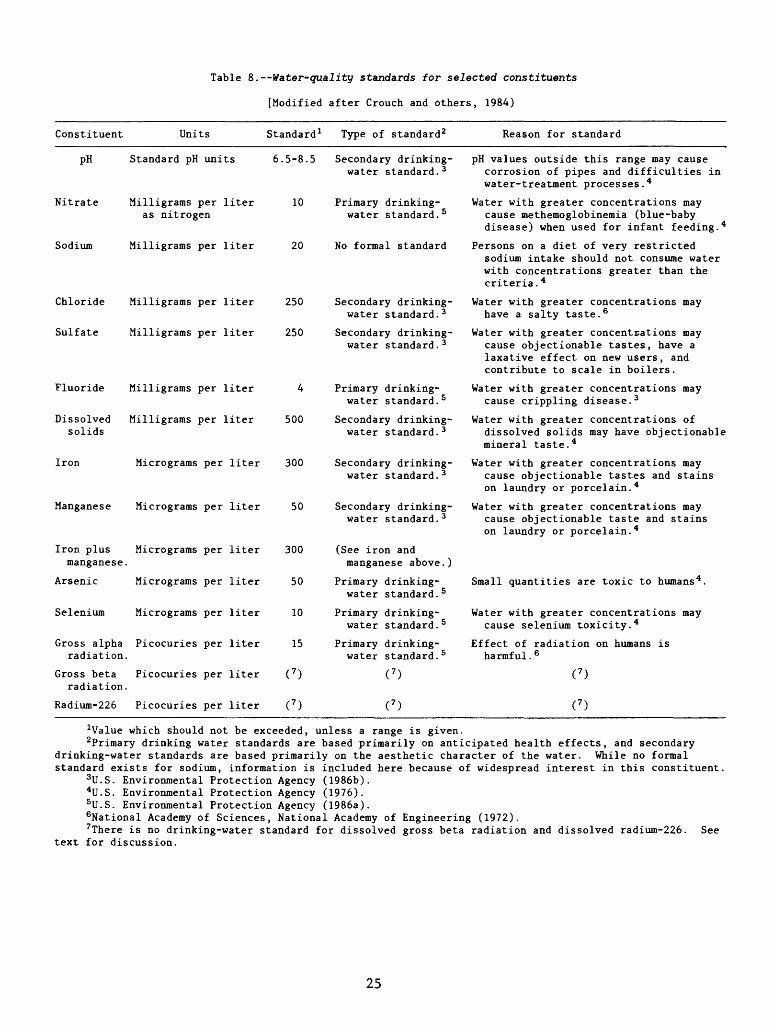
Table 8. --Water-quality standards for selected constituents
[Modified after Crouch and others, 1984)
Constituent Units Standard 1 Type of standard 2 Reason for standard
pH Standard pH units
Nitrate Milligrams per liter as nitrogen
Sodium Milligrams per liter
Chloride Milligrams per liter
Sulfate Milligrams per liter
Fluoride Milligrams per liter
Dissolved Milligrams per liter solids
Iron Micrograms per liter
Manganese Micrograms per liter
Iron plus Micrograms per liter manganese.
Arsenic Micrograms per liter
Selenium Micrograms per liter
Gross alpha Picocuries per liter radiation.
Gross beta Picocuries per liter radiation.
Radium-226 Picocuries per liter
6.5-8.5 Secondary drinking- water standard. 3
10 Primary drinking- water standard. 5
20 No formal standard
250 Secondary drinking- water standard. 3
250 Secondary drinking- water standard. 3
4 Primary drinking- water standard. 5
500 Secondary drinking- water standard. 3
300 Secondary drinking- water standard. 3
50 Secondary drinking- water standard. 3
300 (See iron andmanganese above.)
50 Primary drinking- water standard. 5
10 Primary drinking- water standard. 5
15 Primary drinking- water standard. 5
pH values outside this range may cause corrosion of pipes and difficulties in water-treatment processes. 4
Water with greater concentrations may cause methemoglobinemia (blue-baby disease) when used for infant feeding. 4
Persons on a diet of very restricted sodium intake should not consume water with concentrations greater than the criteria. 4
Water with greater concentrations may have a salty taste. 6
Water with greater concentrations may cause objectionable tastes, have a laxative effect on new users, and contribute to scale in boilers.
Water with greater concentrations may cause crippling disease. 3
Water with greater concentrations ofdissolved solids may have objectionable mineral taste. 4
Water with greater concentrations may cause objectionable tastes and stains on laundry or porcelain. 4
Water with greater concentrations may cause objectionable taste and stains on laundry or porcelain. 4
Small quantities are toxic to humans 4 .
Water with greater concentrations may cause selenium toxicity. 4
Effect of radiation on humans is harmful. 6
1Value which should not be exceeded, unless a range is given.2Primary drinking water standards are based primarily on anticipated health effects, and secondary
drinking-water standards are based primarily on the aesthetic character of the water. While no formal standard exists for sodium, information is included here because of widespread interest in this constituent.
3U.S. Environmental Protection Agency (1986b).4U.S. Environmental Protection Agency (1976).5U.S. Environmental Protection Agency (1986a).6National Academy of Sciences, National Academy of Engineering (1972).7There is no drinking-water standard for dissolved gross beta radiation and dissolved radium-226. See
text for discussion.
25
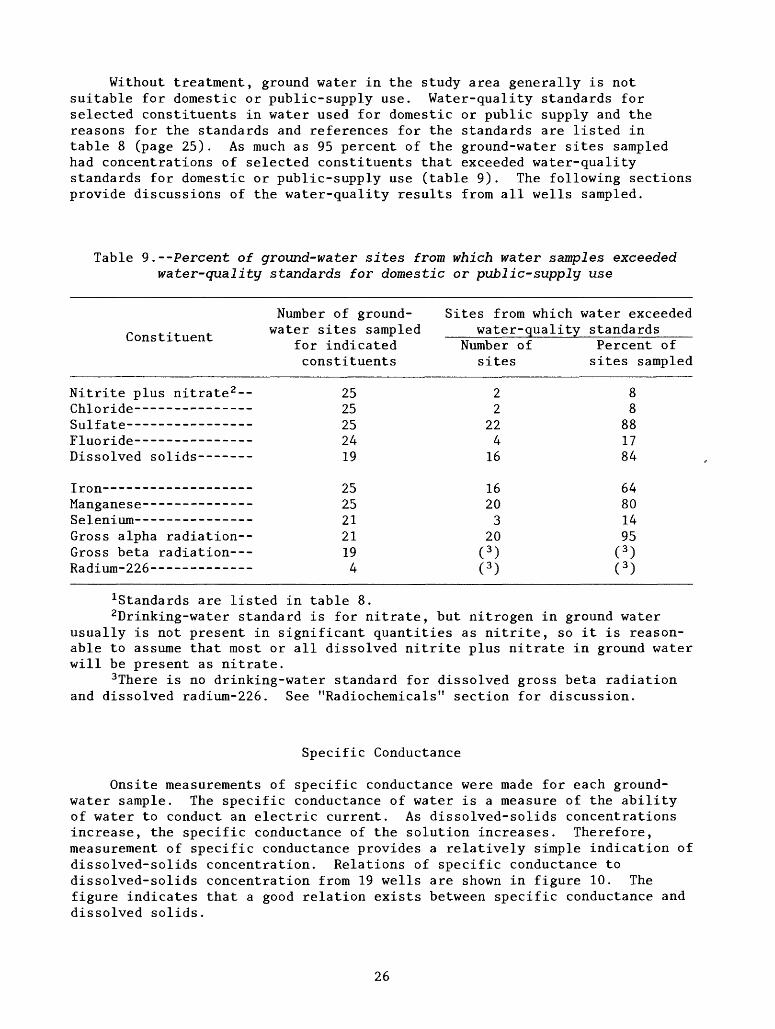
Without treatment, ground water in the study area generally is not suitable for domestic or public-supply use. Water-quality standards for selected constituents in water used for domestic or public supply and the reasons for the standards and references for the standards are listed in table 8 (page 25). As much as 95 percent of the ground-water sites sampled had concentrations of selected constituents that exceeded water-quality standards for domestic or public-supply use (table 9). The following sections provide discussions of the water-quality results from all wells sampled.
Table 9.--Percent of ground-water sites from which water samples exceeded water-quality standards for domestic or public-supply use
Number of ground- Sites from which water exceeded water sites sampled water-quality standards
\j«Jii& UJ- UUCllL.
Nitrite plus nitrate 2 -- Chloride
Fluoride-- -------------Dissolved solids-------
Iron- ------------------
iidii^ciiicroC,Selenium--- ------------
Gross alpha radiation- Gross beta radiation--- Radium-226
for indicated constituents
25 2525o /2419
2525A^-^f
21 21 19 4
Number of sites
22
22 4
16
16203
20 ( 3 )( 3 )
Perce sites
8
ftftoo
1784
64enoU1495
( 3 ) ( 3 )
nt of sampled
Standards are listed in table 8.2Drinking-water standard is for nitrate, but nitrogen in ground water
usually is not present in significant quantities as nitrite, so it is reason able to assume that most or all dissolved nitrite plus nitrate in ground water will be present as nitrate.
3There is no drinking-water standard for dissolved gross beta radiation and dissolved radium-226. See "Radiochemicals" section for discussion.
Specific Conductance
Onsite measurements of specific conductance were made for each ground- water sample. The specific conductance of water is a measure of the ability of water to conduct an electric current. As dissolved-solids concentrations increase, the specific conductance of the solution increases. Therefore, measurement of specific conductance provides a relatively simple indication of dissolved-solids concentration. Relations of specific conductance to dissolved-solids concentration from 19 wells are shown in figure 10. The figure indicates that a good relation exists between specific conductance and dissolved solids.
26
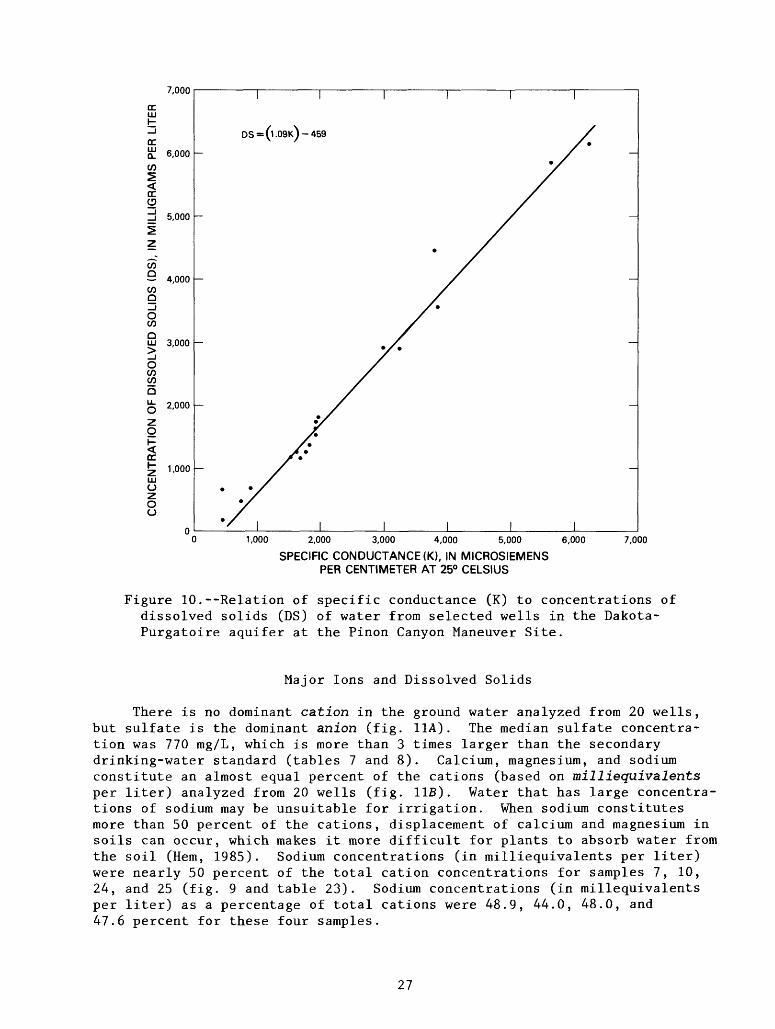
DC
DC
7,000
6,000
5,000
DS=(l.09K)-459
C/5~ 4,000
O C/5OLU
O C/5 C/5Q
<oc
OzO O
3,000
2,000
1,000
1,000 2,000 3,000 4,000 5,000
SPECIFIC CONDUCTANCE (K), IN MICROSIEMENS PER CENTIMETER AT 25° CELSIUS
6,000 7,000
Figure 10.--Relation of specific conductance (K) to concentrations of dissolved solids (DS) of water from selected wells in the Dakota- Purgatoire aquifer at the Pinon Canyon Maneuver Site.
Major Ions and Dissolved Solids
There is no dominant cation in the ground water analyzed from 20 wells, but sulfate is the dominant anion (fig. HA). The median sulfate concentra tion was 770 mg/L, which is more than 3 times larger than the secondary drinking-water standard (tables 7 and 8). Calcium, magnesium, and sodium constitute an almost equal percent of the cations (based on milliequivalents per liter) analyzed from 20 wells (fig. 11B). Water that has large concentra tions of sodium may be unsuitable for irrigation. When sodium constitutes more than 50 percent of the cations, displacement of calcium and magnesium in soils can occur, which makes it more difficult for plants to absorb water from the soil (Hem, 1985). Sodium concentrations (in milliequivalents per liter) were nearly 50 percent of the total cation concentrations for samples 7, 10, 24, and 25 (fig. 9 and table 23). Sodium concentrations (in millequivalents per liter) as a percentage of total cations were 48.9, 44.0, 48.0, and 47.6 percent for these four samples.
27
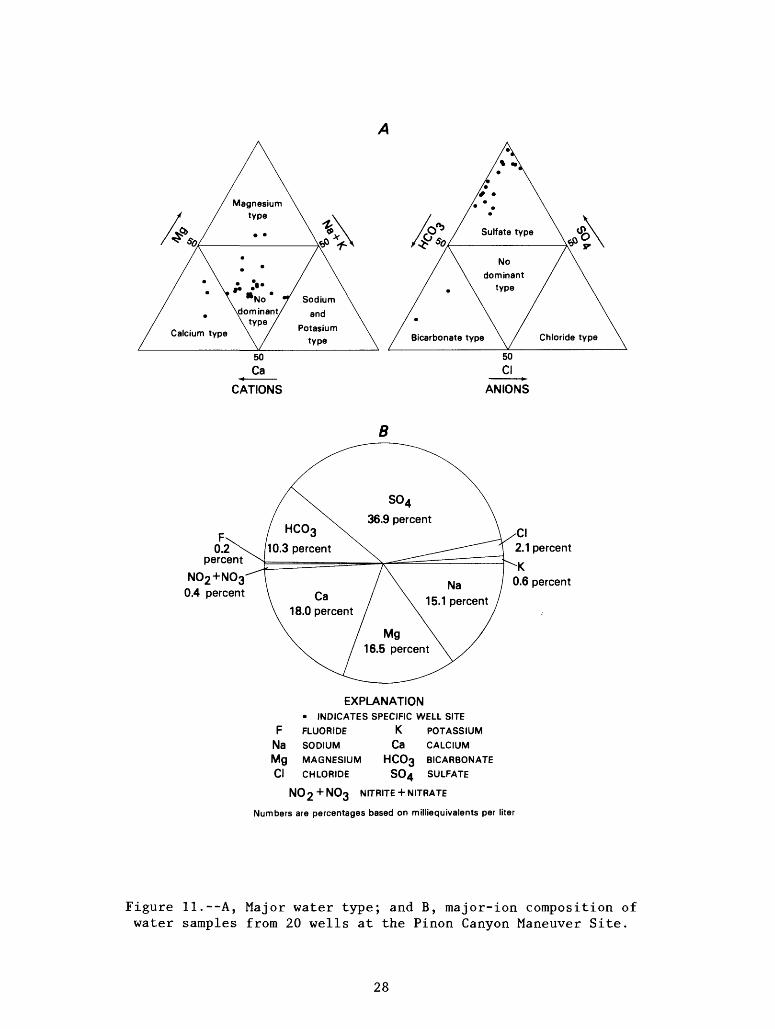
CATIONS ANIONS
EXPLANATION INDICATES SPECIFIC WELL SITE
FNa MgCl
FLUORIDE K POTASSIUM
SODIUM Ca CALCIUM
MAGNESIUM HC03 BICARBONATE
CHLORIDE S04 SULFATE
N02+N03 NITRITE + NITRATE
Numbers are percentages based on milliequivalents per liter
Figure 11.--A, Major water type; and B, major-ion composition of water samples from 20 wells at the Pinon Canyon Maneuver Site.
28
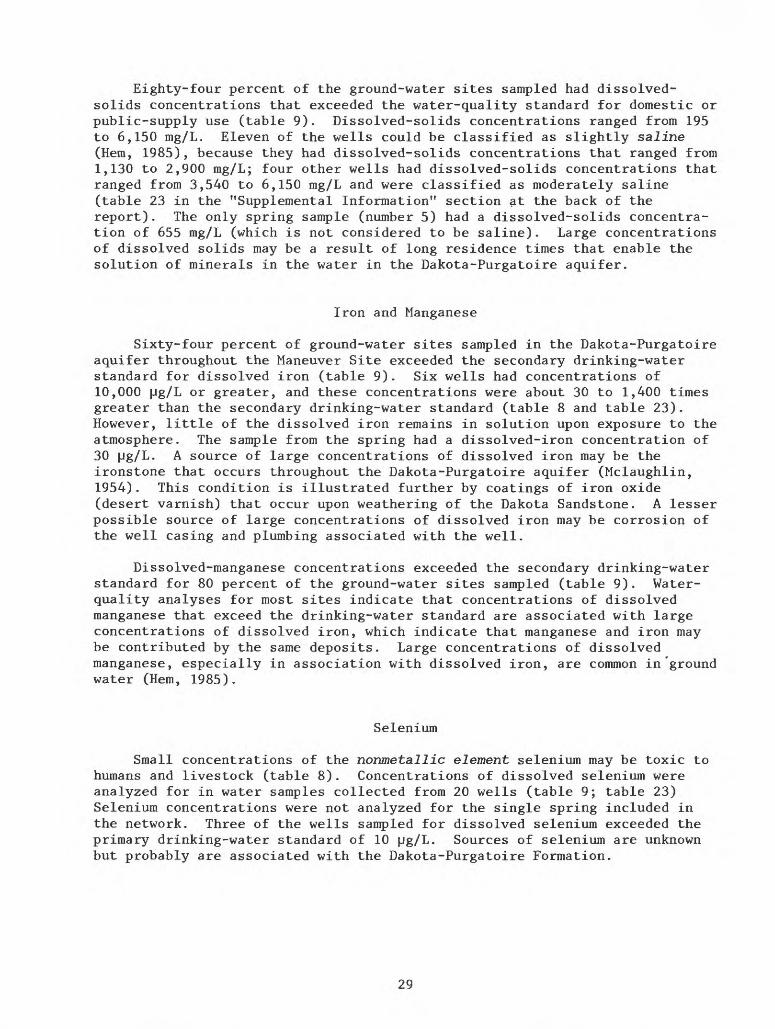
Eighty-four percent of the ground-water sites sampled had dissolved- solids concentrations that exceeded the water-quality standard for domestic or public-supply use (table 9). Dissolved-solids concentrations ranged from 195 to 6,150 mg/L. Eleven of the wells could be classified as slightly saline (Hem, 1985), because they had dissolved-solids concentrations that ranged from 1,130 to 2,900 mg/L; four other wells had dissolved-solids concentrations that ranged from 3,540 to 6,150 mg/L and were classified as moderately saline (table 23 in the "Supplemental Information" section at the back of the report). The only spring sample (number 5) had a dissolved-solids concentra tion of 655 mg/L (which is not considered to be saline). Large concentrations of dissolved solids may be a result of long residence times that enable the solution of minerals in the water in the Dakota-Purgatoire aquifer.
Iron and Manganese
Sixty-four percent of ground-water sites sampled in the Dakota-Purgatoire aquifer throughout the Maneuver Site exceeded the secondary drinking-water standard for dissolved iron (table 9). Six wells had concentrations of 10,000 }Jg/L or greater, and these concentrations were about 30 to 1,400 times greater than the secondary drinking-water standard (table 8 and table 23). However, little of the dissolved iron remains in solution upon exposure to the atmosphere. The sample from the spring had a dissolved-iron concentration of 30 pg/L. A source of large concentrations of dissolved iron may be the ironstone that occurs throughout the Dakota-Purgatoire aquifer (Mclaughlin, 1954). This condition is illustrated further by coatings of iron oxide (desert varnish) that occur upon weathering of the Dakota Sandstone. A lesser possible source of large concentrations of dissolved iron may be corrosion of the well casing and plumbing associated with the well.
Dissolved-manganese concentrations exceeded the secondary drinking-water standard for 80 percent of the ground-water sites sampled (table 9). Water- quality analyses for most sites indicate that concentrations of dissolved manganese that exceed the drinking-water standard are associated with large concentrations of dissolved iron, which indicate that manganese and iron may be contributed by the same deposits. Large concentrations of dissolved manganese, especially in association with dissolved iron, are common in'ground water (Hem, 1985).
Selenium
Small concentrations of the nonmetallic element selenium may be toxic to humans and livestock (table 8). Concentrations of dissolved selenium were analyzed for in water samples collected from 20 wells (table 9; table 23) Selenium concentrations were not analyzed for the single spring included in the network. Three of the wells sampled for dissolved selenium exceeded the primary drinking-water standard of 10 pg/L. Sources of selenium are unknown but probably are associated with the Dakota-Purgatoire Formation.
29
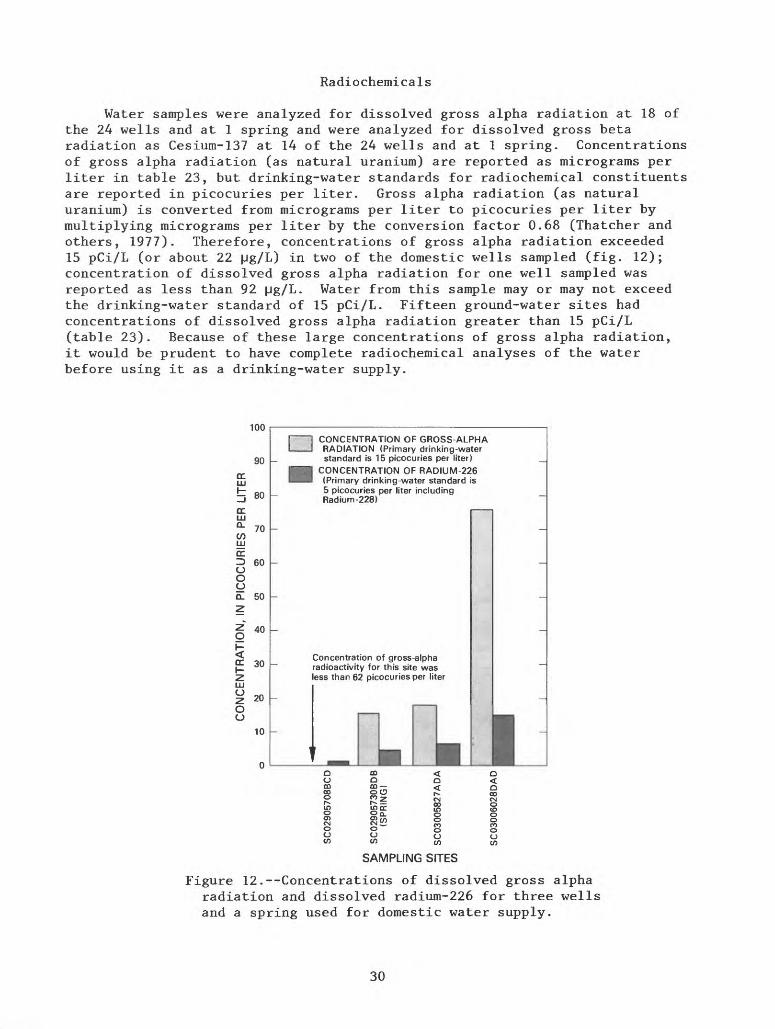
Radiochemicals
Water samples were analyzed for dissolved gross alpha radiation at 18 of the 24 wells and at 1 spring and were analyzed for dissolved gross beta radiation as Cesium-137 at 14 of the 24 wells and at 1 spring. Concentrations of gross alpha radiation (as natural uranium) are reported as micrograms per liter in table 23, but drinking-water standards for radiochemical constituents are reported in picocuries per liter. Gross alpha radiation (as natural uranium) is converted from micrograms per liter to picocuries per liter by multiplying micrograms per liter by the conversion factor 0.68 (Thatcher and others, 1977). Therefore, concentrations of gross alpha radiation exceeded 15 pCi/L (or about 22 |Jg/L) in two of the domestic wells sampled (fig. 12); concentration of dissolved gross alpha radiation for one well sampled was reported as less than 92 [Jg/L. Water from this sample may or may not exceed the drinking-water standard of 15 pCi/L. Fifteen ground-water sites had concentrations of dissolved gross alpha radiation greater than 15 pCi/L (table 23). Because of these large concentrations of gross alpha radiation, it would be prudent to have complete radiochemical analyses of the water before using it as a drinking-water supply.
IVJVJ
90 ccLU
^ 80
OCLU°- 70 ODLU
PICOCURI s g
2
| 4°
| 30
LU
2 20 O O
10
0
n CONCENTRATION OF GROSS-ALPHA RADIATION (Primary drinking-water
_ standard is 15 picocuries per liter) _
CONCENTRATION OF RADIUM-226 (Primary drinking-water standard is 5 picocuries per liter including Radium-228)
~
-
-
Concentration of gross-alpha ~~ radioactivity for this site was
less than 62 picocuries per liter
-
1 ' in_ _______ 1 » 1 ^ 1
O CD < 0 O 0 CD CO < §0(3 fti
1*5 T9 M.I
-
-
' ;
^1
O < O 00
1 P s §O O Q_ o o O) O) f/\ ^ o
SAMPLING SITES
Figure 12.--Concentrations of dissolved gross alpha radiation and dissolved radium-226 for three wells and a spring used for domestic water supply.
30
There is no drinking-water standard established for dissolved gross beta radiation. However, State regulations (Colorado Department of Health, 1977) specify that when gross beta radiation exceeds 50 pCi/L, the water should be analyzed to identify the major radioactive constituents that are present. Dissolved gross beta radiation as Cesium-137 exceeded 50 pCi/L in 10 wells (table 23). The only spring sample had a concentration of 17 pCi/L.
Three wells and one spring that were used for domestic purposes were sampled for dissolved radium-226 and dissolved uranium. Concentrations of dissolved radium-226 at three domestic wells ranged from 1.2 to 15 pCi/L; the radium-226 concentration for the spring sampled was 4.4 pCi/L (fig. 12). The drinking-water standard for dissolved radium is based on radiation from radium-226 and radiom-228. No analysis for dissolved concentrations of radium-228 was made. Therefore, direct comparison of concentrations of dissolved radium-226 to the drinking-water standard of 5 pCi/L could not be made. However, for these samples, the concentrations of dissolved radium-226 almost met or exceeded the combined drinking-water standard for radium 226 and 228. Because of these large concentrations of radium-226, it would be prudent to have a complete radiochemical analysis of the water before using it as a drinking-water supply.
Development Considerations
The Dakota-Purgatoire aquifer is the most dependable source of ground water at the Maneuver Site. Continued use of this source of water is possible for some purposes. The aquifer can continue to be a source of water for wildlife and for stock use during off-training periods. Water from the Dakota-Purgatoire aquifer has been and is being used for domestic purposes at homesteads on the site. However, chemical concentrations of constituents analyzed from wells that yield water from the Dakota-Purgatoire aquifer commonly exceeded drinking-water standards (table 9).
The natural presence of large concentrations of dissolved solids, sulfate, iron, manganese, and radiochemical constituents in most samples collected limits the usefulness of ground water from the Dakota-Purgatoire aquifer as a domestic water supply. Because of the large concentrations of naturally occurring radioactivity, it would be prudent to have a complete radiochemical analysis of the water before using it as a drinking-water supply. Large concentrations of nitrate, chloride, fluoride, and selenium may further exclude certain wells as sources of drinking water. Additional investigation is necessary to determine what treatment would be needed to bring the water within the limits of drinking-water standards.
SURFACE WATER
The following is a discussion of the surface-water resources of the Maneuver Site. Included in this section are data that pertain to the temporal and spatial characteristics of streamflow and rainfall runoff. The discussion of surface-water quality includes instream water-quality standards, summary statistics of water-quality data, and dissolved-solids and suspended-sediment loads.
31
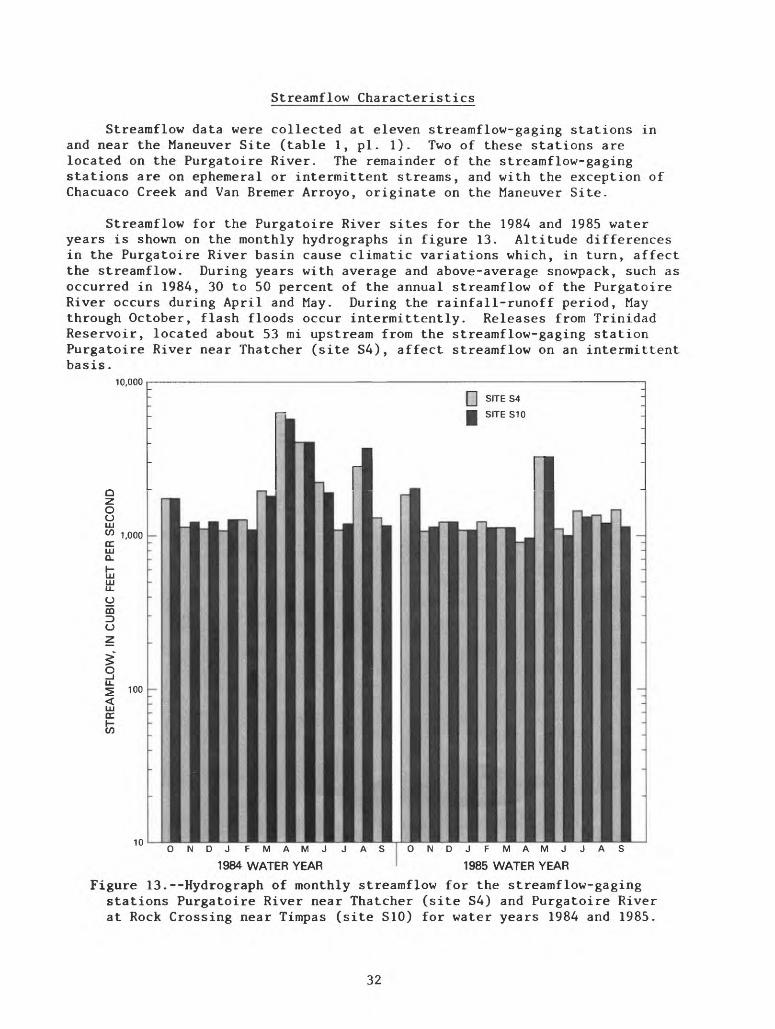
Streamflow Characteristics
Strearaflow data were collected at eleven streamflow-gaging stations in and near the Maneuver Site (table 1, pi. 1). Two of these stations are located on the Purgatoire River. The remainder of the streamflow-gaging stations are on ephemeral or intermittent streams, and with the exception of Chacuaco Creek and Van Bremer Arroyo, originate on the Maneuver Site.
Strearaflow for the Purgatoire River sites for the 1984 and 1985 water years is shown on the monthly hydrographs in figure 13. Altitude differences in the Purgatoire River basin cause climatic variations which, in turn, affect the streamflow. During years with average and above-average snowpack, such as occurred in 1984, 30 to 50 percent of the annual streamflow of the Purgatoire River occurs during April and May. During the rainfall-runoff period, May through October, flash floods occur intermittently. Releases from Trinidad Reservoir, located about 53 mi upstream from the streamflow-gaging station Purgatoire River near Thatcher (site S4), affect streamflow on an intermittent basis.
10,000
o oLLJ
w 1,000ccLU O_
o mD O
O
<LUcc to
100
10
[] SITE S4
SITE S10
D J F M A M J
1984 WATER YEAR
J A S J F M A M J
1985 WATER YEAR
A S
Figure 13.--Hydrograph of monthly streamflow for the streamflow-gaging stations Purgatoire River near Thatcher (site S4) and Purgatoire River at Rock Crossing near Timpas (site S10) for water years 1984 and 1985.
32

Hydrographs of monthly streamflow for the 1984 and 1985 water years at streamflow-gaging stations with ephemeral and intermittent streamflow are presented in figures 30-37 in the "Supplemental Information" section at the back of the report. Streamflow at ephemeral stations usually results from rainfall during May through October and is characterized by a quick rise to peak discharge and a rapid decline. Spatial and temporal distribution of runoff-producing storms is quite variable. Duration and magnitude of rainfall runoff is a function of antecedent moisture conditions and the location and duration of the storm in a drainage basin.
Streamflow at three streamflow-gaging stations, Van Bremer Arroyo near Tyrone (site S2A), Van Bremer Arroyo near Model (site S3), and Lockwood Canyon Creek near Thatcher (site S6) is characterized as intermittent. Rainfall runoff affects streamflow at these sites in the same manner as at ephemeral stream sites. However, the intermittent stream sites differ from ephemeral stream sites because streamflow occurs at times other than during storm runoff. Base streamflow, usually less than 0.50 ft 3 /s, is maintained intermittently at these sites by ground-water recharge (sites S3 and S6) and by ground-water recharge and irrigation-return flow (site S2A and S3). A reservoir located immediately west of the Maneuver Site on Van Bremer Arroyo intercepts all streamflow that originates upstream from site S2 (pi. 1). Van Bremer Arroyo near Tyrone (site S2A) was established during the spring of 1985 downstream from Brown Sheep Camp in order to monitor irrigation-return flow entering the Maneuver Site from adjacent farmland.
Contributions of Tributary Streamflow to the Purgatoire River
During the 1984 and 1985 water years (table 10), Purgatoire River tribu taries that drain the Maneuver Site (sites S3, S5, S6, S7, and S9) had stream- flow of about 3,760 acre-ft, or about 4.4 percent of the streamflow at the Purgatoire River at Rock Crossing, near Timpas (site S10). About 64 percent of the tributary streamflow was discharged from Van Bremer Arroyo near Model (site S3) (table 10). The streamflow-duration curve (fig. 14) for Van Bremer Arroyo near Model (site S3) shows that mean daily streamflow is less than 0.70 ft 3 /s approximately 90 percent of the time. However, during periods when irrigation-return flow is discharged into Van Bremer Arroyo from irrigated lands southwest of the Maneuver Site, mean daily streamflow ranges from 1 to 40 ft 3 /s. During the 1984 and 1985 water years, approximately 2,100 acre-ft, or about 88 percent of the annual streamflow at Van Bremer Arroyo near Model (site S3) resulted from irrigation return flow. This return flow represents 56 percent of the streamflow that entered the Purgatoire River in or near the Maneuver Site. The remainder of the tributary streamflow results from rainfall runoff and from base streamflow sustained by ground-water recharge.
The main tributary inflow to the Purgatoire River between sites S4 and S10 that does not originate on the Maneuver Site is Chacuaco Creek at mouth, near Timpas (site S8). Chacuaco Creek has a drainage area of 424 mi 2 , an area similar in size to the Maneuver Site. During the 1984 and 1985 water years, streamflow from Chacuaco Creek was 1,140 acre-ft, or about 1.3 percent of the streamflow at site S10 (table 10). All streamflow from Chacuaco Creek resulted from rainfall runoff.
33
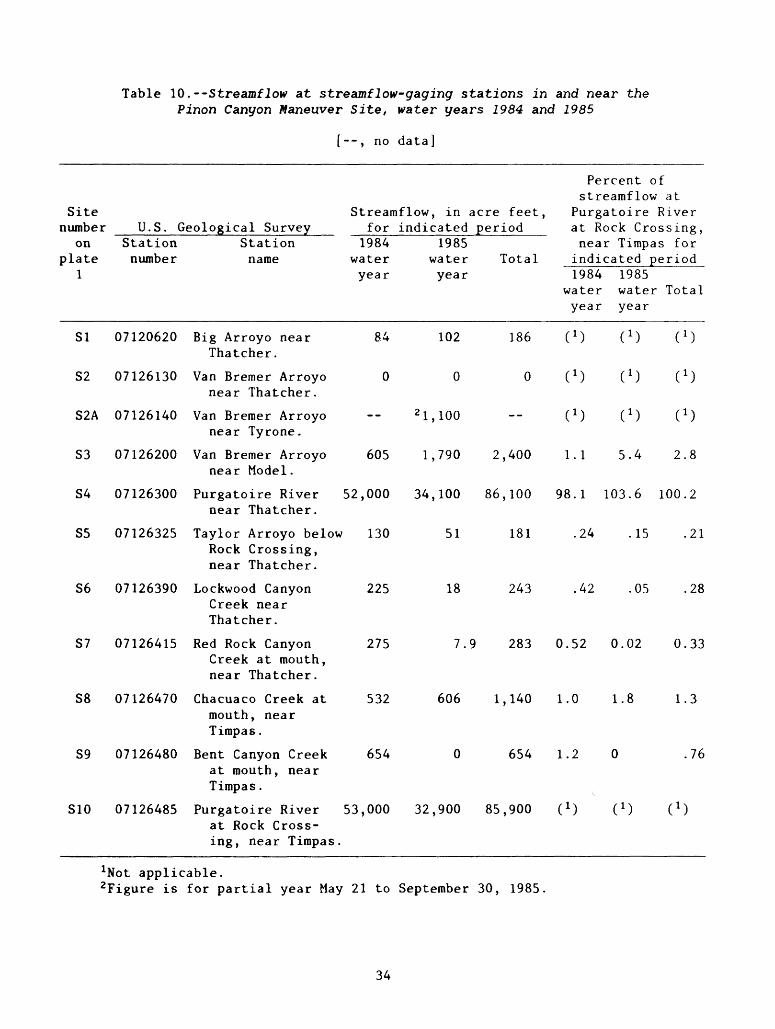
Table 10.--Streamflow at streamflow-gaging stations in and near the Pinon Canyon Maneuver Site, water years 1984 and 1985
[--, no data]
Percent of streamflow at
Site number
on plate
1
SI
S2
S2A
S3
S4
S5
U.S. Geological SurveyStation number
07120620
07126130
07126140
07126200
07126300
07126325
Station name
Big Arroyo near Thatcher.
Van Bremer Arroyo near Thatcher.
Van Bremer Arroyo near Tyrone.
Van Bremer Arroyo near Model.
Purgatoire River near Thatcher.
Taylor Arroyo below
Streamflow, in acre feet, for indicated period
1984 water year
84
0
--
605
52,000
130
1985 water Total year
102 186
0 0
2 1,100
1,790 2,400
34,100 86,100
51 181
Purgatoire River at Rock Crossing, near Timpas for indicated period1984
wateryear
C 1 )
C 1 )
C 1 )
1.1
98.1
.24
1985 water Totalyear
C 1 ) C 1 )
C 1 ) C 1 )
C 1 ) C 1 )
5.4 2.8
103.6 100.2
.15 .21
18 243 .42
Rock Crossing, near Thatcher.
Lockwood Canyon 225 Creek near Thatcher.
Red Rock Canyon 275 Creek at mouth, near Thatcher.
Chacuaco Creek at 532 mouth, near Timpas.
Bent Canyon Creek 654 at mouth, near Timpas.
Purgatoire River 53,000 32,900 85,900 C 1 ) C 1 ) at Rock Cross ing, near Timpas.
JNot applicable.2Figure is for partial year May 21 to September 30, 1985.
S6 07126390
S7 07126415
S8 07126470
S9 07126480
S10 07126485
.05
7.9 283 0.52 0.02
606 1,140 1.0 1.8
654 1.2
.28
0.33
1.3
.76
34
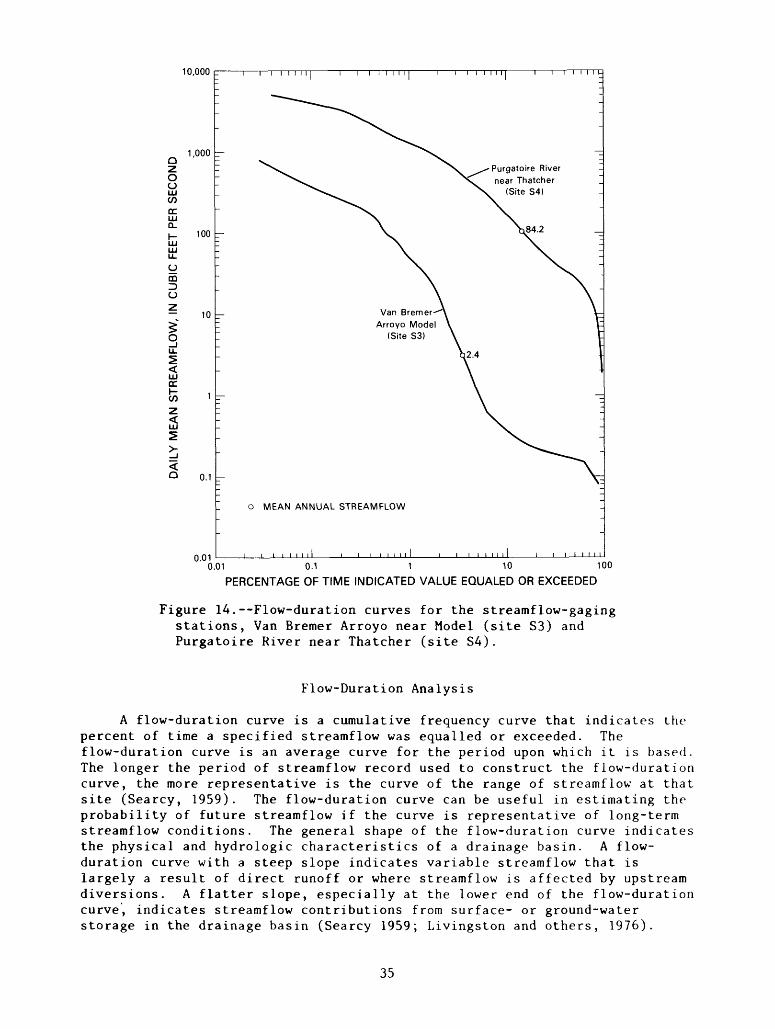
10,000 p
1,000
o oUJ(/) cc.UJ Q_
<Q
100UJ UJu. OmZ>o
- 10
o
UJ CC.
0.1
0.01
T I I I II I ~\ I I I I I 11 ~\ i i i i i u
Purgatoire River near Thatcher
(Site S4)
Van BremerArroyo Model
(Site S3)
o MEAN ANNUAL STREAMFLOW
i i i i i i i 11 i i i i i i i0.01 0.1 1 10 100
PERCENTAGE OF TIME INDICATED VALUE EQUALED OR EXCEEDED
Figure 14.--Flow-duration curves for the streamflow-gaging stations, Van Bremer Arroyo near Model (site S3) and Purgatoire River near Thatcher (site S4).
Flow-Duration Analysis
A flow-duration curve is a cumulative frequency curve that indicates the percent of time a specified streamflow was equalled or exceeded. The flow-duration curve is an average curve for the period upon which it is based. The longer the period of streamflow record used to construct the flow-duration curve, the more representative is the curve of the range of streamflow at that site (Searcy, 1959). The flow-duration curve can be useful in estimating the probability of future streamflow if the curve is representative of long-term streamflow conditions. The general shape of the flow-duration curve indicates the physical and hydrologic characteristics of a drainage basin. A flow- duration curve with a steep slope indicates variable streamflow that is largely a result of direct runoff or where streamflow is affected by upstream diversions. A flatter slope, especially at the lower end of the flow-duration curve, indicates streamflow contributions from surface- or ground-water storage in the drainage basin (Searcy 1959; Livingston and others, 1976).
35
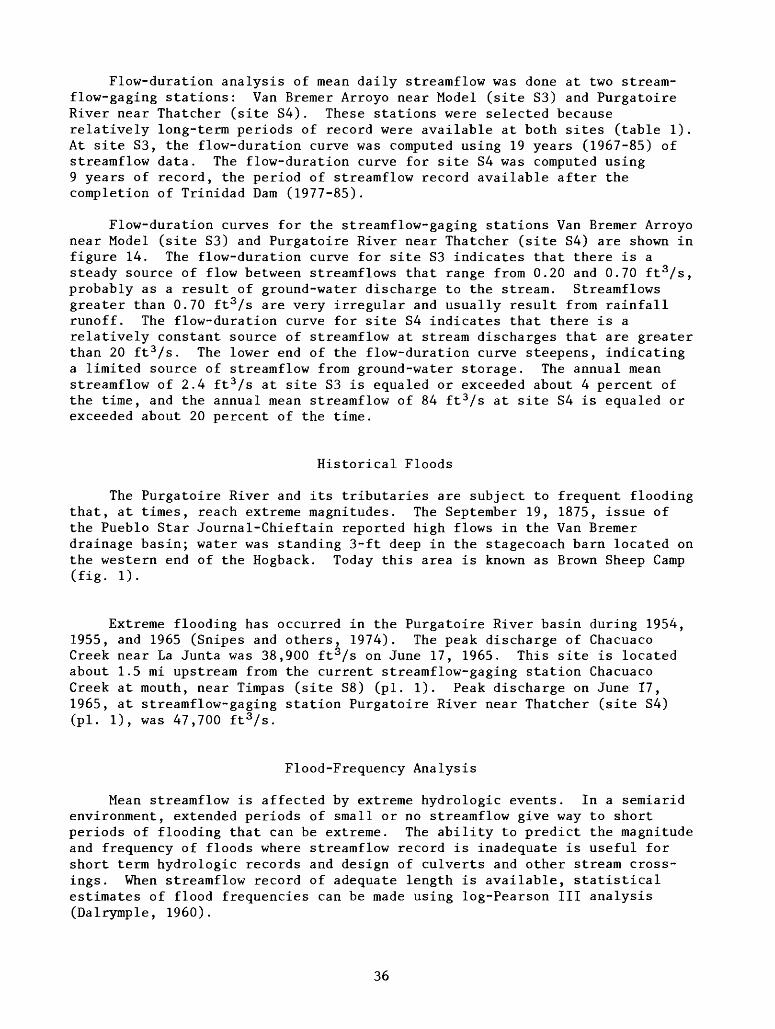
Flow-duration analysis of mean daily streamflow was done at two stream- flow-gaging stations: Van Bremer Arroyo near Model (site S3) and Purgatoire River near Thatcher (site S4). These stations were selected because relatively long-term periods of record were available at both sites (table 1). At site S3, the flow-duration curve was computed using 19 years (1967-85) of streamflow data. The flow-duration curve for site S4 was computed using 9 years of record, the period of streamflow record available after the completion of Trinidad Dam (1977-85).
Flow-duration curves for the streamflow-gaging stations Van Bremer Arroyo near Model (site S3) and Purgatoire River near Thatcher (site S4) are shown in figure 14. The flow-duration curve for site S3 indicates that there is a steady source of flow between streamflows that range from 0.20 and 0.70 ft3/s, probably as a result of ground-water discharge to the stream. Streamflows greater than 0.70 fts/s are very irregular and usually result from rainfall runoff. The flow-duration curve for site S4 indicates that there is a relatively constant source of streamflow at stream discharges that are greater than 20 ft 3 /s. The lower end of the flow-duration curve steepens, indicating a limited source of streamflow from ground-water storage. The annual mean streamflow of 2.4 ft 3 /s at site S3 is equaled or exceeded about 4 percent of the time, and the annual mean streamflow of 84 ft 3 /s at site S4 is equaled or exceeded about 20 percent of the time.
Historical Floods
The Purgatoire River and its tributaries are subject to frequent flooding that, at times, reach extreme magnitudes. The September 19, 1875, issue of the Pueblo Star Journal-Chieftain reported high flows in the Van Bremer drainage basin; water was standing 3-ft deep in the stagecoach barn located on the western end of the Hogback. Today this area is known as Brown Sheep Camp (fig. 1).
Extreme flooding has occurred in the Purgatoire River basin during 1954, 1955, and 1965 (Snipes and others, 1974). The peak discharge of Chacuaco Creek near La Junta was 38,900 fts/s on June 17, 1965. This site is located about 1.5 mi upstream from the current streamflow-gaging station Chacuaco Creek at mouth, near Timpas (site S8) (pi. 1). Peak discharge on June 17, 1965, at streamflow-gaging station Purgatoire River near Thatcher (site S4) (pi. 1), was 47,700 ft3/s.
Flood-Frequency Analysis
Mean streamflow is affected by extreme hydrologic events. In a semiarid environment, extended periods of small or no streamflow give way to short periods of flooding that can be extreme. The ability to predict the magnitude and frequency of floods where streamflow record is inadequate is useful for short term hydrologic records and design of culverts and other stream cross ings. When streamflow record of adequate length is available, statistical estimates of flood frequencies can be made using log-Pearson III analysis (Dalrymple, 1960).
36
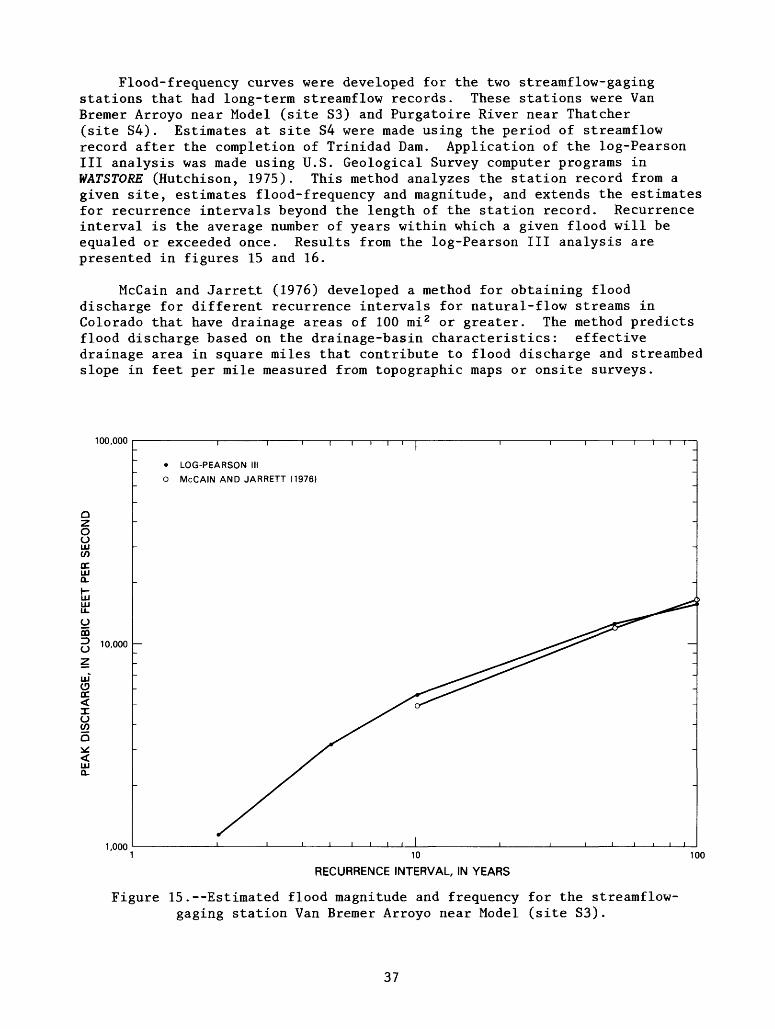
Flood-frequency curves were developed for the two streamflow-gaging stations that had long-term streamflow records. These stations were Van Bremer Arroyo near Model (site S3) and Purgatoire River near Thatcher (site S4). Estimates at site S4 were made using the period of streamflow record after the completion of Trinidad Dam. Application of the log-Pearson III analysis was made using U.S. Geological Survey computer programs in WATSTORE (Hutchison, 1975). This method analyzes the station record from a given site, estimates flood-frequency and magnitude, and extends the estimates for recurrence intervals beyond the length of the station record. Recurrence interval is the average number of years within which a given flood will be equaled or exceeded once. Results from the log-Pearson III analysis are presented in figures 15 and 16.
McCain and Jarrett (1976) developed a method for obtaining flood discharge for different recurrence intervals for natural-flow streams in Colorado that have drainage areas of 100 mi 2 or greater. The method predicts flood discharge based on the drainage-basin characteristics: effective drainage area in square miles that contribute to flood discharge and streambed slope in feet per mile measured from topographic maps or onsite surveys.
100,000
Qzo oLU(/) cc.LU Q_
LU U.
O
00
10,000
Xo
1,000
LOG-PEARSON III
McCAIN AND JARRETT (1976)
1 10
RECURRENCE INTERVAL, IN YEARS
100
Figure 15.--Estimated flood magnitude and frequency for the streamflow- gaging station Van Bremer Arroyo near Model (site S3).
37
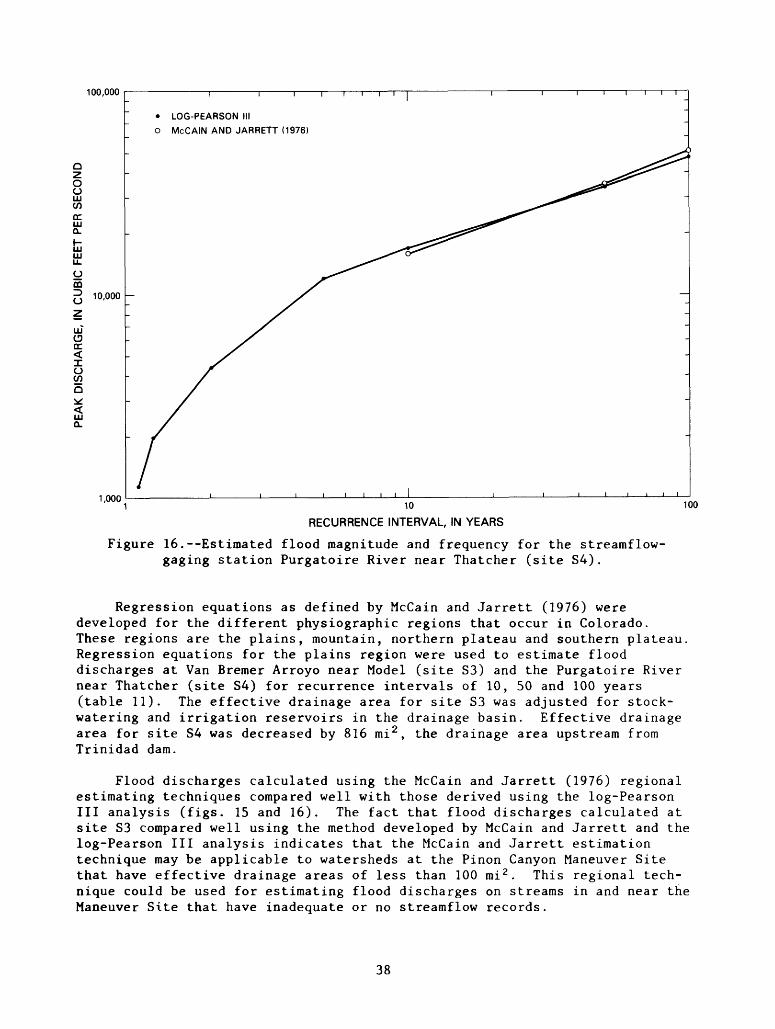
100,000
LOG-PEARSON III
o McCAIN AND JARRETT (1976)
1,000
RECURRENCE INTERVAL, IN YEARS
Figure 16.--Estimated flood magnitude and frequency for the streamflow- gaging station Purgatoire River near Thatcher (site S4).
Regression equations as defined by McCain and Jarrett (1976) were developed for the different physiographic regions that occur in Colorado. These regions are the plains, mountain, northern plateau and southern plateau. Regression equations for the plains region were used to estimate flood discharges at Van Bremer Arroyo near Model (site S3) and the Purgatoire River near Thatcher (site S4) for recurrence intervals of 10, 50 and 100 years (table 11). The effective drainage area for site S3 was adjusted for stock- watering and irrigation reservoirs in the drainage basin. Effective drainage area for site S4 was decreased by 816 mi 2 , the drainage area upstream from Trinidad dam.
Flood discharges calculated using the McCain and Jarrett (1976) regional estimating techniques compared well with those derived using the log-Pearson III analysis (figs. 15 and 16). The fact that flood discharges calculated at site S3 compared well using the method developed by McCain and Jarrett and the log-Pearson III analysis indicates that the McCain and Jarrett estimation technique may be applicable to watersheds at the Pinon Canyon Maneuver Site that have effective drainage areas of less than 100 mi 2 . This regional tech nique could be used for estimating flood discharges on streams in and near the Maneuver Site that have inadequate or no streamflow records.
38
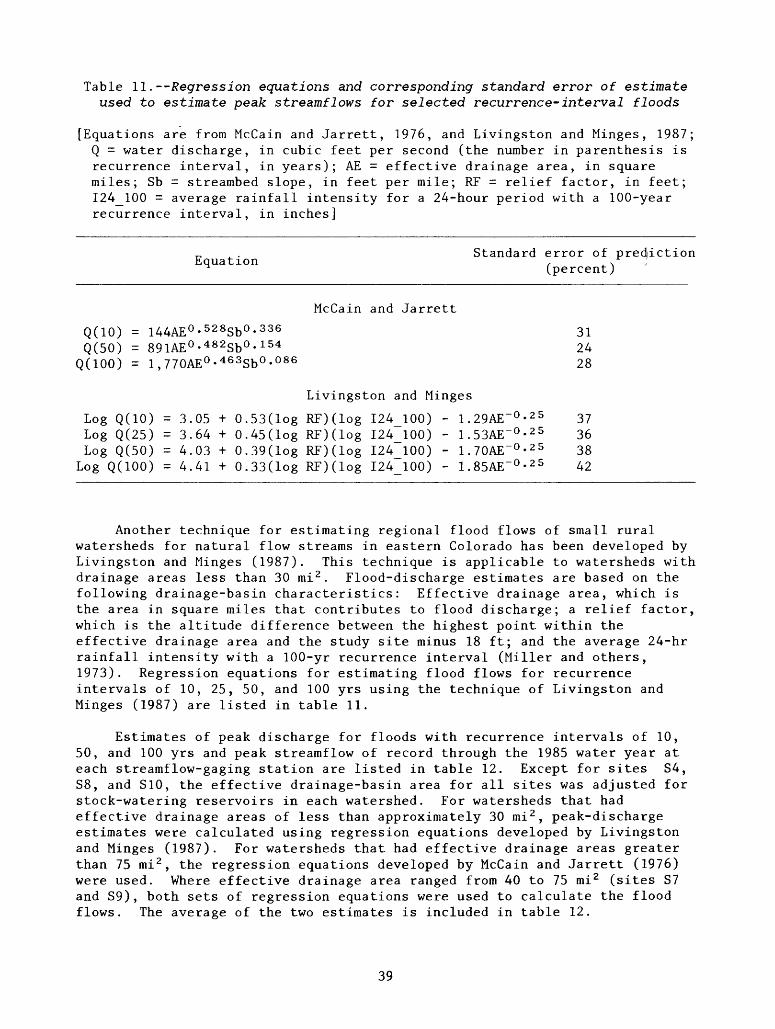
Table II.--Regression equations and corresponding standard error of estimate used to estimate peak streamflows for selected recurrence-interval floods
[Equations are from McCain and Jarrett, 1976, and Livingston and Minges, 1987; Q = water discharge, in cubic feet per second (the number in parenthesis is recurrence interval, in years); AE = effective drainage area, in square miles; Sb = streambed slope, in feet per mile; RF = relief factor, in feet; I24_100 = average rainfall intensity for a 24-hour period with a 100-year recurrence interval, in inches]
. Standard error of pred/ictionEquation , ^^ (percent)
McCain and JarrettQ(10) = 144AE°- 528Sb°- 336 31Q(50) = 891AE°- 482 Sb°- 154 24
Q(100) = l,770AE°- 463Sb 0 ' 086 28
Livingston and Minges
Log Q(10)Log Q(25)Log Q(50)
Log Q(100)
= 3.05 H= 3.64 H= 4.03 H= 4.41 H
H 0.53(log RF)(log 124 100)H 0.45(log RF)(log 124 100)H 0.39(log RF)(log 124 100)H 0.33(log RF)(log 124 100)
- 1.29AE- 0 - 25- 1.53AE- 0 - 25- 1.70AE- 0 - 25- 1.85AE- 0 - 25
37363842
Another technique for estimating regional flood flows of small rural watersheds for natural flow streams in eastern Colorado has been developed by Livingston and Minges (1987). This technique is applicable to watersheds with drainage areas less than 30 mi 2 . Flood-discharge estimates are based on the following drainage-basin characteristics: Effective drainage area, which is the area in square miles that contributes to flood discharge; a relief factor, which is the altitude difference between the highest point within the effective drainage area and the study site minus 18 ft; and the average 24-hr rainfall intensity with a 100-yr recurrence interval (Miller and others, 1973). Regression equations for estimating flood flows for recurrence intervals of 10, 25, 50, and 100 yrs using the technique of Livingston and Minges (1987) are listed in table 11.
Estimates of peak discharge for floods with recurrence intervals of 10, 50, and 100 yrs and peak streamflow of record through the 1985 water year at each streamflow-gaging station are listed in table 12. Except for sites S4, S8, and S10, the effective drainage-basin area for all sites was adjusted for stock-watering reservoirs in each watershed. For watersheds that had effective drainage areas of less than approximately 30 mi 2 , peak-discharge estimates were calculated using regression equations developed by Livingston and Minges (1987). For watersheds that had effective drainage areas greater than 75 mi 2 , the regression equations developed by McCain and Jarrett (1976) were used. Where effective drainage area ranged from 40 to 75 mi 2 (sites S7 and S9), both sets of regression equations were used to calculate the flood flows. The average of the two estimates is included in table 12.
39

Table 12. Selected d
rainage
basin
char
acte
rist
ics,
es
tima
tes
of flood ma
gnit
ude
for se
lect
ed r
ecur
renc
e in
terv
als
and
reco
rded
peak
disc
harg
es of p
eriods of re
cord
for
stre
amfl
ow-g
agin
g stations in
an
d near the
Pino
n Ca
nyon
Maneuver
Site
[Pea
k discharges in cu
bic
feet
pe
r second]
Site
num
ber on
plate
1 SI S3 S4 S5 S6 S7 S8 S9 S10
Drainage-basin ch
arac
teri
stic
U.S. Geological Survey
Station
number
07120620
0712
6200
0712
6300
07126325
0712
6390
07126415
0712
6470
0712
6480
07126485
Stat
ion
name
Big
Arro
yo near
That
cher
.Va
n Bremer Arroyo
near
Mo
del.
Purgatoire River
near
Th
atch
er.
Taylor Arroyo be
low
Rock
Cr
ossi
ng,
near Th
atch
er.
Lock
wood
Canyon
Creek
near
That
cher
.Red
Rock
Canyon
Creek
at mo
uth,
near
Th
atch
er.
Chac
uaco
Creek
atmo
uth,
ne
arTi
mpas
.Be
nt Canyon Creek
at mo
uth,
ne
arTimpas .
Purgatoire River
at Ro
ck Cr
ossi
ng,
near Ti
mpas
.
Effective
drai
nage
area
(square
miles) 7.7
77.7
1,11
9 28.9
31.7
47.1
2424 51
.1
1,819
Esti-
Average
rain
fall
.
,
, mated
r> -i
*
4.
-4.
* i/
Streambed
, A
Reli
ef
inte
nsit
y for
24-
, 10-year
factor
hour period wi
th
fj:
.*
peak
(*
^\ IA
A (f
eet
per
*, .
(feet; 100-year recurrence
., ^
dis-
inte
rval
(i
nche
s)
562 NA NA 907
537
922 NA
1,01
3 NA
5.0
NA NA 5.0
5.0
5.0
NA 5.0
NA
NA 19.3
23.0
NA NA 32.5
10.5
35.1
19.0
charge
1,97
0
3,880
16,8
00
3,880
3,290
4,040
7,740
4,300
20,400
Esti
mated
50-year
peak
dis
charge
5,740
11,500
42,6
00
12,7
00
11,400
12,600
23,6
00
13,3
00
52,200
Esti
mate
d 10
0-ye
ar
peak
di
scharge
8,580
17,1
00
59,8
00
19,7
00
18,2
00
19,3
00
35,7
00
20,4
00
73,700
Peak
recorded
disc
harg
e for
period of
record
1,50
0
6,240
^2,400
761
744
274
31,8
40
2,640
3,290
1Pea
k flood
disc
harg
e outside
the
peri
od of
re
cord
is
47,700 cubic
feet per
second.
2Effective dr
aina
ge area no
t available; es
tima
tes
of flood
discharges are
based
on total
drai
nage
area.
3Pea
k flood
disc
harg
e outside
the
period of re
cord
is
38
,900
cubic
feet
pe
r second.
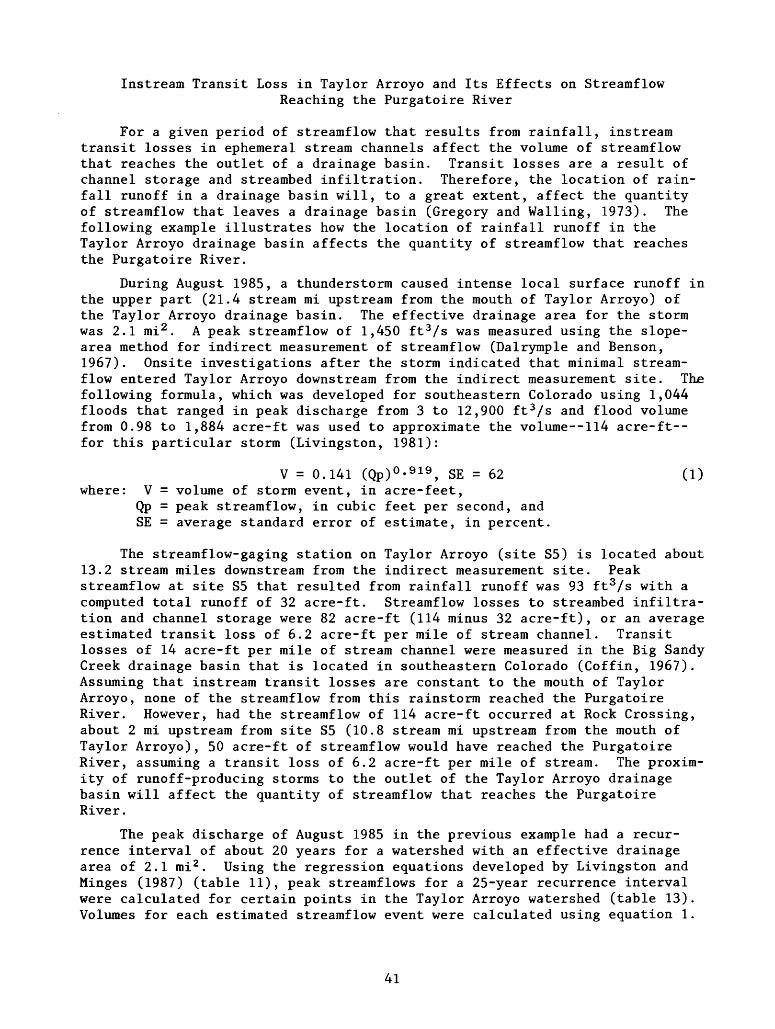
Instream Transit Loss in Taylor Arroyo and Its Effects on StreamflowReaching the Purgatoire River
For a given period of streamflow that results from rainfall, instream transit losses in ephemeral stream channels affect the volume of streamflow that reaches the outlet of a drainage basin. Transit losses are a result of channel storage and streambed infiltration. Therefore, the location of rain fall runoff in a drainage basin will, to a great extent, affect the quantity of streamflow that leaves a drainage basin (Gregory and Walling, 1973). The following example illustrates how the location of rainfall runoff in the Taylor Arroyo drainage basin affects the quantity of streamflow that reaches the Purgatoire River.
During August 1985, a thunderstorm caused intense local surface runoff in the upper part (21.4 stream mi upstream from the mouth of Taylor Arroyo) of the Taylor Arroyo drainage basin. The effective drainage area for the storm was 2.1 mi2 . A peak streamflow of 1,450 ft 3 /s was measured using the slope- area method for indirect measurement of streamflow (Dalrymple and Benson, 1967). Onsite investigations after the storm indicated that minimal stream- flow entered Taylor Arroyo downstream from the indirect measurement site. The following formula, which was developed for southeastern Colorado using 1,044 floods that ranged in peak discharge from 3 to 12,900 ft 3/s and flood volume from 0.98 to 1,884 acre-ft was used to approximate the volume--H4 acre-ft-- for this particular storm (Livingston, 1981):
V = 0.141 (Qp)°- 919 , SE = 62 (1) where: V = volume of storm event, in acre-feet,
QP = peak streamflow, in cubic feet per second, and SE = average standard error of estimate, in percent.
The streamflow-gaging station on Taylor Arroyo (site S5) is located about 13.2 stream miles downstream from the indirect measurement site. Peak streamflow at site S5 that resulted from rainfall runoff was 93 ft3/s with a computed total runoff of 32 acre-ft. Streamflow losses to streambed infiltra tion and channel storage were 82 acre-ft (114 minus 32 acre-ft), or an average estimated transit loss of 6.2 acre-ft per mile of stream channel. Transit losses of 14 acre-ft per mile of stream channel were measured in the Big Sandy Creek drainage basin that is located in southeastern Colorado (Coffin, 1967). Assuming that instream transit losses are constant to the mouth of Taylor Arroyo, none of the streamflow from this rainstorm reached the Purgatoire River. However, had the streamflow of 114 acre-ft occurred at Rock Crossing, about 2 mi upstream from site S5 (10.8 stream mi upstream from the mouth of Taylor Arroyo), 50 acre-ft of streamflow would have reached the Purgatoire River, assuming a transit loss of 6.2 acre-ft per mile of stream. The proxim ity of runoff-producing storms to the outlet of the Taylor Arroyo drainage basin will affect the quantity of streamflow that reaches the Purgatoire River.
The peak discharge of August 1985 in the previous example had a recur rence interval of about 20 years for a watershed with an effective drainage area of 2.1 mi 2 . Using the regression equations developed by Livingston and Minges (1987) (table 11), peak streamflows for a 25-year recurrence interval were calculated for certain points in the Taylor Arroyo watershed (table 13). Volumes for each estimated streamflow event were calculated using equation 1.
41
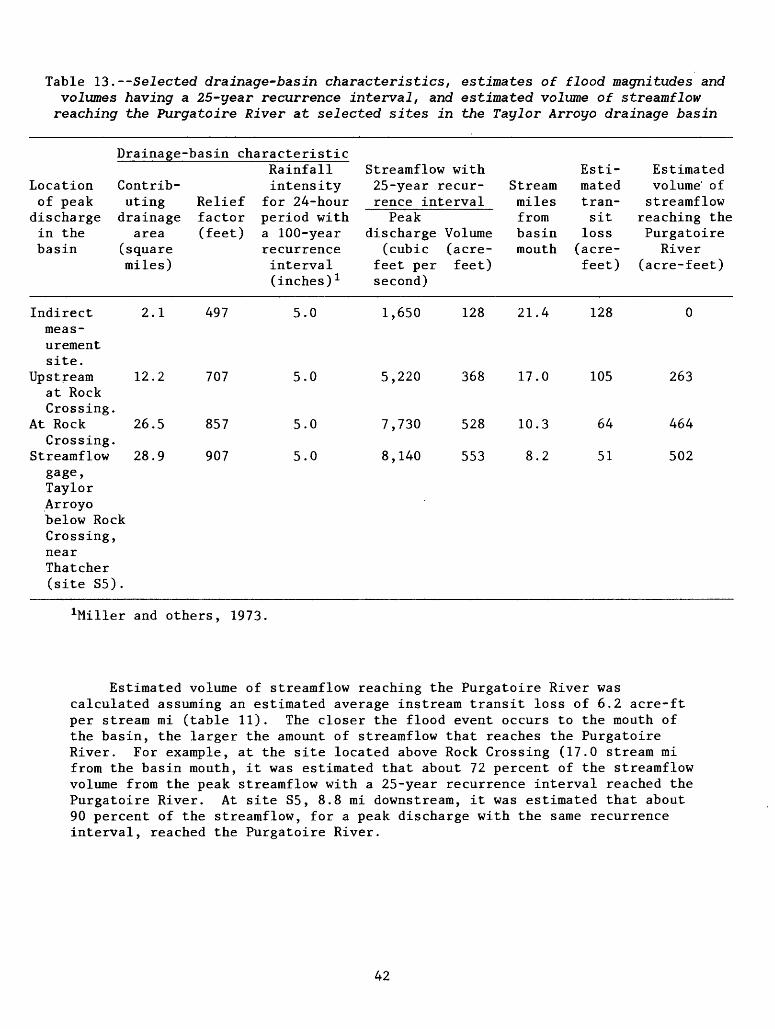
Table 13.--Selected drainage-basin characteristics, estimates of flood magnitudes andvolumes having a 25-year recurrence interval, and estimated volume of streamflow reaching the Purgatoire River at selected sites in the Taylor Arroyo drainage basin
Drainage-basin characteristic
Location Contrib- of peak uting
discharge drainage in the area basin (square
miles)
Indirect 2.1measurementsite.
Upstream 12.2 at RockCrossing.
At Rock 26.5 Crossing.
Streamflow 28.9gage, Taylor Arroyo below RockCrossing,nearThatcher(site S5).
Rainfallintensity
Relief for 24-hour factor period with (feet) a 100-year
recurrence interval (inches) 1
497 5.0
707 5.0
857 5.0
907 5.0
Streamflow with25-year recur- Stream rence interval milesPeak
discharge (cubic
feet per second)
1,650
5,220
7,730
8,140
from Volume basin (acre- mouth feet)
128 21.4
368 17.0
528 10.3
553 8.2
Estimated tran sit
loss (acre- feet)
128
105
64
51
Estimatedvolume' of streamflow
reaching the Purgatoire River
(acre-feet)
0
263
464
502
filler and others, 1973
Estimated volume of streamflow reaching the Purgatoire River was calculated assuming an estimated average instream transit loss of 6.2 acre-ft per stream mi (table 11). The closer the flood event occurs to the mouth of the basin, the larger the amount of streamflow that reaches the Purgatoire River. For example, at the site located above Rock Crossing (17.0 stream mi from the basin mouth, it was estimated that about 72 percent of the streamflow volume from the peak streamflow with a 25-year recurrence interval reached the Purgatoire River. At site S5, 8.8 mi downstream, it was estimated that about 90 percent of the streamflow, for a peak discharge with the same recurrence interval, reached the Purgatoire River.
42
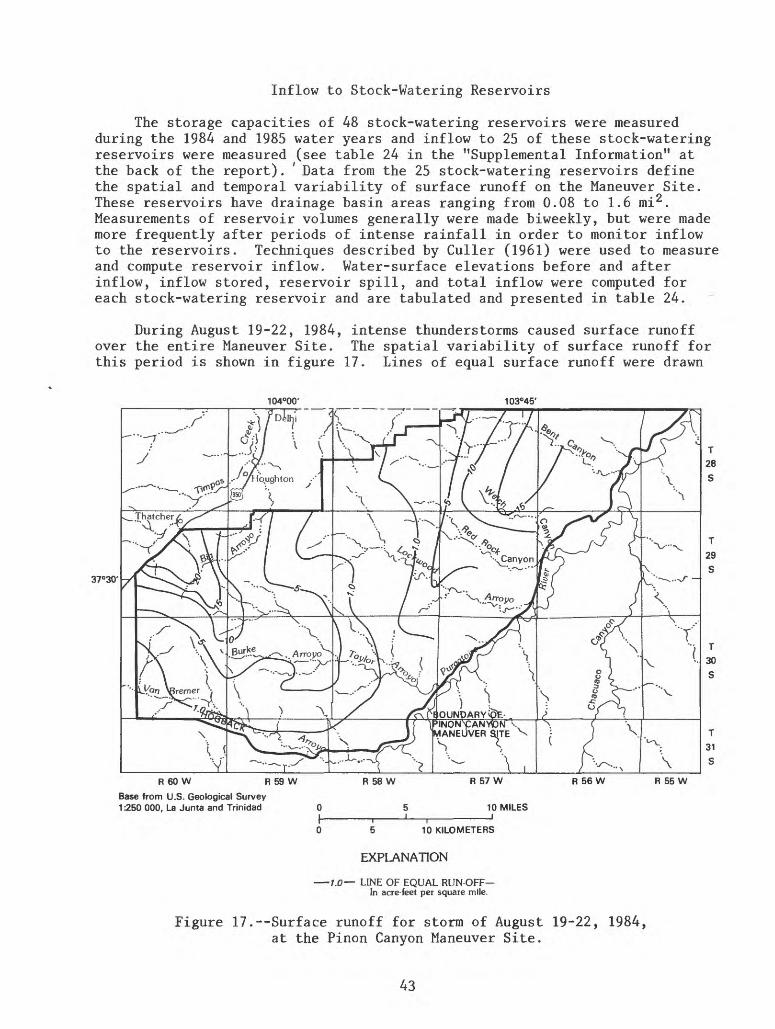
Inflow to Stock-Watering Reservoirs
The storage capacities of 48 stock-watering reservoirs were measured during the 1984 and 1985 water years and inflow to 25 of these stock-watering reservoirs were measured (see table 24 in the "Supplemental Information" at the back of the report). ' Data from the 25 stock-watering reservoirs define the spatial and temporal variability of surface runoff on the Maneuver Site. These reservoirs have drainage basin areas ranging from 0.08 to 1.6 mi2 . Measurements of reservoir volumes generally were made biweekly, but were made more frequently after periods of intense rainfall in order to monitor inflow to the reservoirs. Techniques described by Culler (1961) were used to measure and compute reservoir inflow. Water-surface elevations before and after inflow, inflow stored, reservoir spill, and total inflow were computed for each stock-watering reservoir and are tabulated and presented in table 24.
During August 19-22, 1984, intense thunderstorms caused surface runoff over the entire Maneuver Site. The spatial variability of surface runoff for this period is shown in figure 17. Lines of equal surface runoff were drawn
104°00' 103°45'
37°30'
P NONNCANY10N ;-. MANEUVER $ITE
R 55 W
Base from U.S. Geological Survey 1:250 000, La Junta and Trinidad
5 10 KILOMETERS
EXPLANATION
1.0 LINE OF EQUAL RUN-OFF In acre-feet per square mile.
Figure 17. Surface runoff for storm of August 19-22, 1984, at the Pinon Canyon Maneuver Site.
43
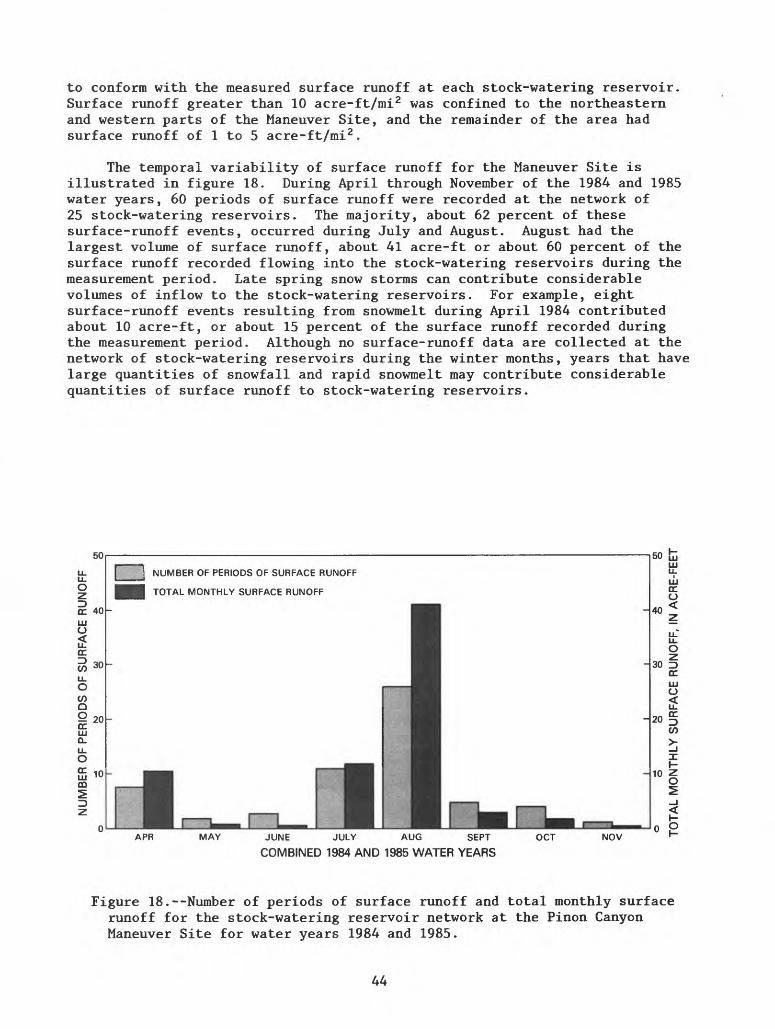
to conform with the measured surface runoff at each stock-watering reservoir. Surface runoff greater than 10 acre-ft/mi2 was confined to the northeastern and western parts of the Maneuver Site, and the remainder of the area had surface runoff of 1 to 5 acre-ft/mi 2 .
The temporal variability of surface runoff for the Maneuver Site is illustrated in figure 18. During April through November of the 1984 and 1985 water years, 60 periods of surface runoff were recorded at the network of 25 stock-watering reservoirs. The majority, about 62 percent of these surface-runoff events, occurred during July and August. August had the largest volume of surface runoff, about 41 acre-ft or about 60 percent of the surface runoff recorded flowing into the stock-watering reservoirs during the measurement period. Late spring snow storms can contribute considerable volumes of inflow to the stock-watering reservoirs. For example, eight surface-runoff events resulting from snowmelt during April 1984 contributed about 10 acre-ft, or about 15 percent of the surface runoff recorded during the measurement period. Although no surface-runoff data are collected at the network of stock-watering reservoirs during the winter months, years that have large quantities of snowfall and rapid snowmelt may contribute considerable quantities of surface runoff to stock-watering reservoirs.
50
| ) NUMBER OF PERIODS OF SURFACE RUNOFF
TOTAL MONTHLY SURFACE RUNOFF
APR MAY JUNE JULY AUG SEPT
COMBINED 1984 AND 1985 WATER YEARSOCT NOV
Figure 18.--Number of periods of surface runoff and total monthly surface runoff for the stock-watering reservoir network at the Pinon Canyon Maneuver Site for water years 1984 and 1985.
44
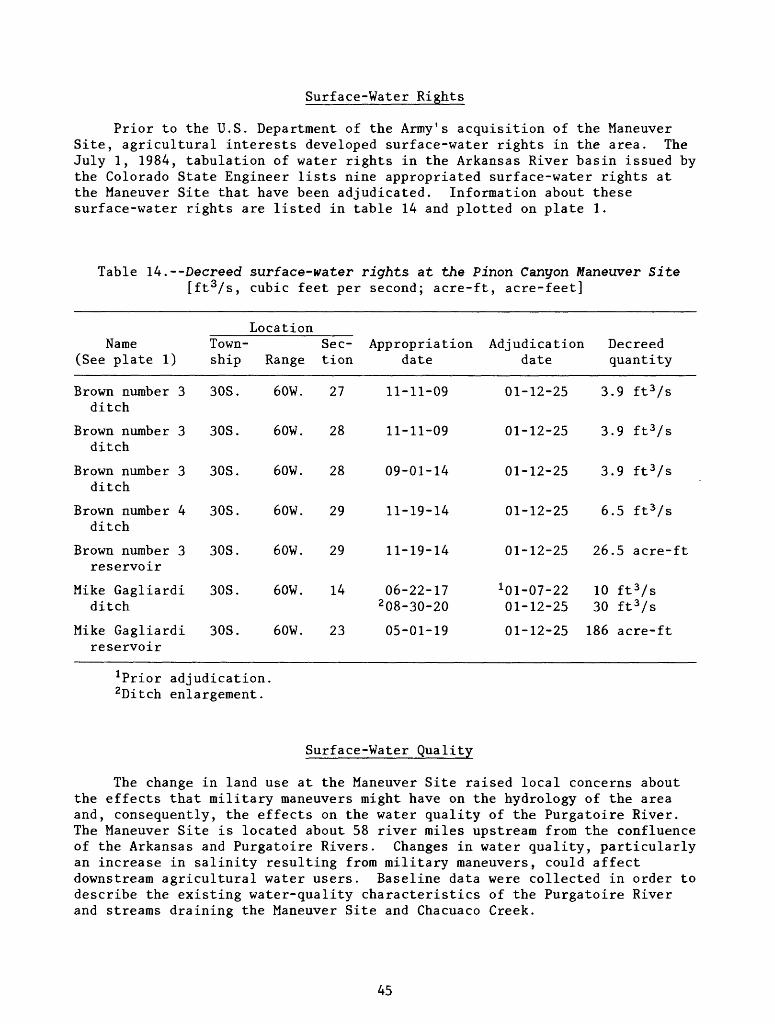
Surface-Water Rights
Prior to the U.S. Department of the Army's acquisition of the Maneuver Site, agricultural interests developed surface-water rights in the area. The July 1, 1984, tabulation of water rights in the Arkansas River basin issued by the Colorado State Engineer lists nine appropriated surface-water rights at the Maneuver Site that have been adjudicated. Information about these surface-water rights are listed in table 14 and plotted on plate 1.
Table 14.--Decreed surface-water rights at the Pinon Canyon Maneuver Site [ft 3/s, cubic feet per second; acre-ft, acre-feet]
LocationName Town- Sec- Appropriation Adjudication Decreed
(See plate 1) ship Range tion date date quantity
Brown number 3ditch
Brown number 3ditch
Brown number 3ditch
Brown number 4ditch
Brown number 3reservoir
Mike Gagliardi ditch
Mike Gagliardireservoir
30S.
30S.
30S.
30S.
30S.
30S.
30S.
60W.
60W.
60W.
60W.
60W.
60W.
60W.
27
28
28
29
29
14
23
11-11-09
11-11-09
09-01-14
11-19-14
11-19-14
06-22-17 2 08-30-20
05-01-19
01-12-25
01-12-25
01-12-25
01-12-25
01-12-25
1 01-07-22 01-12-25
01-12-25
3.9 ft 3/s
3.9 ft 3/s
3.9 ft 3 /s
6.5 ft 3/s
26.5 acre-ft
10 ft 3 /s 30 ft 3 /s
186 acre-ft
1Prior adjudication. 2Ditch enlargement.
Surface-Water Quality
The change in land use at the Maneuver Site raised local concerns about the effects that military maneuvers might have on the hydrology of the area and, consequently, the effects on the water quality of the Purgatoire River. The Maneuver Site is located about 58 river miles upstream from the confluence of the Arkansas and Purgatoire Rivers. Changes in water quality, particularly an increase in salinity resulting from military maneuvers, could affect downstream agricultural water users. Baseline data were collected in order to describe the existing water-quality characteristics of the Purgatoire River and streams draining the Maneuver Site and Chacuaco Creek.
45
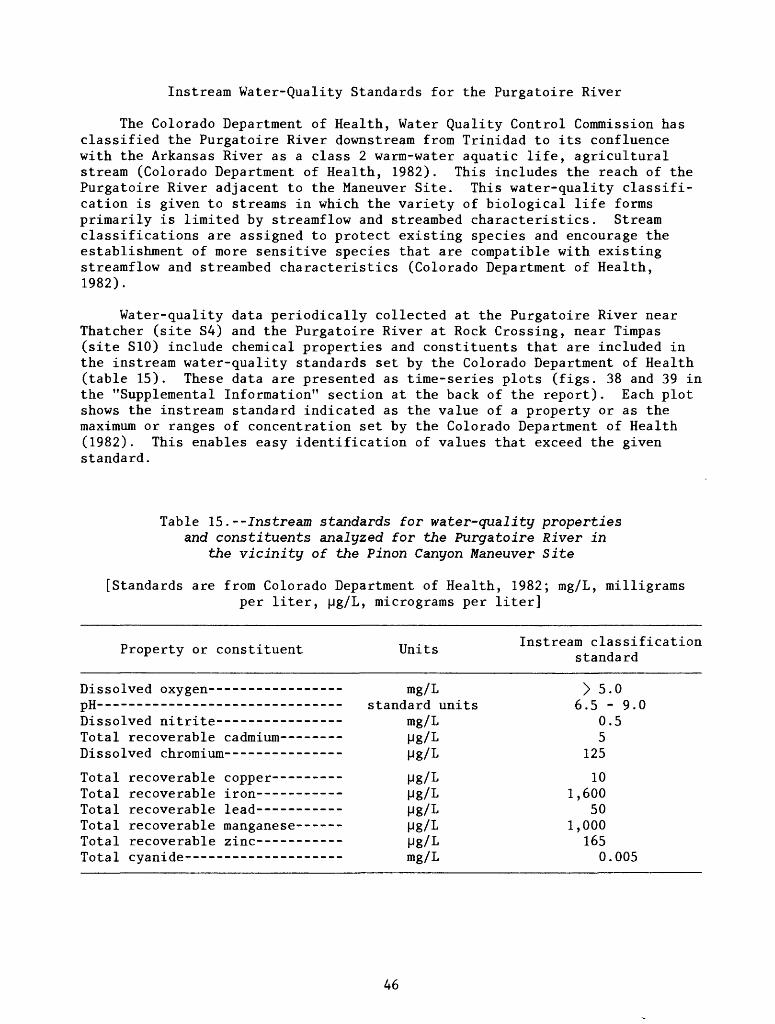
Instream Water-Quality Standards for the Purgatoire River
The Colorado Department of Health, Water Quality Control Commission has classified the Purgatoire River downstream from Trinidad to its confluence with the Arkansas River as a class 2 warm-water aquatic life, agricultural stream (Colorado Department of Health, 1982). This includes the reach of the Purgatoire River adjacent to the Maneuver Site. This water-quality classifi cation is given to streams in which the variety of biological life forms primarily is limited by streamflow and streambed characteristics. Stream classifications are assigned to protect existing species and encourage the establishment of more sensitive species that are compatible with existing streamflow and streambed characteristics (Colorado Department of Health, 1982).
Water-quality data periodically collected at the Purgatoire River near Thatcher (site S4) and the Purgatoire River at Rock Crossing, near Timpas (site S10) include chemical properties and constituents that are included in the instream water-quality standards set by the Colorado Department of Health (table 15). These data are presented as time-series plots (figs. 38 and 39 in the "Supplemental Information" section at the back of the report). Each plot shows the instream standard indicated as the value of a property or as the maximum or ranges of concentration set by the Colorado Department of Health (1982). This enables easy identification of values that exceed the given standard.
Table 15.--Instream standards for water-quality properties and constituents analyzed for the Purgatoire River in
the vicinity of the Pinon Canyon Maneuver Site
[Standards are from Colorado Department of Health, 1982; mg/L, milligrams per liter, Mg/L, micrograms per liter]
. *.-*.*. TT -x. Instream classificationProperty or constituent Units , ,r standard
Dissolved oxygen----------------pH Dissolved nitrite---------------Total recoverable cadmium - -Dissolved chromium--------- --
Total recoverable copper--------Total recoverable iron----------Total recoverable lead----------Total recoverable manganese-----Total recoverable zinc----------Total cyanide- ----------------
mg/Lstandard units
mg/LMg/LMg/L
MgAMg/LMg/LMg/LMg/Lmg/L
> 5.06.5 - 9.0
0.55
125
101,600
501,000
1650.005
46
All dissolved-oxygen concentrations and pH values were within the instream standards. There is an instream water-quality standard for dissolved nitrite. Plots of dissolved nitrite plus nitrate indicate that the instream standard for nitrite may have been exceeded four times at sites S4 and S10 (figs. 38 and 39). However, dissolved nitrogen in surface water usually is not present as nitrite; therefore, it is reasonable to assume that most of the dissolved nitrite plus nitrate in surface water is present as nitrate. Probable sources of nitrate in the Purgatoire River basin are related to farming and ranching activities.
Time-series plots of data for seven total recoverable metals and suspended-sediment concentration indicate that instream standards were exceeded during periods of streamflow that had large concentrations of suspended sediment (figs. 38 and 39); these periods usually are associated with snowmelt and rainfall runoff. A water-quality standard may be exceeded because of natural conditions such as flood flows or drought (Colorado Department of Health, 1982). Otherwise, during periods of baseflow, metal concentrations met or were less than the instream standards. There is no instream standard for suspended sediment for streams classified as class 2 warm-water aquatic life. No plot of cyanide is included; the instream standard for cyanide is 0.005 mg/L. All samples analyzed for cyanide were less than 0.01 mg/L, which is the detection limit of the analytical method used for cyanide analysis.
Summary Statistics of Water-Quality Data
Summary statistics of selected water-quality data are presented in table 25 in the "Supplemental Information" at the back of the report. These data summarize water-quality properties and constituents collected at the Purgatoire River near Thatcher (site S4), the Purgatoire River at Rock Crossing, near Timpas (site S10) and at five intermittent and ephemeral streamflow-gaging stations (sites SI, S3, S5, S6, S8) for October 1982 through September 1985.
Data summarized include onsite measurements, and concentrations of dis solved cations and anions, dissolved nutrients, dissolved and total recover able metals, radiochemical constituents, and suspended sediment. These data represent samples collected during base streamflow and during periods of snowmelt and rainfall runoff. Streamflows ranged from 14 to 1,090 ft 3 /s at site S4, 12 to 861 ft 3 /s at site S10, and 0.01 to 760 ft 3 /s at the intermit tent and ephemeral sites. The majority of the rainfall-runoff events sampled were at Big Arroyo near Thatcher (site SI), Taylor Arroyo below Rock Crossing, near Thatcher (site S5), and Chacuaco Creek at mouth, near Timpas (site S8). Samples collected at Lockwood Canyon Creek near Thatcher (site S6) represent intermittent base streamflows and samples at Van Bremer Arroyo near Model (site S3) represent base streamflow and irrigation-return flow.
As previously noted in the "Instream Water-Quality Standards for the Purgatoire River" section, large concentrations of total recoverable metals and suspended sediment are associated with periods of rainfall and snowmelt runoff. Conversely, concentrations of dissolved constituents are smaller during periods of runoff. For example, at the Purgatoire River near Thatcher (site S4), the median value for dissolved sulfate analyzed during periods of base flow was 1,500 mg/L and 670 mg/L during periods of runoff (table 16).
47
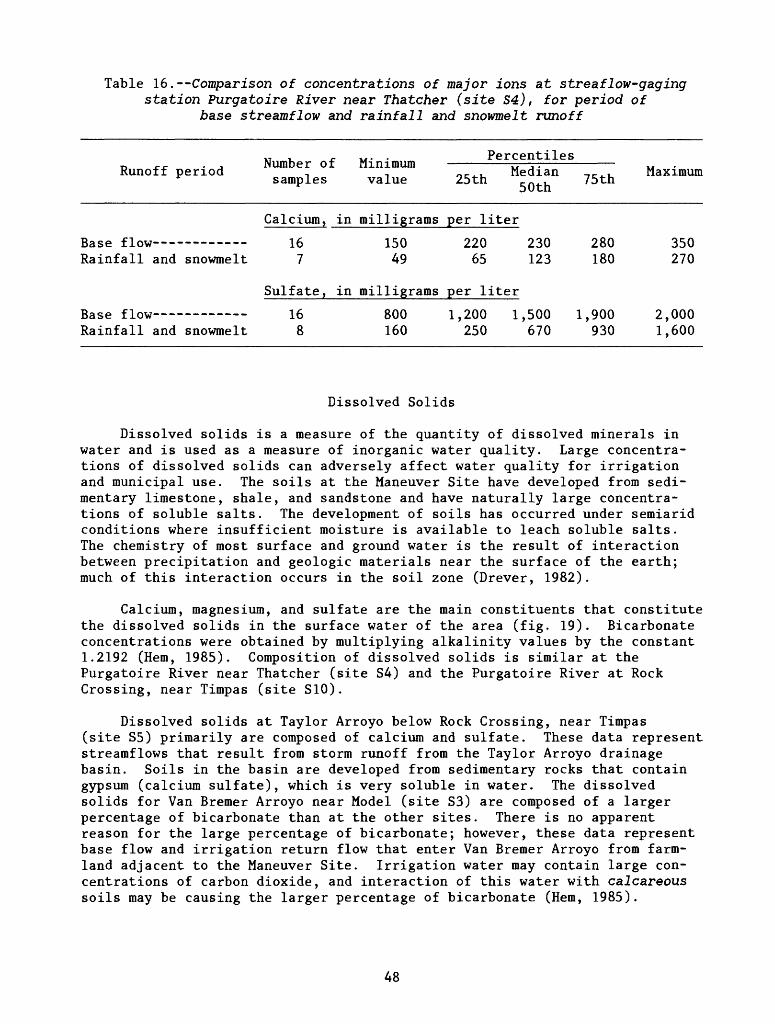
Table 16.--Comparison of concentrations of major ions at streaflow-gaging station Purgatoire River near Thatcher (site S4), for period of
base streamflow and rainfall and snowmelt runoff
Runoff period Number of Minimum samples value
Percentiles0(. , Median __ 25th 50th 75t
, Maximum
Calcium, in milligrams per liter
Base flow 16 150 220 230 280 350Rainfall and snowmelt 7 49 65 123 180 270
Sulfate, in milligrams per liter
Base flow 16 800 1,200 1,500 1,900 2,000Rainfall and snowmelt 8 160 250 670 930 1,600
Dissolved Solids
Dissolved solids is a measure of the quantity of dissolved minerals in water and is used as a measure of inorganic water quality. Large concentra tions of dissolved solids can adversely affect water quality for irrigation and municipal use. The soils at the Maneuver Site have developed from sedi mentary limestone, shale, and sandstone and have naturally large concentra tions of soluble salts. The development of soils has occurred under semiarid conditions where insufficient moisture is available to leach soluble salts. The chemistry of most surface and ground water is the result of interaction between precipitation and geologic materials near the surface of the earth; much of this interaction occurs in the soil zone (Drever, 1982).
Calcium, magnesium, and sulfate are the main constituents that constitute the dissolved solids in the surface water of the area (fig. 19). Bicarbonate concentrations were obtained by multiplying alkalinity values by the constant 1.2192 (Hem, 1985). Composition of dissolved solids is similar at the Purgatoire River near Thatcher (site S4) and the Purgatoire River at Rock Crossing, near Timpas (site S10).
Dissolved solids at Taylor Arroyo below Rock Crossing, near Timpas (site S5) primarily are composed of calcium and sulfate. These data represent streamflows that result from storm runoff from the Taylor Arroyo drainage basin. Soils in the basin are developed from sedimentary rocks that contain gypsum (calcium sulfate), which is very soluble in water. The dissolved solids for Van Bremer Arroyo near Model (site S3) are composed of a larger percentage of bicarbonate than at the other sites. There is no apparent reason for the large percentage of bicarbonate; however, these data represent base flow and irrigation return flow that enter Van Bremer Arroyo from farm land adjacent to the Maneuver Site. Irrigation water may contain large con centrations of carbon dioxide, and interaction of this water with calcareous soils may be causing the larger percentage of bicarbonate (Hem, 1985).
48
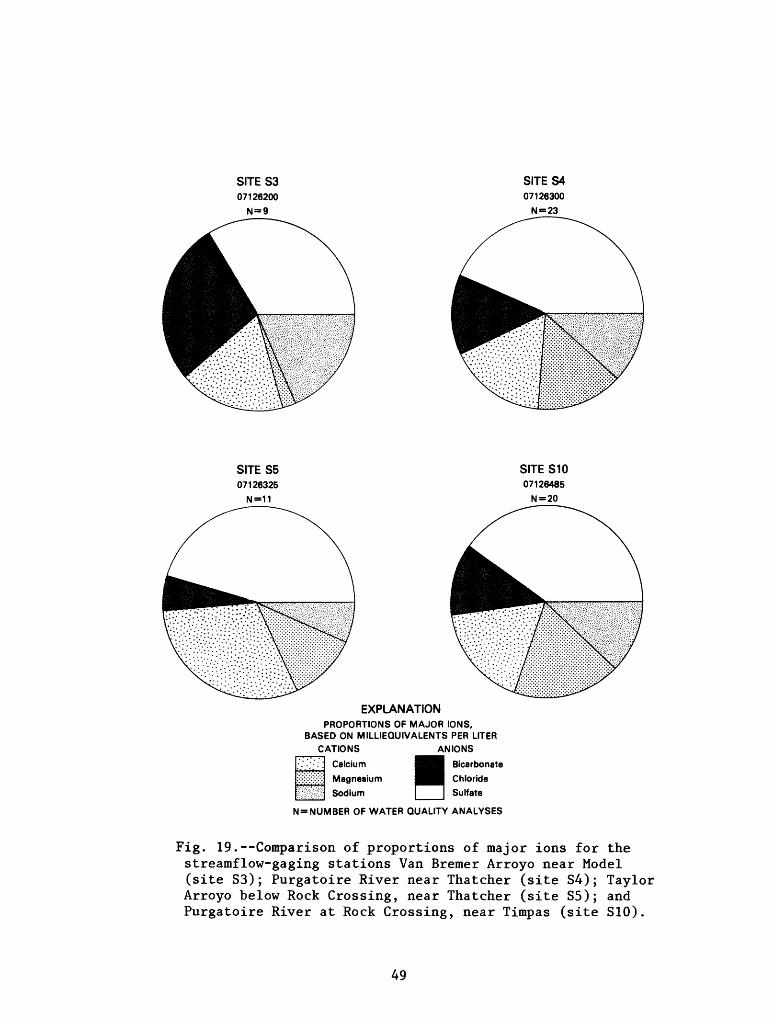
SITE S307126200
SITES407126300
N=23
SITE S507126325
N=11
SITE S1007126485
N=20
EXPLANATIONPROPORTIONS OF MAJOR IONS,
BASED ON MILLIEQUIVALENTS PER LITER CATIONS ANIONS
Calcium ^^H Bicarbonate
Magnesium ^^J| Chloride
Sodium | | Sulfate
NUMBER OF WATER QUALITY ANALYSES
Fig. 19. Comparison of proportions of major ions for the streamflow-gaging stations Van Bremer Arroyo near Model (site S3); Purgatoire River near Thatcher (site S4); Taylor Arroyo below Rock Crossing, near Thatcher (site S5); and Purgatoire River at Rock Crossing, near Timpas (site S10).
49
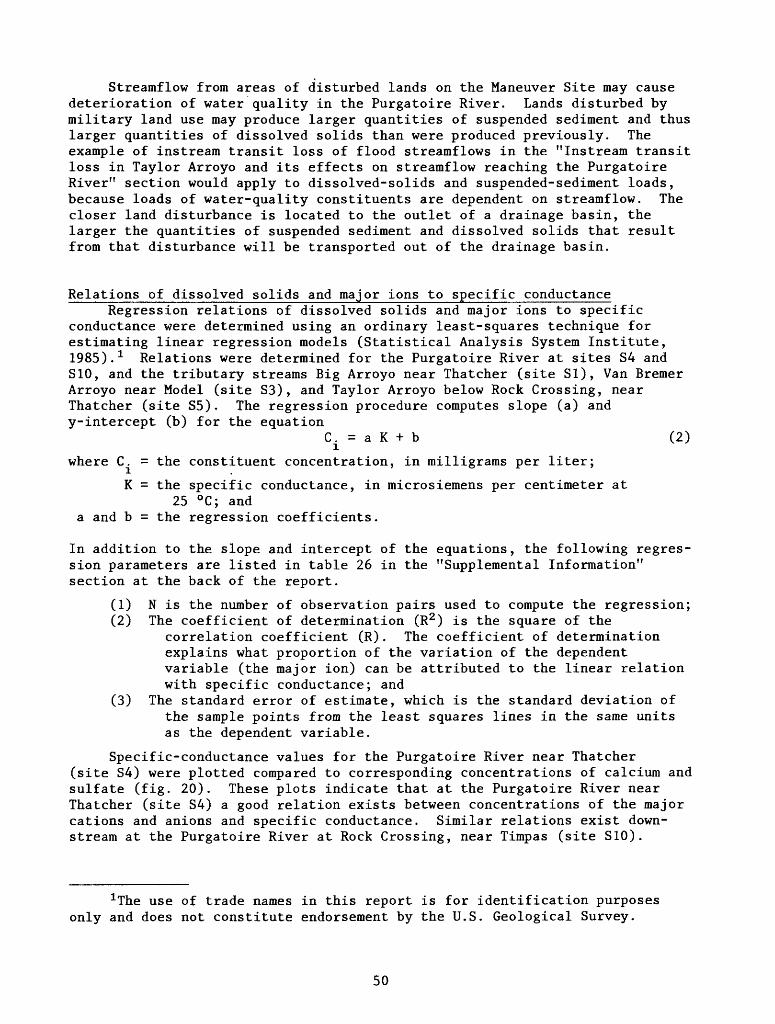
Streamflow from areas of disturbed lands on the Maneuver Site may cause deterioration of water quality in the Purgatoire River. Lands disturbed by military land use may produce larger quantities of suspended sediment and thus larger quantities of dissolved solids than were produced previously. The example of instream transit loss of flood streamflows in the "Instream transit loss in Taylor Arroyo and its effects on streamflow reaching the Purgatoire River" section would apply to dissolved-solids and suspended-sediment loads, because loads of water-quality constituents are dependent on streamflow. The closer land disturbance is located to the outlet of a drainage basin, the larger the quantities of suspended sediment and dissolved solids that result from that disturbance will be transported out of the drainage basin.
Relations of dissolved solids and major ions to specific conductanceRegression relations of dissolved solids and major ions to specific
conductance were determined using an ordinary least-squares technique for estimating linear regression models (Statistical Analysis System Institute, 1985).* Relations were determined for the Purgatoire River at sites S4 and S10, and the tributary streams Big Arroyo near Thatcher (site SI), Van Bremer Arroyo near Model (site S3), and Taylor Arroyo below Rock Crossing, near Thatcher (site S5). The regression procedure computes slope (a) and y-intercept (b) for the equation
C. = a K + b (2)
where C. = the constituent concentration, in milligrams per liter;
K = the specific conductance, in microsiemens per centimeter at25 °C; and
a and b = the regression coefficients.
In addition to the slope and intercept of the equations, the following regres sion parameters are listed in table 26 in the "Supplemental Information" section at the back of the report.
(1) N is the number of observation pairs used to compute the regression;(2) The coefficient of determination (R2 ) is the square of the
correlation coefficient (R). The coefficient of determination explains what proportion of the variation of the dependent variable (the major ion) can be attributed to the linear relation with specific conductance; and
(3) The standard error of estimate, which is the standard deviation of the sample points from the least squares lines in the same units as the dependent variable.
Specific-conductance values for the Purgatoire River near Thatcher (site S4) were plotted compared to corresponding concentrations of calcium and sulfate (fig. 20). These plots indicate that at the Purgatoire River near Thatcher (site S4) a good relation exists between concentrations of the major cations and anions and specific conductance. Similar relations exist down stream at the Purgatoire River at Rock Crossing, near Timpas (site S10).
xThe use of trade names in this report is for identification purposes only and does not constitute endorsement by the U.S. Geological Survey.
50
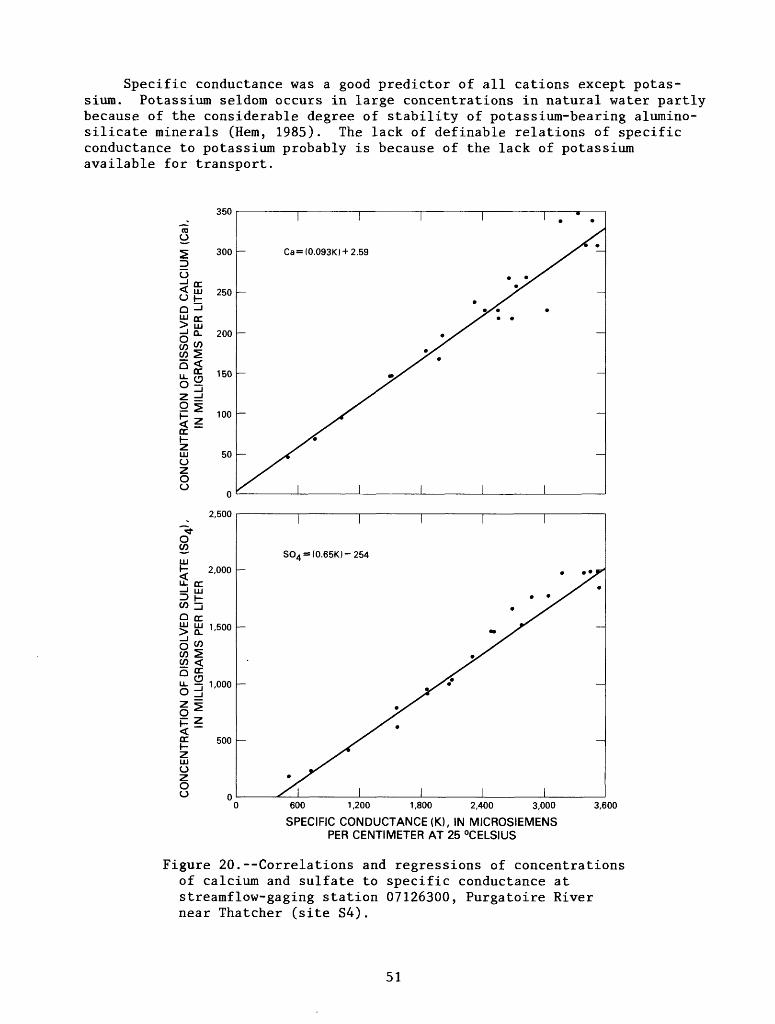
Specific conductance was a good predictor of all cations except potas sium. Potassium seldom occurs in large concentrations in natural water partly because of the considerable degree of stability of potassium-bearing alumino- silicate minerals (Hem, 1985). The lack of definable relations of specific conductance to potassium probably is because of the lack of potassium available for transport.
CDo
O
0 LU
to *>
z d
oc ~I-LUoz o o
O
LU
IsO LT
350
300
250
200
150
100
50
0
2,500
2,000
1,500
Ca=(0.093K) + 2.59
O wto ^to <Q OC
u- § 1,000O IJ
500
zLUO
o o
S04 = (0.65K)-254
600 1,200 1,800 2,400 3,000
SPECIFIC CONDUCTANCE (K), IN MICROSIEMENS PER CENTIMETER AT 25 °CELSIUS
3,600
Figure 20.--Correlations and regressions of concentrations of calcium and sulfate to specific conductance at streamflow-gaging station 07126300, Purgatoire River near Thatcher (site S4).
51
At sites S4 and S10, specific conductance correlated well with sulfate and chloride but correlated poorly with fluoride and bicarbonate. At the intermittent and ephemeral sites, SI, S3, and S5, specific conductance was a good predictor of sulfate at all sites and was a good predictor of fluoride only at site S5. Good relations between specific conductance and fluoride are unusual and unexplainable because minerals that contain fluoride generally have a low solubility that results in small quantities of fluoride in solu tion. Bicarbonate concentration is affected by chemical controls, which include the availability of carbonate minerals, such as calcite, for solution. When streamflow is small, specific-conductance values are larger, and bicarbonate reaches saturation with respect to calcite.
Daily mean specific conductance for the Purgatoire RiverContinuous records of specific-conductance measurements were collected at
the Purgatoire River near Thatcher (site S4) and the Purgatoire River at Rock Crossing, near Timpas (site S10) . These data are used to compute daily mean specific conductance for each site. Daily mean specific conductance ranged from 530 to 3,810 nS/cm at site S4 and 534 to 4,030 ^S/cm at site S10.
Hydrologic data usually do not have a normal probability distribution. They often are skewed and serially correlated. Therefore, when doing statistical analyses, it is necessary either to transform the data to follow a normal distribution or to use nonparametric statistical techniques that are less sensitive to the skewed distribution.
During the 1984 and 1985 water years, when daily mean specific- conductance data are available at both sites (S4 and S10), the mean value for daily specific conductance was computed. The average of the daily mean specific-conductance values at site S4 was 2,550 jjS/cm, and the average of the daily mean values at site S10 was 2,540 jjS/cm. The hypothesis that the average values of daily mean specific conductance at sites S4 and S10 were equal (Mi=M2) was tested using the nonparametric Wilcoxon rank sum test (SAS Institute, 1985). The average values of the daily mean specific conductance from both sites are equal at the 0.01 percent level of significance. This test indicated that for periods when specific-conductance data are available, streamflow and ground-water discharge that enter the Purgatoire River between sites S4 and S10 do not significantly affect dissolved-solids concentrations.
Dissolved-Solids and Suspended-Sediment Loads
Dissolved-solids and suspended-sediment loads can be characterized best in terms of magnitude, duration, and frequency. Dissolved-solids and suspended-sediment loads are the summation of the mean daily dissolved-solids and suspended-sediment discharges for one water year. Daily mean specific- conductance data were available for calculating dissolved-solids discharge, and daily suspended-sediment data were available to calculate the suspended- sediment discharge. Dissolved-solids and suspended-sediment discharge were computed using the following equations (Porterfield, 1972):
Qds = Qw x ds x 0.0027 (3) Qs = Qw x c x 0.0027 (4)
52
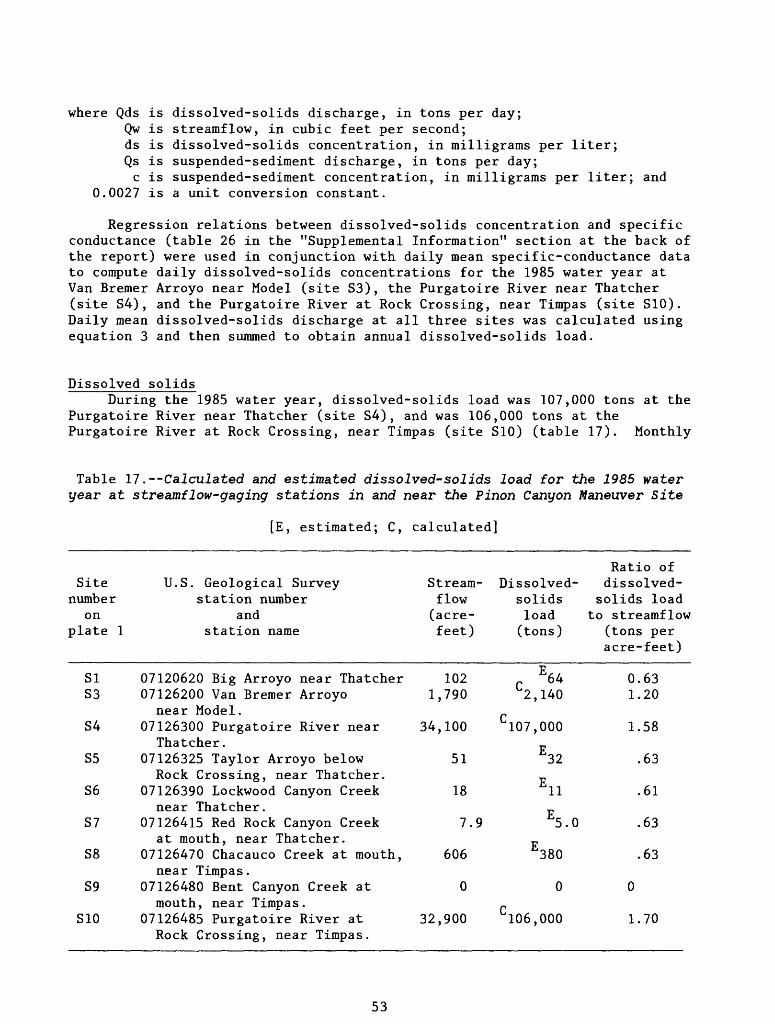
where Qds is dissolved-solids discharge, in tons per day; Qw is streamflow, in cubic feet per second;ds is dissolved-solids concentration, in milligrams per liter; Qs is suspended-sediment discharge, in tons per day;c is suspended-sediment concentration, in milligrams per liter; and
0.0027 is a unit conversion constant.
Regression relations between dissolved-solids concentration and specific conductance (table 26 in the "Supplemental Information" section at the back of the report) were used in conjunction with daily mean specific-conductance data to compute daily dissolved-solids concentrations for the 1985 water year at Van Bremer Arroyo near Model (site S3), the Purgatoire River near Thatcher (site S4) , and the Purgatoire River at Rock Crossing, near Timpas (site S10). Daily mean dissolved-solids discharge at all three sites was calculated using equation 3 and then summed to obtain annual dissolved-solids load.
Dissolved solidsDuring the 1985 water year, dissolved-solids load was 107,000 tons at the
Purgatoire River near Thatcher (site S4) , and was 106,000 tons at the Purgatoire River at Rock Crossing, near Timpas (site S10) (table 17). Monthly
Table 17. --Calculated and estimated dissolved-solids load for the 1985 water year at streamflow-gaging stations in and near the Pinon Canyon Maneuver Site
[E, estimated; C, calculated]
Site number
on plate 1
SI S3
U.S. Geological Survey station number
and station name
07120620 Big Arroyo near Thatcher 07126200 Van Bremer Arroyo
Stream- flow(acre- feet)
102 1,790
Dissolved- solidsload (tons)
L2,140
Ratio ofdissolved-
solids loadto streamflow
(tons per acre-feet)
0.63 1.20
near Model.54 07126300 Purgatoire River near 34,100
Thatcher.55 07126325 Taylor Arroyo below 51
Rock Crossing, near Thatcher.56 07126390 Lockwood Canyon Creek 18
near Thatcher.57 07126415 Red Rock Canyon Creek 7.9
at mouth, near Thatcher.58 07126470 Chacauco Creek at mouth, 606
near Timpas.59 07126480 Bent Canyon Creek at 0
mouth, near Timpas.S10 07126485 Purgatoire River at 32,900
Rock Crossing, near Timpas.
'107,000
E32
J5.0
E380
0
'106,000
1.58
.63
.61
.63
.63
0
1.70
53
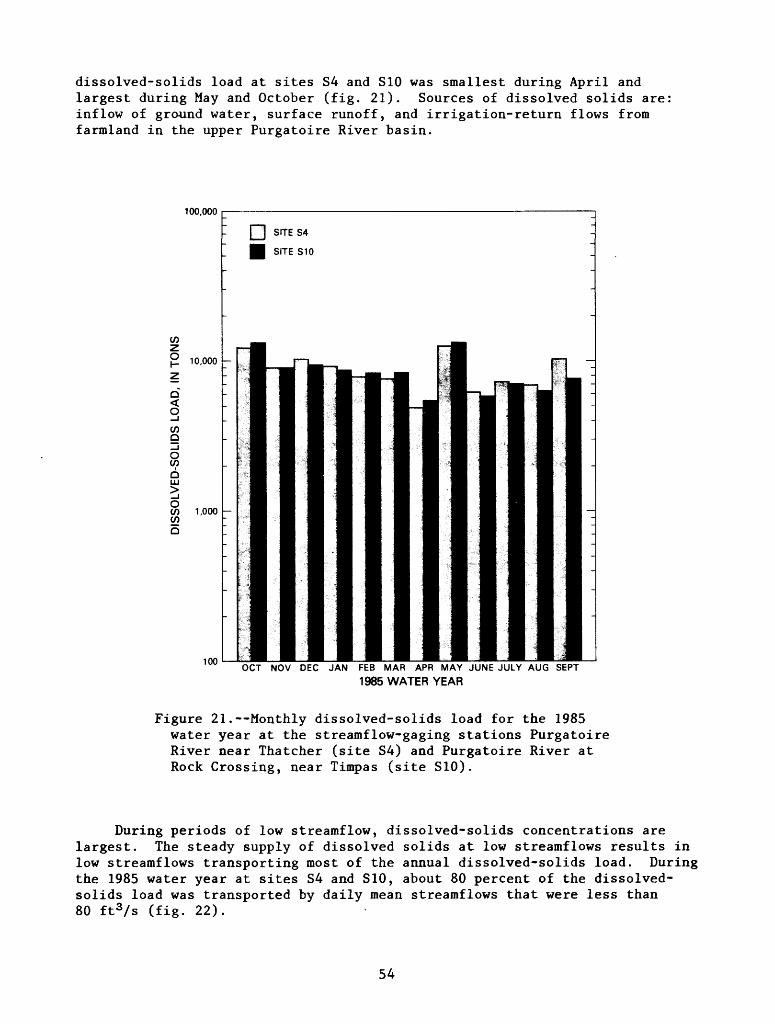
dissolved-solids load at sites S4 and S10 was smallest during April and largest during May and October (fig. 21). Sources of dissolved solids are inflow of ground water, surface runoff, and irrigation-return flows from farmland in the upper Purgatoire River basin.
100,000
10,000
Q<
QLU
1,000
100
SITE S4
SITE S10
OCT NOV DEC JAN FEB MAR APR MAY JUNE JULY AUG SEPT
1985 WATER YEAR
Figure 21. Monthly dissolved-solids load for the 1985 water year at the streamflow-gaging stations Purgatoire River near Thatcher (site S4) and Purgatoire River at Rock Crossing, near Timpas (site S10).
During periods of low streamflow, dissolved-solids concentrations are largest. The steady supply of dissolved solids at low streamflows results in low streamflows transporting most of the annual dissolved-solids load. During the 1985 water year at sites S4 and S10, about 80 percent of the dissolved- solids load was transported by daily mean streamflows that were less than 80 ft3/s (fig. 22).
54
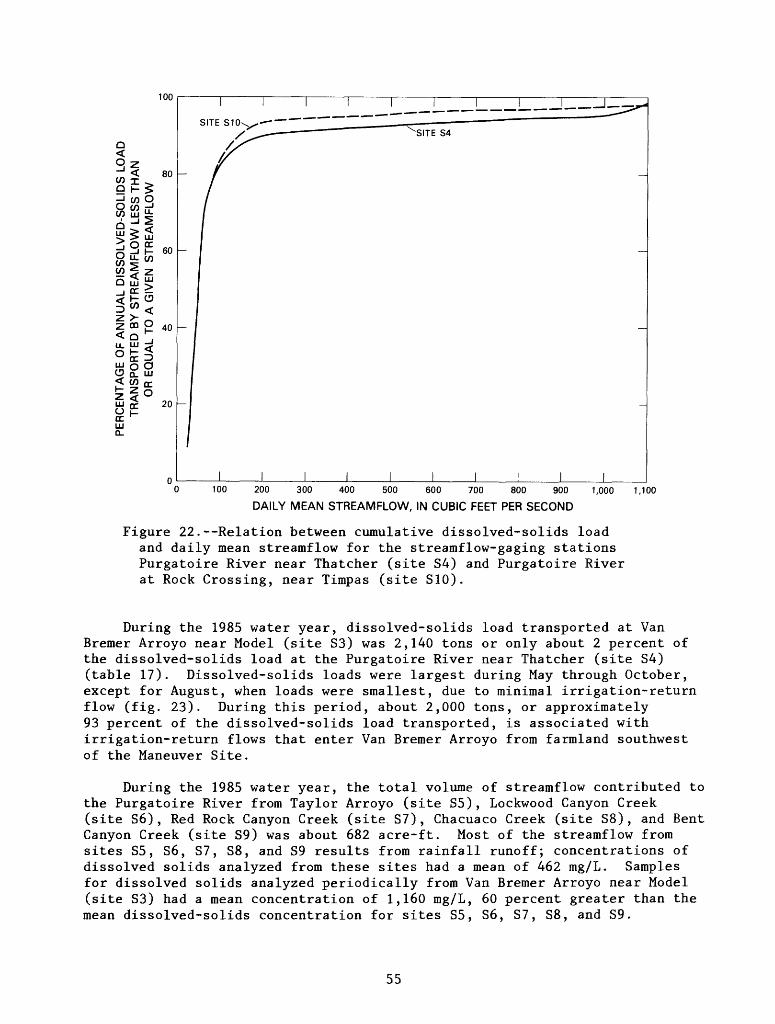
100 200 300 400 500 600 700 800 900
DAILY MEAN STREAMFLOW, IN CUBIC FEET PER SECOND
1,000 1,100
Figure 22.--Relation between cumulative dissolved-solids load and daily mean streamflow for the streamflow-gaging stations Purgatoire River near Thatcher (site S4) and Purgatoire River at Rock Crossing, near Timpas (site S10).
During the 1985 water year, dissolved-solids load transported at Van Bremer Arroyo near Model (site S3) was 2,140 tons or only about 2 percent of the dissolved-solids load at the Purgatoire River near Thatcher (site S4) (table 17). Dissolved-solids loads were largest during May through October, except for August, when loads were smallest, due to minimal irrigation-return flow (fig. 23). During this period, about 2,000 tons, or approximately 93 percent of the dissolved-solids load transported, is associated with irrigation-return flows that enter Van Bremer Arroyo from farmland southwest of the Maneuver Site.
During the 1985 water year, the total volume of streamflow contributed to the Purgatoire River from Taylor Arroyo (site S5), Lockwood Canyon Creek (site S6), Red Rock Canyon Creek (site S7), Chacuaco Creek (site S8), and Bent Canyon Creek (site S9) was about 682 acre-ft. Most of the streamflow from sites S5, S6, S7, S8, and S9 results from rainfall runoff; concentrations of dissolved solids analyzed from these sites had a mean of 462 mg/L. Samples for dissolved solids analyzed periodically from Van Bremer Arroyo near Model (site S3) had a mean concentration of 1,160 mg/L, 60 percent greater than the mean dissolved-solids concentration for sites S5, S6, S7, S8, and S9.
55
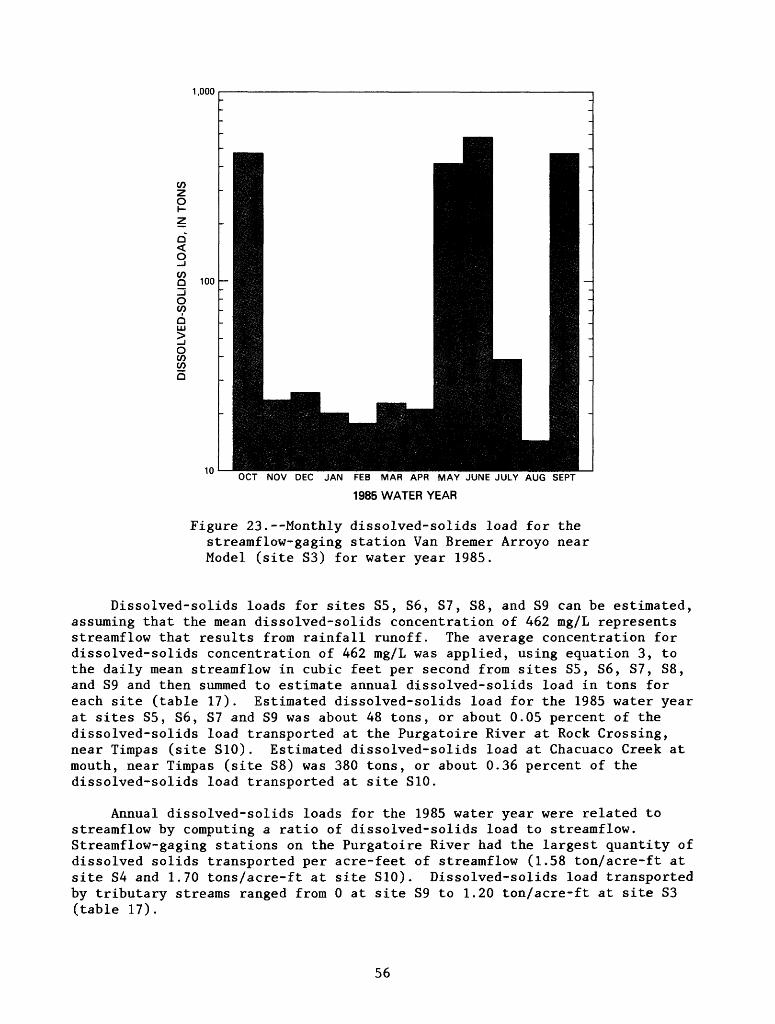
1,000
COz o
Q <O
COg_i oCOQ LU
O CO COQ
100
10OCT NOV DEC JAN FEB MAR APR MAY JUNE JULY AUG SEPT
1985 WATER YEAR
Figure 23.--Monthly dissolved-solids load for the streamflow-gaging station Van Bremer Arroyo near Model (site S3) for water year 1985.
Dissolved-solids loads for sites S5, S6, S7, S8, and S9 can be estimated, assuming that the mean dissolved-solids concentration of 462 mg/L represents streamflow that results from rainfall runoff. The average concentration for dissolved-solids concentration of 462 mg/L was applied, using equation 3, to the daily mean streamflow in cubic feet per second from sites S5, S6, S7, S8, and S9 and then summed to estimate annual dissolved-solids load in tons for each site (table 17). Estimated dissolved-solids load for the 1985 water year at sites S5, S6, S7 and S9 was about 48 tons, or about 0.05 percent of the dissolved-solids load transported at the Purgatoire River at Rock Crossing, near Timpas (site S10). Estimated dissolved-solids load at Chacuaco Creek at mouth, near Timpas (site S8) was 380 tons, or about 0.36 percent of the dissolved-solids load transported at site S10.
Annual dissolved-solids loads for the 1985 water year were related to streamflow by computing a ratio of dissolved-solids load to streamflow. Streamflow-gaging stations on the Purgatoire River had the largest quantity of dissolved solids transported per acre-feet of streamflow (1.58 ton/acre-ft at site S4 and 1.70 tons/acre-ft at site S10). Dissolved-solids load transported by tributary streams ranged from 0 at site S9 to 1.20 ton/acre-ft at site S3 (table 17).
56
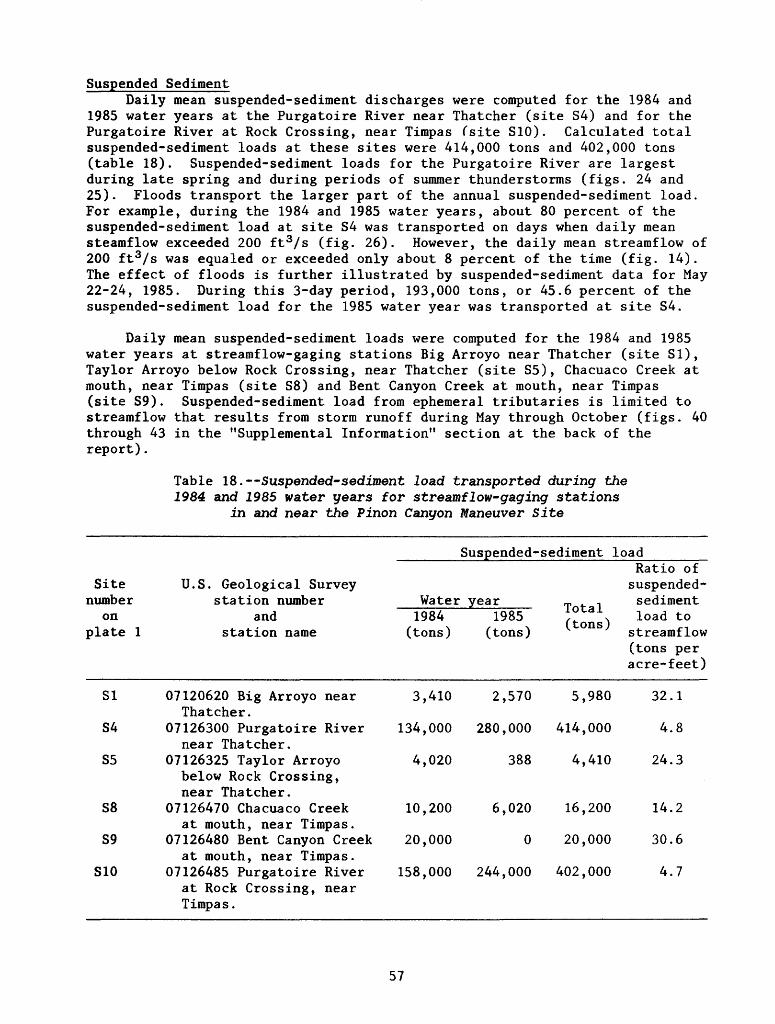
Suspended SedimentDaily mean suspended-sediment discharges were computed for the 1984 and
1985 water years at the Purgatoire River near Thatcher (site S4) and for the Purgatoire River at Rock Crossing, near Timpas (site S10). Calculated total suspended-sediment loads at these sites were 414,000 tons and 402,000 tons (table 18). Suspended-sediment loads for the Purgatoire River are largest during late spring and during periods of summer thunderstorms (figs. 24 and 25). Floods transport the larger part of the annual suspended-sediment load. For example, during the 1984 and 1985 water years, about 80 percent of the suspended-sediment load at site S4 was transported on days when daily mean steamflow exceeded 200 ft3/s (fig. 26). However, the daily mean streamflow of 200 ft3/s was equaled or exceeded only about 8 percent of the time (fig. 14). The effect of floods is further illustrated by suspended-sediment data for May 22-24, 1985. During this 3-day period, 193,000 tons, or 45.6 percent of the suspended-sediment load for the 1985 water year was transported at site S4.
Daily mean suspended-sediment loads were computed for the 1984 and 1985 water years at streamflow-gaging stations Big Arroyo near Thatcher (site SI), Taylor Arroyo below Rock Crossing, near Thatcher (site S5), Chacuaco Creek at mouth, near Timpas (site S8) and Bent Canyon Creek at mouth, near Timpas (site S9). Suspended-sediment load from ephemeral tributaries is limited to streamflow that results from storm runoff during May through October (figs. 40 through 43 in the "Supplemental Information" section at the back of the report).
Table 18. Suspended-sediment load transported during the1984 and 1985 neater years for streamflow-gaging stations
in and near the Pinon Canyon Maneuver Site
Suspended-sediment load
Site number
on plate 1
U.S. Geological Survey station number
and station name
Water year1984 1985 (tons) (tons)
Ratio of suspended-
,p . ! sediment Total , , . f . -^ load to (tons) . _. streamflow(tons per acre-feet)
SI 07120620 Big Arroyo near Thatcher.
54 07126300 Purgatoire River near Thatcher.
55 07126325 Taylor Arroyo below Rock Crossing, near Thatcher.
58 07126470 Chacuaco Creek at mouth, near Timpas.
59 07126480 Bent Canyon Creekat mouth, near Timpas.
S10 07126485 Purgatoire River at Rock Crossing, near Timpas.
3,410 2,570 5,980 32.1
134,000 280,000 414,000 4.8
4,020 388 4,410 24.3
10,200 6,020 16,200 14.2
20,000 0 20,000 30.6
158,000 244,000 402,000 4.7
57
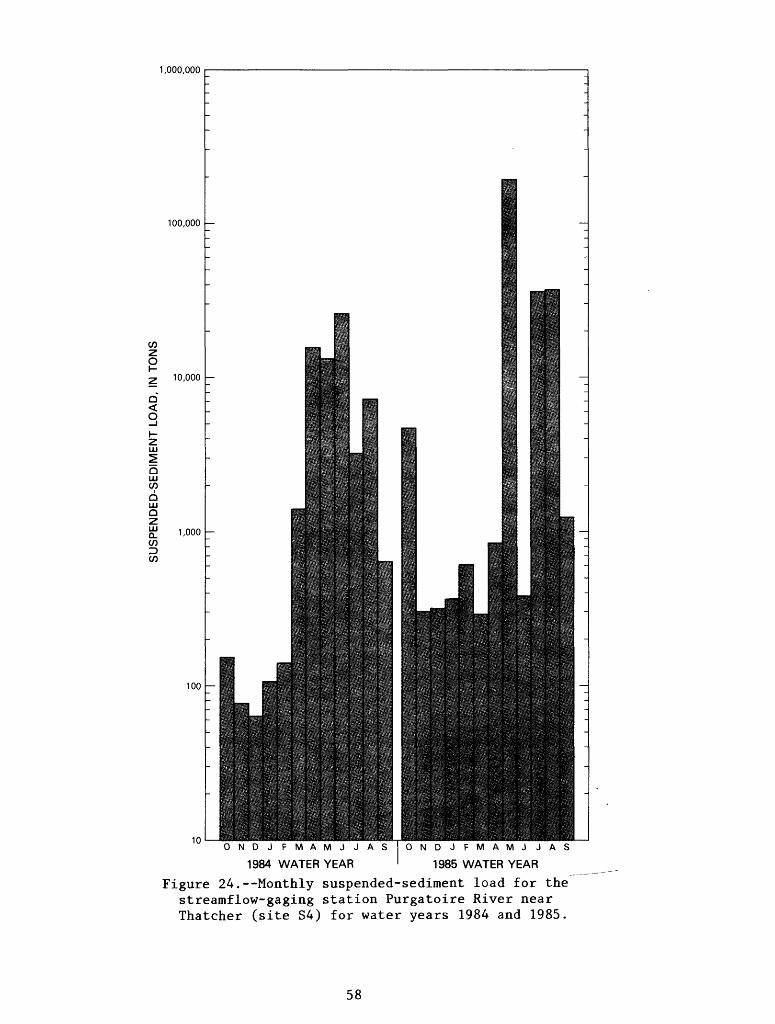
1,000,000
100,000 -
C/)z o
Q<o
ui
Q LUopQ LU Q Z LU Q. C/)Din
10,000 -
1,000 -
10 ONDJFMAMJJASIONDJFMAMJJAS
1984 WATER YEAR ' 1985 WATER YEAR Figure 24.--Monthly suspended-sediment load for the
streamflow-gaging station Purgatoire River near Thatcher (site S4) for water years 1984 and 1985.
58
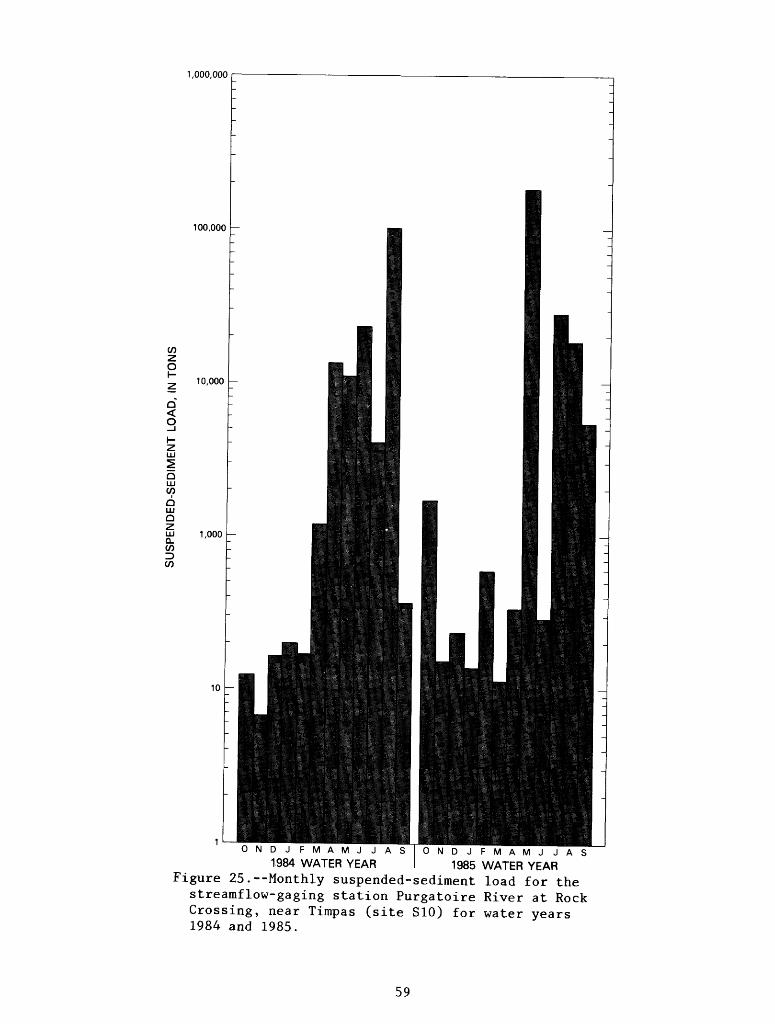
1,000,00
100,000
C/32o
Q <O
LU
QLU °?
QLUQ2LU Q. C/3D C/3
10,000 -
1,000
ONDJ FMAMJJASlONDJFMAMJ JAS
1984 WATER YEAR 1985 WATER YEAR Figure 25.--Monthly suspended-sediment load for the
streamflow-gaging station Purgatoire River at Rock Crossing, near Timpas (site S10) for water years 1984 and 1985.
59
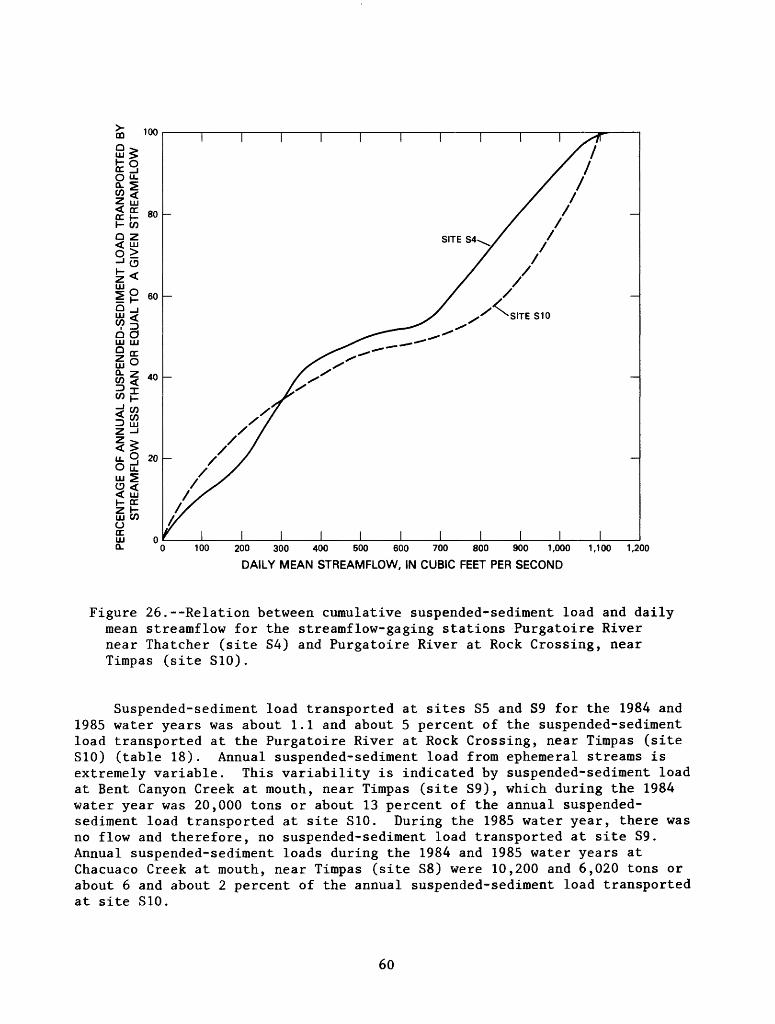
CO 100
a >UJ >fc oDC _jO u,a-
SfE soI- CO9 zrf '"
3|£<UJ -> ig 60
Q O UJ UJ
CO < 40
rf W< CO=> UJZ -J
Isu. O 20
ll
O DC UJ Q. 100 200 300 400 500 600 700 800 900 1,000
DAILY MEAN STREAMFLOW, IN CUBIC FEET PER SECOND1,100 1,200
Figure 26.--Relation between cumulative suspended-sediment load and daily mean streamflow for the streamflow-gaging stations Purgatoire River near Thatcher (site S4) and Purgatoire River at Rock Crossing, near Timpas (site S10).
Suspended-sediment load transported at sites S5 and S9 for the 1984 and 1985 water years was about 1.1 and about 5 percent of the suspended-sediment load transported at the Purgatoire River at Rock Crossing, near Timpas (site S10) (table 18). Annual suspended-sediment load from ephemeral streams is extremely variable. This variability is indicated by suspended-sediment load at Bent Canyon Creek at mouth, near Timpas (site S9), which during the 1984 water year was 20,000 tons or about 13 percent of the annual suspended- sediment load transported at site S10. During the 1985 water year, there was no flow and therefore, no suspended-sediment load transported at site S9. Annual suspended-sediment loads during the 1984 and 1985 water years at Chacuaco Creek at mouth, near Timpas (site S8) were 10,200 and 6,020 tons or about 6 and about 2 percent of the annual suspended-sediment load transported at site S10.
60
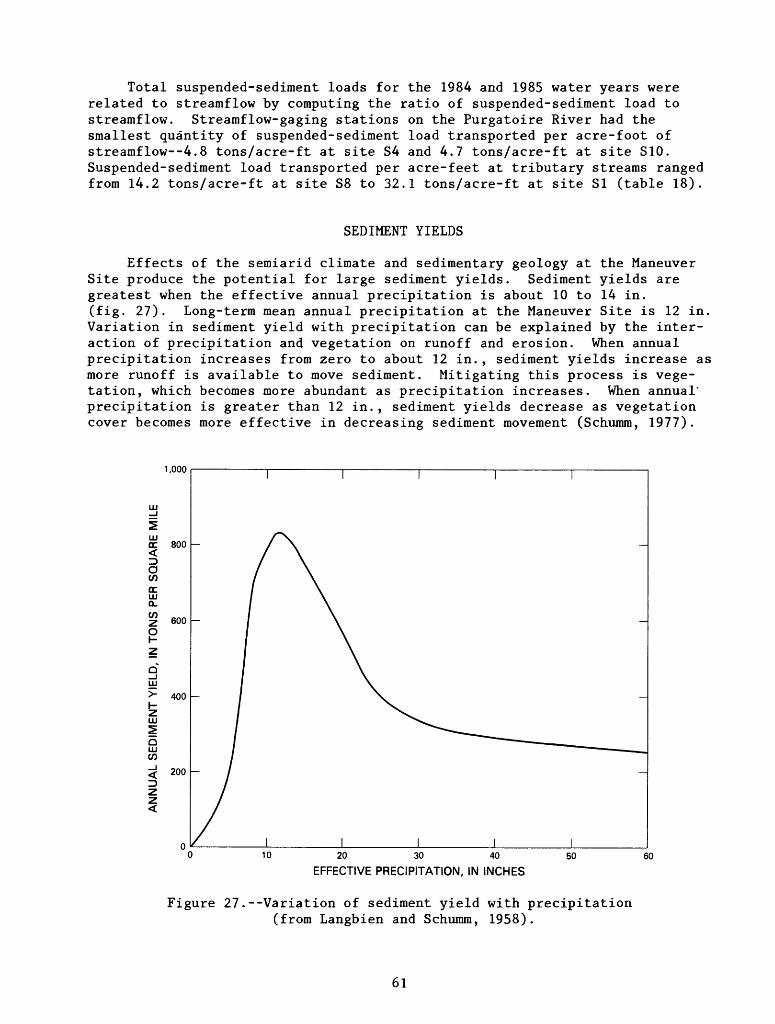
Total suspended-sediment loads for the 1984 and 1985 water years were related to streamflow by computing the ratio of suspended-sediment load to streamflow. Streamflow-gaging stations on the Purgatoire River had the smallest quantity of suspended-sediment load transported per acre-foot of streamflow--4.8 tons/acre-ft at site S4 and 4.7 tons/acre-ft at site S10. Suspended-sediment load transported per acre-feet at tributary streams ranged from 14.2 tons/acre-ft at site S8 to 32.1 tons/acre-ft at site SI (table 18).
SEDIMENT YIELDS
Effects of the semiarid climate and sedimentary geology at the Maneuver Site produce the potential for large sediment yields. Sediment yields are greatest when the effective annual precipitation is about 10 to 14 in. (fig. 27). Long-term mean annual precipitation at the Maneuver Site is 12 in. Variation in sediment yield with precipitation can be explained by the inter action of precipitation and vegetation on runoff and erosion. When annual precipitation increases from zero to about 12 in., sediment yields increase as more runoff is available to move sediment. Mitigating this process is vege tation, which becomes more abundant as precipitation increases. When annual' precipitation is greater than 12 in., sediment yields decrease as vegetation cover becomes more effective in decreasing sediment movement (Schumm, 1977).
1,000
20 30 40
EFFECTIVE PRECIPITATION, IN INCHES
50 60
Figure 27.--Variation of sediment yield with precipitation (from Langbien and Schumm, 1958).
61
Sediment yield is the quantity of net eroded sediment that is transported at the mouth of a drainage basin. Sediment yields are usually much smaller than the gross quantity of sediment eroded in a drainage basin. In general, the rate at which sediment is discharged from a drainage basin is less than one-fourth the actual rate of soil erosion from the land surface (Vanoni, 1975).
Sediment Yields Measured from Stock-Watering Reservoirs
In order to determine the effects of military land use on sediment yields at the Maneuver Site, it was necessary to determine sediment yields in the area prior to any change in land use. Sediment yields were measured for the drainage basins upstream from 29 of 49 stock-watering reservoirs (table 19) (pi. 1). Twenty-two of these reservoirs are located within the boundary of the Maneuver Site and the remaining seven reservoirs are located offsite on adjacent rangeland. Stock-watering reservoirs where sediment yields were measured had drainage-basin areas that ranged from 0.06 to 1.2 mi 2 and storage capacities that ranged from 0.41 to 16.0 acre-ft.
Contour maps of deposited sediment were developed from a transit survey and the probing of sediment depths. Volume of deposited sediment was calcu lated using the modified prismodial formula (Heinemann and Dvorak, 1963). Bulk density samples were collected to determine the weight per unit volume of deposited sediments. In order to measure actual sediment yields, trap efficiencies were needed for each reservoir. These trap efficiencies were estimated based on the condition of the spillway and on the comparison of capacity-inflow ratios with the trap efficiency curve described by Heinemann (1981). Ages of stock-watering reservoirs were determined from interviews with previous landowners and inspection of aerial photographs available at the U.S. Soil Conservation office in Trinidad.
Annual mean sediment yield, in tons per square mile, was calculated by converting sediment volume in acre-feet to tons by applying the bulk density for each stock-watering reservoir, then dividing the total volume of sediment in tons by the size of the drainage-basin area in square miles and then dividing by the age of the reservoir in years. Calculated mean annual sediment yields were adjusted by dividing by the estimated trap efficiency for each reservoir (table 19).
Annual mean sediment yields determined at the 22 stock-watering reser voirs located on the Maneuver Site ranged from 9.5 to 1,700 tons/mi 2 . Stock- watering reservoirs that have drainage basins underlain by shale had the largest measured sediment yields and an annual mean sediment yield of 588 tons/mi 2 . Stock-watering reservoirs that have drainage basins underlain by sandstone and limestone had annual mean sediment yields of 186 and 68 tons/mi 2 . One stock-watering reservoir has a drainage basin underlain by basalt and had an annual mean sediment yield of 302 tons/mi 2 . Mean annual sediment yields determined for seven stock-watering reservoirs located adjacent to the Maneuver Site ranged from 22 to 325 tons/mi 2 .
62
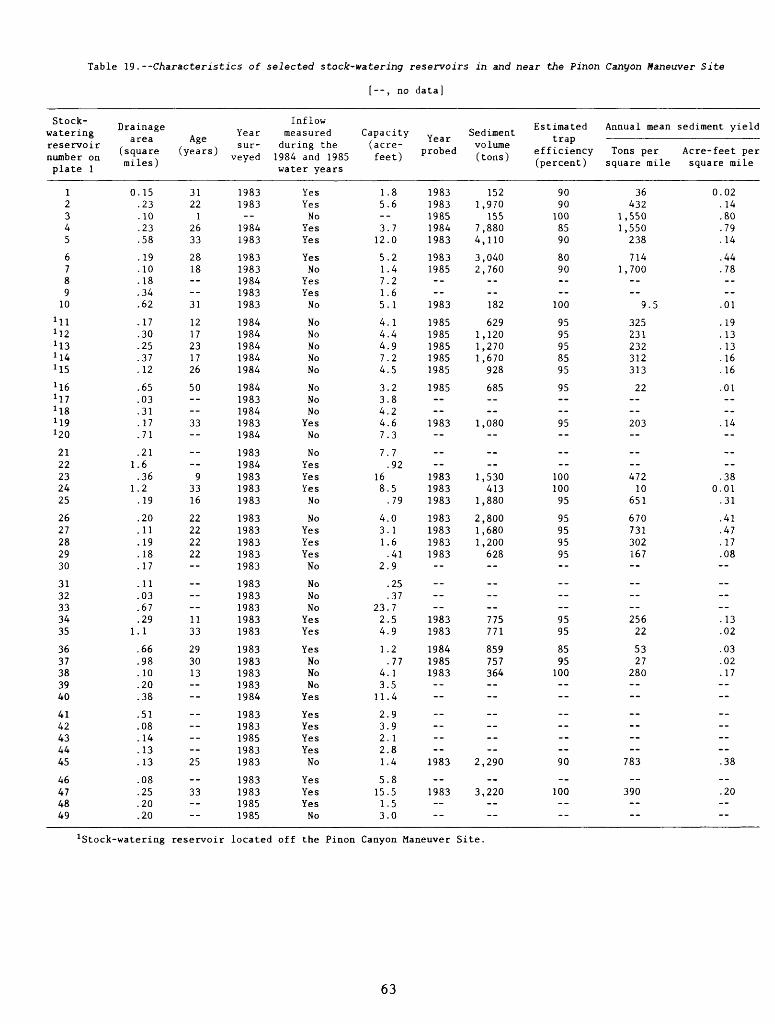
Table ^.--Characteristics of selected stock-watering reservoirs in and near the Pinon Canyon Maneuver Site
[--, no data]
Stock- watering reservoir number on plate 1
12345
678910
MlM2M3M4MsM6M7M8M9*20
2122232425
2627282930
3132333435
3637383940
4142434445
46474849
Drainage area
(square miles)
0.15.23.10.23.58
.19
.10
.18
.34
.62
.17
.30
.25
.37
.12
.65
.03
.31
.17
.71
.211.6.36
1.2.19
.20
.11
.19
.18
.17
.11
.03
.67
.291.1
.66
.98
.10
.20
.38
.51
.08
.14
.13
.13
.08
.25
.20
.20
Age(years)
3122
12633
2818----31
1217231726
50----33--
----
93316
22222222--
-- --1133
293013 --
--------25
--
33----
Year sur
veyed
19831983--19841983
19831983198419831983
19841984198419841984
19841983198419831984
19831984198319831983
19831983198319831983
19831983198319831983
19831983198319831984
19831983198519831983
1983198319851985
Inflow measured during the 1984 and 1985 water years
YesYesNo
YesYes
YesNo
YesYesNo
NoNoNoNoNo
NoNoNo
YesNo
NoYesYesYesNo
NoYesYesYesNo
NoNoNoYesYes
YesNoNoNo
Yes
YesYesYesYesNo
YesYesYesNo
Capacity (acre-
feet)
1.85.6--3.712.0
5.21.47.21.65.1
4.14.44.97.24.5
3.23.84.24.67.3
7.7.92
168.5.79
4.03.11.6.41
2.9
.25
.3723.72.54.9
1.2.77
4.13.511.4
2.93.92.12.81.4
5.815.51.53.0
Year probed
19831983198519841983
19831985----1983
19851985198519851985
1985 --1983--
----
198319831983
1983198319831983--
------19831983
198419851983----
--------1983
--1983 --
Sediment volume (tons)
1521,970
1557,8804,110
3,0402,760
----182
6291,1201,2701,670
928
685----
1,080--
----
1,530413
1,880
2,8001,6801,200
628--
------775771
859757364----
--------
2,290
--3,220
----
Estimated trap
efficiency (percent)
90901008590
8090 --
100
9595958595
95 --95--
----
10010095
95959595--
---- 9595
8595100----
------ 90
--100----
Annual mean
Tons per square mile
36432
1,5501,550238
7141,700
----
9.5
325231232312313
22----203--
----47210
651
670731302167--
------25622
5327
280----
------
783
--390----
sediment yield
Acre-feet per square mile
0.02.14.80.79.14
.44
.78----.01
.19
.13
.13
.16
.16
.01---_.14--
----.38
0.01.31
.41
.47
.17
.08--
-- --.13.02
.03
.02
.17----
--------.38
--.20----
1 Stock-watering reservoir located off the Pinon Canyon Maneuver Site.
63
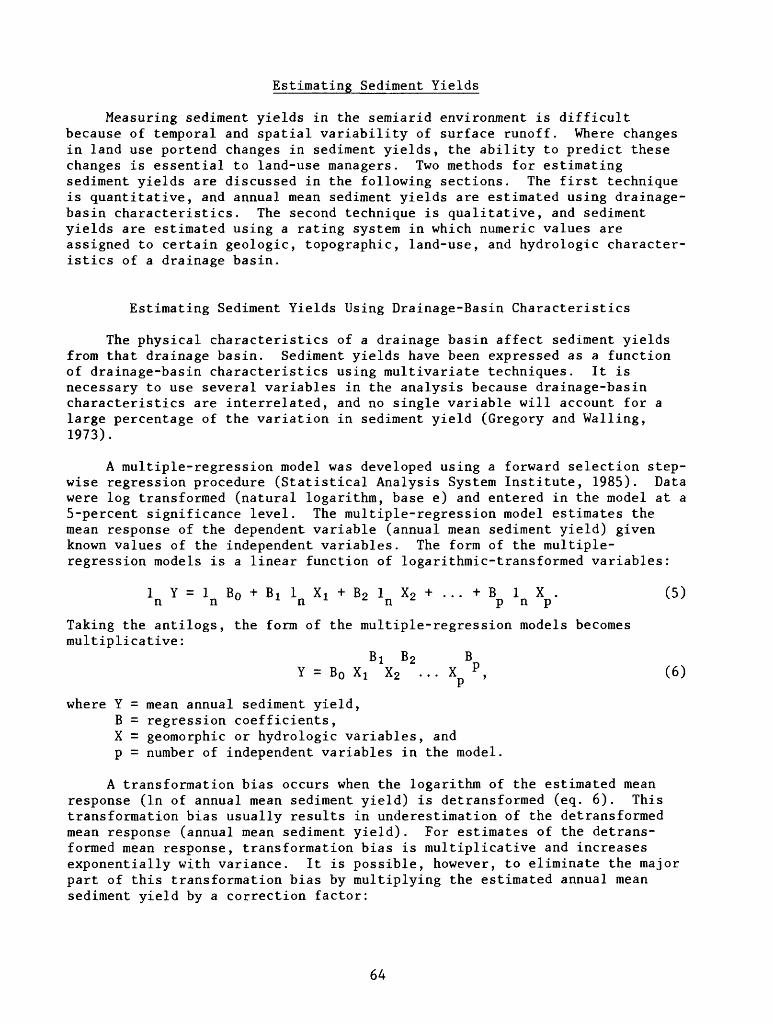
Estimating Sediment Yields
Measuring sediment yields in the seraiarid environment is difficult because of temporal and spatial variability of surface runoff. Where changes in land use portend changes in sediment yields, the ability to predict these changes is essential to land-use managers. Two methods for estimating sediment yields are discussed in the following sections. The first technique is quantitative, and annual mean sediment yields are estimated using drainage- basin characteristics. The second technique is qualitative, and sediment yields are estimated using a rating system in which numeric values are assigned to certain geologic, topographic, land-use, and hydrologic character istics of a drainage basin.
Estimating Sediment Yields Using Drainage-Basin Characteristics
The physical characteristics of a drainage basin affect sediment yields from that drainage basin. Sediment yields have been expressed as a function of drainage-basin characteristics using multivariate techniques. It is necessary to use several variables in the analysis because drainage-basin characteristics are interrelated, and no single variable will account for a large percentage of the variation in sediment yield (Gregory and Walling, 1973).
A multiple-regression model was developed using a forward selection step- wise regression procedure (Statistical Analysis System Institute, 1985). Data were log transformed (natural logarithm, base e) and entered in the model at a 5-percent significance level. The multiple-regression model estimates the mean response of the dependent variable (annual mean sediment yield) given known values of the independent variables. The form of the multiple- regression models is a linear function of logarithmic-transformed variables:
1 Y = 1 B0 + B! 1 X x + B 2 1 X2 + ... + B 1 X . (5) n n ul n lz n z pnp
Taking the antilogs, the form of the multiple-regression models becomes multiplicative:
BI B 2 B Y = B 0 Xi X2 ... Xp p , (6)
where Y = mean annual sediment yield, B = regression coefficients, X = geomorphic or hydrologic variables, and p = number of independent variables in the model.
A transformation bias occurs when the logarithm of the estimated mean response (In of annual mean sediment yield) is detransformed (eq. 6). This transformation bias usually results in underestimation of the detransformed mean response (annual mean sediment yield). For estimates of the detrans formed mean response, transformation bias is multiplicative and increases exponentially with variance. It is possible, however, to eliminate the major part of this transformation bias by multiplying the estimated annual mean sediment yield by a correction factor:
64
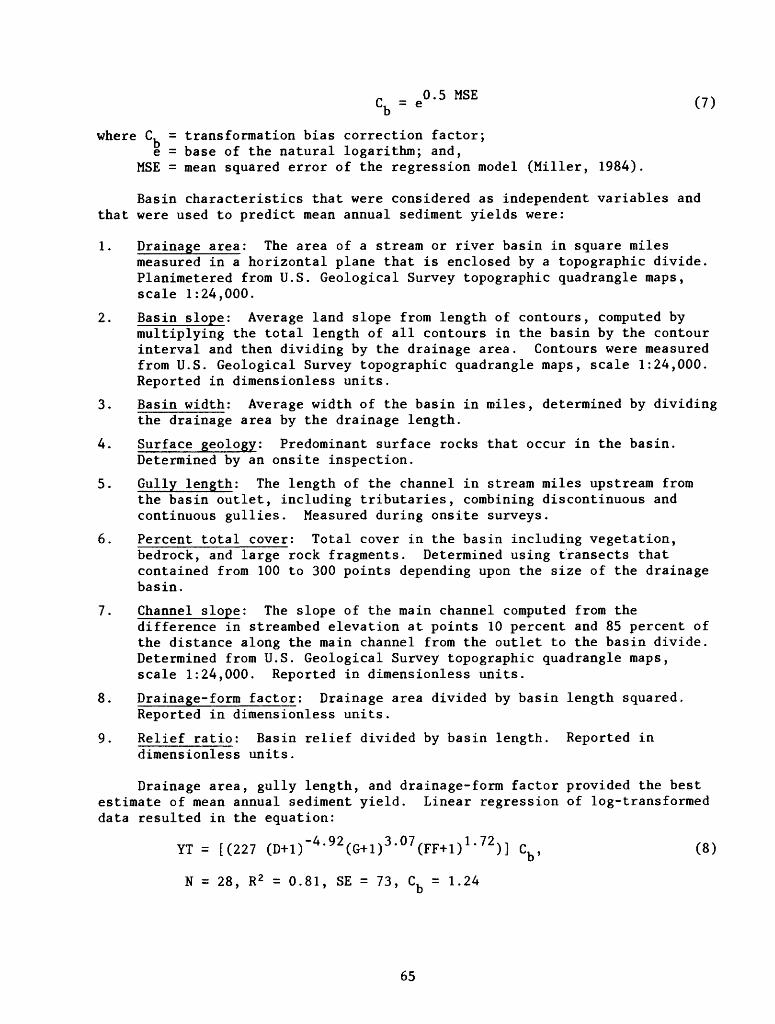
Cb = e°' 5 MSE (7)
where C, = transformation bias correction factor;e = base of the natural logarithm; and,
MSE = mean squared error of the regression model (Miller, 1984).
Basin characteristics that were considered as independent variables and that were used to predict mean annual sediment yields were:
1. Drainage area: The area of a stream or river basin in square milesmeasured in a horizontal plane that is enclosed by a topographic divide. Planimetered from U.S. Geological Survey topographic quadrangle maps, scale 1:24,000.
2. Basin slope: Average land slope from length of contours, computed bymultiplying the total length of all contours in the basin by the contour interval and then dividing by the drainage area. Contours were measured from U.S. Geological Survey topographic quadrangle maps, scale 1:24,000. Reported in dimensionless units.
3. Basin width: Average width of the basin in miles, determined by dividing the drainage area by the drainage length.
4. Surface geology: Predominant surface rocks that occur in the basin. Determined by an onsite inspection.
5. Gully length: The length of the channel in stream miles upstream from the basin outlet, including tributaries, combining discontinuous and continuous gullies. Measured during onsite surveys.
6. Percent total cover: Total cover in the basin including vegetation, bedrock, and large rock fragments. Determined using transects that contained from 100 to 300 points depending upon the size of the drainage basin.
7. Channel slope: The slope of the main channel computed from thedifference in streambed elevation at points 10 percent and 85 percent of the distance along the main channel from the outlet to the basin divide. Determined from U.S. Geological Survey topographic quadrangle maps, scale 1:24,000. Reported in dimensionless units.
8. Drainage-form factor: Drainage area divided by basin length squared. Reported in dimensionless units.
9. Relief ratio: Basin relief divided by basin length. Reported in dimensionless units.
Drainage area, gully length, and drainage-form factor provided the best estimate of mean annual sediment yield. Linear regression of log-transformed data resulted in the equation:
YT = [(227 (D+1)" 4 ' 92 (G+1) 3 -° 7 (FF+1) 1 - 72 )] C^, (8)
N = 28, R 2 = 0.81, SE = 73, C, = 1.24
65
where: YT = mean annual sediment yield, in tons per square mile; D = drainage area, in square miles; G = gully length, in miles;
FF = drainage-form factor, in dimensionless units; C, = log transformation bias correction factor (Miller, 1984);
N = number of observations; R2 = coefficient of determination; and SE = standard error of estimate, in average percent.
The R2 value indicates that 81 percent of the variation in sediment yields can be explained by the basin characteristics of drainage area, gully length, and drainage-form factor.
Sediment yields decrease with an increase in drainage area because the opportunity for deposition of sediments increases within the basin. The negative exponent associated with drainage area in the equation indicates this inverse relation. Sediment yield also is dependent on the transport effi ciency of the channel network (Hadley and Shown, 1976). As gully length increases, there is greater opportunity for conveyance of sediment from a basin. Existing gullies also provide additional sediment sources through exposed erosional surfaces on headcuts and gully walls. Drainage-form factor is an expression of basin shape (Gregory and Walling, 1973). Basin shape can affect the proximity of eroded sediment to conveyance channels and subse quently the basin outlet. Drainage-form factors ranged from 0.11 to 0.96. Small values represent greater watershed length relative to drainage area. Drainage-form factor has a positive correlation with sediment yield indicating that with a decrease in drainage length relative to drainage area, sediment yields increase.
Estimating Sediment Yields Using the Pacific Southwest Inter-Agency Committee Method
A qualitative method for estimating sediment yields in the semiarid southwest was developed by the Pacific Southwest Inter-Agency Committee (1968) or PSIAC. The PSIAC method considers nine factors that affect sediment yields; these are: (1) Surface geology, (2) soils, (3) climate, (4) runoff, (5) topography, (6) ground cover, (7) land use, (8) upland erosion, and (9) channel erosion and sediment transport. Each factor is given a numerical rating based on those listed in table 20. The sum of these numerical ratings then is compared with the rating column in table 21, which corresponds to a range of annual sediment yields in acre feet per square mile. Numerical values assigned to each drainage-basin condition, and the estimated annual mean sediment yield, in acre-feet per square mile, are listed in table 22.
The PSIAC guidelines recommend this method be used for drainage basins that are no smaller than 10 mi 2 . However, Shown (1970) reported that sediment-yield estimates compared favorably with measured sediment yields in basins ranging in size from 0.02 to 7.1 mi2 . Sediment-yield data obtained from 28 stock-watering reservoirs (stock-watering-reservoir number 3 was excluded from this analysis) that have drainage-basin areas that range from 0.10 to 1.20 mi 2 were compared with PSIAC estimates for their respective basins (fig. 28). Estimated annual mean sediment yields generally were larger
66
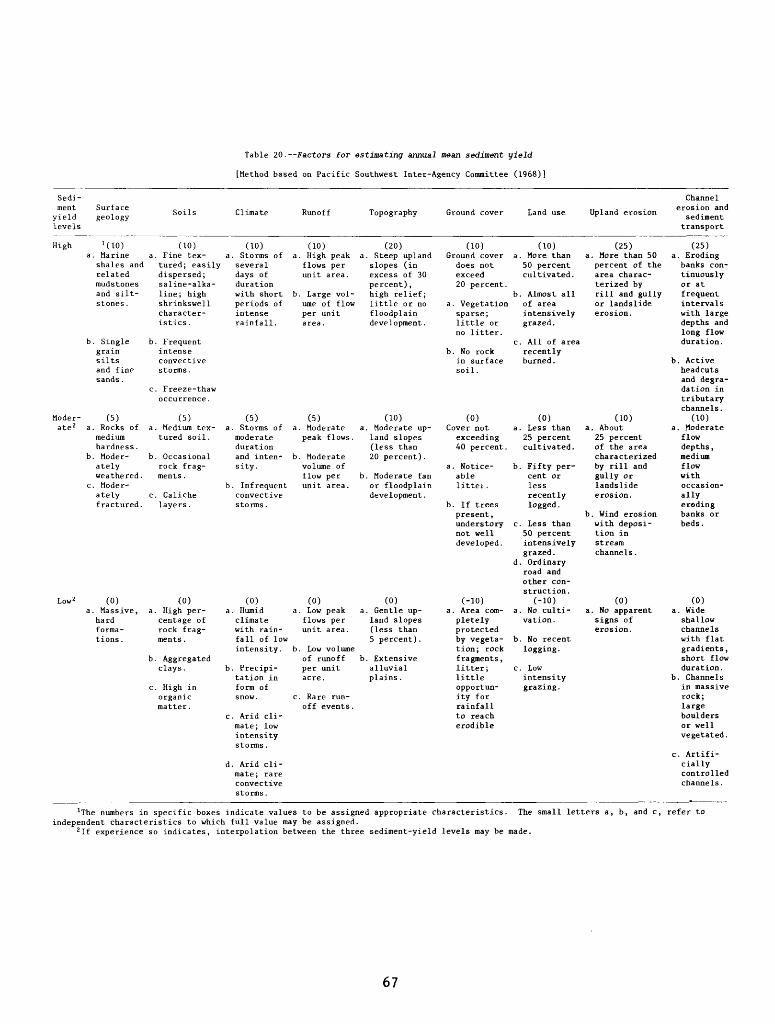
Table 20.--Factors for estimating annual mean sediment yield
[Method based on Pacific Southwest Inter-Agency Committee (1968)]
Sedi ment yield levels
High
Moderate 2
Low 2
Surface geology
HlO)a. Marine
shales andrelatedmudstonesand silt-stones .
b. Singlegrainsiltsand finesands .
(5)a. Rocks ofmediumhardness .
b. Moderatelyweathered.
c. Moderatelyfractured.
(0)a. Massive,
hard formations .
Soils
(10)a. Fine tex-
tured; easilydispersed;saline-alkaline; highshrinkswell
istics.
b. Frequentintenseconvectivestorms .
c. Freeze-thawoccurrence.
(5)a. Medium tex-
tured soil.
b. Occasionalrock fragments.
c. Calichelayers.
(0)a. High per
centage ofrock frag ments.
b. Aggregatedclays.
c. High inorganicmatter.
Climate
(10)a. Storms of a.
severaldays ofdurationwith short bperiods of
rainfall.
(5)a. Storms of a
moderatedurationand inten- bsity.
b. Infrequentconvectivestorms.
(0)a. Humid a
climate
fall of lowintensity, b
b. Precipitation inform ofsnow. c
c. Arid climate; lowintensitystorms.
d. Arid climate; rareconvectivestorms .
Runoff
(10). High peakflows perunit area.
. Large volume of flowper unit area.
(5). Moderatepeak flows.
. Moderatevolume offlow perunit area.
(0). Low peakflows per unit area.
. Low volumeof runoffper unitacre.
. Rare runoff events.
Topography
(20)a. Steep upland
slopes (inexcess of 30percent) ,high relief;little or nofloodplain development.
(10)a. Moderate up
land slopes(less than20 percent).
b. Moderate fanor floodplaindevelopment.
(0)a. Gentle up
land slopes (less than5 percent) .
b. Extensivealluvialplains .
Ground cover
(10)Ground cover
does notexceed20 percent.
a. Vegetationsparse; little orno litter.
b. No rockin surfacesoil.
(0)Cover not
exceeding40 percent.
a. Noticeablelittei.
b. If treespresent,understorynot welldeveloped.
(-10)a. Area completelyprotected by vegetation; rockfragments,litter;littleopportunity forrainfallto reacherodible
Land use
(10)a. More than
50 percentcultivated.
b. Almost allof areaintensively grazed.
c. All of arearecentlyburned.
(0)a. Less than
25 percentcultivated.
b. Fifty percent orlessrecentlylogged.
c. Less than50 percentintensivelygrazed.
d. Ordinaryroad andother construction.
(-10)a. No culti
vation.
b. No recentlogging.
c. Lowintensitygrazing.
Upland erosion
(25)a. More than 50percent of thearea characterized byrill and gullyor landslide erosion.
(10)a . About
25 percentof the areacharacterizedby rill andgully orlandslideerosion.
b. Wind erosionwith deposition instreamchannels.
(0)a. No apparent
signs of erosion.
Channel erosion and
sediment transport
(25)a. Erodingbanks continuouslyor atfrequentintervals
depths andlong flowduration.
b. Activeheadcutsand degradation intributarychannels.
(10)a. Moderate
flowdepths ,mediumflowwithoccasionallyerodingbanks orbeds.
(0)a. Wide
shallow channelswith flatgradients,short flowduration.
b. Channelsin massiverock;largebouldersor wellvegetated.
c. Artificiallycontrolledchannels.
1The numbers in specific boxes indicate values to be assigned appropriate characteristics. The small letters a, b, and c, refer to independent characteristics to which full value may be assigned.
2 If experience so indicates, interpolation between the three sediment-yield levels may be made.
67
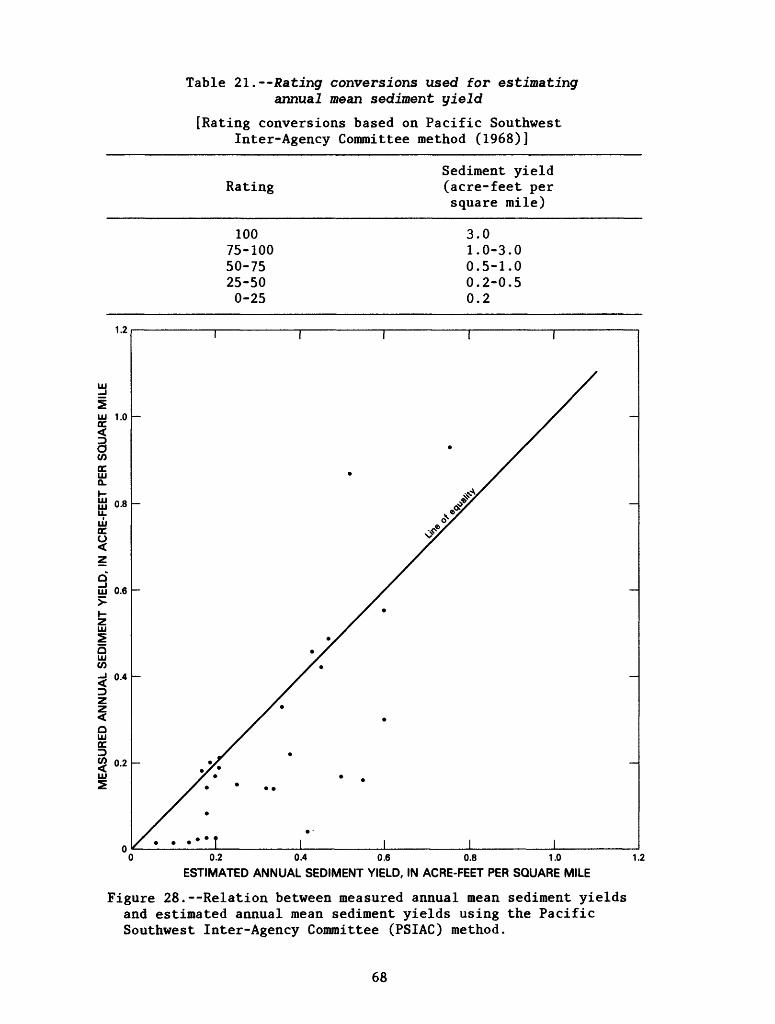
Table 21. Rating conversions used for estimating annual mean sediment yield
[Rating conversions based on Pacific Southwest Inter-Agency Committee method (1968)]
RatingSediment yield(acre-feet persquare mile)
10075-10050-7525-500-25
3.01.0-3.00.5-1.00.2-0.50.2
1.2
LU 1.0DC<
8C/>ccLU CL
" 0.8
3LU 0.6
LU
5 LU (0
Q LU DC
0.4
0.2LU
0 0.2 0.4 0.6 0.8 1.0 1.2 ESTIMATED ANNUAL SEDIMENT YIELD, IN ACRE-FEET PER SQUARE MILE
Figure 28. Relation between measured annual mean sediment yields and estimated annual mean sediment yields using the Pacific Southwest Inter-Agency Committee (PSIAC) method.
68
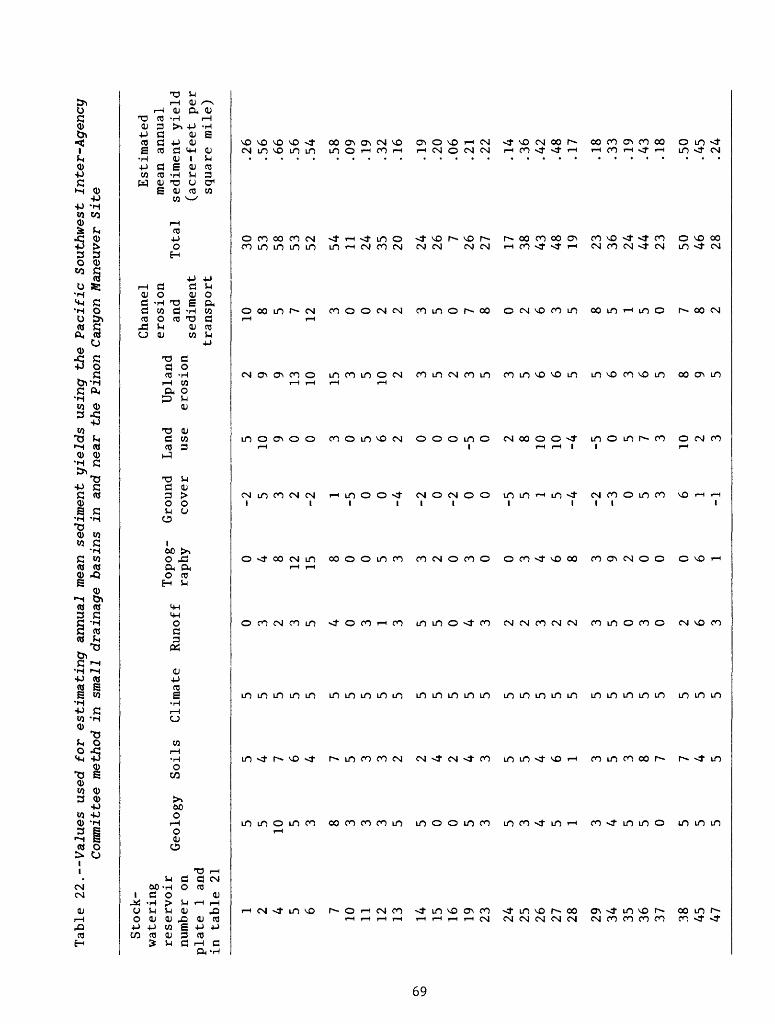
Tabl
e 22. Values used fo
r estimating annual me
an sediment yields us
ing
the
Pacific
Sout
hwes
t In
ter-
Agen
cy
Comm
itte
e method in
sm
all
drai
nage
basins in
and near th
e Pi
non
Cany
on M
aneuver
Site
Stoc
k-
wate
ring
reservoir
.., -.
, Geology
number on
&Jplate
1 and
in table
21
1 2 4 5 6 7 10 11 12 13 14 15 16 19 23 24 25 26 27 28 29 34 35 36 37 38 45 47
5 5 10 5 3 8 3 3 3 5 5 0 0 5 3 5 3 4 5 1 3 4 5 5 0 5 5 5
Soil
s
5 4 7 6 4 7 5 3 3 2 2 4 2 4 3 5 5 4 6 1 3 5 3 8 7 7 4 5
Clim
ate
5 5 5 5 5 5 5 5 5 5 5 5 5 5 5 5 5 5 5 5 5 5 5 5 5 5 5 5
Runo
ff 0 3 2 3 5 4 0 3 1 3 5 5 0 4 3 2 2 3 2 2 3 5 0 3 0 2 6 3
Topo
g
raphy 0 4 8 12 15 8 0 0 5 3 3 2 0 3 0 0 3 4 6 8 3 9 2 0 0 0 6 1
Grou
nd
cove
r
-2 5 3 2 -2
1-5 0 0 -4 -2 0 -2 0 0 -5 5 1 5 -4 -2 -3 0 5 3 6 1-1
Land
use 5 10 9 0 0 3 0 5 6 2 0 0 0 -5 0 2 8 10 10 -4 -5 0 5 7 3 10 2 3
Upla
nd
eros
ion
2 9 9 13 10 15 3 5 10 2 3 5 2 3 5 3 5 6 6 5 5 6 3 6 5 8 9 5
Channel
Estimated
eros
ion
mean
an
nual
and
Total
sediment yield
sediment
(acr
e-fe
et pe
r tr
ansp
ort
squa
re mile)
10 8 5 7 12 3 0 0 2 2 3 5 0 7 8 0 2 6 3 5 8 5 1 5 0 7 8 2
30 53 58 53 52 54 11 24 35 20 24 267
26 27 17 38 43 48 19 23 36 24 44 23 50 46 28
.26
.56
.66
.56
.54
.58
.09
.19
.32
.16
.19
.20
.06
.21
.22
.14
.36
.42
.48
.17
.18
.33
.19
.43
.18
.50
.45
.24
than the measured annual mean sediment yields determined from stock-watering reservoirs. The overestimates may be explained by estimator bias that affects the subjectivity of the technique. Also, PSIAC estimates represent the effects of the current basin conditions on sediment yields. Measured sediment yields from the stock-watering reservoirs integrate conditions for a period of years, during which time the physical characteristics of each basin have not been static but have been evolving into their present condition.
SUMMARY
The U.S. Department of the Army has acquired 381 mi 2 of semiarid rangeland in southeastern Colorado for mechanized military maneuvers. The U.S. Geological Survey was directed by the U.S. Congress to collect background hydrologic information at the U.S. Army Pinon Canyon Maneuver Site. A multi- disciplined hydrologic investigation began in October 1982. As part of the ground-water investigation, 114 wells and springs were inventoried and water- quality samples were collected at 24 wells and 1 spring. Strearaflow and water-quality data were collected at 11 streamflow-gaging stations in and near the Maneuver Site. Suspended-sediment data were collected at six streamflow- gaging stations. Storage capacities of 48 stock-watering reservoirs were surveyed, and sediment volumes and sediment yields were determined at 29 of these reservoirs.
The primary aquifer at the Maneuver Site is the Dakota-Purgatoire aquifer. The Dakota-Purgatoire aquifer has been a source of water for a few domestic wells and many stock-watering wells. On the Maneuver Site, recharge to the aquifer is primarily from precipitation and subsurface inflow from adjoining areas. Where outcrop areas are traversed by ephemeral streams, occasional flood flows provide some local recharge of very limited extent. Discharge from the aquifer is by well pumpage, spring flow, evapotranspira- tion, and ground-water flow. On the basis of 16 aquifer tests, values of transmissivity ranged from 14 to 882 ft 3/d, and values of storage coefficient ranged from 0.0001 to 0.10.
Wells in the Dakota-Purgatoire aquifer have yields that generally range from 10 to 500 gal/min. On the basis of periodic measurements made at eight wells during the 1985 water year, water levels in the aquifer are not fluctuating to a great extent. Only two of the wells had water-level changes greater than 1 ft.
Water-quality samples from the Dakota-Purgatoire aquifer have large concentrations of dissolved solids and extremely large dissolved-iron concen trations at certain wells. Primary and secondary drinking-water standards for dissolved solids were exceeded at 84 percent of the ground-water sites sampled. Secondary drinking-water standards for dissolved iron were exceeded at 64 percent of the ground-water sites sampled. Ground-water-quality samples indicated that ground water in the area of the Maneuver Site has naturally large concentrations of radiochemicals. Samples collected from two wells used for domestic purposes exceeded the primary drinking-water standard of 15 pCi/L for gross alpha radiation and the primary drinking-water standard of 5 pCi/L for radium-226.
70
Existing streamflow-gaging stations 07126200, Van Bremer Arroyo near Model (site S3) and 07126300, Purgatoire River near Thatcher (site S4) were incorporated into a network of 11 streamflow-gaging stations to monitor streamflow in and around the Maneuver Site. Streamflow in the Purgatoire River is perennial. Snowmelt runoff, intense rainfall, and reservoir releases affect increases in streamflow in the Purgatoire River. The majority of the streamflow from the Maneuver Site results from rainfall runoff during May through October. Tributary streams to the Purgatoire River that drain the Maneuver Site are intermittent or ephemeral. Base streamflow, usually less than 0.50 ft 3 /s, is sustained by ground-water seepage and is typical of the intermittent streams located near the canyon rim of the Purgatoire River. During the 1984 and 1985 water years, streamflow in tributaries was about 3,760 acre-ft, or about 4.4 percent of the streamflow at the Purgatoire River at Rock Crossing, near Timpas (site S10). About 64 percent of the tributary streamflow was derived from Van Bremer Arroyo near Model (site S3) of which 88 percent resulted from irrigation-return flow. The remainder of the tributary streamflow resulted from rainfall runoff and base streamflow sustained by ground-water storage.
Flow-duration analysis of daily mean streamflow was done at Van Bremer Arroyo near Model (site S3) and at Purgatoire River near Thatcher (site S4). On the basis of long-term periods of record, the annual mean streamflow of 2.4 ft 3 /s at site S3 is equaled or exceeded about 4 percent of the time, but daily mean streamflows greater than 0.70 ft 3 /s are quite variable and usually result from rainfall runoff; the annual mean streamflow of 84 ft 3 /s at site S4 is equaled or exceeded about 20 percent of the time, but daily mean stream- flows less than 20 ft 3 /s are quite variable and indicate a limited source of flow from ground-water storage.
Flood estimates for recurrence intervals of 10, 50, and 100 years were made for the two streamflow-gaging stations that have long-term periods of record Van Bremer Arroyo near Model (site S3) and Purgatoire River near Thatcher (site S4). Estimates of flood frequency derived from long-term station records using the log-Pearson III analysis compared well with those obtained using a regional estimating techniques developed by McCain and Jarrett (1976). The regional estimating technique is considered fairly reliable for estimating flood discharges in streams in and near the Maneuver Site that have effective drainage areas greater than 75 mi 2 .
Inflow was measured at 25 stock-watering reservoirs that represent small watersheds that have drainage-basin areas ranging from 0.08 to 1.6 mi 2 . Data collected include inflow, inflow stored, and reservoir spill.
Water-quality data were presented for 7 of the 11 streamflow-gaging sta tions. Samples collected were analyzed for water-quality properties and con stituents used by the Colorado Department of Health to classify the Purgatoire River. Time-series plots indicated that nitrate and metal concentrations exceeded instream water-quality standards. Dissolved solids present in the surface water predominantly are composed of calcium, magnesium, and sulfate ions. Dissolved-solids loads were computed for Van Bremer Arroyo near Model (site S3), the Purgatoire River near Thatcher (site S4), and the Purgatoire River at Rock Crossing, near Timpas (site S10). Dissolved-solids load for the 1985 water year at Van Bremer Arroyo near Model (site S3) was 2,140 tons, or
71
about 2 percent of the dissolved-solids load transported at the Purgatoire River near Thatcher (site S4). Dissolved-solids load for the 1985 water year was 107,000 tons at site S4 and was 106,000 tons at the Purgatoire River at Rock Crossing, near Timpas (site S10). Dissolved-solids load estimated for four ephemeral streams during the 1985 water year was about 48 tons, or about 0.05 percent of the dissolved-solids load transported at the Purgatoire River at Rock Crossing, near Timpas (site S10).
Annual suspended-sediment load was computed at six sites in and near the Maneuver Site. Floods originating from rainfall runoff transport the majority of suspended sediment. During the 1984 and 1985 water years, suspended- sediment loads at tributaries were about 22 and about 3 percent of the suspended-sediment load transported at the Purgatoire River at Rock Crossing, near Timpas (site S10).
Sediment-yield data were collected for 29 small stock-watering reservoirs. The drainage-basin areas of these reservoirs ranged from 0.06 to 1.2 mi 2 and had annual mean sediment yields that ranged from 9.5 to 1,700 tons/mi 2 . Sediment yields were largest from drainage basins that are underlain by shale. A multiple-regression model was developed that predicts sediment yields using physical drainage-basin characteristics. Drainage area, gully length, and drainge-form factor were the drainage-basin characteristics that best predicted annual mean sediment yields.
Sediment yields also were estimated by using the Pacific Southwest Inter-Agency Committee (1968) method in all but one drainage basin where sediment yields were measured. Estimated annual mean sediment yields tended to be larger than measured annual mean sediment yields; this is attributed to the subjectivity of the estimate and the assumption of static, long-term, land-use and climatic conditions within the drainage basin.
REFERENCES CITED
Bass, N.W., 1947, Structure-contour map of the surface rocks of the Modelanticline, Las Animas County, Colorado: U.S. Geological Survey Oil andGas Investigations Preliminary Map 68, scale 1:84,500, 1 sheet.
Coffin, D.L., 1967, Geology and ground-water resources of the Big Sandy CreekValley, Lincoln, Cheyenne, and Kiowa Counties, Colorado: U.S. GeologicalSurvey Water-Supply Paper 1843, 49 p.
Colorado Climate Center, 1984, Colorado average precipitation map 1951-1980:scale 1:500,000.
Colorado Department of Health, 1977, Primary drinking water regulations forthe State of Colorado: Denver, Colorado, 56 p.
___1982, Classifications and numeric standards, Arkansas River Basin:Colorado Department of Health, Water Quality Control Commission, 59 p.
Crouch, T.M., Cain, Doug, Abbott, P.O., Penley, R.D., and Hurr, R.T., 1984,Water-resources appraisal of the upper Arkansas River basin fromLeadville to Pueblo, Colorado: U.S. Geological Survey Water-ResourcesInvestigations Report 82-4114, 123 p.
Culler, R.C., 1961, Hydrology of the upper Cheyenne River basin: U.S.Geological Survey Water-Supply Paper 1531-A, 136 p.
72
Dalryraple, Tate, 1960, Flood frequency analysis: Manual of hydrology, part 3,flood flow techniques: U.S. Geological Survey Water-Supply Paper 1543-A,77 p.
Dalryraple, Tate, and Benson, M.A., 1967, Measurement of peak discharge by theslope-area method: U.S. Geological Survey Techniques of Water-ResourcesInvestigations, bk. 3, chap. A2, 12 p.
Drever, J.I., 1982, The geochemistry of natural waters: Englewood Cliffs, NewJersey, Prentice-Hall, 388 p.
Femlee, J.K., and Cadigan, R.A., 1979, Radium and uranium concentrations andassociated hydrogeochemistry in groundwater in southwestern PuebloCounty, Colorado: U.S. Geological Survey Open-File Report 79-974, 59 p.
Fenneman, N.M., 1931, Physiography of western United States: New York,McGraw-Hill, 534 p.
Gregory, K.T., and Walling, D.E., 1973, Drainage basin form and process: NewYork, John Wiley and Sons, 458 p.
Hadley, R.F., and Shown, L.M., 1976, Relation of erosion to sediment yield:Third Inter-Agency Sedimentation Conference, Denver, 1976, Proceedings,Water Resources Council Sedimentation Committee, p. 1-131-1-139.
Heinemann, H.G., 1981, A new sediment trap efficiency curve for smallreservoirs: Water Resources Bulletin, v. 17, no. 5, p. 825-830.
Heinemann, H.G., and Dvorak, V.I., 1963, Improved volumetric survey andcomputation procedures for small reservoirs: Federal Inter-AgencySedimentation Conference, Denver, 1963, Proceedings, U.S. Department ofAgriculture Miscellaneous Publication no. 970, p. 845-856.
Hem, J.D., 1985, Study and interpretation of the chemical characteristics ofnatural water (3d ed.): U.S. Geological Survey Water-Supply Paper 2254,263 p.
Hutchison, N.E., Compiler, 1975 WATSTORE users guide, volume 1: U.S.Geological Survey Open-File Report 75-426, 708 p.
Johnson, R.B., 1969, Geologic map of the Trinidad quadrangle, south-centralColorado: U.S. Geological Survey Miscellaneous Geologic InvestigationsMap 1-558, scale 1:250,000, 1 sheet.
Langbien, W.B., and Schumm, S.A., 1958, Yield of sediment in relation to meanannual precipitation: American Geophysical Union Transactions, v. 39,p. 1076-1084.
Leonard, G.J., 1984, Assessment of water resources at Fort Carson MilitaryReservation near Colorado Springs, Colorado: U.S. Geological SurveyWater-Resources Investigations Report 83-4270, 78 p.
Livingston, R.K., 1981, Rainfall runoff modeling and preliminary regionalflood characteristics of small rural watersheds in the Arkansas Riverbasin in Colorado: U.S. Geological Survey Water-Resources InvestigationsReport 80-112, 40 p.
Livingston, R.K., Klein, J.M., and Bingham, D.L., 1976, Appraisals of waterresources of southeastern El Paso County, Colorado: Denver, Colorado,Water Conservation Board, Colorado Water Resources Circular No. 33, 66 p.
Livingston, R.K., and Minges, D.R., 1987, Techniques for estimating regionalflood characteristics of small rural watersheds in the plains region ofeastern Colorado: U.S. Geological Survey Water-Resources InvestigationsReport 87-4904, 72 p.
Lusby, G.C., 1970, Hydrologic and biotic effects of grazing versus nongrazingnear Grand Junction, Colorado: U.S. Geological Survey Research 1970,p. B232-B236.
73
Mark, Anson, and Requist, Norris, 1969, First day's road log--Trinidad toWalsenburg and return to Trinidad Mesozoic and Tertiary of the eastflank of the Raton Basin, in the Mountain Geologist: Denver, RockyMountain Association of Geologists, v. 6, no. 3, p. 149-164.
McCain, J.F., and Jarrett, R.D., 1976, Manual for estimating flood character istics of natural-flow streams in Colorado: Colorado Water ConservationBoard Technical Manual No. 1, 68 p.
McLaughlin, T.G., 1954, Geology and ground-water resources of Baca County,Colorado: U.S. Geological Survey Water-Supply Paper 1256, 232 p.
___1966, Ground water in Huerfano County, Colorado: U.S. Geological SurveyWater-Supply Paper 180S, 91 p.
Miller, D.M., 1984, Reducing transformation bias in curve fitting: TheAmerican Statistician, v. 38, no. 2, p. 124-126.
Miller, J.F., Frederick, R.H., and Tracey, R.J., 1973, Precipitation-frequencyatlas of the western United States, v. Ill, Colorado: National Oceanicand atmospheric Administration, 67 p.
National Academy of Sciences, National Academy of Engineering, 1972 (1973),Water quality criteria, 1972: Washington, B.C., U.S. Government PrintingOffice, 594 p.
Pacific Southwest Inter-Agency Committee, 1968, Report on factors affectingsediment yield in the Pacific Southwest area: Water ManagementSubcommittee, Sedimentation Task Force, 10 p.
Porterfield, George, 1972, Computation of fluvial sediment discharge: U.S.Geological Survey Techniques of Water-Resources Investigations, bk. 3,chap. C3, 66 p.
Robson, S.G. and Banta, E.R., 1987, Geology and hydrology of the deep bedrockaquifers in eastern Colorado: U.S. Geological Survey Water-ResourcesInvestigations Report 85-4240, scale 1:500,000, 6 sheets.
Schumm, S.A., 1977, The fluvial system: New York, John Wiley and Sons, 335 p. Scott, G.R., 1968, Geologic and structure contour map of the La Junta
quadrangle, Colorado and Kansas: U.S. Geological Survey MiscellaneousGeologic Investigations Map 1-560, scale 1:250,000, 1 sheet.
Searcy, J.K., 1959, Flow-duration curves: U.S. Geological Survey Water-SupplyPaper 1542-A, 33 p.
Shown, L.M., 1970, Evaluation of a method for estimating sediment yield inGeological Survey Research 1970: U.S. Geological Survey ProfessionalPaper 700-B, p. B245-B249.
Snipes, R.J., and others, 1974, Floods of June 1965 in Arkansas River basin,Colorado, Kansas, and New Mexico: U.S. Geological Survey Water-SupplyPaper 1850-D, 94 p.
Statistical Analysis System Institute, 1985, SAS users guide Statistics(5th ed.): Gary, North Carolina, SAS Institute, Inc., 956 p.
Thatcher, L.L., Janzer, V.J., and Edwards, K.W., 1977, Methods for determina tion of radioactive substances in water and fluvial sediments: U.S.Geological Survey Techniques of Water-Resources Investigations, bk. 5,chap. A5, 95 p.
U.S. Army Corps of Engineers, 1981, Final environmental impact statement fortraining land acquisition, Fort Carson, Colorado: Omaha, Nebraska, 280 p.
U.S. Department of the Interior, 1970, The national atlas of the United Statesof America: U.S. Geological Survey, 417 p.
74
U.S. Environmental Protection Agency, 1976, Quality criteria for water: Washington, B.C., U.S. Government Printing Office, 256 p.
_____1986a, Maximum contaminant levels (subpart B of part 141, national interim primary drinking-water regulations): U.S. Code of Federal Regulations, Title 40, Parts 100 to 149, revised as of July 1, 1986, p. 524-528.
____1986b, Secondary maximum contaminant levels (section 143.3 of part 143, national secondary drinking-water regulations): U.S. Code of Federal Regulations, Title 40, Parts 100 to 149, revised as of July 1, 1986, p. 587-590.
U.S. Soil Conservation Service, 1983, Soils manuscript for the Pinon Canyon Maneuver Site: Trinidad, Colo., U.S. Department of Agriculture, unpublished, 157 p.
Vanoni, V.A., 1975, Sedimentation Engineering: New York, American Society of Civil Engineers, 745 p.
Voegeli, P.T., Sr., and Hershey, L.A., 1965, Geology and ground-waterresources of Prowers County, Colorado: U.S. Geological Survey Water- Supply Paper 1772, 101 p.
Weist, W.G., Jr., and others, 1965, Geology and occurrence of ground water in . Otero County and the southern part of Crowley County, Colorado: U.S. Geological Survey Water-Supply Paper 1799, 90 p.
Wilson, W.W., 1965, Pumping tests in Colorado: Denver, Colorado WaterConservation Board, Colorado Water Resources Circular No. 11, 361 p.
Wood, W.W., 1976, Guidelines for collection and field analysis of ground-water samples for selected unstable constituents: U.S. Geological Survey Techniques of Water-Resources Investigations, bk. 1, chap. D2, 24 p.
75

SUPPLEMENTAL INFORMATION
77
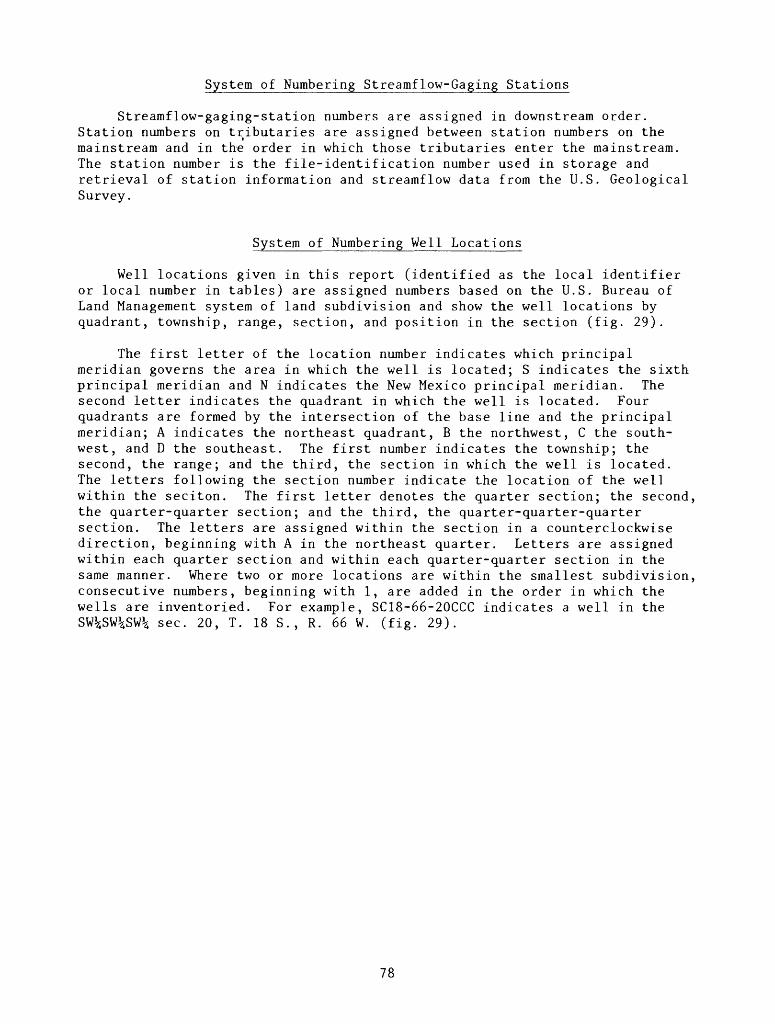
System of Numbering Streamflow-Gaging Stations
Streamflow-gaging-station numbers are assigned in downstream order. Station numbers on tributaries are assigned between station numbers on the mainstream and in the order in which those tributaries enter the mainstream. The station number is the file-identification number used in storage and retrieval of station information and Streamflow data from the U.S. Geological Survey.
System of Numbering Well Locations
Well locations given in this report (identified as the local identifier or local number in tables) are assigned numbers based on the U.S. Bureau of Land Management system of land subdivision and show the well locations by quadrant, township, range, section, and position in the section (fig. 29).
The first letter of the location number indicates which principal meridian governs the area in which the well is located; S indicates the sixth principal meridian and N indicates the New Mexico principal meridian. The second letter indicates the quadrant in which the well is located. Four quadrants are formed by the intersection of the base line and the principal meridian; A indicates the northeast quadrant, B the northwest, C the south west, and D the southeast. The first number indicates the township; the second, the range; and the third, the section in which the well is located. The letters following the section number indicate the location of the well within the seciton. The first letter denotes the quarter section; the second, the quarter-quarter section; and the third, the quarter-quarter-quarter section. The letters are assigned within the section in a counterclockwise direction, beginning with A in the northeast quarter. Letters are assigned within each quarter section and within each quarter-quarter section in the same manner. Where two or more locations are within the smallest subdivision, consecutive numbers, beginning with 1, are added in the order in which the wells are inventoried. For example, SC18-66-20CCC indicates a well in the
sec. 20, T. 18 S., R. 66 W. (fig. 29).
78
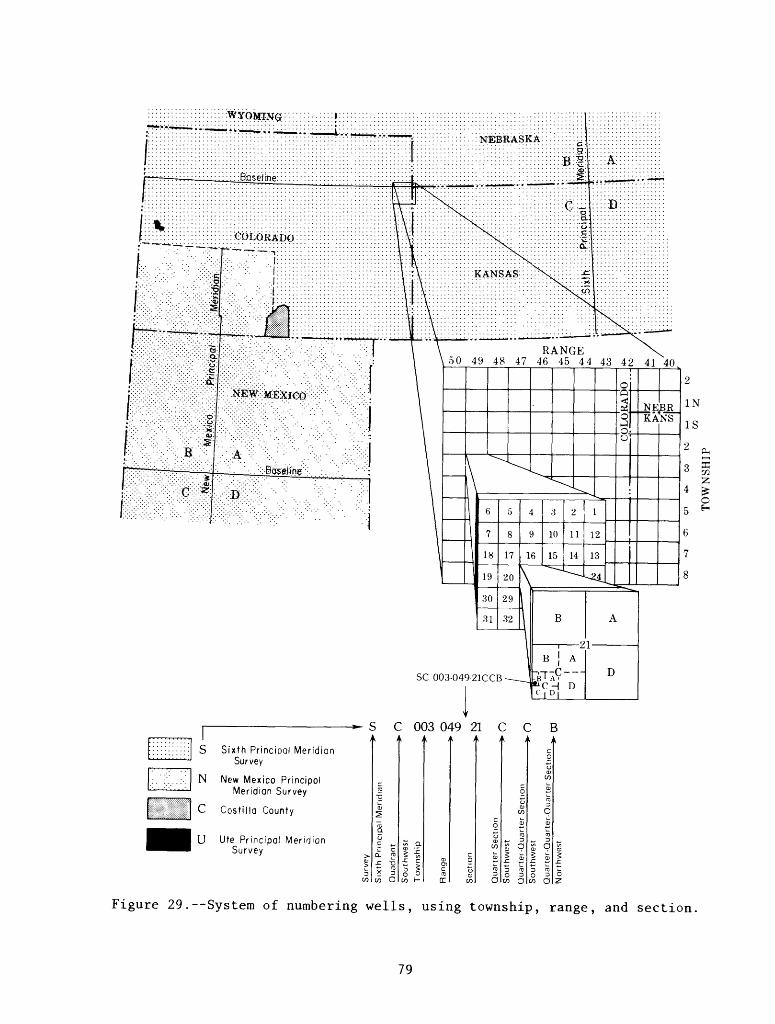
WYOMING;;NEBRASKA:
RANGE50 49 48 47 46 45 44 43
S C 003 049 21 C C
S Sixth Principal Meridian Survey
New Mexico Principal Meridian Survey
Costilla County
U Ute Principal Meridian Survey
in a
S ir,
in O
Figure 29.--System of numbering wells, using township, range, and section
79
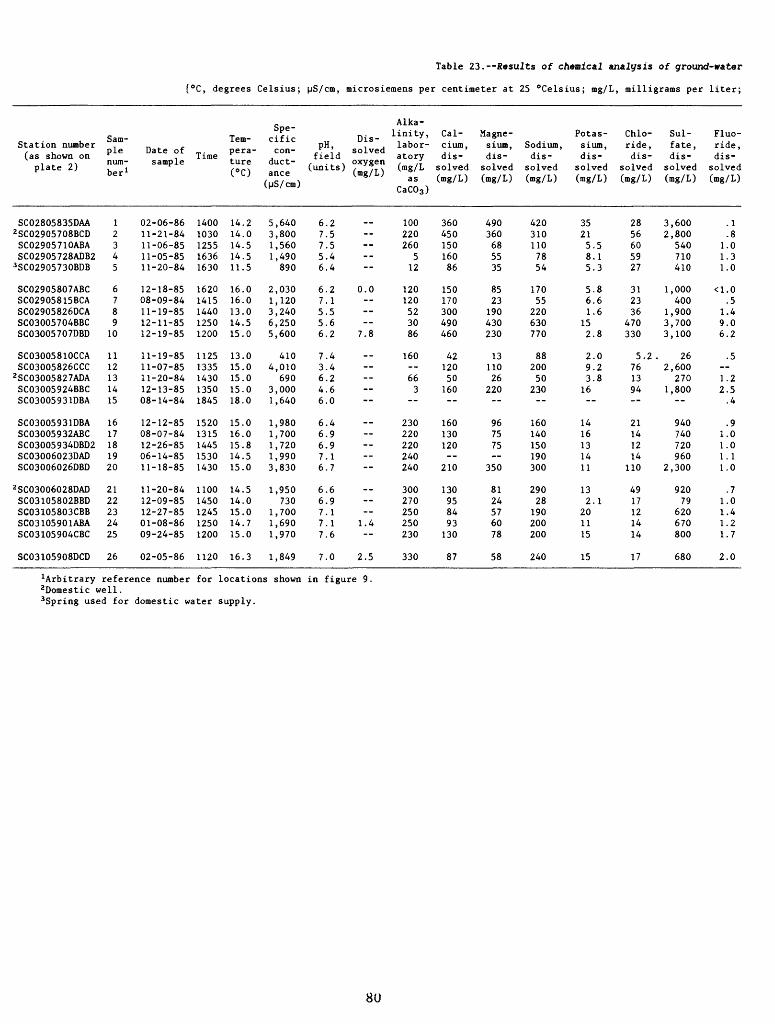
Table 23.--Resuits of chemical analysis of ground-water
'C, degrees Celsius; |jS/cm, microsiemens per centimeter at 25 "Celsius; mg/L, milligrams per liter;
Station number (as shown on plate 2)
SC02805835DAA2 SC02905708BCDSC02905710ABASC02905728ADB2
3SC02905730BDB
SC02905807ABCSC02905815BCASC02905826DCASC03005704BBCSC03005707DBD
SC03005810CCASC03005826CCC
2SC03005827ADASC03005924BBCSC03005931DBA
SC03005931DBASC03005932ABCSC03005934DBD2SC03006023DADSC03006026DBD
2 SC03006028DADSC03105802BBDSC03105803CBBSC03 10590 1ABASC03105904CBC
SC03105908DCD
Sam-pie num ber 1
12345
6789
10
1112131415
1617181920
2122232425
26
Date of sample
02-06-8611-21-8411-06-8511-05-8511-20-84
12-18-8508-09-8411-19-8512-11-8512-19-85
11-19-8511-07-8511-20-8412-13-8508-14-84
12-12-8508-07-8412-26-8506-14-8511-18-85
11-20-8412-09-8512-27-8501-08-8609-24-85
02-05-86
Time
14001030125516361630
16201415144012501200
11251335143013501845
15201315144515301430
11001450124512501200
1120
Tempera ture (°C)
14.214.014.514.511.5
16.016.013.014.515.0
13.015.015.015.018.0
15.016.015.814.515.0
14.514.015.014.715.0
16.3
Spe cificcon
duct ance (|jS/cm)
5,6403,8001,5601,490890
2,0301,1203,2406,2505,600
4104,010
6903,0001,640
1,9801,7001,7201,9903,830
1,950730
1,7001,6901,970
1,849
Dis-pH, I" .
... ' solved field , . . , oxygen (units) , , T * (mg/L)
6.27.57.55.46.4
6.2 0.07.15.55.66.2 7.8
7.43.46.24.66.0
6.46.96.97.16.7
6.66.97.17.1 1.47.6
7.0 2.5
Alka linity,labor atory (mg/L
as CaC03 )
100220260
512
120120523086
160 663
230220220240240
300270250250230
330
Calcium, dis
solved (mg/L)
36045015016086
150170300490460
4212050160--
160130120--
210
130958493130
87
Magnesium, dis solved (mg/L)
490360685535
8523190430230
1311026
220--
967575--
350
8124576078
58
Sodium, dis
solved (mg/L)
4203101107854
17055
220630770
8820050
230--
160140150190300
29028190200200
240
Potassium, dis
solved (mg/L)
35215.58.15.3
5.86.61.6
152.8
2.09.23.8
16--
1416131411
132.1
201115
15
Chloride, dis
solved (mg/L)
2856605927
312336
470330
5.2 .761394
21141214
110
4917121414
17
Sul-fate, dis
solved (mg/L)
3,6002,800
540710410
1,000400
1,9003,7003,100
262,600
2701,800
--
940740720960
2,300
92079
620670800
680
Fluo-ride, dis solved (mg/L)
.1
.81.01.31.0
<1.0.5
1.49.06.2
.5 1.22.5.4
.91.01.01.11.0
.71.01.41.21.7
2.0
Arbitrary reference number for locations shown in figure 9.2Domestic well.3Spring used for domestic water supply.
8U
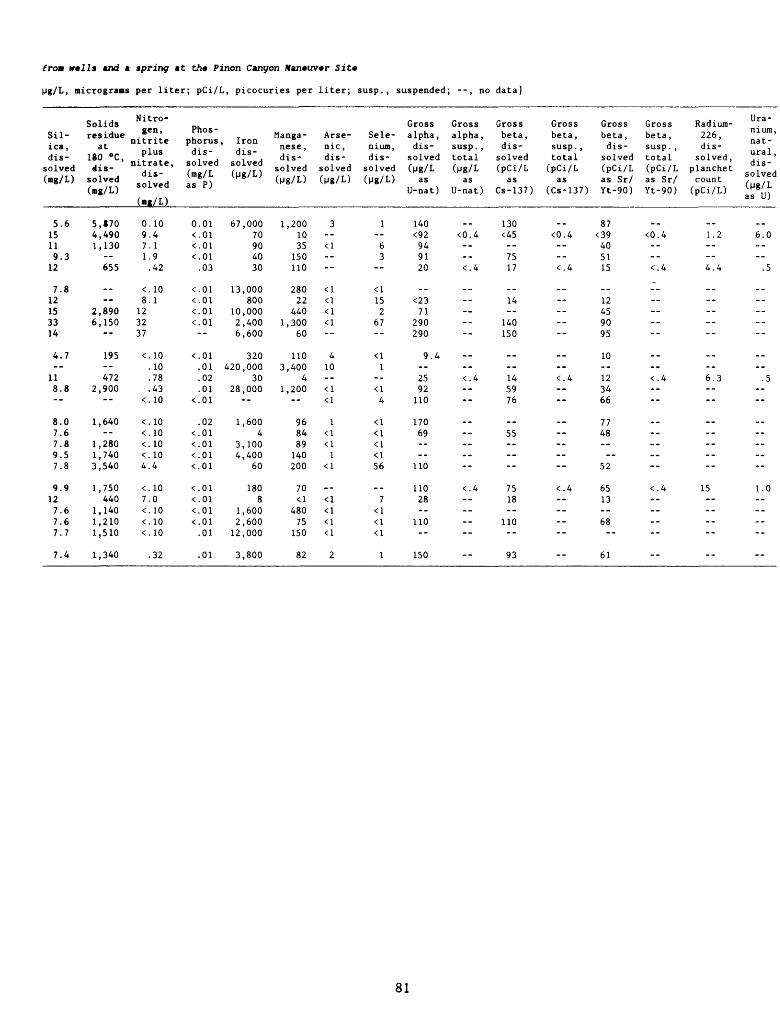
from w*ll3 and a spring at th« Pinon Canyon Maneuver Sit*
Mg/L, micrograns per liter; pCi/L, picocuries per liter; susp., suspended; --, no data]
Sil ica, dis solved (mg/L)
5.615119.3
12
7.812153314
4.7--
118.8--
8.07.67.89.57.8
9.9127.67.67.7
7.4
Solidsresidue
at 180 °C, dis solved (mg/L)
5,*704,4901,130
--655
..--
2,8906,150
--
195--472
2,900
1,640--
1,2801,7403,540
1,750440
1,1401,2101,510
1,340
Nitrogen,
nitrite plus
nitrate, dis solved
(mg/L)
0.109.47.11.9.42
<.108.1
123237
<.10.10.78.43
<.10
<.10< . 10<. 10<. 104.4
<.107.0<. 10<. 10<.10
.32
Phos phorus dis solved (mg/L as P)
0.01<.01<.01<.01.03
<.01 c.Ol c.Ol<.01--
<.01.01.02.01
<.01
.02< .01<.01<.01<.01
<.01<.01<.01<.01.01
.01
, Iron dis
solved
67,00070904030
13,000800
10,0002,4006,600
320420,000
3028,000
--
1,6004
3,1004,400
60
1808
1,6002,60012,000
3,800
Manga- Arse- nese, nic, dis- dis solved solved (Mg/L) (Mg/L)
1,200 31035 <1
150 --110
280 <122 <1
440 <11,300 <1
60
110 43,400 10
41,200 <1
<1
96 184 <189 <1140 1200 <1
70<1 <1
480 <175 <1
150 <1
82 2
Sele nium, dis solved (Mg/L)
1--63
--
<!152
67--
<!1
--
<14
<!<1<1<156
..
7<1<1<!
1
Gross Grossalpha, alpha, dis- susp. , solved total (Mg/L (Mg/L
as as U-nat) U-nat)
140<92 <0.4949120 <.4
..<2371
290290
9.4..
25 <.492110
17069....
110
110 <.428..
110--
150
Grossbeta, dis
solved (pCi/L
as Cs-137)
130<45--
7517
..
14--
140150
..--
145976
..
55------
7518--
110--
93
Gross Gross Grossbeta, beta, beta, susp. , dis- susp . , total solved total (pCi/L (pCi/L (pCi/L
as as Sr/ as Sr/ (Cs-137) Yt-90) Yt-90)
87<0.4 <39 <0.4
4051
<.4 15 <.4
..
12459095
10..
<.4 12 <.43466
7748
..
..
52
<.4 65 <-413
..
68--
61
Radium-226, dis
solved , planchet count (pCi/L)
..1.2----4.4
..--------
__--6.3----
--------
15--------
--
Uranium, nat ural , dis
solved (Mg/L as U)
..6.0----.5
..--------
..--.5
----
--------
1.0--------
--
81
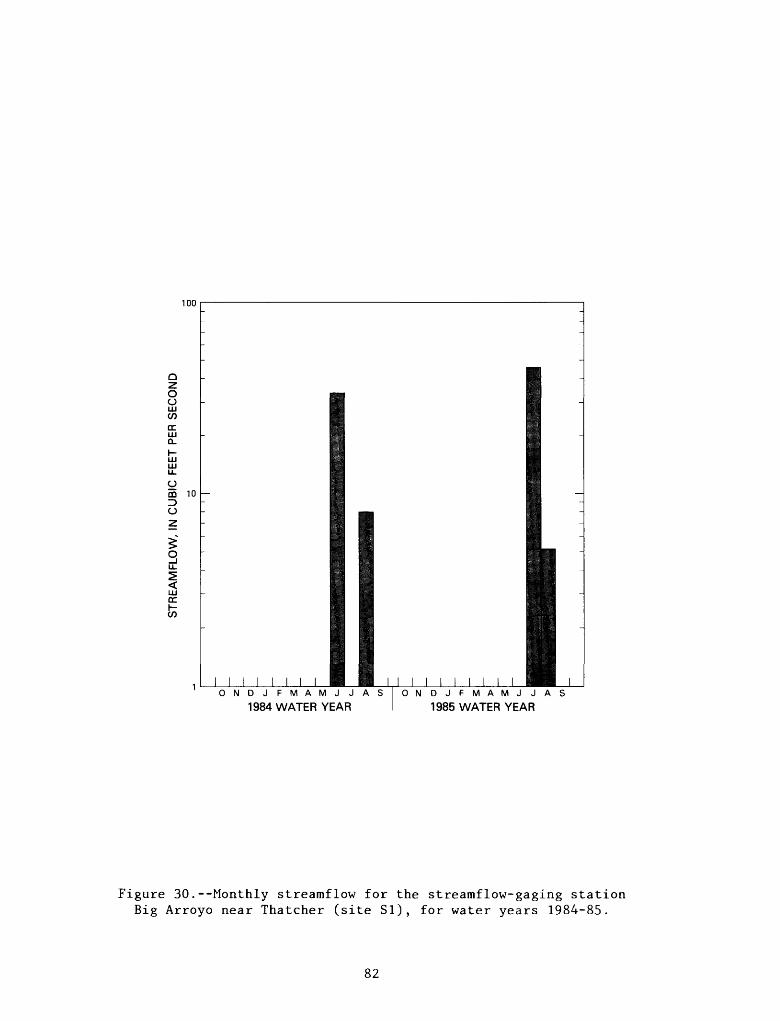
100
oCJLLJco <rLU CL
oDQ 10ID CJ
UJccCO
ONDJFMAMJJAS
1984 WATER YEARONDJFMAMJJAS
1985 WATER YEAR
Figure 30.--Monthly streamflow for the streamflow-gaging station Big Arroyo near Thatcher (site SI), for water years 1984-85.
82
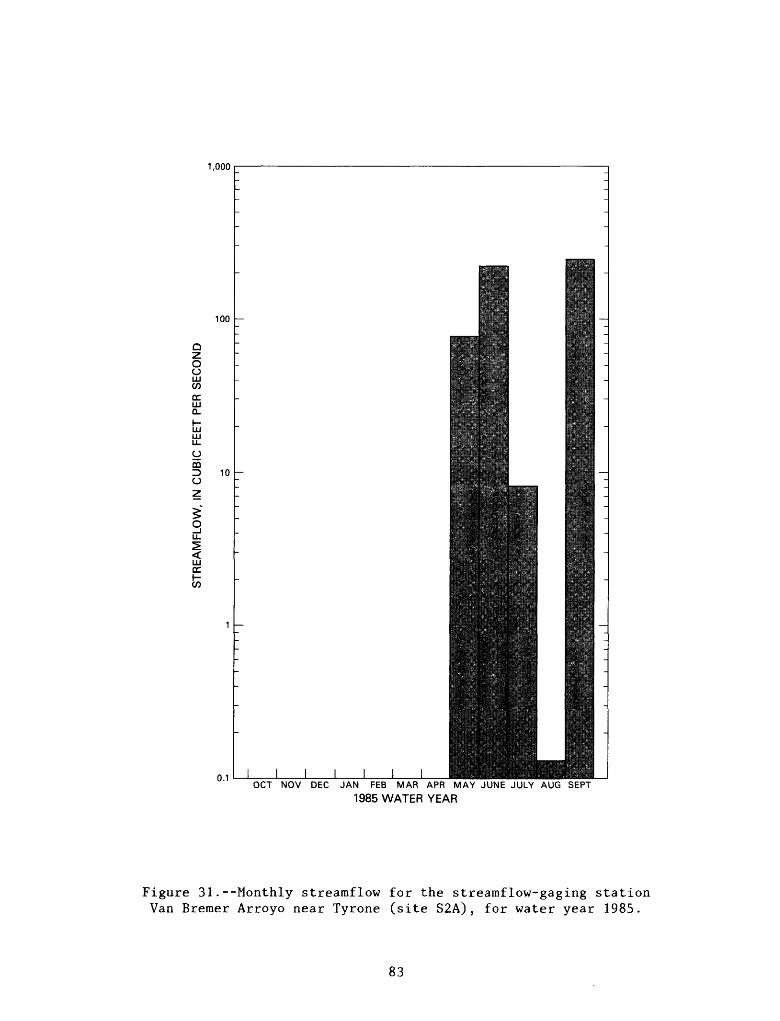
1,000
oCJUJ(/) cc.UJ Q.
omID CJ
O
cc.
OCT NOV DEC JAN FEB MAR APR MAY JUNE JULY AUG SEPT
1985 WATER YEAR
Figure 31.--Monthly streamflow for the streamflow-gaging station Van Bremer Arroyo near Tyrone (site S2A), for water year 1985.
83
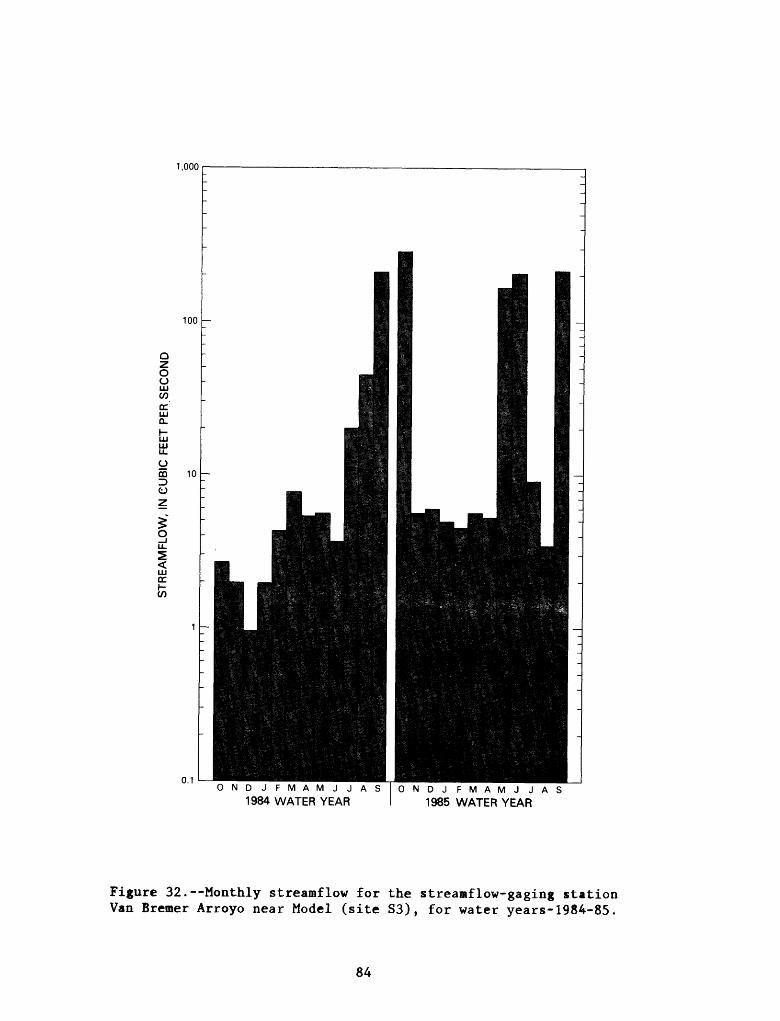
1,000
100
o oLUCOOL LU Q.
OmID o
3LL.
<LUcc.CO
ONDJFMAMJJAS
1984 WATER YEARONDJFMAMJJAS
1985 WATER YEAR
Figure 32. Monthly streamflow for the streamflow-gaging station Van Bremer Arroyo near Model (site S3), for water years-1984-85.
84
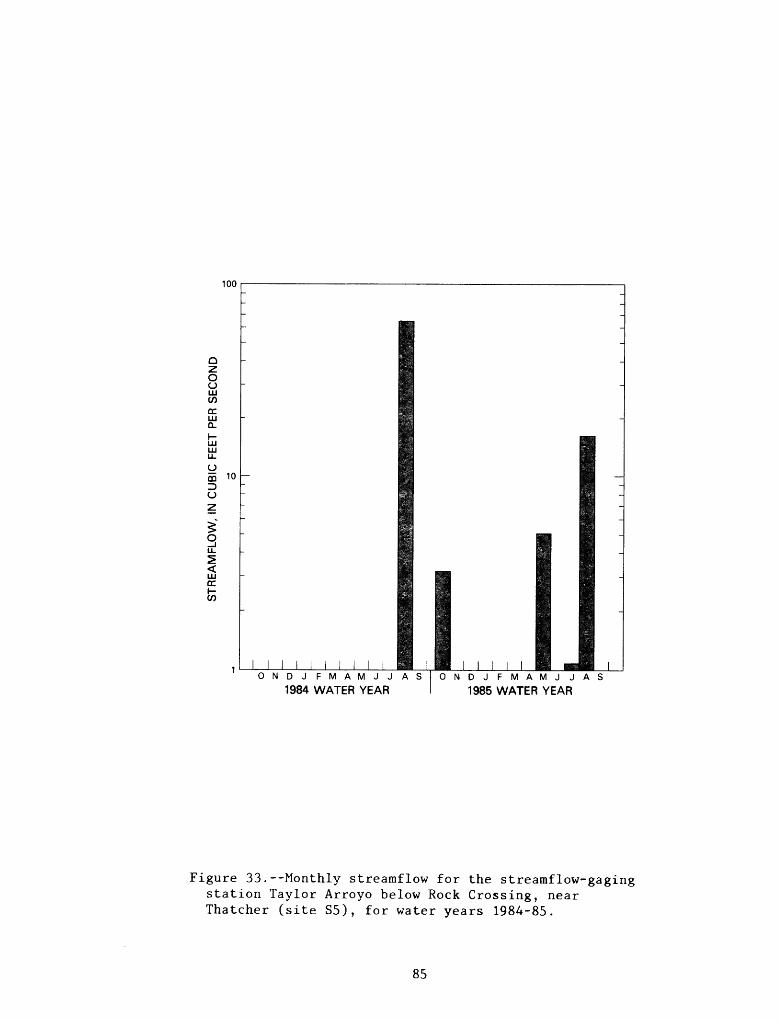
100
oCJUJcn crUJa.UJ LUu. y OQD CJz
gu.
UJcrt/)
ONDJFMAMJJAS
1984 WATER YEARONDJFMAMJJAS
1985 WATER YEAR
Figure 33.--Monthly streamflow for the streamflow-gaging station Taylor Arroyo below Rock Crossing, near Thatcher (site S5), for water years 1984-85.
85
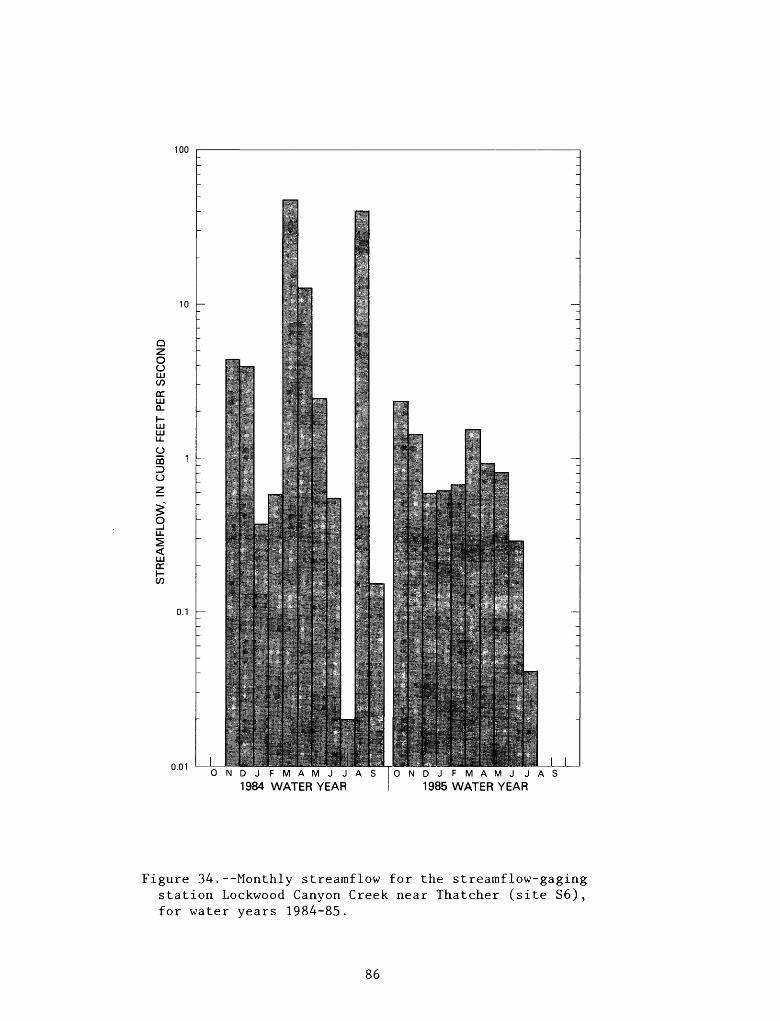
100
o oLUC/3cr LUQ_
o mD CJ
O
CC.
C/3
0.01ONDJFMAMJJAS
1984 WATER YEARONDJ FMAMJ JAS
1985 WATER YEAR
Figure 34.--Monthly streamflow for the streamflow-gaging station Lockwood Canyon Creek near Thatcher (site S6), for water years 1984-85.
86
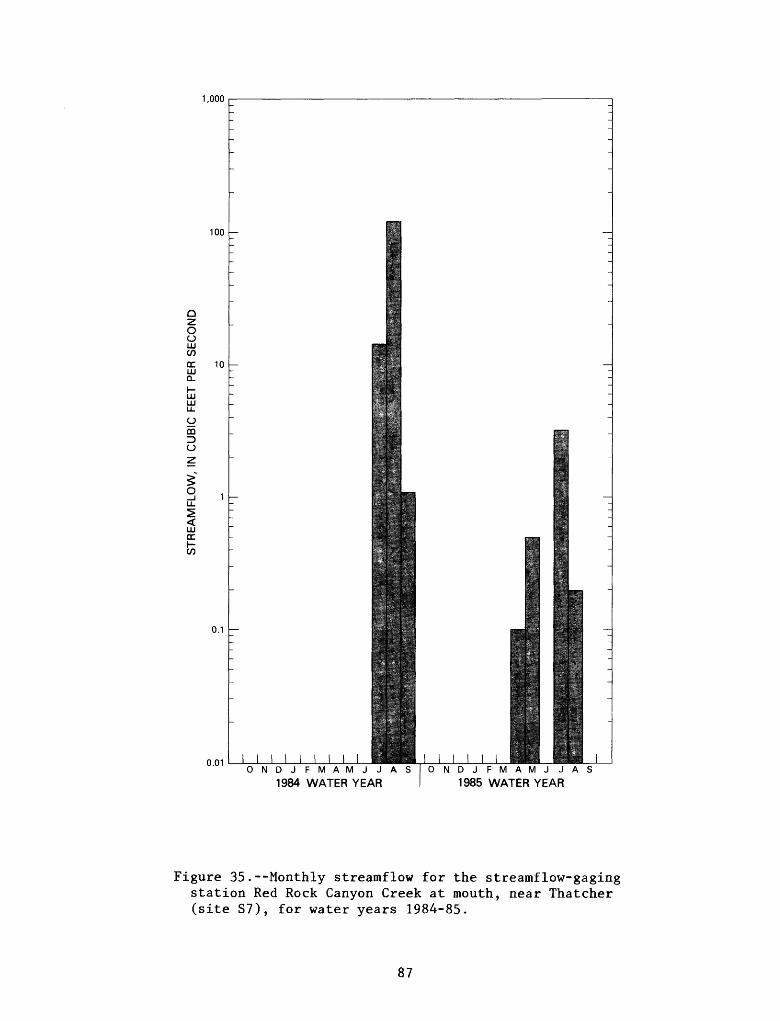
1,000
100
o uUJ
QC UJa.UJ UJ U_
yCOID U
10
cc
0.1
0.01ONDJFMAMJJAS
1984 WATER YEARONDJFMAMJJAS
1985 WATER YEAR
Figure 35.--Monthly streamflow for the streamflow-gaging station Red Rock Canyon Creek at mouth, near Thatcher (site S7), for water years 1984-85.
87
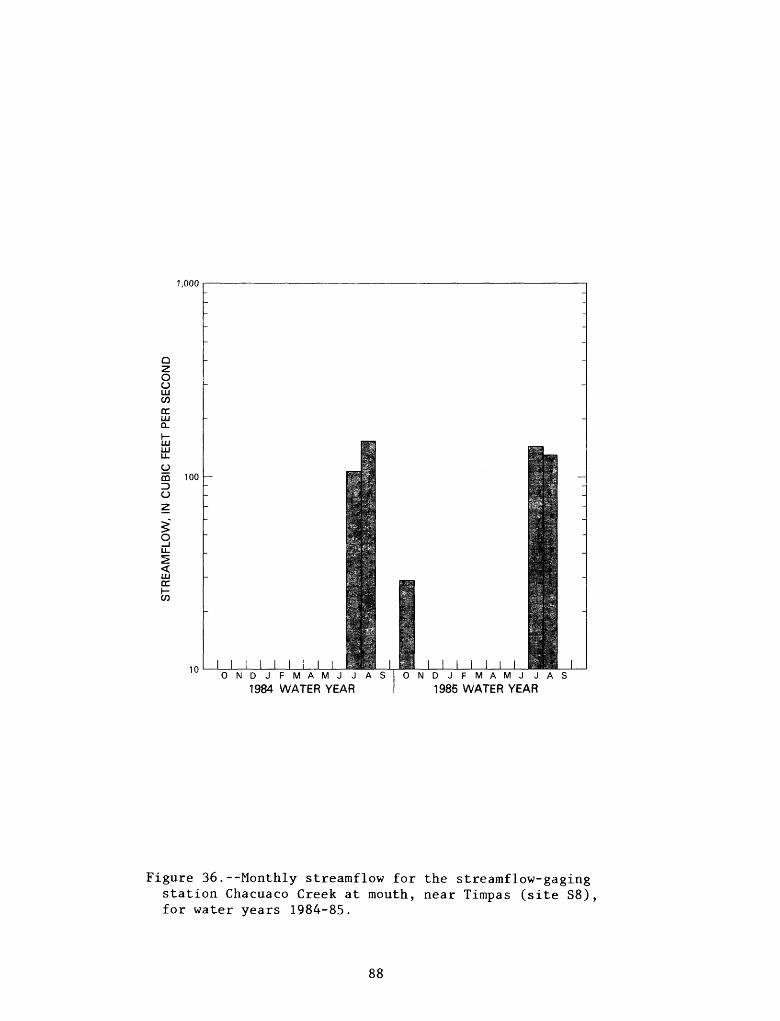
1,000
o oLJLJwDC UJ Q_
UJ UJ
oCDD O
100
UJ DC
10ONDJFMAMJJAS
1984 WATER YEARONDJFMAMJJAS
1985 WATER YEAR
Figure 36.--Monthly streamflow for the streamflow-gaging station Chacuaco Creek at mouth, near Timpas (site S8), for water years 1984-85.
88
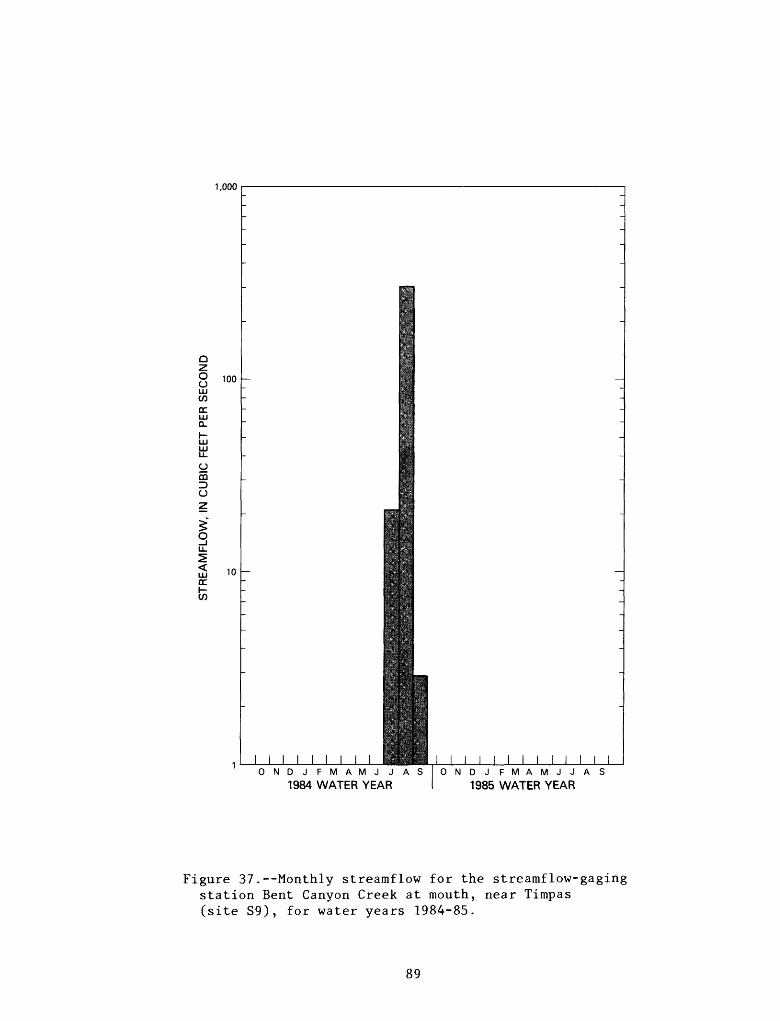
1,000
o oULICOccLJLJ CL
O
CDD O
O
LJLJ CC
100
10
I INDJFMAMJJ
1984 WATER YEARONDJ FMAMJJAS
1985 WATER YEAR
Figure 37.--Monthly streamflow for the streamflow-gaging station Bent Canyon Creek at mouth, near Timpas (site S9), for water years 1984-85.
89
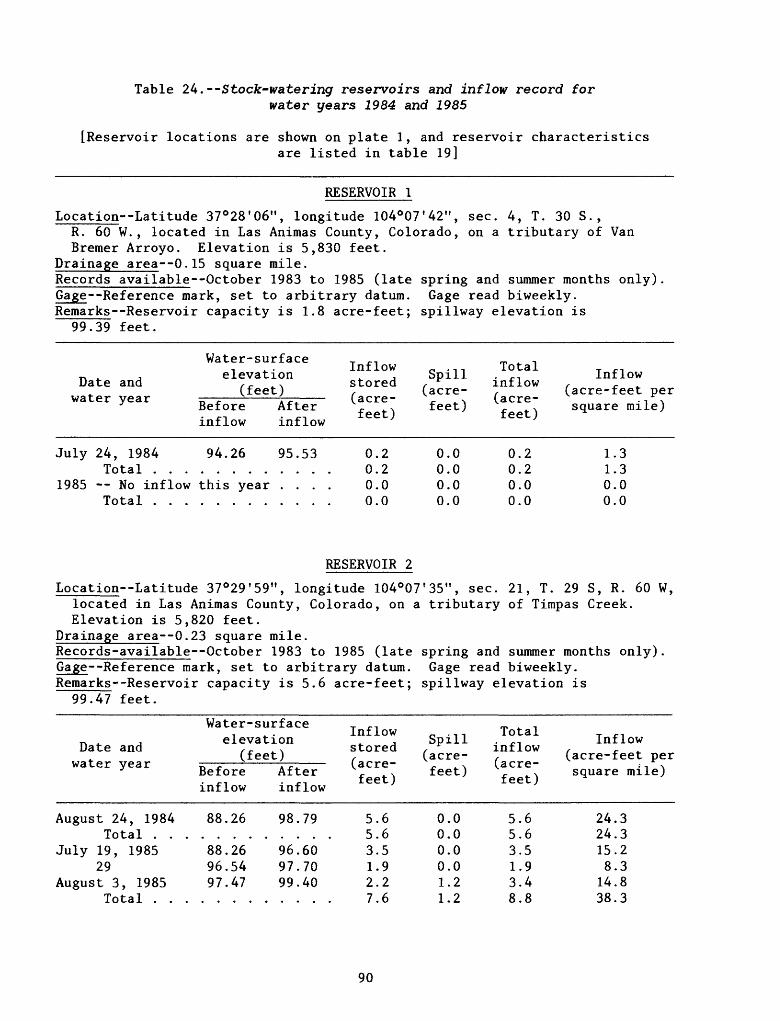
Table 24.--Stock-watering reservoirs and inflow record for water years 1984 and 1985
[Reservoir locations are shown on plate 1, and reservoir characteristicsare listed in table 19]
RESERVOIR 1
Location Latitude 37°28'06", longitude 104°07'42", sec. 4, T. 30 S., R. 60 W., located in Las Animas County, Colorado, on a tributary of Van Bremer Arroyo. Elevation is 5,830 feet.
Drainage area--0.15 square mile.Records available October 1983 to 1985 (late spring and summer months only).Gage--Reference mark, set to arbitrary datum. Gage read biweekly.Remarks--Reservoir capacity is 1.8 acre-feet; spillway elevation is
99.39 feet.
Date and water year
July
1985
24, 1984 Total . . .
-- No inflow Total . . .
Water-surface elevation
(feet)Before inflow
94.26
this year
After inflow
95.53
....
Inflow stored (acre- feet)
0 0 0 0
.2
.2
.0
.0
Spill (acre- feet)
0 0 0 0
.0
.0
.0
.0
Total inflow (acre- feet)
0. 0. 0. 0.
2 2 0 0
Inflow (acre-feet per square mile)
1. 1. 0. 0.
3 3 0 0
RESERVOIR 2
Location Latitude 37°29'59", longitude 104°07'35", sec. 21, T. 29 S, R. 60 W, located in Las Animas County, Colorado, on a tributary of Timpas Creek. Elevation is 5,820 feet.
Drainage area--0.23 square mile.Records-available October 1983 to 1985 (late spring and summer months only).Gage--Reference mark, set to arbitrary datum. Gage read biweekly.Remarks--Reservoir capacity is 5.6 acre-feet; spillway elevation is
99.47 feet.
Date and water year
August 24, 1984 Total . . ,
July 19, 1985 29
August 3, 1985 Total . .
Water-surface elevation
(feet)Before inflow
88.26
88.26 96.54 97.47
After inflow
98.79
96.60 97.70 99.40
Inflow stored (acre- feet)
5.6 5.6 3.5 1.9 2.2 7.6
Spill (acre- feet)
0.0 0.0 0.0 0.0 1.2 1.2
Total inflow (acre- feet)
5.6 5.6 3.5 1.9 3.4 8.8
Inflow (acre-feet per square mile)
24.3 24.3 15.2 8.3 14.8 38.3
90
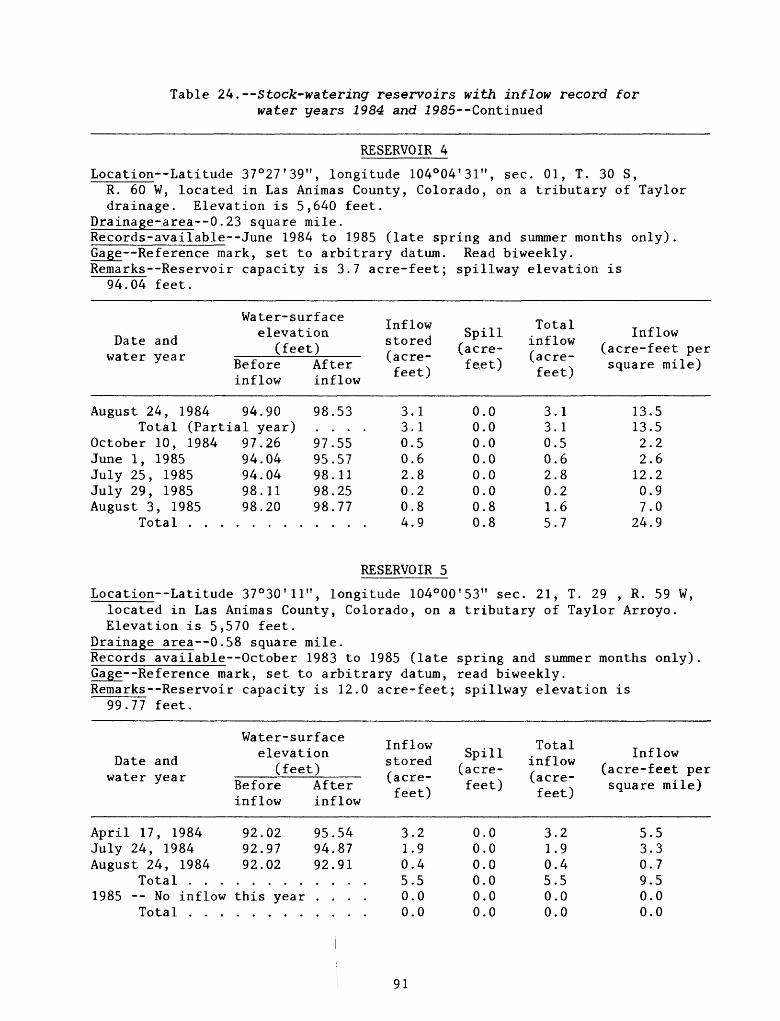
Table 24. --Stock-watering reservoirs with inflow record for water years 1984 and I985--Continued
RESERVOIR 4
Location Latitude 37°27'39", longitude 104°04 f 31", sec. 01, T. 30 S,R. 60 W, located in Las Animas County, Colorado, on a tributary of Taylor drainage. Elevation is 5,640 feet.
Drainage-area--0.23 square mile.Records-available--June 1984 to 1985 (late spring and summer months only).Gage--Reference mark, set to arbitrary datum. Read biweekly.Remarks--Reservoir capacity is 3.7 acre-feet; spillway elevation is
94.04 feet.
Date and water year
August 24, 1984
Water-surface elevation
(feet)Before inflow
94.90
After inflow
98.53Total (Partial year) ....
October 10, 1984June 1, 1985July 25, 1985July 29, 1985August 3, 1985
Total . . .
97.2694.0494.0498.1198.20
97.5595.5798.1198.2598.77
Inflow stored (acre- feet)
3.13.10.50.62.80.20.84.9
Spill (acre- fe^et)
0.00.00.00.00.00.00.80.8
Total inflow (acre- feet)
3.13.10.50.62.80.21.65.7
Inflow (acre-feet per square mile)
13.513.52.22.612.20.97.0
24.9
RESERVOIR 5
Location Latitude 37°30 f ll", longitude 104°00 t 53" sec. 21, T. 29 , R. 59 W, located in Las Animas County, Colorado, on a tributary of Taylor Arroyo. Elevation is 5,570 feet.
Drainage area--0.58 square mile.Records available October 1983 to 1985 (late spring and summer months only).Gage--Reference mark, set to arbitrary datum, read biweekly.Remarks--Reservoir capacity is 12.0 acre-feet; spillway elevation is
99.77 feet.
Date and water year
April 17, 1984 July 24, 1984 August 24, 1984
Total . . .1985 -- No inflow
Total . . .
Water-surface elevation
(feet)Before inflow
92.02 92.97 92.02
this year
After inflow
95.54 94.87 92.91
....
Inflow stored (acre- feet)
3.2 1.9 0.4 5.5 0.0 0.0
Spill (acre- feet)
0.0 0.0 0.0 0.0 0.0 0.0
Total inflow (acre- feet)
3.2 1.9 0.4 5.5 0.0 0.0
Inflow (acre-feet per square mile)
5.5 3.3 0.7 9.5 0.0 0.0
91
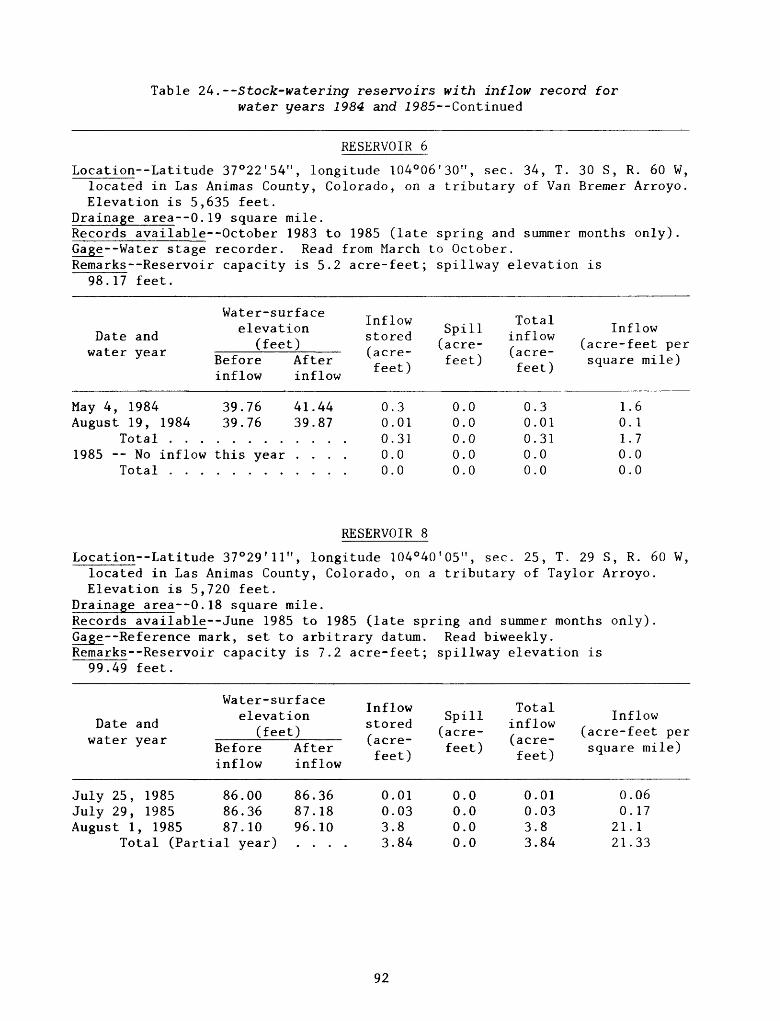
Table 2^.--Stock-watering reservoirs with inflow record for water years 1984 and 1985 Continued
RESERVOIR 6
Location Latitude 37°22'54", longitude 104°06'30", sec. 34, T. 30 S, R. 60 W, located in Las Animas County, Colorado, on a tributary of Van Bremer Arroyo. Elevation is 5,635 feet.
Drainage area--0.19 square mile.Records available October 1983 to 1985 (late spring and summer months only).Gage Water stage recorder. Read from March to October.Remarks--Reservoir capacity is 5.2 acre-feet; spillway elevation is
98.17 feet.
Date and water year
May 4, August
1985 -
1984 19, 1984
Total . . .- No inflow Total . . .
Water-surface elevation
(feet)Before inflow
39.76 39.76
this year
After inflow
41.44 39.87
....
Inflow stored (acre-
feet)
0. 0. 0. 0. 0.
3 01 31 0 0
Spill (acre-
feet)
0 0 0 0 0
.0
.0
.0
.0
.0
Total inflow (acre-
feet)
0 0 0 0 0
.3
.01
.31
.0
.0
Inflow (acre-feet per square mile)
1.0. 1. 0. 0.
6 1 7 0 0
RESERVOIR 8
Location Latitude 37 0 29'11", longitude 104°40'05", sec. 25, T. 29 S, R. 60 W, located in Las Animas County, Colorado, on a tributary of Taylor Arroyo. Elevation is 5,720 feet.
Drainage area 0.18 square mile.Records available June 1985 to 1985 (late spring and summer months only).Gage--Reference mark, set to arbitrary datum. Read biweekly.Remarks--Reservoir capacity is 7.2 acre-feet; spillway elevation is
99.49 feet.
Date and water year
July 25,July 29,August 1
19851985
, 1985
Water-surface elevation
(feet)Before inflow
86.0086.3687.10
After inflow
86.3687.1896.10
Total (Partial year) ....
Inflow stored (acre-
feet)
0033
.01
.03
.8
.84
Spill (acre-
feet)
0000
.0
.0
.0
.0
Total inflow (acre-
feet)
0033
.01
.03
.8
.84
Inflow (acre-feet per square mile)
0.0.
21.21.
0617133
92
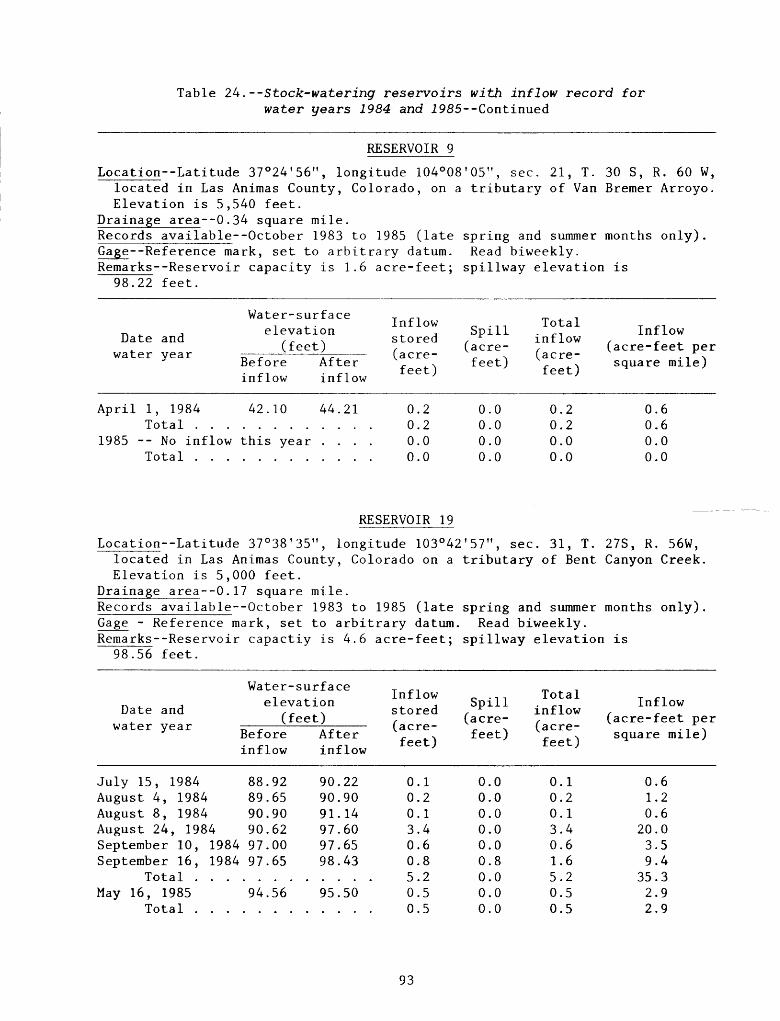
Table 24. --Stock-watering reservoirs with inflow record for water years 1984 and 1985--Continued
RESERVOIR 9
Location Latitude 37°24'56", longitude 104°08'05", sec. 21, T. 30 S, R. 60 W, located in Las Animas County, Colorado, on a tributary of Van Bremer Arroyo. Elevation is 5,540 feet.
Drainage area--0.34 square mile.Records available October 1983 to 1985 (late spring and summer months only).Gage--Reference mark, set to arbitrary datum. Read biweekly.Remarks--Reservoir capacity is 1.6 acre-feet; spillway elevation is
98.22 feet.
Date and water year
April
1985
1, 1984 Total . . .
-- No inflow Total . . .
Water- surf ace elevation
(feet)Before After inflow inflow
42.10 44.21
this year ....
Inflow stored (acre-
feet)
0.2 0.2 0.0 0.0
Spill (acre-
feet)
0.0 0.0 0.0 0.0
Total inflow (acre-
feet)
0.2 0.2 0.0 0.0
Inflow (acre-feet per square mile)
0.6 0.6 0.0 0.0
RESERVOIR 19
Location Latitude 37°38'35", longitude 103°42'57", sec. 31, T. 27S, R. 56W, located in Las Animas County, Colorado on a tributary of Bent Canyon Creek. Elevation is 5,000 feet.
Drainage area--0.17 square mile.Records available October 1983 to 1985 (late spring and summer months only).Gage - Reference mark, set to arbitrary datum. Read biweekly.Remarks--Reservoir capactiy is 4.6 acre-feet; spillway elevation is
98.56 feet.
Water- surf ace . , elevation Date and ,_ >.
(feet)water year Beforeinflow
July 15, 1984 88.92August 4, 1984 89.65August 8, 1984 90.90August 24, 1984 90.62September 10, 1984 97.00September 16, 1984 97.65
Total .......May 16, 1985 94.56
Total .......
After inflow
90.2290.9091.1497.6097.6598.43
95.50
Inflow stored (acre-
feet)
0.10.20.13.40.60.85.20.50.5
Spill (acre-
feet)
0.00.00.00.00.00.80.00.00.0
Total inflow (acre-
feet)
0.10.20.13.40.61.65.20.50.5
Inflow (acre-feet per square mile)
0.61.20.6
20.03.59.4
35.32.92.9
93
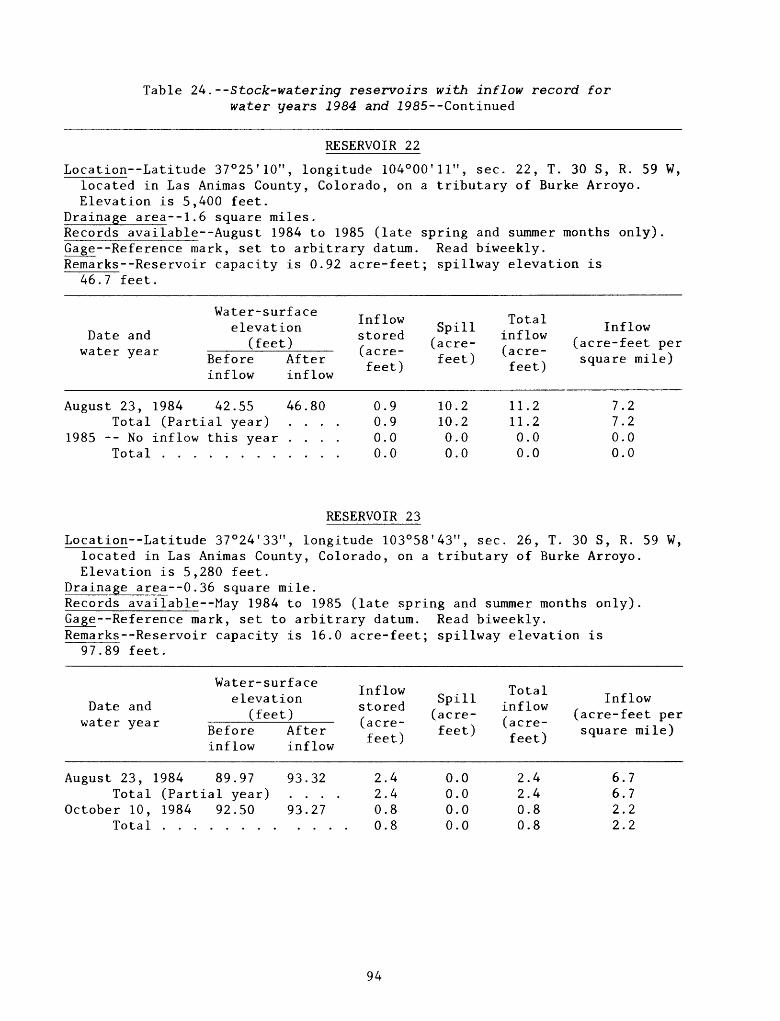
Table 24. Stocfc-watering reservoirs with inflow record for water years 2984 and 1985--Continued
RESERVOIR 22
Location--Latitude 37°25'10", longitude 104°00'11 M , sec. 22, T. 30 S, R. 59 W, located in Las Animas County, Colorado, on a tributary of Burke Arroyo. Elevation is 5,400 feet.
Drainage area--1.6 square miles.Records available August 1984 to 1985 (late spring and summer months only).Gage--Reference mark, set to arbitrary datum. Read biweekly.Remarks--Reservoir capacity is 0.92 acre-feet; spillway elevation is
46.7 feet.
Date and water yea
August
1985 -
23, Total - No Total
Water-surface elevation
(feet)Before inflow
1984 42.55 (Partial year)
inflow this year
After inflow
46.80
Inflow stored (acre-
feet)
0 0 0 0
.9
.9
.0
.0
Spill (acre- feet)
10 10 0 0
.2
.2
.0
.0
Total inflow (acre-
feet)
11 11 0 0
.2
.2
.0
.0
Inflow (acre-feet per square mile)
7. 7. 0. 0.
2 2 0 0
RESERVOIR 23
Location Latitude 37°24'33M , longitude 103°58'43", sec. 26, T. 30 S, R. 59 W, located in Las Animas County, Colorado, on a tributary of Burke Arroyo. Elevation is 5,280 feet.
Drainage area--0.36 square mile.Records available May 1984 to 1985 (late spring and summer months only).Gage--Reference mark, set to arbitrary datum. Read biweekly.Remarks--Reservoir capacity is 16.0 acre-feet; spillway elevation is
97.89 feet.
Date and water year
August 23, Total
October 10, Total
Water- surf ace elevation
(feet)Before inflow
1984 89.97 (Partial year) 1984 92.50
After inflow
93.32
93.27
Inflow stored (acre- feet)
2.4 2.4 0.8 0.8
Spill (acre-
feet)
0 0 0 0
.0
.0
.0
.0
Total inflow (acre- feet)
2 2 0 0
.4
.4
.8
.8
Inflow (acre-feet per square mile)
6. 6. 2. 2.
7 7 2 2
94
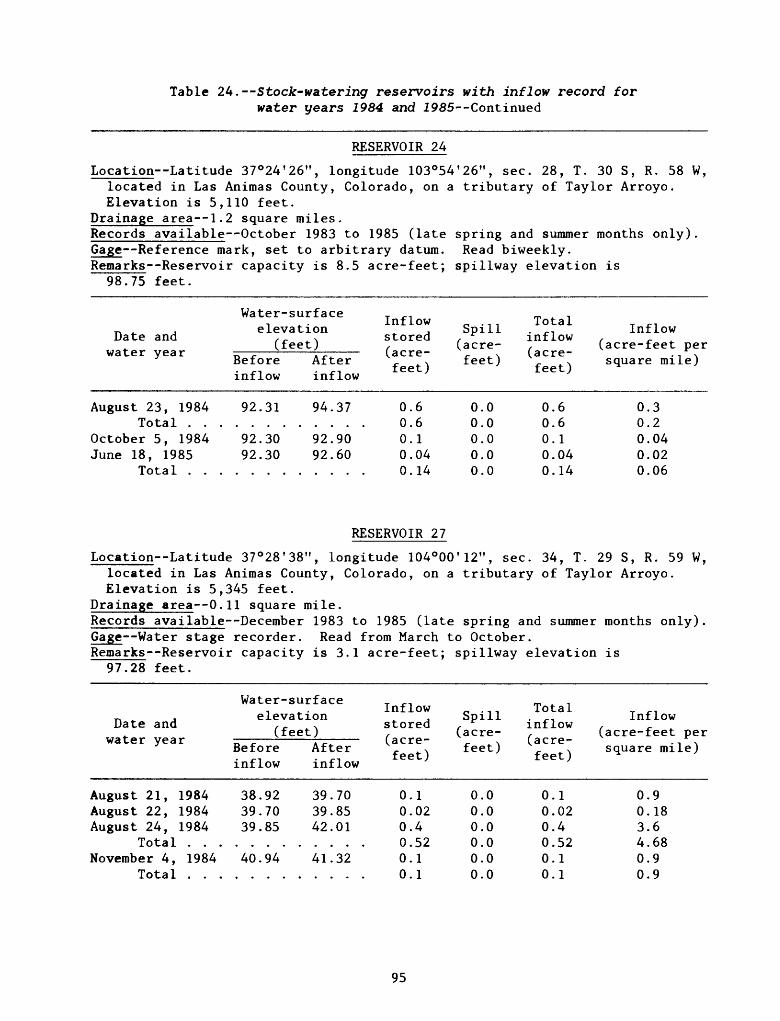
Table 24. Stock-watering reservoirs with inflow record for water years 1984 and 1985- -Continued
RESERVOIR 24
Location Latitude 37°24'26 M , longitude 103°54'26", sec. 28, T. 30 S, R. 58 W, located in Las Animas County, Colorado, on a tributary of Taylor Arroyo. Elevation is 5,110 feet.
Drainage area--1.2 square miles.Records available October 1983 to 1985 (late spring and summer months only).Gage Reference mark, set to arbitrary datum. Read biweekly.Remarks--Reservoir capacity is 8.5 acre-feet; spillway elevation is
98.75 feet.
Date and water year
August 23, 1984 Total . . .
October 5, 1984 June 18, 1985
Total . . ,
Water-surface elevation
(feet)Before inflow
92.31
92.30 92.30
After inflow
94.37
92.90 92.60
Inflow stored (acre- feet)
0.6 0.6 0.1 0.04 0.14
Spill (acre- feet)
0.0 0.0 0.0 0.0 0.0
Total inflow (acre- feet)
0.6 0.6 0.1 0.04 0.14
Inflow (acre-feet per square mile)
0.3 0.2 0.04 0.02 0.06
RESERVOIR 27
Location Latitude 37°28'38", longitude 104°00'12", sec. 34, T. 29 S, R. 59 W, located in Las Animas County, Colorado, on a tributary of Taylor Arroyo. Elevation is 5,345 feet.
Drainage area 0.11 square mile.Records available December 1983 to 1985 (late spring and summer months only).Gage Water stage recorder. Read from March to October.Remarks--Reservoir capacity is 3.1 acre-feet; spillway elevation is
97.28 feet.
Date and water year
August 21, 1984 August 22, 1984 August 24, 1984
Total . . .November 4, 1984
Total . . .
Water-surface elevation
(feet)Before inflow
38.92 39.70 39.85
40.94
After inflow
39.70 39.85 42.01
41.32
Inflow stored (acre- feet)
0.1 0.02 0.4 0.52 0.1 0.1
Spill (acre- feet)
0.0 0.0 0.0 0.0 0.0 0.0
Total inflow (acre- feet)
0.1 0.02 0.4 0.52 0.1 0.1
Inflow (acre-feet per square mile)
0.9 0.18 3.6 4.68 0.9 0.9
95
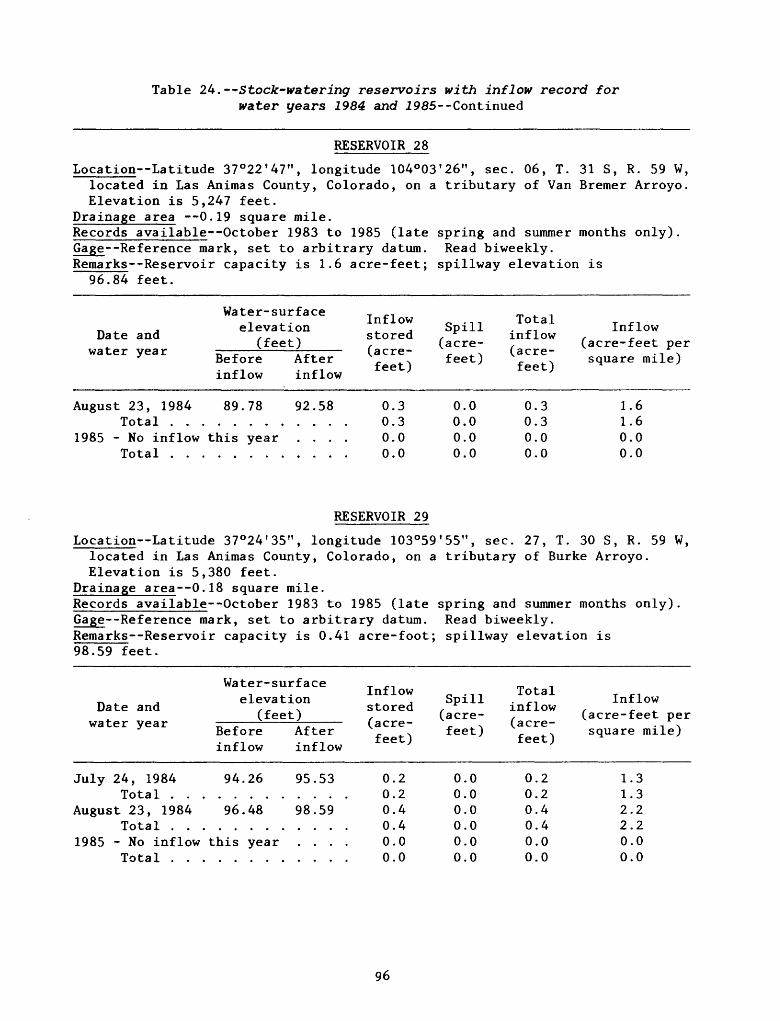
Table 24.--Stock-watering reservoirs with inflow record for water years 1984 and 1 985--Continued
RESERVOIR 28
Location Latitude 37°22'47", longitude 104°03'26", sec. 06, T. 31 S, R. 59 W, located in Las Animas County, Colorado, on a tributary of Van Bremer Arroyo. Elevation is 5,247 feet.
Drainage area 0.19 square mile.Records available October 1983 to 1985 (late spring and summer months only).Gage--Reference mark, set to arbitrary datum. Read biweekly.Remarks--Reservoir capacity is 1.6 acre-feet; spillway elevation is
96.84 feet.
Date and water year
August
1985 -
23, 1984 Total . . .No inflow Total . . .
Water-surface elevation
(feet)Before After inflow inflow
89.78 92.58
this year ....
Inflow stored (acre- feet)
0. 0. 0. 0.
3 3 0 0
Spill (acre- feet)
0. 0. 0. 0.
0 0 0 0
Total inflow (acre- feet)
0 0 0 0
.3
.3
.0
.0
Inflow (acre-feet per square mile)
1. 1. 0. 0.
6 6 0 0
RESERVOIR 29
Location Latitude 37°24'35", longitude 103°59'55", sec. 27, T. 30 S, R. 59 W, located in Las Animas County, Colorado, on a tributary of Burke Arroyo. Elevation is 5,380 feet.
Drainage area 0.18 square mile.Records available October 1983 to 1985 (late spring and summer months only).Gage--Reference mark, set to arbitrary datum. Read biweekly.Itemarks Reservoir capacity is 0.41 acre-foot; spillway elevation is98.59 feet.
Date and water year
July 24, 1984 Tntal . . .
August
1985 -
23, 1984 Total . . .No inflow Total . . .
Water-surface elevation
(feet)Before inflow
94.26
96.48
this year
After inflow
95.53
98.59
....
Inflow stored (acre- feet)
0 0 0 0 0 0
.2
.2
.4
.4
.0
.0
Spill (acre- feet)
0 0 0 0 0 0
.0
.0
.0
.0
.0
.0
Total inflow (acre-
feet)
0. 0. 0. 0. 0. 0.
2 2 4 4 0 0
Inflow (acre-feet per square mile)
1. 1. 2. 2. 0. 0.
3 3 2 2 0 0
96
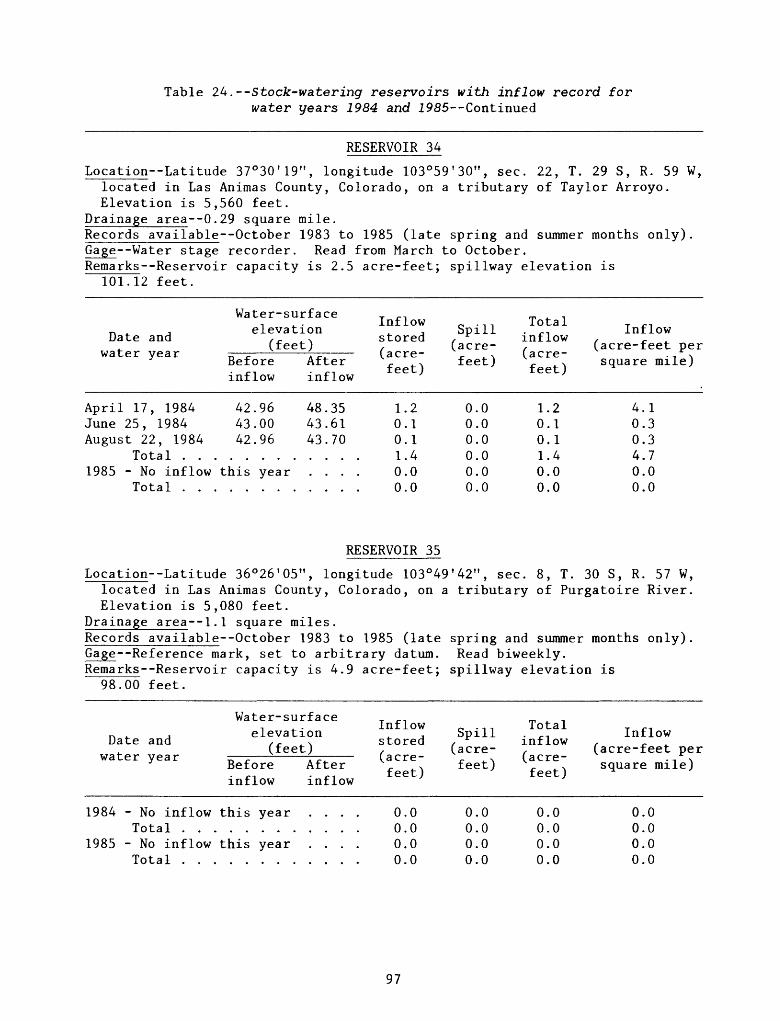
Table 24. --Stock-watering reservoirs with inflow record for water years 1984 and 1985--Continued
RESERVOIR 34
Location Latitude 37°30'19", longitude 103°59'30 M , sec. 22, T. 29 S, R. 59 W, located in Las Animas County, Colorado, on a tributary of Taylor Arroyo. Elevation is 5,560 feet.
Drainage area--0.29 square mile.Records available October 1983 to 1985 (late spring and summer months only).Gage--Water stage recorder. Read from March to October.Rema rks--Re s e rvo i r capacity is 2.5 acre-feet; spillway elevation is
101.12 feet.
Date and water year
April 17, 1984 June 25, 1984 August 22, 1984
Total . . .1985 - No inflow
Total . . .
Water-surface elevation
(feet)Before inflow
42.96 43.00 42.96
this year
After inflow
48.35 43.61 43.70
Inflow stored (acre-
feet)
1.2 0.1 0.1 1.4 0.0 0.0
Spill (acre-
feet)
0.0 0.0 0.0 0.0 0.0 0.0
Total inflow (acre-
feet)
1.2 0.1 0.1 1.4 0.0 0.0
Inflow (acre-feet per square mile)
4.1 0.3 0.3 4.7 0.0 0.0
RESERVOIR 35
Location Latitude 36°26'05 M , longitude 103°49 t 42", sec. 8, T. 30 S, R. 57 W, located in Las Animas County, Colorado, on a tributary of Purgatoire River. Elevation is 5,080 feet.
Drainage area 1.1 square miles.Records available October 1983 to 1985 (late spring and summer months only).Gage--Reference mark, set to arbitrary datum. Read biweekly.Rema rks--Re s e rvo i r capacity is 4.9 acre-feet; spillway elevation is
98.00 feet.
Water-surface~ . , elevation Date and ,_ ,
. (feet)3 Before After
inflow inflow
1984 - No inflow this year .... Total ............
1985 - No inflow this year .... Total ............
Inflow stored (acre-
feet)
0.0 0.0 0.0 0.0
Spill (acre-
feet)
0.0 0.0 0.0 0.0
Total inflow (acre-
feet)
0.0 0.0 0.0 0.0
Inflow (acre-feet per square mile)
0.0 0.0 0.0 0.0
97
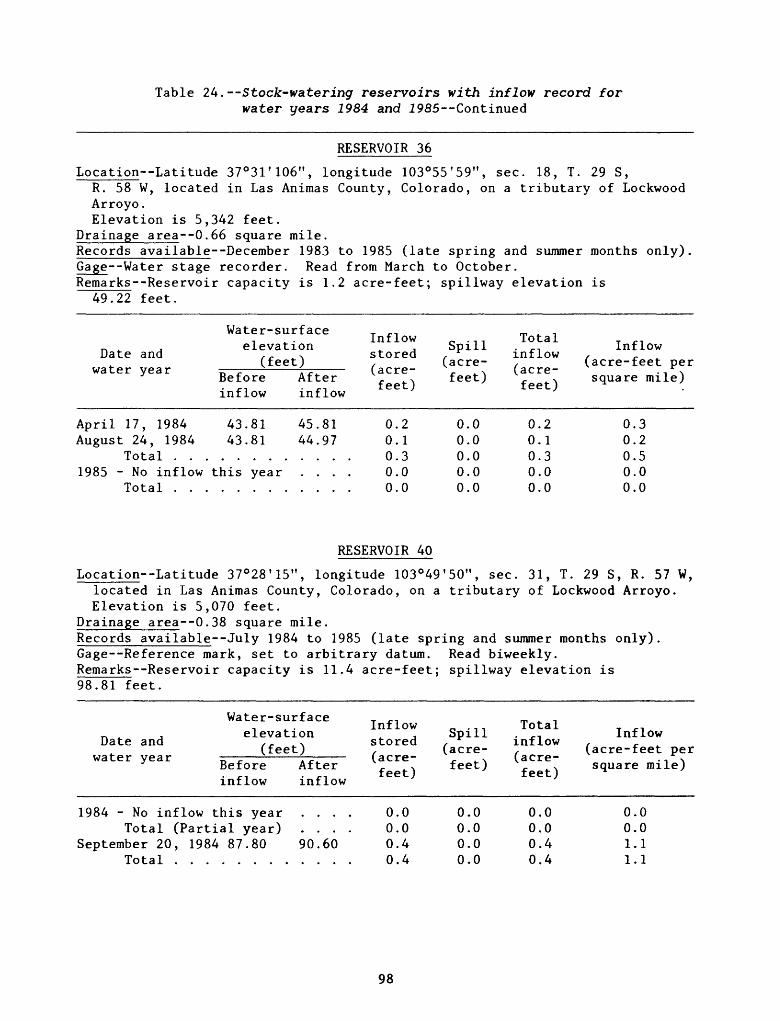
Table 24. --Stock-watering reservoirs with inflow record for water years 1984 and 2985--Continued
RESERVOIR 36
Location Latitude 37°31'106", longitude 103°55'59", sec. 18, T. 29 S,R. 58 W, located in Las Animas County, Colorado, on a tributary of LockwoodArroyo.Elevation is 5,342 feet.
Drainage area 0.66 square mile.Records available December 1983 to 1985 (late spring and summer months only). Gage--Water stage recorder. Read from March to October. Remarks--Reservoir capacity is 1.2 acre-feet; spillway elevation is
49.22 feet.
Date and water year
April 17, 1984 August 24, 1984
Total . . .1985 - No inflow
Total . . .
Water-surface elevation
(feet)Before inflow
43.81 43.81
this year
After inflow
45.81 44.97
....
Inflow stored (acre-
feet)
0.2 0.1 0.3 0.0 0.0
Spill (acre- feet)
0.0 0.0 0.0 0.0 0.0
Total inflow (acre- feet)
0.2 0.1 0.3 0.0 0.0
Inflow (acre-feet per square mile)
0.3 0.2 0.5 0.0 0.0
RESERVOIR 40
Location Latitude 37°28'15", longitude 103°49'50", sec. 31, T. 29 S, R. 57 W, located in Las Animas County, Colorado, on a tributary of Lockwood Arroyo. Elevation is 5,070 feet.
Drainage area--0.38 square mile.Records available July 1984 to 1985 (late spring and summer months only).Gage Reference mark, set to arbitrary datum. Read biweekly.Remarks--Reservoir capacity is 11.4 acre-feet; spillway elevation is98.81 feet.
Date and water year
Water-surface elevation
(feet)Before After inflow inflow
1984 - No inflow this year .... Total (Partial year) ....
September 20, 1984 87.80 90.60 Total ............
Inflow stored (acre-
feet)
0.0 0.0 0.4 0.4
Spill (acre- feet)
0.0 0.0 0.0 0.0
Total inflow (acre- feet)
0.0 0.0 0.4 0.4
Inflow (acre-feet per square mile)
0.0 0.0 1.1 1.1
98
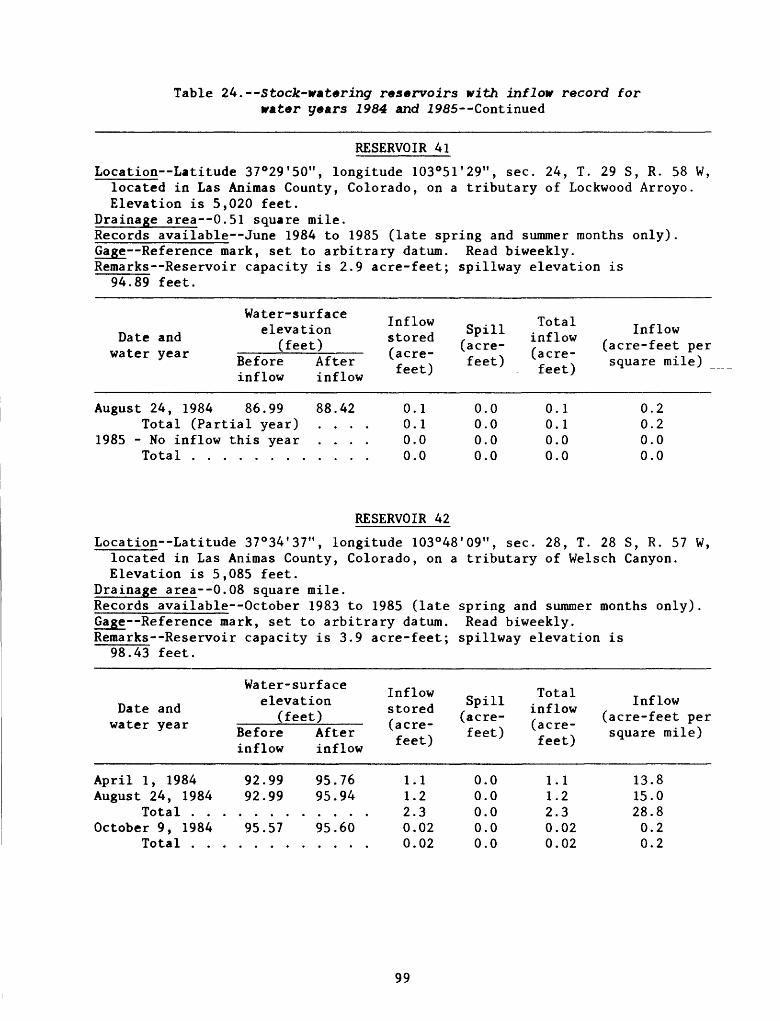
Table 24.--Stock-lirataring reservoirs with inflow record for water years 1984 and 1985 Continued
RESERVOIR 41
Location Latitude 37°29 I 50 11 , longitude 103°51'29", sec. 24, T. 29 S, R. 58 W, located in Las Animas County, Colorado, on a tributary of Lockwood Arroyo. Elevation is 5,020 feet.
Drainage area--0.51 square mile.Records available June 1984 to 1985 (late spring and summer months only).Gage--Reference mark, set to arbitrary datum. Read biweekly.Remarks--Reservoir capacity is 2.9 acre-feet; spillway elevation is
94.89 feet.
Water-surface_. . . elevation Date and , ,
(feet)WclUlTL VCdl. _. ' Before
inflow
August 24, 1984 86.99 Total (Partial year)
1985 - No inflow this year Total ........
After inflow
88.42
Inflow stored (acre- feet)
0.1 0.1 0.0 0.0
Spill (acre- feet)
0.0 0.0 0.0 0.0
Total inflow (acre- feet)
0.1 0.1 0.0 0.0
Inflow (acre-feet per square mile)
0.2 0.2 0.0 0.0
RESERVOIR 42
Location Latitude 37°34 I 37 11 , longitude 103°48 I 09 11 , sec. 28, T. 28 S, R. 57 W, located in Las Animas County, Colorado, on a tributary of Welsch Canyon. Elevation is 5,085 feet.
Drainage area 0.08 square mile.Records available October 1983 to 1985 (late spring and summer months only).Gage Reference mark, set to arbitrary datum. Read biweekly.Remarks--Reservoir capacity is 3.9 acre-feet; spillway elevation is
98.43 feet.
Date and water year
April 1, 1984 August 24, 1984
Total . . ,October 9, 1984
Total . . .
Water-surface elevation
(feet)Before inflow
92.99 92.99
95.57
After inflow
95.76 95.94
95.60
Inflow stored (acre- feet)
1.1 1.2 2.3 0.02 0.02
Spill (acre- feet)
0.0 0.0 0.0 0.0 0.0
Total inflow (acre- feet)
1.1 1.2 2.3 0.02 0.02
Inflow (acre-feet per square mile)
13.8 15.0 28.8 0.2 0.2
99
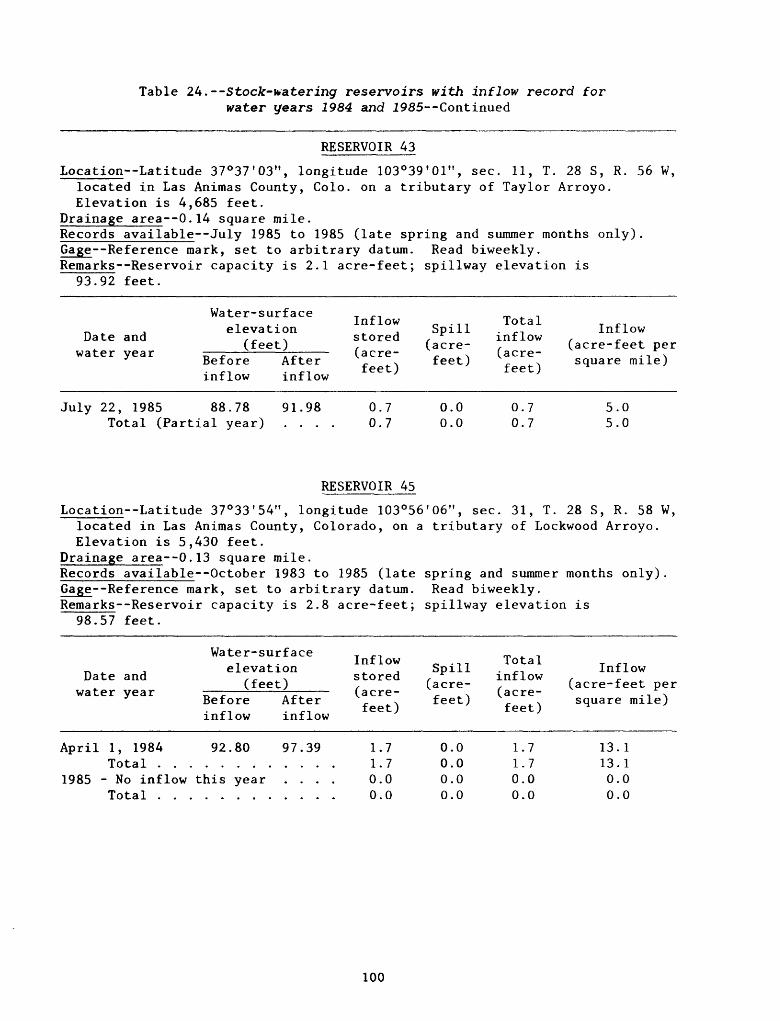
Table 24. --Stock-watering reservoirs with inflow record for water years 1984 and 1985- -Continued
RESERVOIR A3
Location Latitude 37°37'03", longitude 103°39'01", sec. 11, T. 28 S, R. 56 W, located in Las Animas County, Colo. on a tributary of Taylor Arroyo. Elevation is 4,685 feet.
Drainage area 0.14 square mile.Records available July 1985 to 1985 (late spring and summer months only).Gage Reference mark, set to arbitrary datum. Read biweekly.Remarks--Reservoir capacity is 2.1 acre-feet; spillway elevation is
93.92 feet.
D£ wat
July
Water- surf ace, elevation
ite and , , (feet):er year - - -
J Beforeinflow
22, 1985 88.78 Total (Partial year)
After inflow
91.98
Inflow stored (acre-
feet)
0.7 0.7
Spill (acre-
feet)
0.0 0.0
Total inflow (acre- feet)
0.7 0.7
Inflow (acre-feet per square mile)
5.0 5.0
RESERVOIR 45
Location Latitude 37°33'54", longitude 103°56 I 06", sec. 31, T. 28 S, R. 58 W, located in Las Animas County, Colorado, on a tributary of Lockwood Arroyo. Elevation is 5,430 feet.
Drainage area--0.13 square mile.Records available October 1983 to 1985 (late spring and summer months only).Gage--Reference mark, set to arbitrary datum. Read biweekly.Remarks--Reservoir capacity is 2.8 acre-feet; spillway elevation is
98.57 feet.
Date and water year
April
1985
1, 1984 Total . . .
- No inflow Total . . .
Water- surf ace elevation
(feet)Before After inflow inflow
92.80 97.39
this year ....
Inflow stored (acre-
feet)
1. 1. 0. 0.
7 7 0 0
Spill (acre-
feet)
0 0 0 0
.0
.0
.0
.0
Total inflow (acre-
feet)
1 1 0 0
.7
.7
.0
.0
Inflow (acre-feet per square mile)
13.13. 0. 0.
1 1 0 0
100
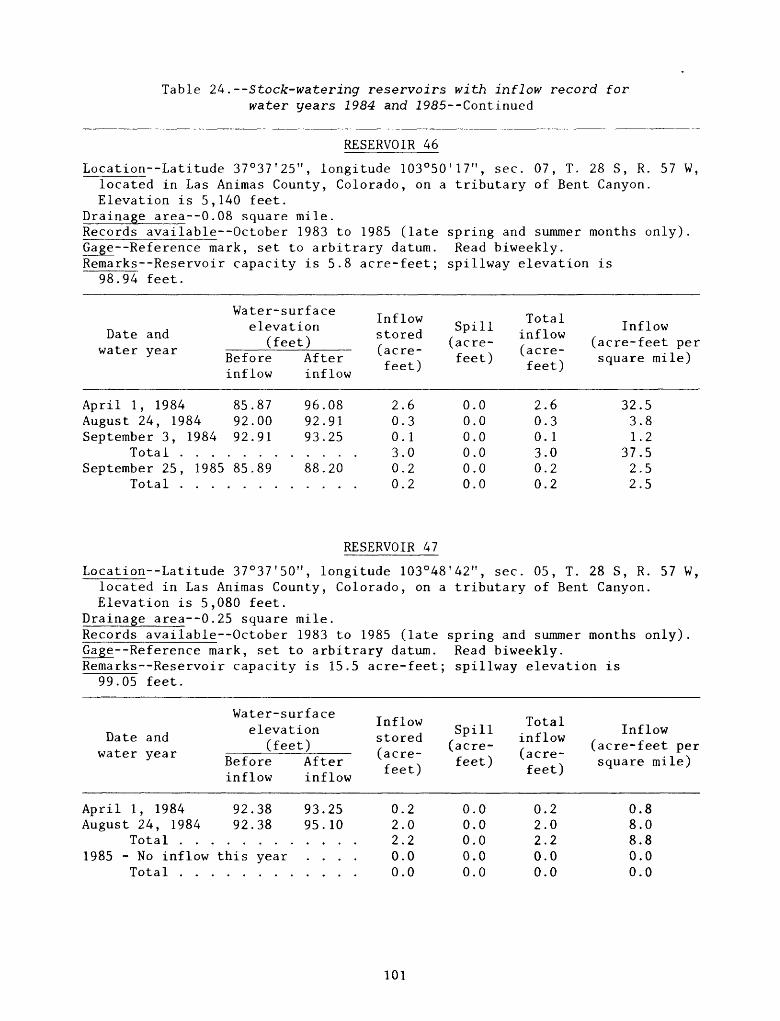
Table 24. --Stock-watering reservoirs with inflow record for water years 1984 and 1985--Continued
RESERVOIR 46
Location Latitude 37°37'25 ff , longitude 103°50 f 17", sec. 07, T. 28 S, R. 57 W, located in Las Animas County, Colorado, on a tributary of Bent Canyon. Elevation is 5,140 feet.
Drainage area--0.08 square mile.Records available October 1983 to 1985 (late spring and summer months only).Gage--Reference mark, set to arbitrary datum. Read biweekly.Remarks--Reservoir capacity is 5.8 acre-feet; spillway elevation is
98.94 feet.
Date and water year
April 1, 1984 August 24, 1984 September 3, 1984
Total . . .September 25, 1985
Total . . .
Water-surface elevation
(feet)Before inflow
85.87 92.00 92.91
85.89
After inflow
96.08 92.91 93.25
88.20
Inflow stored (acre-
feet)
2.6 0.3 0.1 3.0 0.2 0.2
Spill (acre- feet)
0.0 0.0 0.0 0.0 0.0 0.0
Total inflow (acre- feet)
2.6 0.3 0.1 3.0 0.2 0.2
Inflow (acre-feet per square mile)
32.5 3.8 1.2
37.5 2.5 2.5
RESERVOIR 47
Location Latitude 37°37'50 M , longitude 103°48 f 42", sec. 05, T. 28 S, R. 57 W, located in Las Animas County, Colorado, on a tributary of Bent Canyon. Elevation is 5,080 feet.
Drainage area 0.25 square mile.Records available October 1983 to 1985 (late spring and summer months only).Gage--Reference mark, set to arbitrary datum. Read biweekly.Remarks--Reservoir capacity is 15.5 acre-feet; spillway elevation is
99.05 feet.
Date and water year
April 1, 1984 August 24, 1984
Total . . .1985 - No inflow
Total . . .
Water-surface elevation
(feet)Before inflow
92.38 92.38
this year
After inflow
93.25 95.10
....
Inflow stored (acre-
feet)
0.2 2.0 2.2 0.0 0.0
Spill (acre-
feet)
0.0 0.0 0.0 0.0 0.0
Total inflow (acre-
feet)
0.2 2.0 2.2 0.0 0.0
Inflow (acre-feet per square mile)
0.8 8.0 8.8 0.0 0.0
101
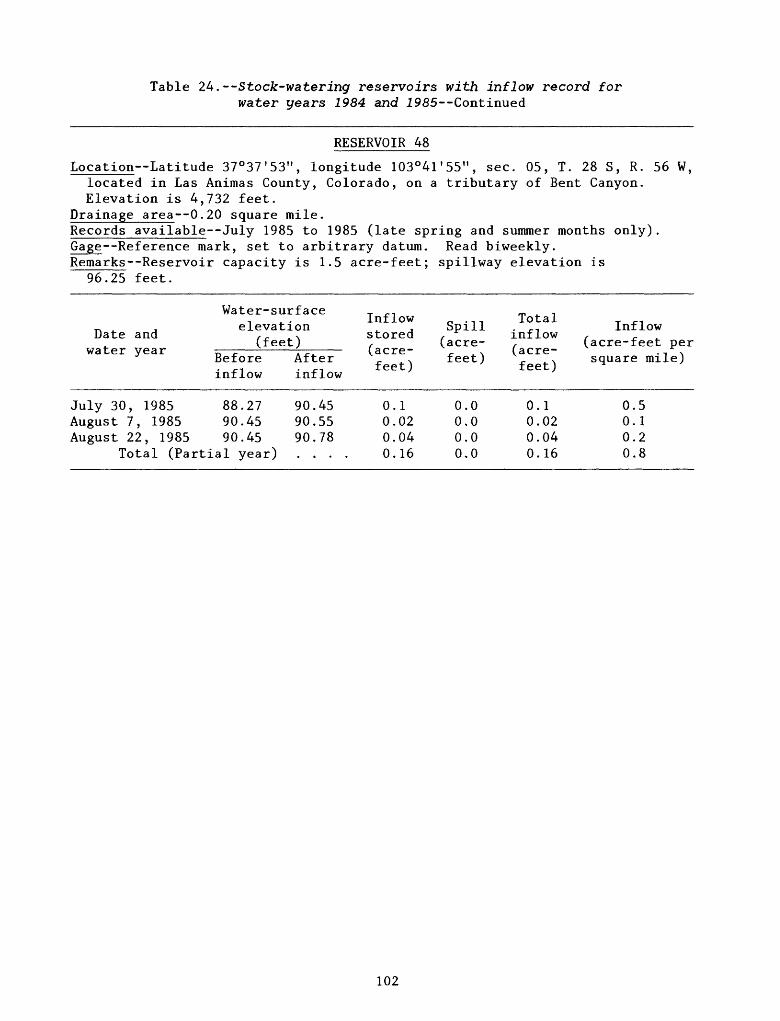
Table 24. --Stock-watering reservoirs with inflow record for water years 1984 and 1985--Continued
RESERVOIR 48
Location Latitude 37°37'53", longitude 103°41'55", sec. 05, T. 28 S, R. 56 W, located in Las Animas County, Colorado, on a tributary of Bent Canyon. Elevation is 4,732 feet.
Drainage area--0.20 square mile.Records available July 1985 to 1985 (late spring and summer months only).Gage--Reference mark, set to arbitrary datum. Read biweekly.Remarks--Reservoir capacity is 1.5 acre-feet; spillway elevation is
96.25 feet.
Date and water year
July 30,August 7,August 22
19851985
, 1985
Water-surface elevation
(feet)Before inflow
88.2790.4590.45
After inflow
90.4590.5590.78
Total (Partial year) ....
Inflow stored (acre-
feet)
0000
.1
.02
.04
.16
Spill (acre-
feet)
0.0.0.0.
0000
Total inflow (acre-
feet)
0000
.1
.02
.04
.16
Inflow (acre-feet per square mile)
0.0.0.0.
5128
102
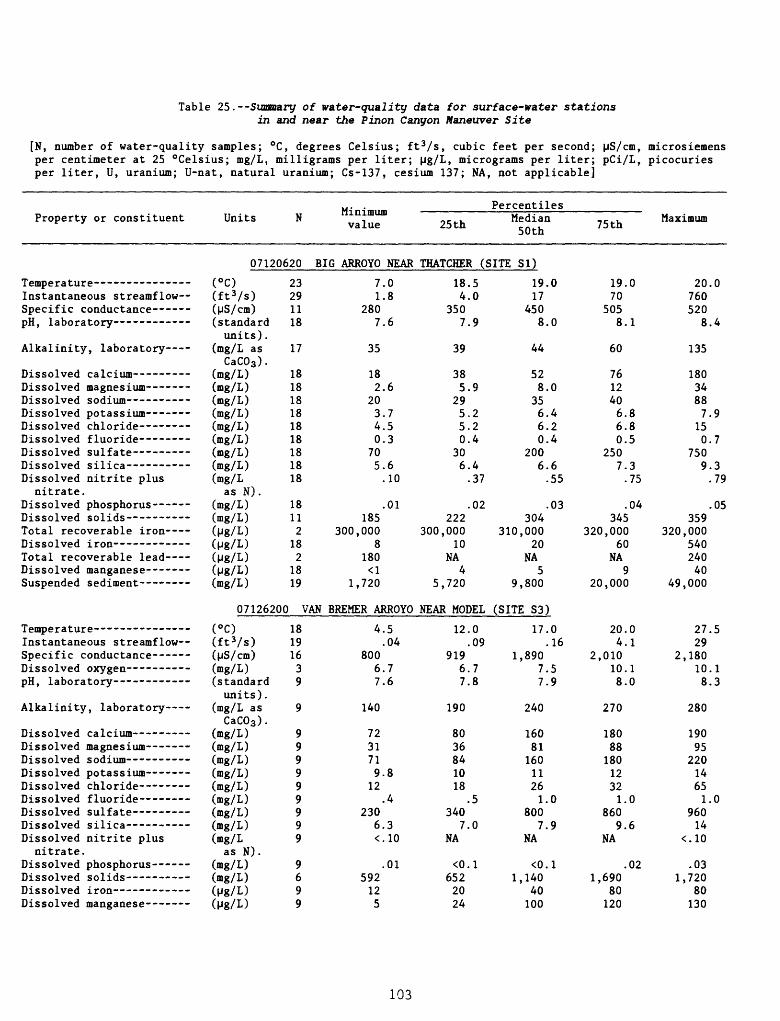
Table 25. Summary of waiter-quality data, for surface-water stations in and near the Pinon Canyon Maneuver Site
[N, number of water-quality samples; °C, degrees Celsius; ft 3 /s, cubic feet per second; pS/cm, microsiemens per centimeter at 25 "Celsius; mg/L, milligrams per liter; Mg/L, tnicrograms per liter; pCi/L, picocuries per liter, U, uranium; U-nat, natural uranium; Cs-137, cesium 137; NA, not applicable]
Property or constituent Units Minimum value
Percentiles
25th Median 50th 75th Maximum
07120620 BIG ARROYO NEAR THATCHER (SITE SI)Temperature- - --- Instantaneous streamflow- Specific conductance-- - pH, laboratory --- ---
Alkalinity, laboratory
Dissolved calcium Dissolved magnesium Dissolved sodium- - - Dissolved potassium---- Dissolved chloride-- - Dissolved fluoride -- Dissolved sulfate Dissolved silica -- Dissolved nitrite plus
nitrate.Dissolved phosphorus--- Dissolved solids --- Total recoverable iron- Dissolved iron-- --- Total recoverable lead- Dissolved manganese---- Suspended sediment
Temperature--- -- Instantaneous streamflow- Specific conductance- - Dissolved oxygen - pH, laboratory- ---.
Alkalinity, laboratory
Dissolved Dissolved Dissolved Dissolved Dissolved Dissolved Dissolved Dissolved Dissolved
nitrate, Dissolved Dissolved Dissolved Dissolved
calcium magnesium- sodium potassium - chloride fluoride sulfate silica -- nitrite plus
phosphorus- solids iron manganese--
(°c)(ft 3/s)(MS/cm)(standardunits) .
(mg/L asCaC03 ).
(mg/L)(mg/L)(mg/L)(mg/L)(mg/L)(mg/L)(mg/L)(mg/L)(mg/L
as N).(mg/L)(mg/L)(Mg/L)(Mg/L)(Mg/L)(Mg/L)(mg/L)
23291118
17
181818181818181818
18112182
1819
7.01.8
2807.6
35
182.6
203.74.50.3
705.6.10
18.54.0
3507.9
39
385.9
295.25.20.4
306.4.37
19.017
4508.0
44
528.0
356.46.20.4
2006.6.55
.01 .02 .03185
300,0008
180
1,720
222300,000
10 NA
4 5,720
304310,000
20NA
59,800
07126200 VAN BREMER ARROYO NEAR MODEL (SITE S3)
4.5.04
8006.77.6
(°C)(ft 3/s)(MS/cm)(mg/L)(standardunits).
(mg/L asCaC03 ).
(mg/L)(mg/L)(mg/L)(mg/L)(mg/L)(mg/L)(mg/L)(mg/L)(mg/L
as N).(mg/L)(mg/L)(Mg/L)(Mg/L)
18191639
9
999999999
9699
140
7231719.8
12.4
2306.3
190
8036841018
3407.0
.01592125
NA
6522024
240
16081
16011261.0
8007.9
NA
1,14040100
19.070
5058.1
60
12.0.09
9196.77.8
17.0.16
1,8907.57.9
20.04.1
2,01010.18.0
270
18088
18012321.
8609.6
NA
0
.021,690
80120
20.0760520
8.4
135
7612406.86.80.5
2507.3.75
.04345
320,00060
NA9
20,000
18034887.9
150.7
7509.3.79
.05359
320,00054024040
49,000
27.529
2,18010.18.3
280
19095
22014651.0
96014
.031,720
80130
103
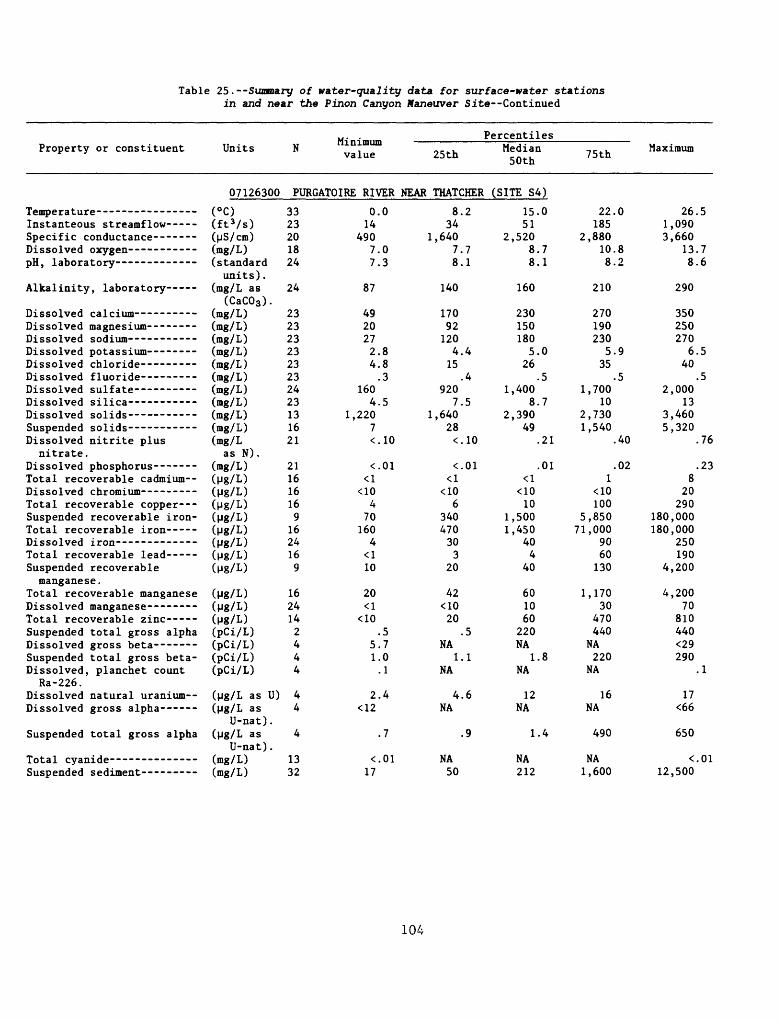
Table 25.--Stannary of water-quality data for surface-water stations in and near the Pinon Canyon Maneuver Site Continued
Property or constituent Units Minimum value
Percentiles
25th Median 50th 75th Maximum
07126300 PURGATOIRE RIVER NEAR THATCHER (SITE S4)Temperature (°C) 33Instanteous streamflow- -- (ft 3 /s) 23Specific conductance- - (MS/cm) 20Dissolved oxygen--- ------ (mg/L) 18pH, laboratory -------- (standard 24
units). Alkalinity, laboratory - (mg/L as 24
(CaC03 ). Dissolved calcium (mg/L) 23Dissolved magnesium----- - (mg/L) 23Dissolved sodium - - - (mg/L) 23Dissolved potassium - (mg/L) 23Dissolved chloride (mg/L) 23Dissolved fluoride (mg/L) 23Dissolved sulfate (mg/L) 24Dissolved silica - - (mg/L) 23Dissolved solids (mg/L) 13Suspended solids----------- (mg/L) 16Dissolved nitrite plus (mg/L 21
nitrate. as N).Dissolved phosphorus------- (mg/L) 21Total recoverable cadmium-- (Mg/L) 16Dissolved chromium- - - (Mg/L) 16Total recoverable copper--- (Mg/L) 16Suspended recoverable iron- (Mg/L) 9Total recoverable iron----- (Mg/L) 16Dissolved iron - (Mg/L) 24Total recoverable lead----- (yg/L) 16Suspended recoverable (yg/L) 9
manganese.Total recoverable manganese (M8/L) 16Dissolved manganese-------- (Mg/L) 24Total recoverable zinc --- (Mg/L) 14Suspended total gross alpha (pCi/L) 2Dissolved gross beta---- - (pCi/L) 4Suspended total gross beta- (pCi/L) 4Dissolved, planchet count (pCi/L) 4
Ra-226.Dissolved natural uranium-- (M8/L as U) 4Dissolved gross alpha - (M8/L as 4
U-nat). Suspended total gross alpha (M8/L as 4
U-nat).Total cyanide (mg/L) 13Suspended sediment (mg/L) 32
0.014
4907. 7,
87
4920272.84.8
1604.
1,2207
470
1604
10
20
.5 5.7 1.0.1
2.4
.7
8.234
1,6407.78.1
140
170921204.4
15.4
9207.5
1,64028
6340470303
20
42
20.5
NA1.1
NA
4.6NA
.9
15.051
2,5208.78.1
160
2301501805.0
26.5
1,4008.7
2,39049
.21
.01
101,5001,450
404
40
601060
220NA
1.8 NA
12 NA
1.4
17NA 50
NA 212
22.0185
2,88010.88.2
210
270190230
5.935
.51,700
102,7301,540
.40
.02
1005,85071,000
9060130
1,17030
470440
NA220
NA
16NA
490
NA 1,600
26.51,0903,660
13.78.6
290
350250270
6.540
.52,000
133,4605,320
.76
.238
20290
180,000180,000
250190
4,200
4,200 70
810 440 <29 290
.1
17 <66
650
12,500
104
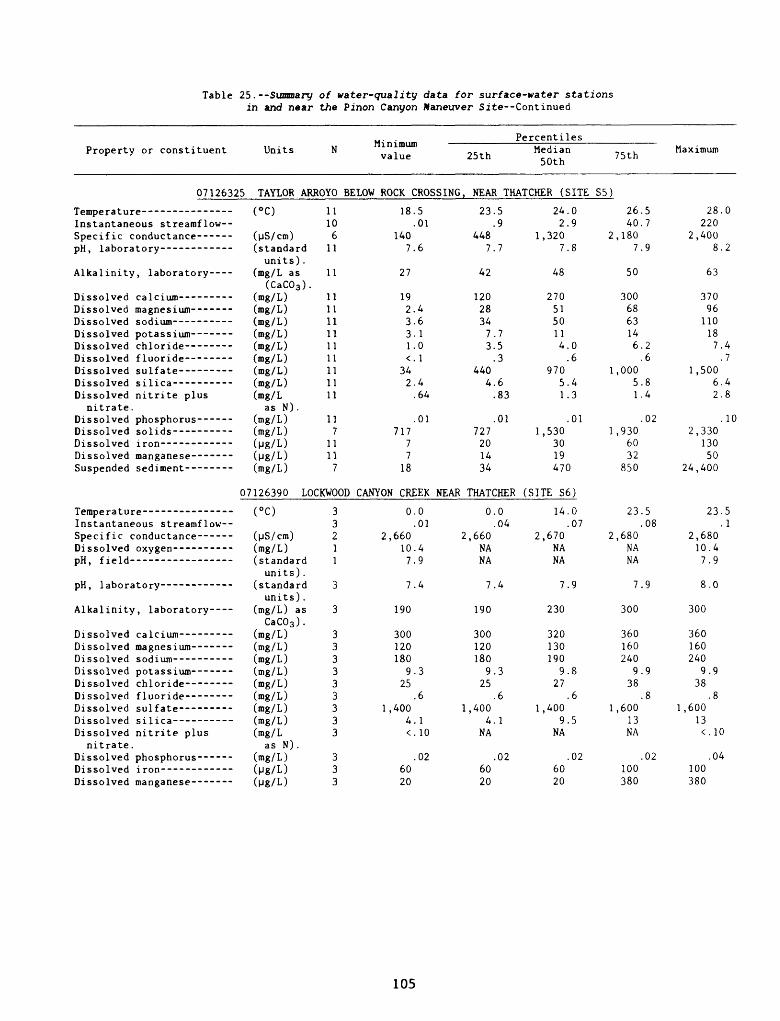
Table 25.--Summary of water-quality data for surface-water stations in and near the Pinon Canyon Maneuver Site Continued
Property or constituent
07126325Tempera ture- --------------Instantaneous streamflow--Specific conductance------pH, laboratory------------
Alkalinity, laboratory-
Dissolved calcium---------Dissolved magnesium-------Dissolved sodium----------Dissolved potassium-------Dissolved chloride--------Dissolved f luoride--------Dissolved sulfate---------Dissolved silica----------Dissolved nitrite plus
nitrate.Dissolved phosphorus------Dissolved solids----------Dissolved iron------------Dissolved manganese-------Suspended sediment--------
Units N 11J.11J.UIU1II
value
TAYLOR ARROYO BELOW ROCK(°C)
(MS/cm)(standardunits) .
(mg/L as(CaC03 ).
(mg/L)(mg/L)(mg/L)(mg/L)(mg/L)(mg/L)(mg/L)(mg/L)(mg/L
as N).(mg/L)(mg/L)(Mg/L)(Mg/L)(mg/L)
11106
11
11
111111111111111111
117
11117
07126390 LOCKWOODTempe ra ture-- ------------ -Instantaneous streamflow--Specific conductance ----Dissolved oxygen----------pH, field
pH, laboratory------------
Alkalinity, laboratory-
Dissolved calcium---------Dissolved magnesium-------Dissolved sodium----------Dissolved potassium-------Dissolved chloride--------Dissolved f luoride--------Dissolved sulfate---------Dissolved silica----------Dissolved nitrite plus
nitrate.Dissolved phosphorus------Dissolved iron------------Dissolved manganese-------
(°C)
(MS/cm)(mg/L)(standardunits) .
(standardunits) .
(mg/L) asCaC03 ).
(mg/L)(mg/L)(mg/L)(mg/L)(mg/L)(mg/L)(mg/L)(mg/L)(mg/L
as N).(mg/L)(Mg/L)(Mg/L)
33211
3
3
333333333
333
18
1407
27
192331<
342
71777
18
CROSSING
.5
.01
.6
.4
.6
.1
.0
.1
.4
.64
.01
CANYON CREEK NEAR
0
2,660107
7
190
300120180
925
1,4004<
6020
.0
.01
.4
.9
.4
.3
.6
.1
.10
.02
25th
, NEAR
23.
4487.
42
12028347.3.
4404.
727201434
PercentilesMedian 50th
THATCHER (SITE
59
7
753
683
01
THATCHER
0.
2,660NANA
7.
190
300120180
9.25
1,4004.
NA
6020
004
4
3
6
1
02
24.02.9
1,3207.8
48
2705150114.0.6
9705.41.3
.011,530
3019470
(SITE S6)
14.0.07
2,670NANA
7.9
230
320130190
9.827
.61,400
9.5NA
.026020
75th
S5)
26.540.7
2,1807.9
50
3006863146.2.6
1,0005.81.4
.021,930
6032
850
23.5.08
2,680NANA
7.9
300
360160240
9.938
.81,600
13NA
.02100380
Maximum
28.220
2,4008.
63
37096110187.
1,5006.2.
2,33013050
24,400
23.
2,68010.47.9
8.0
300
360160240
9.938
.81,600
13<. 10
.04100380
0
2
47
48
10
51
105
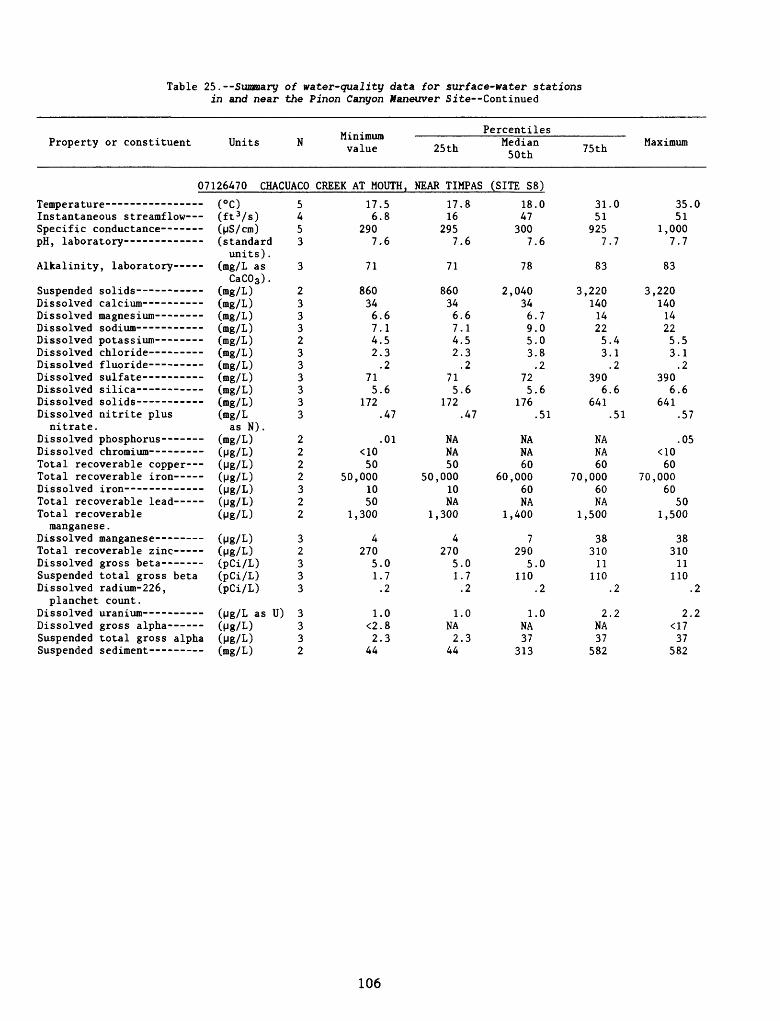
Table 25. Summary of water-quality data for surface-water stations in and near the Pinon Canyon Maneuver Site Continued
Property or constituent Units Minimum value
Percentiles
25th Median 50th 75th Maximum
07126470 CHACUACO CREEK AT MOUTH, NEAR TIMPAS (SITE S8)
Temperature (°C) 5 17.5 17.8 18.0 31.0 35.0Instantaneous streamflow (ft 3 /s) 4 6.8 16 47 51 51Specific conductance (pS/cm) 5 290 295 300 925 1,000pH, laboratory (standard 3 7.6 7.6 7.6 7.7 7.7
units). Alkalinity, laboratory (mg/L as 3 71 71 78 83 83
CaC03 ).Suspended solids (mg/L) 2 860 860 2,040 3,220 3,220Dissolved calcium (mg/L) 3 34 34 34 140 140Dissolved magnesium-- -- (mg/L) 3 6.6 6.6 6.7 14 14Dissolved sodium (mg/L) 3 7.1 7.1 9.0 22 22Dissolved potassium (mg/L) 2 4.5 4.5 5.0 5.4 5.5Dissolved chloride (mg/L) 3 2.3 2.3 3.8 3.1 3.1Dissolved fluoride (mg/L) 3 .2 .2 .2 .2 .2Dissolved sulfate (mg/L) 3 71 71 72 390 390Dissolved silica (mg/L) 3 5.6 5.6 5.6 6.6 6.6Dissolved solids (mg/L) 3 172 172 176 641 641Dissolved nitrite plus (mg/L 3 .47 .47 .51 .51 .57
nitrate. as N).Dissolved phosphorus (mg/L) 2 .01 NA NA NA .05Dissolved chromium (M8/L) 2 <10 NA NA NA <10Total recoverable copper (M8/L) 2 50 50 60 60 60Total recoverable iron (Mg/L) 2 50,000 50,000 60,000 70,000 70,000Dissolved iron (M8/L) 3 10 10 60 60 60Total recoverable lead (M8/L) 2 50 NA NA NA 50Total recoverable (Mg/L) 2 1,300 1,300 1,400 1,500 1,500
manganese.Dissolved manganese (M8/L) 34 4 7 38 38Total recoverable zinc (M8/D 2 270 270 290 310 310Dissolved gross beta (pCi/L) 3 5.0 5.0 5.0 11 11Suspended total gross beta (pCi/L) 3 1.7 1.7 110 110 110Dissolved radium-226, (pCi/L) 3 .2 .2 .2 .2 .2
planchet count.Dissolved uranium (M8/L as U) 3 1.0 1.0 1.0 2.2 2.2Dissolved gross alpha (M8/L) 3 <2.8 NA NA NA <17Suspended total gross alpha (pg/L) 3 2.3 2.3 37 37 37Suspended sediment (mg/L) 2 44 44 313 582 582
106
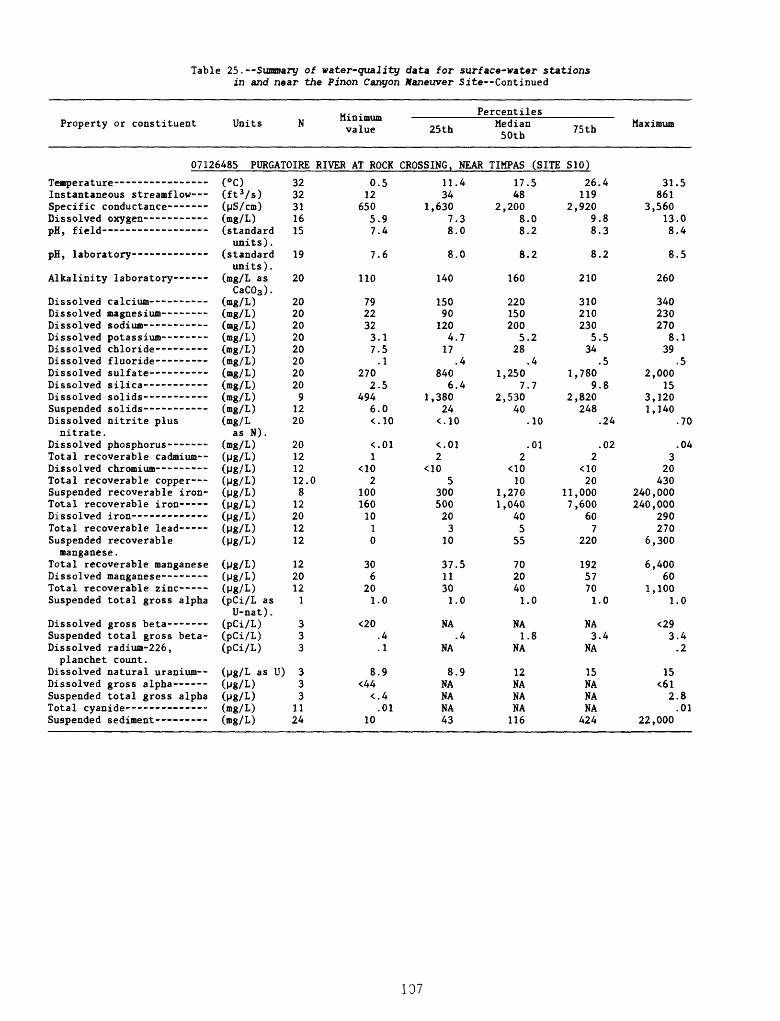
Table 25.--Summary of water-quality data for surface-water stations in and near the Pinon Canyon Maneuver Site Continued
Property or constituent Units Minimum value
Percentiles
25th Median 50th 75th Maximum
07126485 PURGATOIRE RIVER AT ROCK CROSSING. NEAR TIMPAS (SITE S10)
Temperature (°C) 32 0.5 11.4 17.5 26.4 31.5Instantaneous streamflow (ft 3/s) 32 12 34 48 119 861Specific conductance (MS/cm) 31 650 1,630 2,200 2,920 3,560Dissolved oxygen (mg/L) 16 5.9 7.3 8.0 9.8 13.0pH, field (standard 15 7.4 8.0 8.2 8.3 8.4
units). pH, laboratory (standard 19 7.6 8.0 8.2 8.2 8.5
units). Alkalinity laboratory (mg/L as 20 110 140 160 210 260
CaC03 ).Dissolved calcium (mg/L) 20 79 150 220 310 340Dissolved magnesium (mg/L) 20 22 90 150 210 230Dissolved sodium (mg/L) 20 32 120 200 230 270Dissolved potassium (mg/L) 20 3.1 4.7 5.2 5.5 8.1Dissolved chloride (mg/L) 20 7.5 17 28 34 39Dissolved fluoride - (mg/L) 20 .1 .4 .4 .5 .5Dissolved sulfate (mg/L) 20 270 840 1,250 1,780 2,000Dissolved silica (mg/L) 20 2.5 6.4 7.7 9.8 15Dissolved solids (mg/L) 9 494 1,380 2,530 2,820 3,120Suspended solids (mg/L) 12 6.0 24 40 248 1,140Dissolved nitrite plus (mg/L 20 <.10 <.10 .10 .24 .70
nitrate. as N).Dissolved phosphorus (mg/L) 20 <.01 <.01 .01 .02 .04Total recoverable cadmium-- (Mg/L) 12 1 2 22 3Dissolved chromium- - - (Mg/L) 12 <10 <10 <10 <10 20Total recoverable copper (Mg/L) 12.0 2 5 10 20 430Suspended recoverable iron- (Mg/L) 8 100 300 1,270 11,000 240,000Total recoverable iron (Mg/L) 12 160 500 1,040 7,600 240,000Dissolved iron (Mg/L) 20 10 20 40 60 290Total recoverable lead (Mg/L) 12 1 3 5 7 270Suspended recoverable (Mg/L) 12 0 10 55 220 6,300manganese.
Total recoverable manganese (Mg/L) 12 30 37.5 70 192 6,400Dissolved manganese (Mg/L) 20 6 11 20 57 60Total recoverable zinc (Mg/L) 12 20 30 40 70 1,100Suspended total gross alpha (pCi/L as 1 1.0 1.0 1.0 1.0 1.0
U-nat).Dissolved gross beta (pCi/L) 3 <20 NA NA NA <29Suspended total gross beta- (pCi/L) 3 .4 .4 1.8 3.4 3.4Dissolved radium-226, (pCi/L) 3 .1 NA NA NA .2planchet count.
Dissolved natural uranium-- (Mg/L as U) 3 8.9 8.9 12 15 15Dissolved gross alpha (Mg/L) 3 <44 NA NA NA <6lSuspended total gross alpha (Mg/L) 3 <.4 NA NA NA 2.8Total cyanide (mg/L) 11 .01 NA NA NA .01Suspended sediment (mg/L) 24 10 43 116 424 22,000
107
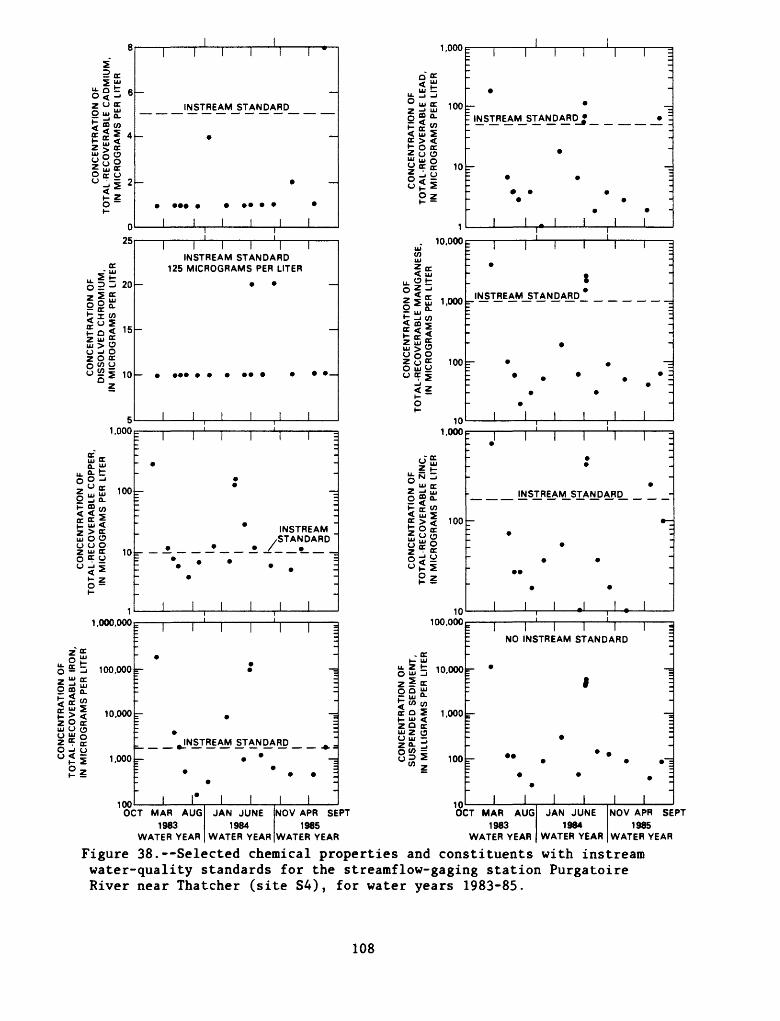
CO
NC
EN
TR
AT
ION
OF
TO
TA
L R
EC
OV
ER
AB
LE
IR
ON
» 2
H.
tu
oo
<
ft
Cre
re
^
*i
n re
o
j
re
c oo
>
H«
1 3>
Q "
H ft
CO
<
^
p-v
- re
>
£*
.- f
3
«o
rt n
$
j_
p-
to
ft
>
>re
p
re
H
^ z
»-»
CL
CL
2 S
fio>
2
*~
^
*<
*">
m
Z
CO
CL
P"
>
mH
- W
re
3D
rt
g
>
- z-
fD
hh
H
- <
o
on.
<C
O
^1
0>
m -
>
**
>-J
^ S
5'--' ft
-< S
=0
1*
||[J
* ^J
HI
ro ^
£ 52
. .
,-.
3D
mrh
O
-o
O
W
*t
f H
-
^i rt
re
O
ft
>1oo
c
re
rtrt
g
re
' re
M
I co
O
0)vs
C
p
re
i CL
to
00
*i
to
nW
00
OH.
p
05(-
p
co
nV
OO
O
ft
$
H
00
H-
>
to
en
rt
z| -
5
(_
* r"«
m
CO
^
ft
p
3 S
3D
oo t
u re
^2
5<-
" rt
p
S
>
. H
. ft
>
£
0
en
30
£
*«
<
c_
P
rt
H ^ 2
n
p-
3 «
,00
^f c
0»
H-
S
2
ft
P
>
m
O
W
3D
S' S
$ §
re
re
> <
CB
in -*
S3
5» ^
(? ^
m
3D
m
IN M
ICR
OG
RA
MS
PE
R L
ITE
R
p
I
\
\ '§ l|
'
3
z
* r
i iiin
nl
Ii iiiin
il
i ii n
ull
i lim
n
CO
NC
EN
TR
AT
ION
OF
S
US
PE
ND
ED
SE
DIM
EN
T,
IN M
ILLIG
RA
MS
PE
R
LIT
ER
P
I
§~"
8
8
< o
o
ii
IIM
IIII
i IIIIIM
I i
iin
llii
i iiin
li
: §
tl
H
m
1 3-
z
o_
* > 3
i i
i mill
i
i in
iyl
i iii
mil
i i
i nil
* I I. A 3 5 c 1
CO
NC
EN
TR
AT
ION
OF
T
OT
AL
RE
CO
VE
RA
BLE
CO
PP
ER
, IN
M
ICR
OG
RA
MS
PE
R
LIT
ER
3
§
I1
1 1
1 1 II
I)
1 IIIH
III
1 1
1 1
1 III
\
H2
, ,
, ,,, !
°,
, ,,,, !
, ,
, ,M
,I
CO
NC
EN
TR
AT
ION
OF
TO
TA
L R
EC
OV
ER
AB
LE Z
INC
, IN
MIC
RO
GR
AM
S P
ER L
ITE
R
o
I>
0
C
*
Z
CO
3D m
2
i H
_
1 Oi
3
C
* 1 C
CO
NC
EN
TR
AT
ION
OF
D
ISS
OL
VE
D C
HR
OM
IUM
, IN
M
ICR
OG
RA
MS
PE
R L
ITE
R
-
-
M
l>n
o
w
o
u1
1 1
M
W
- :
il--
Q >
m 2
r; 3
D
m 3D
*
1 1
CO
NC
EN
TR
AT
ION
OF
TO
TA
L-R
EC
OV
ER
AB
LE M
AN
GA
NE
SE
, IN
MIC
RO
GR
AM
S P
ER L
ITE
R-
c
->
o
c;
i 8
sz
H
3D
.
i CO
_
z
_
J> 3D
-
.^
n c
* 5 I
-
CO
NC
EN
TR
AT
ION
OF
T
OT
AL
R
EC
OV
ER
AB
LE
CA
DM
IUM
, IN
M
ICR
OG
RA
MS
PE
R L
ITE
R
3
KJ
*
O)
a
1 1
1
3D m ^
2 H
-
>
lo
3D
O
III*
CO
NC
EN
TR
AT
ION
OF
T
OT
AL
-RE
CO
VE
RA
BL
E L
EA
D,
IN M
ICR
OG
RA
MS
PE
R L
ITE
R t
3 i
1-'"
7 '"i"
1."":
* *
i* ,Hi
' >
. j! I3
D £ ,
i
i 1 I 1.
i i
i i
i ml
i i
i 1 1
ml
i i
i in
n
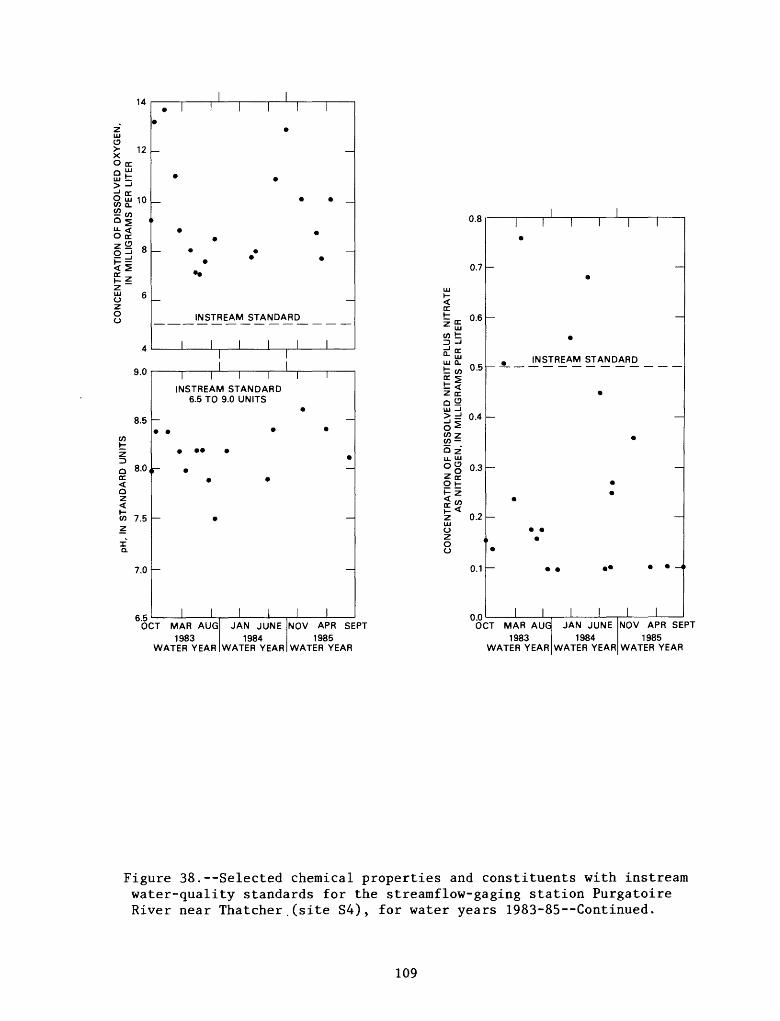
pH
, IN
S
TA
ND
AR
D U
NIT
S
H-
03
00<
ft
P n>
fD n
^
^
fDI P
00
H-
IH
ft
02P
"*<
3
fD03
h-
1ft
W
fDn
rt
np-
03
rtfD
P
fD
h(
CL
CL
03
oT
C
L p
-H
- W
fD
rt
3fD
H
i H
-o
nc/>
n
03
CO
NC
EN
TR
AT
ION
O
F D
ISS
OL
VE
D O
XY
GE
N,
IN M
ILLIG
RA
MS
PE
R L
ITE
R
Oa
O
$
H
~* -«
2
^ C
D ^
^S
sm
>
>
C
>
^H-
>m
to
z
31 g
o5
*i
33
m
I
oH
*"
m -
33
50 >
<c
n
^m 3
U
) "
m T
O
n io
b
i o
ai
c
1 1
*l
1
_
5
V)
01 ii
H ^
* 22 £3
U)
il-
HO D
9
-
II
1
5 4^
O
) 00
O
NJ
*
| 1
'I
1 '
^
^
,
»
_
*
».'
W)
~
3
~~31 m
>
-2
3 >~
Z
~5
31
-
D
.
.
»
1 1
1
n
rt
n>
fD
rt03
03
H
-rt
3
n>n>
H
I w
»i
i-J
O
03«
J C
P
fD
I
CL
03
00n
03
oW
00
O
H-
P
I >
P
W
VO
OO
ft
00
H
-oo
w
rt
i
rt
p00
03
fD
t-n
rt
pI
H-
I O
O
Po £
3
^0
rt
p
rt
H-
n
p-
p o
oP
03
fD
rt
pC
L O
OT
H
- rt
fD
fD 03 3ft
cn
CO
NC
EN
TR
AT
ION
OF
DIS
SO
LV
ED
NIT
RIT
E P
LUS
N
ITR
AT
E
AS
NIT
RO
GE
N,
IN M
ILLIG
RA
MS
PE
R L
ITE
R
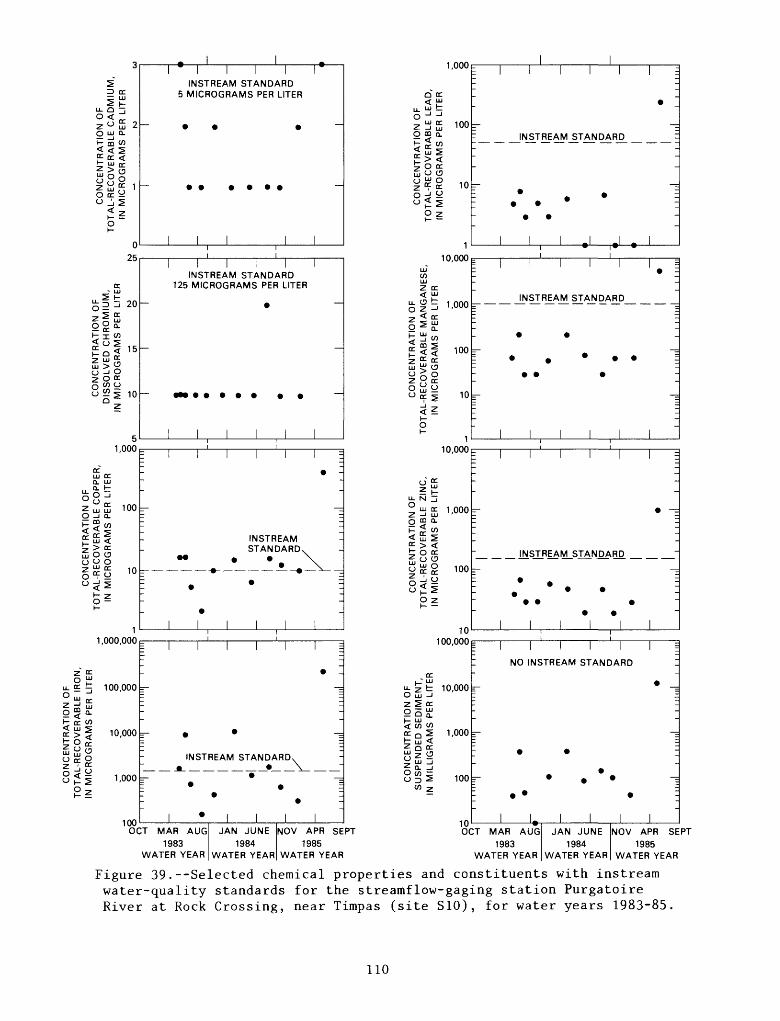
CO
NC
EN
TR
AT
ION
OF
T
OT
AL
-RE
CO
VE
RA
BL
E
IRO
N,
IN M
ICR
OG
RA
MS
PE
R
LIT
ER
P-
03
CD
CD I
03
ft
CD
O
P-
n rt
o
wI-J
ftO
03
w
pen
CL
05
o03
»-S
»-
!ft
H
13
P-
CD
00 »-! CO I I C/3 CD p-
1 CD n CD CL n tr
ro 3 p-
n 03
88
CO
NC
EN
TR
AT
ION
OF
TO
TA
L-R
EC
OV
ER
AB
LE
CO
PP
ER
,IN
M
ICR
OG
RA
MS
PE
R
LIT
ER
8
CO
NC
EN
TR
AT
ION
O
FD
ISS
OLV
ED
C
HR
OM
IUM
,IN
MIC
RO
GR
AM
S P
ER
LIT
ER
CO
NC
EN
TR
AT
ION
O
FT
OT
AL
-RE
CO
VE
RA
BL
E C
AD
MIU
M,
IN M
ICR
OG
RA
MS
PE
R L
ITE
R
^ i
5
03 >
"
00
33
m
>^
C.
33
O
H
^m
*
< 2
cm
z
>
m33 <
Z
<
O>
<
33
<°
>
-< w
33
m 33
rn
i
i i i
nn "
_
i M
inn
i
i i H
IM
_
Z I 33
m 2 r/
i
> Z*> 0
1 1
1 H
ill
Illl I
lll
1 1
1 M
ill
1 1
1 M
ill __ -
9 ~
1 I
1 1 I
lll
1 1
1 1
1 1 1
1
f_
_
'
" ~1
1 1
1 1 1
ll
1 1
1 1 1
1 1 1
' 0
WZ
>> W
* Z
33
*
1>
t O 1
1 1
1 1 I
II
1 1
1 1 1
1 II _ - ~~
1 1
1 M
1 II
1 1
_
i
S_
_
0
2 Z
_
O
H33
33
O
m
C7»
33 2
>
1"_
^*
mo
33 j>
c ^
m 33
1 1
zn w
33 H
> 2
2 w
CD H
-o>
m
Z
33 O Si
33
O
03
CO
NC
EN
TR
AT
ION
OF
SU
SP
EN
DE
D S
ED
IME
NT
,IN
M
ILLIG
RA
MS
PE
R
LIT
ER
en0
0
CO
NC
EN
TR
AT
ION
OF
TO
TA
L-R
EC
OV
ER
AB
LE
Z
INC
, IN
M
ICR
OG
RA
MS
PE
R
LIT
ER
CO
NC
EN
TR
AT
ION
OF
TO
TA
L-R
EC
OV
ER
AB
LE
MA
NG
AN
ES
E,
IN M
ICR
OG
RA
MS
PE
R
LIT
ER
o
03 n
^--'0
0
O
Oc
* P
. p
np
w
^
HP
oOO
ft
>
-,
O
P-
^ -
^
1-5
W
ft
33
oo
33^T
^
j
CO
?
03
fD
m
>>03
ft
P
>
cft
P-
ft
3>
0<
ro o
w <
t-s P
<
<_<
-«"
1 [
M
~*
_» 5
CD
C
ft
33 g
03
t-S
(3-
< *.
J=
»-s oo
ill
z
CO
03
P-
**
mrt
p
33i-
1 O
W
<
Z
V
D
P-
ft
<
9C
O
»-S
»-S
^
<co
ro
ro m
5 >
>I
03
33
00
Z,
00
3
<
W
33
(jl
m >
w33
m
o
8
8
gs
o
o
o
c1
1 1
1 1 II
I 1
1 1
1 1 M
l 1
1 1
1 M
III
1
1 1
1 1
1 II
'
z 0
I Z
*
-n_
m
_
*
2
w~~
>
~~
z
~~
33
~
~
0
_
_
0
1 1
1 1 Illl
1 1
1 1 M
il
1 1
1 1 M
ill
1 1
M
1 II
I
5 -
5 C
C 5
C1
1 1
1 1
1 II
£
-*
0
__
1 1
1 1
1 1 II
» C
3
C
3
C1
1 1
1 1
1 1 1
Z H 33 m 2 CD ^ Z 0 33
O
«
1 1
1 1
1 II
I
I g
5 C
l i
l 1
1 1
1 1 _
»
1 1
M
1 III
S - »
e
i i
i i m
i
- _
Illl M
M
5 I
11
1 1
1 1 M
il 1
1 1
1 Illl
1
0
*
*
_
0
£
^
i i
i mill
i
i i i
mi1
I1
I 1
1 1 II
I
z
_-\ 33 m 2
~
-\ z
~~o ^ 3
- 1
1 1
1 Illl
CO
NC
EN
TR
AT
ION
OF
T
OT
AL
-RE
CO
VE
RA
BL
E L
EA
D,
IN M
ICR
OG
RA
MS
PE
R L
ITE
R
o
I
ICO IS
1 1
1 1 1
1 II
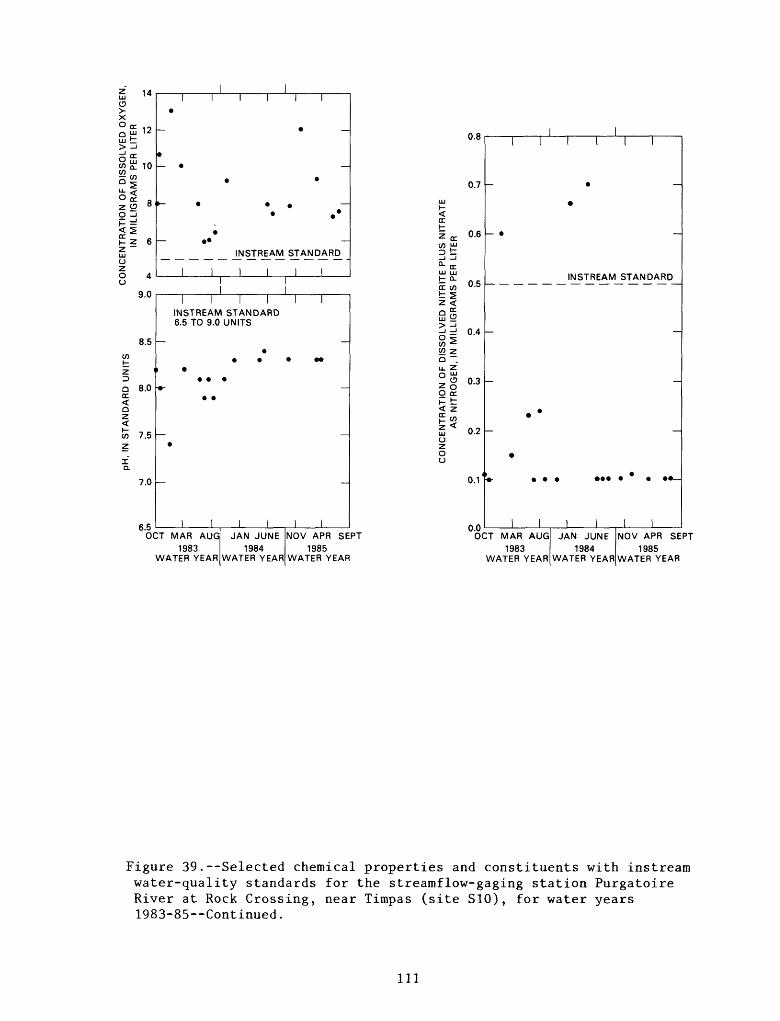
z 14UJ IH
ID
X
QLU 12
LU t > -I
O^W3 £ 10
U- <
zS 8
LU UzO 4u
9.0
8.5
C/3
Z
Q 8.0OC
QZ
wj 7.5
7.0
6.5
INSTREAM STANDARD
i i rINSTREAM STANDARD 6.5 TO 9.0 UNITS
OCT MAR AUG1983
WATER YEAR
JAN JUNE1984
WATER YEAR
NOV APR SEPT
1985 WATER YEAR
O ocK t< Z
0.8
0.7
0.6
0.5
.
t CL
oc <r>t 5z <agLU *-s
-> => 0.4O ^en ^C/3 Za ~
0.3
0.2
0.1
0.0
INSTREAM STANDARD
OCT MAR AUG1983
WATER YEAR
JAN JUNE 1984
NOV APR SEPT 1985
WATER YEAR WATER YEAR
Figure 39.--Selected chemical properties and constituents with instream water-quality standards for the streamflow-gaging station Purgatoire River at Rock Crossing, near Timpas (site S10), for water years 1983-85--Continued.
Ill
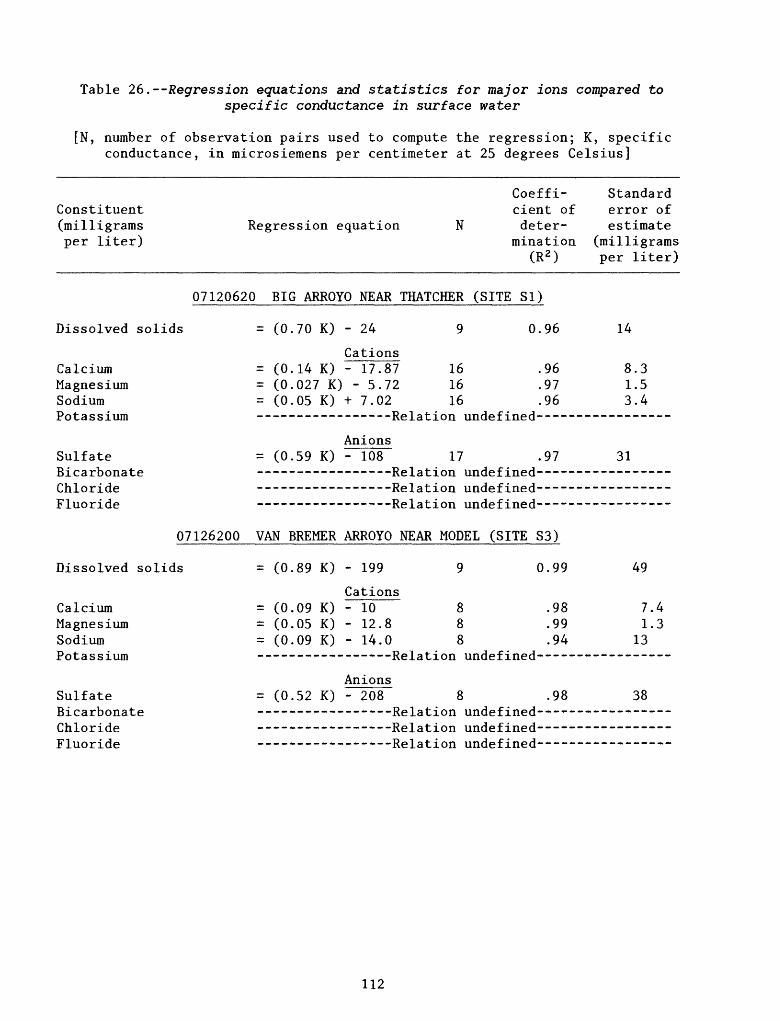
Table 26. Regression equations and statistics for major ions compared tospecific conductance in surface water
[N, number of observation pairs used to compute the regression; K, specific conductance, in microsiemens per centimeter at 25 degrees Celsius]
Constituent(milligrams per liter)
Coefficient of
Regression equation N deter mination
(R2 )
Standarderror ofestimate
(milligrams per liter)
07120620 BIG ARROYO NEAR THATCHER (SITE SI)
Dissolved solids
Calcium Magnesium Sodium Potassium
Sulfate Bicarbonate Chloride Fluoride
= (0.70 K) - 24 0.96
Cations(0.14 K) - 17.87 16 .96 (0.027 K) - 5.72 16 .97 (0.05 K) + 7.02 16 .96 ______ -------Relation undefined----
Anions (0.59 K) - 108 17 .97---------------Relation undefined--- _______________-Relation undefined- ___________ ---Relation undefined----
07126200 VAN BREMER ARROYO NEAR MODEL (SITE S3)
Dissolved solids
Calcium Magnesium Sodium Potassium
Sulfate Bicarbonate Chloride Fluoride
(0.89 K) - 199 9 0.99
Cations(0.09 K) - 10 8 .98(0.05 K) - 12.8 8 .99(0.09 K) - 14.0 8 .94._______«_______Re ]_ation undefined-----
Anions = (0.52 K) - 208 8
-Relation undefined--Relation undefined--Relation undefined-
.98
14
8.3 1.5 3.4
31
49
7.41.3
13
38
112

Table 26. Regression equations and statistics for major ions compared to specific conductance in surface water Continued
Coeffi- StandardConstituent cient of error of(milligrams Regression equation N deter- estimateper liter) mination (milligrams
(R 2 ) per liter)
07126300 PURGATOIRE RIVER NEAR THATCHER (SITE S4)
Dissolved solids = (1.02 K) - 279 22 0.99 81
CationsCalcium = (0.093 K) + 2.59 22 .93 22 Magnesium = (0.076 K) - 32 22 .97 12 Sodium = (0.083 K) - 24.8 22 .98 11 Potassium -----------------Relation undefined-----------------
AnionsSulfate = (0.65 K) - 254 20 .98 78 Bicarbonate -----------------Relation undefined-----------------Chloride = (0.012 K) - 6.6 20 .84 5.0 Fluoride -----------------Relation undefined-----------------
07126325 TAYLOR ARROYO BELOW ROCK CROSSING, NEAR THATCHER (SITE S5)
Dissolved solids = (1.04 K) - 294 6 0.99 72
CationsCalcium = Magnesium = Sodium = Potassium
Sulfate = BicarbonateChlorideFluoride =
07126485 PURGATOIRE
Dissolved solids =
Calcium = Magnesium = Sodium = Potassium
Sulfate = BicarbonateChloride =
(0.16 K) - 19 10 .99 (0.04 K) - 6.6 10 .92 (0.04 K) - 5.0 10 .85 ----------------Relation undef ined---------
Anions(0.61 K) - 118 10 .99._____. -________Re iat -[ on undef ined-- -----------------------Relation undef ined---------
(0.0003 K) + .06 9 .92
RIVER AT ROCK CROSSING, NEAR TIMPAS (SITE
(1.01 K) - 249 18 0.99
Cations(0.096 K) - 1.42 19 .96 (0.08 K) - 36.9 19 .98 (0.08 K) - 23.3 19 .98 ----------------Relation undef ined-------- -
Anions(0.66 K) - 268 19 .99 _________ _______Re i a t i on undef ined----- ----
(0.01 K) - 1.22 19 .93
8.6 8.4
12
55
.1
10)
64
16 10 10
59
2.6
113
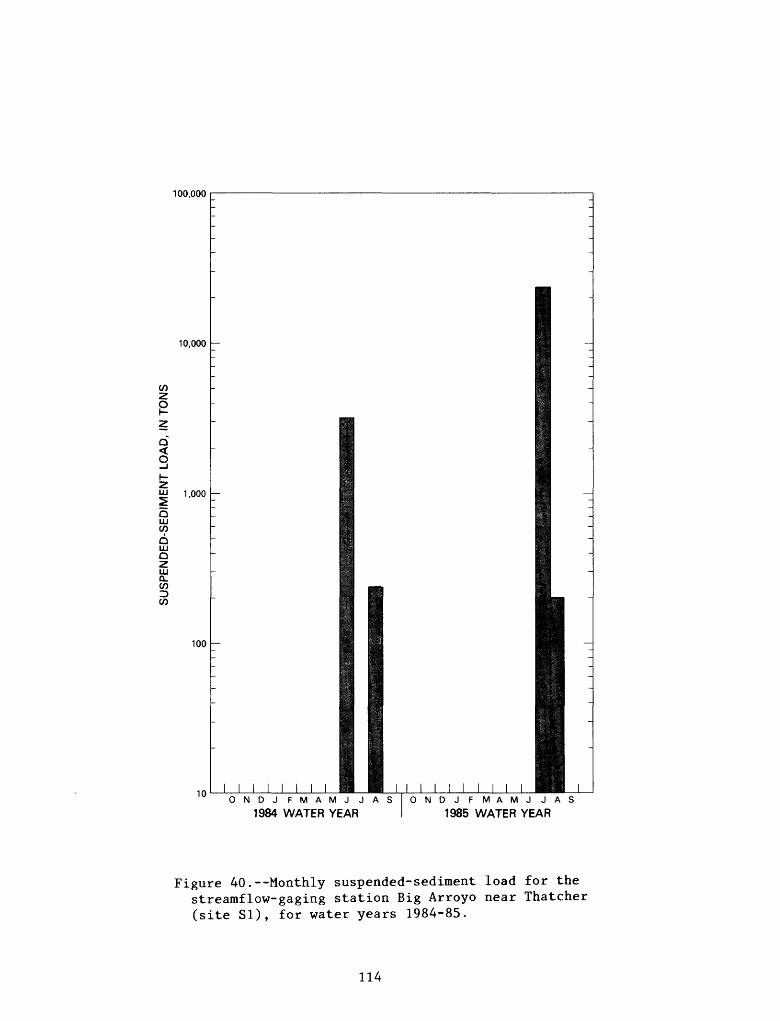
100,000
10,000
co
iQ<O
I-
Q HI COQ HI Q2111 Q. CO
CO
1,000
100
10NDJ FMAMJ JAS
1984 WATER YEARONDJFMAMJJAS
1985 WATER YEAR
Figure 40.--Monthly suspended-sediment load for the streamflow-gaging station Big Arroyo near Thatcher (site SI), for water years 1984-85.
114
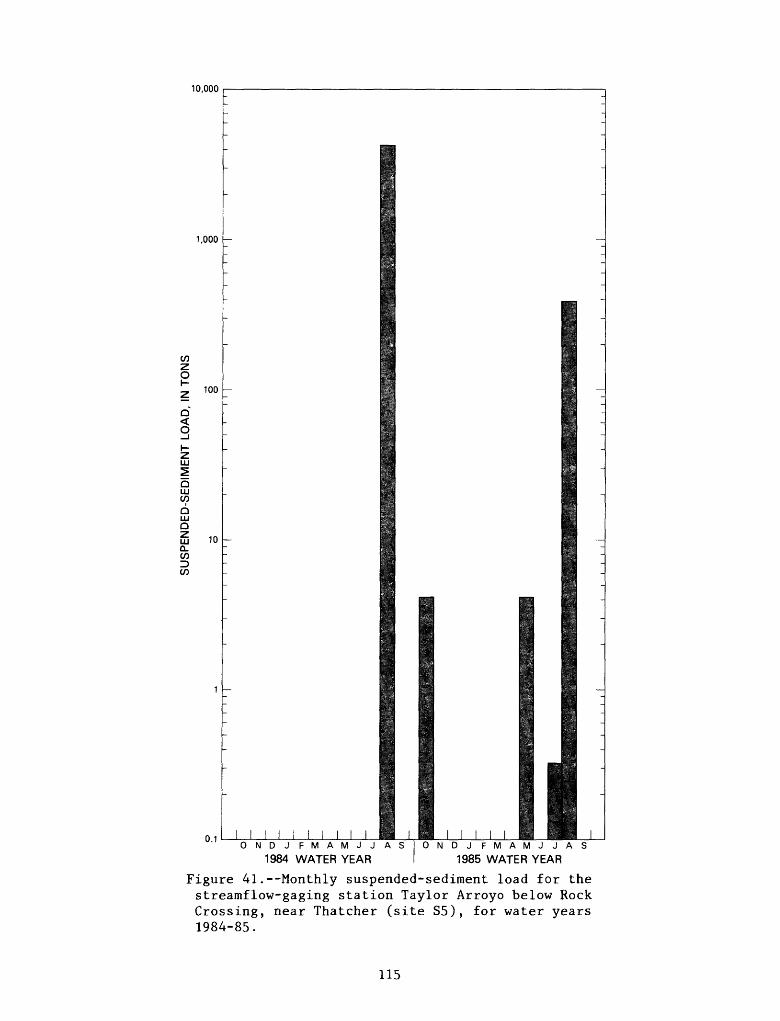
10,000
1,000
C/DzO
Q < O
00 QLUQ Z LU £L (/D D
100
10
0.1 I ONDJFMAMJJAS
1984 WATER YEARNDJFMAMJJAS
1985 WATER YEAR
Figure 41.--Monthly suspended-sediment load for the streamflow-gaging station Taylor Arroyo below Rock Crossing, near Thatcher (site S5), for water years 1984-85.
115
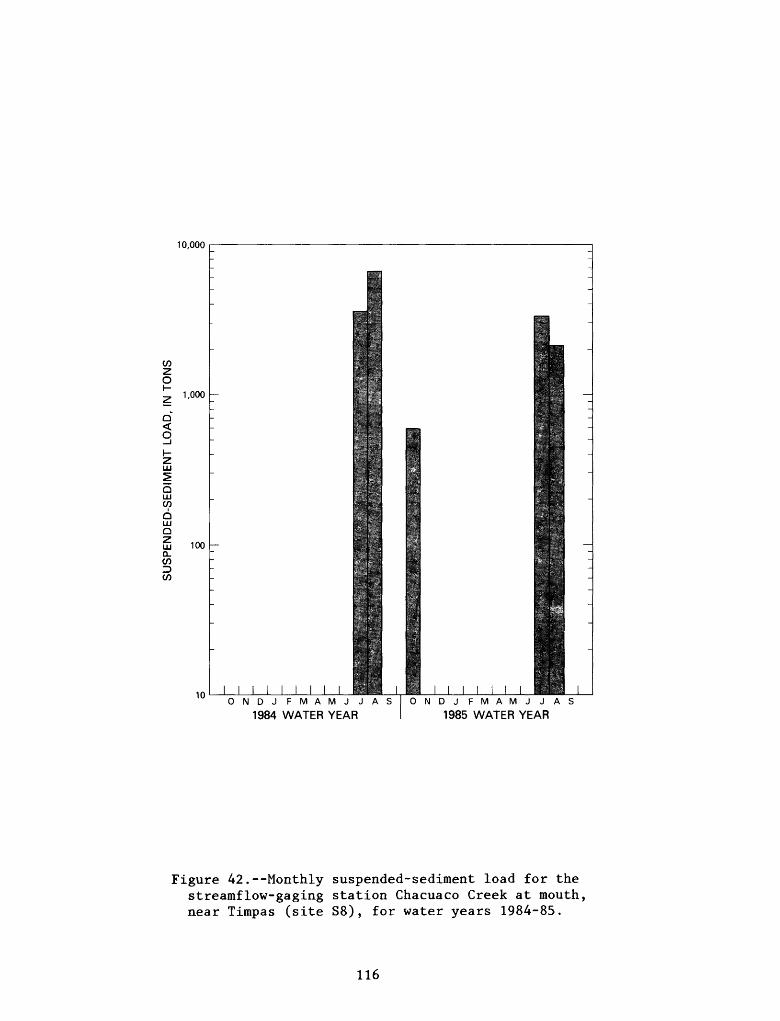
10,000
032o
Q < O
opQ LU Q
Q. 00D 05
1,000
100
10NDJFMAMJJ
1984 WATER YEARDJFMAMJJAS
1985 WATER YEAR
Figure 42.--Monthly suspended-sediment load for the streamflow-gaging station Chacuaco Creek at mouth, near Timpas (site S8) , for water years 1984-85.
116
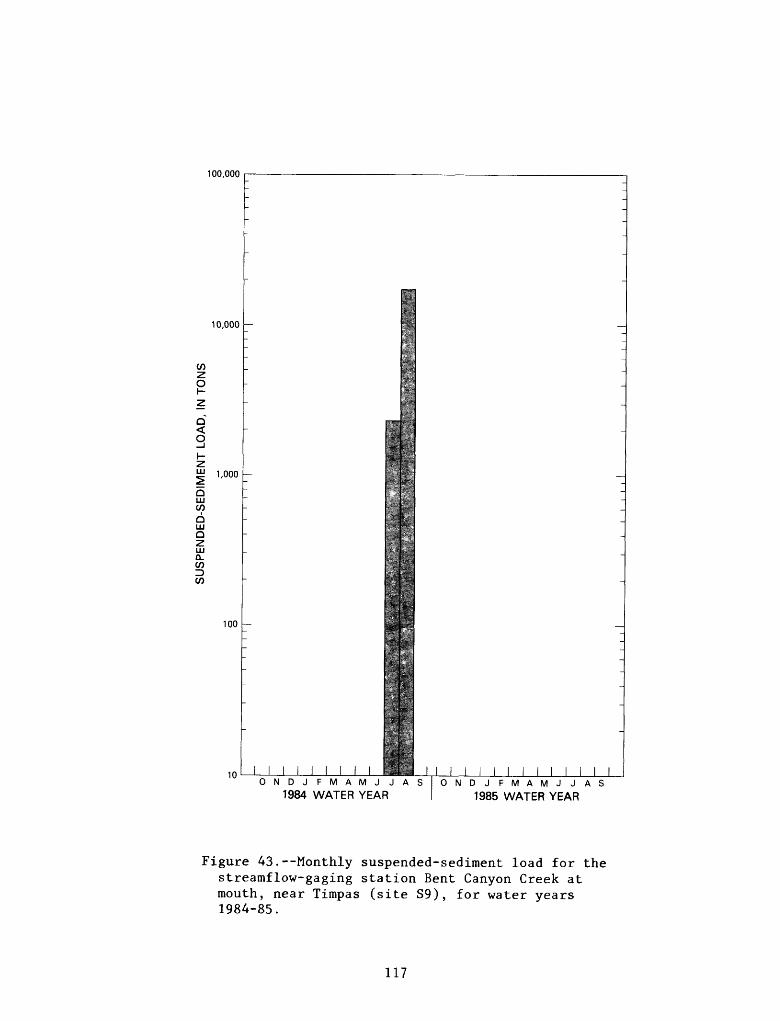
100,000
10,000
Q <
3H ZH 1,000
QUJ°? QUJQZUJa.
100
10ONDJFMAMJJ
1984 WATER YEARA S
LJ____I_____I I I I IONDJFMAMJJAS
1985 WATER YEAR
Figure 43.--Monthly suspended-sediment load for the streamflow-gaging station Bent Canyon Creek at mouth, near Timpas (site S9), for water years 1984-85.
117