i cm i · oidal and random vibration environments are not known, the current state of the art...
TRANSCRIPT

Tfc~(M-3Cn
Human Factors Boeing Wichita
A Comparison of Sinusoidal
and Random Vibration Effects on
' c -
• •.
<:.; CO CJ -.. Human
Performance
I i o
CO
I o
s
S. A\ f -4y
I
I CM
I i
k*T
Technical Report D3-3512-2 Contract NONR 2994(00) Office of Naval Research
\ .

f\\)-3d>\23\
Technical Peport No. 2
A COMPARISON OF SINUSOIDAL AND RANDOM VIBRATION EFFECTS ON HUMAN PERFORMANCE
Research Accomplished Under Office of Naval Research Contract Nonr 2994(00)
"Research On Lov Frequency Vibration Effects
On Human Performance"
By
Donald L. Parks HUMAN FACTORS UNIT
\
Principal Investigator J. E. Beaupeurt
THE BOKTNfi COMPANY Wichita Division
D3-3512-2 28 July 1961
Jrf AUG17 1961

-
D3-3512-2 Page 11
ABSTRACT
Ten male subjects performed a cor.plex task during vertical vibration in a preliminary study to compare performance with sinusoidal, constant period random amplitude, and random (air- craft turbulence) vibration. Performance on the three subtasks varied: performance on a tracking task with delayed control- display feedback was differently affected according to type of vibration; no affect was found for a tracking taBk without feed- back delay; and response time did not change.
Results were analyzed for consistent trends in vibration effects which could be correlated with mechanical and psycho- logical definitions of vibration for evidence of a human perform- ance transfer function for vibration. Psychological and amplitude bases for this function could not be found, vibration accelera- tion (g) effects were not clear, and R'S amplitude power was correlated with constancies in performance. It was suggested that testing combinations of RJ-E and frequency (and related factors) could lead to a performance transfer function permit- ting transformation of human performance data from sinusoidal to operational vibrating environments.
i
Document Number D3-3512-2 reports the 6econd experiment of a series designed to study vibration effects on human performance. Other experiments will be reported sequentially in the document series D3-3512-1 through D3-3512-7. All results will be inte- grated and summarized in D3-3512-0.
Test Design & Conduct
Report
Supervised
Approved
Approved
J. E. B&aupeurt Unit Chief

,
D3-3512-2 Page 111
TABLE OF CONTENTS
Page
Title Page 1
Abstract 11
Table of Contents ill
List of Figures iv
References v
Introduction 1
Summary 3
Conclusions k
Methodology 5
General 5
Subjects 7
Apparatus 7
Test Procedures 12
Results 15
Data 15
Subject Reports 23
Discussion 2k
Appendices
A - Instructions to Subjects 27
B - Individual Data 29
Acknowledgement 3^

••
D3 -3512-2 Page iv
LIST OF FIGURES
Page
1. Power Spectral Density Curves Shoving a Comparison Between Aircraft PSD and Approximations Used for Test Conditions. ... 6
2. Panel Display - Control Column Arrangement 11
3. Summary of Relative Change in Performance 17
h. Performance Comparisons for Vibration Conditions with Approxi- mately Equal Mean Amplitude 18
5. Performance Comparison for Sinusoidal Vibration Conditions Judged Approximately Equal . 19
6. Comparison of Task Performance for Vibration Conditions with Approximately Equal RMS Amplitude Power 20
7. A Comparison of Task Performance with Different PSD Approximations 21
LIST OF TABLES
Page
I. Definition of Vibration Conditions Used and Basis for Comparison 8
II. Latin Square Presentation of Test Conditions. ... 9
III. Sequence of Experimental Conditions 13
IV. Results of Statistical Analysis .... 22

•
D 3.3512-2
Page v REFERENCES
a. Boeing Document D3-3512-1, "Human Reaction to Lov Frequency Vibration, D. L. Parks, ? December i960
b. Boeing Document D3-3301, "Boeing Human Vibration Facility," 23 September i960
c. Boeing Document D3-H89, "Preliminary Study of Aircrew Tolerance to Low Frequency Vertical Vibration," R. B. Gorrill and F. W. Snyder, 3 July 1957.
d. Design and Analysis or experiments in Psychology and Education, 1956, The Riverside Press, Mass.
e. Experimental Design in Psychological Research, 1953» Allen L. Edwards, Rinehart & Co., Inc., New York.
.
'
V

D3-3512-2 Page 1
INTRODUCTION
Sinusoidal vibration has been known to affect human performance and resulting man-machine capability for some time (reference 6). Analysis of the problem suggests that at least two design considerations could be used effectively to optimize human performance: (l) proper display-control selection, and (b) air frame design to control effects of vibration on human capability. However, the quantity of data available for these deci- sions is limited. That data which is available must be applied with reservation since- it was derived under conditions of sinusoidal vibration. No way to adequately relate 6uch data to operational conditions in the form of conversion factors has been determined, although it is strongly suspected that a common relationship between the two does exist.
Since proper conversion factors relating human information for sinus- oidal and random vibration environments are not known, the current state of the art offers two approaches to design decisions pertinent to expected human performance during vibration. One approach is to apply data derived during sinusoidal vibration, not knowing how interactions of frequency and amplitude may affect performance. The other is to simulate the vibration expected for each new equipment design and derive appropriate performance measures. Actually, neither of these approaches is considered an adequate solution to design problems. The reservations that must be attached to the first can seriously affect optimum design of a man-machine system. The second approach is economically undesirable since performance test6 with a new vibration environment for each new vehicle would be required. A con- version factor would permit the transforming of human performance data from one vibration environment to another. This would lead to more efficient data collection with sinusoidal vibration and direct application of the results to any defined random vibration environment.
This study was designed to explore another possibility,using both sinusoidal and random vibration, to seek relationships that could eventu- ally result in definition of a conversion factor for human performance from sinusoidal to random vibration. Several conditions were defined for which vibration could be equated on selected bases, and an interim vibration (constant period random amplitude vibration) was added between the sinus- oidal and operational vibration environments, from the hypothesis that it could help clarify parallel trends. If trends toward consistent performance could be found for any of these vibration conditions, a study program oriented toward identifying performance conversion factors (or a transfer function) could be more clearly defined. The preliminary data reported here would also promote a clearer understanding of the reservations that must be attached to use of available data.
I

; :
I
D3 -3512-2 Page 2
The baces for equating or comparing vibration in this study Included:
1. Representative subjective judgment of vibration severity (refer- ence a).
2. Equal mean amplitude.
3. Equal root mean square (RMS) amplitude power (equal to selected portions of the power spectral density (PSD) curves describing aircraft vibration).
k. Differing amplitudes for the same vibration wave form.
Pull recognition was given the fact that the complex experimental design used, combined with the relatively small amount of data collection possible, could lead to difficulties in adequate statistical analysis. However, it was anticipated that sufficient data would be collected to determine trends in performance changes and to adequately analyze the variables for a more sophisticated study.

D3 -3512-2 Page 3
SUMMARY
A preliminary experiment was conducted in the Boeing human vibration facility to examine the correlation, if any, between certain physical descrip- tions of vertical vibration and comparability of human performance data. It was logical to suspect the existence of some factor which would permit extrapolations of expected performance from one vibration environment to another. This experiment serves as a preliminary step in determining the possibility of a transfer function for such applications.
A power spectral density (PSD) description of vibration was used to simulate vertical aircraft turbulence in the vibration facility. Those frequencies found to have the most relative power in the PSD function were selected as most apt to affect performance on the basis of having the greatest amount of recurring acceleration, and most apt to permit compari- sons of performance from sinusoidal to PSD vibration. The frequencies selected, 0.75 cps and 2.5 cps, defined the number of repetitions per second (or the period) for sinusoidal and random amplitude vibration conditions to be used in this test.
The three vibration conditions selected permitted study of performance with vibration equated according to (a) equal root mean square (RMS) ampli- tude power; (b) subjective equality; or (c) equal mean amplitude. Of the comparisons provided with this selection only RMS could be described as a physical parameter with comparable effects on human performance for dif- ferent vibration conditions, although other correlations could exist. Other comparisons resulted in significantly different performance capability between conditions which eliminated the particular condition as a potential basis for a transfer function. There is evidence to suggest that a mathe- matical function providing for an interaction of RMS amplitude power and frequency would significantly increase understanding of correlative factors and permit transferring data from one vibration environment to another.
A complex task consisting of three subtasks was performed by ten sub- jects during vibration for each experimental condition (PSD, 0.75, and 2.5 cps vibration). Only one subtask, which required the subjects to antici- pate display position of control-display feedback delay, was differentially affected. A tracking task without feedback delays and with color coding was not differently affected by different vibration conditions, nor was the third task which measured response time. Hence there are questions to be answered about quantity and degree for a transfer function. Precision of the measures used may be an added significant variable in studying effects of vibration on the wide range of human perceptual-motor skills.

<
D3 -3512-2 Page k
The large number of vibration frequencies and accelerations randomly present in an operational human environment puzzles systems designers trying to extrapolate and apply human capability data from the single frequency sinusoidal vibration used in laboratory studies. Engineers have discovered a way to perform this function for equipment but data leading to similar application of data for operators is nonexistent. The need for information of this nature led to this study to determine feasibility of similar trans- fer functions for human performance. A demonstration of feasibility could then open up a new area in the field of human vibration research and facili- tate the best application of data by design engineers.
CONCLUSIONS
1. There is evidence that transfer functions vill permit extrapola- tion of performance data from sinusoidal to random vibrating environments. From vibration conditions used in this study, equal RMS amplitude pover equivalence is one possible physical description of vibration leading to a conversion factor for human performance capability. A mathematical combina- tion of RMS and frequency is the most promising possibility from the tested conditions for comparisons of human performance.
2. Vertical vibration amplitude varied considerably at certain fre- quencies with relatively small effects on performance in terms of a transfer function.
3. More extensive testing of these and other task and vibration rela- tionships is necessary to clearly define the correct physical basis for trans- forming data from one vibration environment to another. A wider frequency and amplitude range than used for this study is necessary with simple but precise performance measures known to have minimum variation between subjects since performance measures must be made with vibration as the only independent variable.
4. Transfer relationships may be found to differ for various perceptual- motor capabilities.
RECOfrMENDATIONS
A program is required to define performance conversion factors for confi- dent and accurate application of human vibration data to operational vibration environments. The research described here demonstrates the feasibility of the concept and the need for further study to accurately define a performance transfer function for vibration.
The feasibility of obtaining additional transfer functions for converting basic data from the ideal, nonvibrating environment to operational conditions also requires investigation.
n
Waj&OMtB ttMBW/77J7B
D3 -3512-2 Page 5
METHODOLOGY
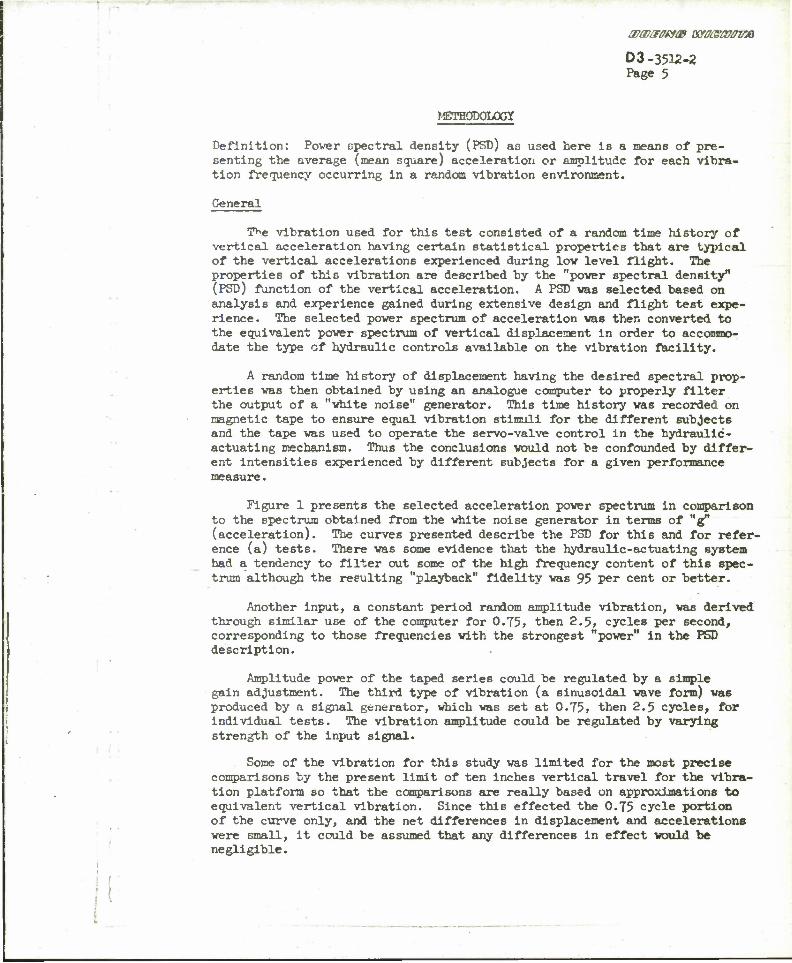
Definition: Power spectral density (PSD) as used here is a means of pre- senting the average (mean square) acceleration or amplitude for each vibra- tion frequency occurring in a random vibration environment.
General
T*e vibration used for this test consisted of a random time history of vertical acceleration having certain statistical properties that are typical of the vertical accelerations experienced during lov level flight. The properties of this vibration are described by the "power spectral density" (PSD) function of the vertical acceleration. A PSD was selected based on analysis and experience gained during extensive design and flight test expe- rience. The selected power spectrum of acceleration was then converted to the equivalent power spectrum of vertical displacement in order to accommo- date the type of hydraulic controls available on the vibration facility.
A random time history of displacement having the desired spectral prop- erties was then obtained by using an analogue computer to properly filter the output of a "white noise" generator. This time history was recorded on magnetic tape to ensure equal vibration stimuli for the different subjects and the tape was used to operate the servo-valve control in the hydraulic- actuating mechanism. Thus the conclusions would not be confounded by differ- ent intensities experienced by different subjects for a given performance measure.
Figure 1 presents the selected acceleration power spectrum in comparison to the spectrum obtained from the white noise generator in terms of "g" (acceleration). The curves presented describe the PSD for this and for refer- ence (a) tests. There was some evidence that the hydraulic-actuating system had a tendency to filter out some of the high frequency content of this spec- trum although the resulting "playback" fidelity was 95 per cent or better.
Another input, a constant period random amplitude vibration, was derived through similar use of the computer for 0.75, then 2.5, cycles per second, corresponding to those frequencies with the strongest "power" in the PSD description.
Amplitude power of the taped series could be regulated by a simple gain adjustment. The third type of vibration (a sinusoidal wave form) was produced by a signal generator, which was 6et at 0.75, then 2.5 cycles, for individual tests. The vibration amplitude could be regulated by varying strength of the input signal.
Some of the vibration for this study was limited for the most precise comparisons by the present limit of ten inches vertical travel for the vibra- tion platform so that the comparisons are really based on approximations to equivalent vertical vibration. Since this effected the 0.75 cycle portion of the curve only, and the net differences in displacement and accelerations were 6mall, it could be assumed that any differences in effect would be negligible.

•
a?a){rffM& oowsmrvx
0.1
.01
.001
•
.0001
.00001
D3-3532-2 Page 6
Actual PSD. Representative of recorded verti- cal aircraft vibrations.
— First approximation to actual PSD, used as a regular experimental condition of this test.
— —Second approximation to actual PSD, used for vibration environment, vltb data to be com- pared to the first approximation.
Figure 1. Power Spectral Density Curves Showing a Comparison Between the Aircraft PSD and the Approximations Used for Test Conditions

D3-3512-2 Page 7
Table I defines the vibration variables and Indicates those compari- sons which could be readily made. RMS values recorded in the table are equivalent to the RMS from the PSD description. The test conditions defined in Table I were selected purposely to obtain the desired compari- sons for trend analysis. In reviewing possible ways of obtaining the desired information, a Latin Square statistical model appeared to be most efficient for data collection and analysis since a wide variety of infor- mation was desired in a short time and some logical method of mixing the different experimental conditions to counterbalance varying effects was desirable. The Latin Square selected had the normal restriction (refer- ence e), i.e., a condition did not occur twice at the same position in a sequential order. An added restriction for this te6t was that no sequence of two experimental conditions wa6 repeated in the matrix, thus averting the possibility of a repetitive sequence influencing the results.
The Latin Square indicating the order of presentation per subject is presented in Table II. Since the sessions were too long for a full series on one day, data were collected during two sessions spaced one week apart. Data for the second PSD approximation (figure l) was collected after «n the Latin Square conditions were completed.
Subjects (Ss)
Ss were ten Boeing-Wichita employees who had volunteered for human vibration studies, had completed the first experiment (reference a) of a series of studies, and who had prior nonvibration experience on the task. The same conditions as in reference a apply here, e.g., Ss passed a compre- hensive physical examination to qualify for testing; a brief examination was completed before and after each test; and two wire mesh contacts for an electrocardiograph (ECG) system were placed on the pectoral (chest) muscles and held in place during tests by wrapping the chest with an elas- tic bandage. A third ECG contact was placed behind the ear and held in place with collodian. All Ss wore flight coveralls and street shoes for the test.
Apparatus
The Boeing-Wichita human vibration facility (reference b) was used to provide the vibration environment for this test. A standard aircraft seat mounted to the platform was reinforced to ensure the most complete transmission of vibration to the subject. Reinforced plywood inserts covered with 3A inch hard felt were used in place of normal aircraft cushioning for three reasons in addition to ensuring complete transmission of vibration. One reason was to obtain baseline data under conditions that can be readily repeated for future comparative studies (such as a continuation of those described here or investigating a new seat design or cushion) with a more limited sample. Another was to permit direct

D3 -3512-2 Page 8
TABUS I
DEFINITION OF VIBRATION CONDITIONS USED AND BASIS FOR COMPARISON
(Each column of checkB indicates that performance can be compared on the basis indicated by the column heading. For example, conditions 2, 3 and 8 can be com- pared for approximately equal RMS at 0.75 cps, as can conditions 2, 6 and 9 for 2.5 cps.)
Experimental RMS Mean Displacement Subjectively Vihration Condition Equivalent Approximately Equal Similar or Equal
0.75 2.5 0.75 2.5 cps cps cps cpa
1. \ Amplitude PSD 2. Full Amplitude PSD X X 3- 0.75 cps, k.2Sn Mean,
Double Amplitude Randan X h. 0.75 cps, 1.7 RMS/
Amplitude Random I X 5- 2.5 cps, 2.16" Mean,
Double Amplitude Randan ! X 6. 2.5 cps, .09 RMS,
Amplitude Random x i 7. 0.75 cps, 1.57" Double
Amplitude Sinusoidal 0.75 cps, U.52" Double Amplitude Sinusoidal
I
I
3.
(1.6 RMS) X X X 9- 2.5 cps, .26" Double
Amplitude Sinusoidal (.09 RMS) x
10. 2.5 cps, 1.08" Double Amplitude
X 1
As indicated In the right hand column, all conditions are defined by double amplitude or RMS amplitude. Conditions 1 and 2 indicate PSD, 3-6 constant period random amplitude/conditions, and 7-10 sinusoidal conditions. Selection of these condition i vas based on desired comparisons, indicated In remaining columns.
Full amplitude PSD refers to vibration as described by PSD 1 (Figure 1.). One-half amplitude PSD is the same condition with all amplitudes smaller by one-half. Conditions 3-6 are cyclic in nature, hence the term cps, but feature random amplitudes with means as identified. Since RMS also defines means, the associated mean amplitude is not indicated unless it is required for another type of comparison.

D3-3512-2 Page 9
TABLE II
LATIN SQUARE PRESENTATION OF TEST CONDITIONS
DAYS
1 2
ORDER 1 2 3 1+ 5 6 7 8 9 10
SUBJECT 1 1 2 3 k 5 6 7 8 9 10
2 2 4 1 6 3 8 5 10 7 9
3 3 1 5 2 7 4 9 6 10 8
U k 6 2 8 1 10 3 9 5 7
5 5 3 7 1 9 2 10 4 8 6
6 6 8 k 10 2 9 1 7 3 5
7 7 5 9 3 10 1 8 2 6 U
8 8 10 6 9 k I 7 2 5 1 3
9 9 7 10 5 8 1 3 6 1 1* 2
10 10 9 8 7 6 J 5 U 3 2 1
The Latin Square, indicating the order of experimental vibration conditions under which S vas required to perform. The entries vithin the matrix identify conditions which are defined below.
1. | Amplitude PSD 2. Pull Power PSD 3. 0.J5 Period Random Aciplitude, U.26 Inches DA Maximum k. 0.75 Period Random Ariplitude, 1.7 RMS 5- 2.5 Period Random Amplitude, 2.l6 Inches Maximum 6. 2.5 Period Random Amplitude, .09 RMS 7. 0.75 cps 1.57 Inch DA 8. 0.75 cps 1.6 RMS 4.52 Inches DA 9. 2-5 cps .09 RMS .26 Inch DA
10. 2.5 cps 1.08 Inch DA

- *
D3 -35^-2 Plage 10
betveen-subject comparisons of performance data throughout this program on the basis of specific vibration intensities at the seat. The third was to avoid introduction of data confounding by a seat with a complex vibration absorption pattern (reference c, page 17; responding differently to dif- ferent Ss1 weight.
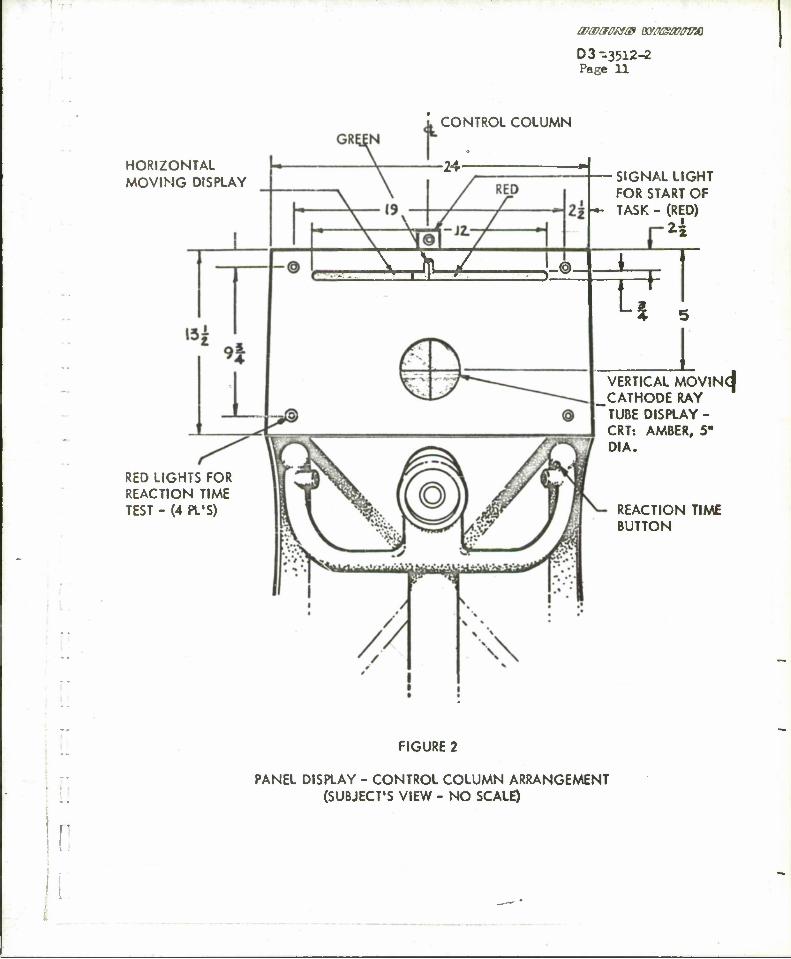
Also on the platform were a large aircraft control column, wheel, and a special test display panel (figure 2). The display panel, mounted in front of the subject and control column on the platform, was sloped at an angle of 10 degrees from the perpendicular with the lower edge nearest S. The panel was approximately 28 inches in front of the subject with the central display located 10 degrees below the horizontal line of sight for an average individual (some variation in this relationship was introduced by different subject heights). The control column was modified by the addition of a cutoff switch on the left hand grasp and a thumb button on the right hand grasp. Releasing the cutoff switch would stop vibration immediately, while pressing the right thumb button would turn off signal lights on the panel display. Rotary movement of the control wheel required forces of 0 to 10 pounds for * 65 degrees of movement. For control column fore and aft move- ment, the forces were 0 to 6U pounds for aaadM forward displacement of l\ inches, and 0 to 84 pounds aft for 9? inches maximum displacement. The force increase was essentially linear up to the maximum column displacement with the increase in required force determined by a spring constant.
The display panel included three testing components (figure 2). The central display was an amber cathode ray tube (CRT) upon which a moving display (O.06 inch wide), somewhat similar to horizon situation or a type of terrain avoidance display, was shown. A horizontal (0.02 inch wide) scribed line could be taken as representing an aircraft and the parallel cathode ray tube (CRT) displayed moving line as portraying a "horizon." Fore and aft control column movement would align the CRT saving line (here- after called the vertical or vertically moving line) with the scribed line. A two-second time constant for delayed display-control feedback similar to that found in an aircraft was included, that is, the vertically moving line would not respond immediately to control action. Also similar to aircraft control systems was the relation betveen control column and display movement, i.e., forward column movement was necessary to bring the iuo/ing line up to the scribed line and vice versa.
Above the CRT iisplay was a horizontal slot through which a visible (vertical) light beam vas seen as moving left or right as the wheel was turned clockwise or counterclockwise, respectively (an analogous relation- ship would be driving to a point on the horizon). Ss were to try to keep the moving beam aligned with a scribed line in the middle of the display. As a control aid this display was color coded so that the light beam was red when gross errors occurred and green when errors were minor, with correct performance indicated when the beam was aligned with an etched line. The
r
•
D3 -3512-2 Page 11
HORIZONTAL MOVING DISPLAY
RED LIGHTS FOR REACTION TIME TEST - (4 PL'S)
CONTROL COLUMN
24-
... \ E
SIGNAL LIGHT FOR START OF TASK - (RED)
V I
VERTICAL MOVINCJ CATHODE RAY TUBE DISPLAY - CRT: AMBER, 5" DIA.
REACTION TIME BUTTON
In
FIGURE 2
PANEL DISPLAY - CONTROL COLUMN ARRANGEMENT (SUBJECT'S VIEW - NO SCALE)

wwamtB OOMMMOO
D3 -35U-2 Page 12
green line vas 0.2 inch wide compared to a 0.06 inch width for the light beam and a 0.03 inch wide, etched, vertical center lire. Movement of the centre! wheel resulted directly in a damped movement of the light beam.
A signal generator was used to generate a sinusoidal display movement for the two moving displays. Although incorrect control movement could extend display movement, normal (programmed) variation was * l/2 inch at k cycles per minute (cpm) for the vertically moving display and •*= 2 inches at 5 cpm for the horizontally moving display (figure 2). Maximum possible error count was 5^72 for the former ard 803 for the latter display. The different cpm for the two displays averted the possibility of synchronized control movement leading to correct performance on the two displays.
The two tracking tasks selected would permit some comparisons to determine whether performance problems could be varied or eliminated by design considerations. An additional measure, response time, could be obtained by the following organization: Four Jeweled red lights, one-half inch in diameter and located in the corners of the display, were activated in a predetermined random order. Each light was activated twice during a test for eight reaction time measures per test. S was instructed to turn each light off as it came on by pressing the right thumb button on the control wheel.
All responses to the displays were measured and recorded automati- cally. Tracking error was recorded ae an integration (over time) of the difference between the desired position of the moving light beam and the actual position as controlled by S. Response to the lights was recorded simply as the interval of time each light was on.
The vibration used for this test was obtained by playback of specific four-minute samples of the taped records described earlier (page 8) and by sinusoidal vibration at 0.75 and 2.5 cps, defined by a signal generator. It was expected that the repetition of the four-minute sample would result in sufficiently valid data for this preliminary study and avoid extended test periods which were considered undesii-able because of possible data confounding by fatigue. The repetitive four-minute sample also permitted a direct comparison between subjects under the same vibration condition.
Test Procedure
Instruct-!"..»i (Appendix A) were read, a medical examination was given, and SCG system contacts were attached prior to the test. Ss proceeded to the vibration table where they were fastened to the seat with an aircraft lap belt and the ECG recording system was connected. Ss were familiar with the general procedure and had considerable prior practice on the task.
I"
• • •
l!

a>ffl£F0wm ssw&atffvx
D3-3512-2 Page 13
The sequence of test conditions was as follows. A ten-second onset rate was used to bring £_ to the level of vibration for four-minute vibra- tion tests with the same total time period used for nonvlbration tests. A similar ten-second decrease was used at the end of each vibration period. The ten-second onset and other table adjustment times were absorbed in the rest period.
TABLE III
^To avoid excessive fatigue build up.
SEQUENCE OF EXPERIMENTAL CONDITIONS
Test Conditions Minutes Test Conditions Minutes
1. Varm-up period h 13- Vibration test k
2. Rest period 2 Ik. Rest period 2
3; Nonvlbration test •h 15- Nonvlbration test k
h. Rest period 2 16. Rest period 2
5- Vibration test k 17. Vibration test U
6. Rest period 2 18. Rest period 2
7. Nonvlbration test 1+ 19- Nonvlbration test k
3. Rest period 2 20. Rest period 2
9- Vibration test u 21. Vibration test k
10. Rest period 10* 22. Rest period 2
11. Nonvlbration test h 23- Nonvlbration test h
12. Rest period 2 2k. End of session

f
I
i
i
!
D3-3512-2 Page ik
Ss were instructed to stretch and relax as completely as possible between tests. During the ten-minute rest period they were permitted to get out of the chair ior seven minutes. They performed continuously with all displays during each test condition for a total of eleven test conditions per session (five with vibration, six without vibration). S were informed that any deviations of the displayed moving lines from the scribed lines would be counted as tracking errors. They were also told that the lights were to be turned off as soon as detected, with the time that the light was on being the performance measure.
After the test the post-vibration physical examination and an inter- view were completed. A summary of interview data is included on page 2U.

a7a?aofi?& c&oigartnm
D3-3512-2 Page 15
RESULTS
Effects of vibration on performance for this test are indicated in the curves of figures 3 to 7- The data is plotted a6 a percentage figure with 0 representing no change in performance vith vibration as compared to non- vibration testing, larger numbers indicating greater error and vice versa. The error percentage figure is based on the equation Vg = V^ * Vo vhere V, is the nonvibration performance score obtained y| immediately before vibration; Vg is the score obtained during the specified vibration; and Vo is the nonvibration score obtained immediately after vibra- tion. This formula, used for derivation of an error term, vas employed for a specific reason. Measures from either or both nonvibration test conditions could have been considered representative of a proficiency level for any particular subject. However, the average of both appeared to be the best estimate since performance fluctuations were anticipated from such factors as test-to-test variability, learning and fatigue. Raw data converted to this figure is included in Appendix B.
Inspection of the curves will indicate possible trends which one might consider sufficient for valid conclusions. However, the differences between Ss could suggest many different and often opposed or misleading conclusions. The logic of statistical reasoning has been employed to provide guidance in determining which variations are possibly caused by chance and subject variability and which variations are most likely due to sew difference between test conditions. The results of this analysis are shown in Table III. For this study the five per cent (.05) level of significance was considered a sufficient test level for statistical determi- nation of factors attributable to chance. That is, when the probability was that a difference or change may occur by chance five times or less in a hundred, it was accepted that the change was due to the experimental con- ditions. In the tables this level is represented by one asterisk, with double and triple asterisks representing the .01 and .001 levels, respec- tively.
Since the tests were intended to determine whether performance corre- lations between types of vibration exist, only those statistical compari- sons are described here and comparisons with nonvibration performance is omitted. In keeping with the analysis of variance procedure for the Latin Square design, the first comparison determined whether a difference existed which was due to (l) order (or sequence), (2) subjects, or (3) the experi- mental variable (types of variation or vibration conditions). "Order" (l) of test conditions was not significant, so one of the possible confounding factors was greatly reduced and variability between (2) subjects and (3) conditions could be attributed to these two variables (2 and 3) and their interactions within this framework. It will be noted that a performance difference between experimental vibration conditions was found for the
f!
-
D 3 -3512-2 Page 16
vertically moving tracking task only (Table III) with no changes indi- cated for the horizontally moving tracking task or in response time for the signal light program.
Another statistic (Tukey's gap test, reference d) vas used to determine which experimental conditions could he c.iusing the differences resulting in significant differences between vibration effects on perform- ance. This test indicated that 2.5 cps, 1.08 inches double amplitude (DA), and 0.75 cps, 1.57 inches double amplitude performance data were signifi- cantly different with performance poorer for the first and better for the latter when both were compared to performance on other experimental condi- tions. A borderline case toward better performance was suggested for 2.5 cps, 0.26 inches DA, although students' t tests indicated that no particular difference existed at this point. This was taken as indicating that no real difference occurred for the condition.
\
I'

o
-I I-
si --
w ^§ ;5 u) '
D3 -3512-2 TW.I7
200-
loo
M6k.V4
*A1K
® VKTICMJLY !^!UG TRACWU&TttK WTH PE^D BM*. DBAY
I! T~
W
KJ
FT;
B£i
*: btt
_ [QO1 ' ' ' ' L l x L
50
® UofZlTCIsiTMLV MBMJ6 T2 *^c* W£ >T& sk
**Ki |—| •
<*) - f^AH krs
*n kMM
1 - \ •
1 J 1 1
•- s
I -i i i
—i i
© RESPONSE TIME
SO
O
-so
*»W 1 1 f—I
• • g kni
j i i i_ J L I Z34 5 6 7 6 S to WEKlMEUTM. COKJWTICKiS (DEFIUEb OU PN£& 9.)
FIGURE'S ,50M»AKRYOP eElATNE CMWsltt IKi PE5P0»^C£ FG£TUE DiPFtP^K/T VIBRMICW1EST COUblTIOMS OP TH6 t\P€2lM£MT: ULM4 Wt> EfcM£>6 (NA*OG
Mi UiKi.^ OF PEeKEMM&E 0Kl£AOl fc'SpLAV N& iMfclCATEb K>£ E&6U TEST COKIblTlOfJ, TME L/UE. SEp&ekTlUfo «SHAD£.fc kklb OPEKJ k2E/CS

"vwvp m—
Oi<T)<0 —VOl
D3-3512-2 Page 18
V Nut i r»4\uH0r>u-* P-2
!
• i 1 M^tJ****^!*** *0
,*
.«
ISS^

03-35*2-2 Page 19
1 \ \JN*N|**)-0 4»*9 OB
"7
a
3 0
- 1 w - k
(sj«)0-J« 2*>t->r
aiwqw saow SKMUSW) 3033a twvaaiN w*was
p
I 2 10
£
Of -3
3
00"^
o 2
•J Of
01

awauHm moas/v/rm
D3-3512-2 Page 20
2 * %
H
s
S
too
SO
1 —
r\/z i_^
/vA o / ^^g^jjgy^aJtf!*^ ^^-^
L--- " s
50 |
r J
!
A VERTICALLY M0VIKJ6 TRACKING TASK WITU FEE.-0 &&CK D5LAV.
loo
50
o -
t -50
1 i i
- j p •—.
- ^^
S HORI70WT&LLY miXVfy mOillUc TASK
C RESPONSE TWE T»SK>
J l I I _L 075 I 0.75
SINUSOIDAL RANDOM PSD 2.5
SINUSOIDAL
± 2.5 I PSD
RANDCM|
•
FIGURE 6 : A COMPARISON/ OF TAS^ PERFORMANCE FOR VIBRATION CONDITIONS WITU *PPfcWMM£LY EQOM.RMS AMPLITUDE POH&t
CTEST C0KJ&IT70MS, 2,3»,S«9;£*Cl4 LlM£ GEPeSWTS OKjE SUBJECT,)

D3-3512-2 Page 21
O -2. •I-
o
CJ
Ul
<J|Z S UJ
UJ o 1 2 0- ^
•2
I 5fl
oJ
oV
UJ
"Z
So
S 1
3
2
it
-i- o
So
W WITH FifeB^CK DELAY.
lrv>
SO
6 iO 7 —
SO S • 9
®uoeizoHTWxY Wtf&TKNCMkTAS*
So 6 S 7 \
8
| 4
^rE ^ti»AM——= L ?-MB-gg^
So
©&ESRDN56 TIME
P501 P5DZ
RG^^E _1 .: * COMpAfclSOK) OF TASK PEEFO^MAVJCe W(TH &tFF£fc6Nr PSb APPeo^lNATIONS. DWK K>Pe£SfcVJ£b FOB MEfctyi&Ntf. $ tUDWHWJAL PffiF-CfcMNJCE BEGDe, MUM&£I2S EBPEB56MT SUBJECTS ROM NWfcN&lX 8.

D3-3512-2 Page 22
TABLE 17
RESULTS OF STATISTICAL ANALYSIS (ANALYSIS OF VARIANCE)
Source of Variation
A. VERTICALLY MOVING DISPLAY
Significance Degrees of Freedom
Sum of Squares
Mean of Squares
F Variance Ratio
Order or Test Sequence 9 I.667 .185 1.29 —
Subjects 9 6.472 • 719 5-02 .001
Experimental Variable (or Vibration Condition)
Residual
Total
9
72
99
6.243
10.322
24.704
.694
.143
4.84 .001
S. HORIZONTALLY MOVING DISPLAY
Significance Source of Variation Degrees of Freedom
Sum of Squares
Mean of Squares
F Variance Ratio
Order or Test Sequence 9 0.547 .061 1.82 —
Subjects 9 0.820 .091 2.73 .05
Experimental Variable (or Vibration Condition)
9 0.344 .038 1.14 —
Residual 72 2.408 •033
Total 99 4.119
Source o\ Variation
C. RESPONSE TIME TEST
F Variance Ratio Significance
Degrees of Freedom
Sum of Squares
Mean of Squares
Order or Test Sequence 9 O.O589 .O065 .478 —
Subjects 9 0.1303 .0145 1.007 —
Experimental Variable (or Vibration Condition) 9 0.1554 .0173 1.272 mm
Residual 72 O.987I .OI36
Total 99 1.3227

D 3.3512-2 Page 23
Subject Reports
In general, S 3 indicated that they noticed little or no effect on performance. The general consensus vas that any effect vhich might exist would be for 2.5 period random amplitude with a mean displacement of 1.08 inches. However, subjects did not believe difference in perfonnance oc- curred. The 2.5 cps, 1.08 inches constant amplitude was generally agreed to affect comfort most, being the least comfortable of the conditions although it was not felt to affect performance. The difference in subject opinion for performance and Judgment appears to be summarised by one S's comment that "you tend to get out of phase with the random vibration, making it more difficult to maintain consistent performance.'' Even in this case, however, the subject did not feel that performance would be signifi- cantly different. PSD was apparently considered fairly comfortable with no one selecting it as most affecting comfort or performance.
S s felt that vibration "made the task easier" with one major effect being a tendency to increase alertness to the task requirements. However, one S coTnmf.nted that random vibration tended to distract him because "phasing in" with the vibration was more difficult. He felt he could adapt to the regularity of sinusoidal frequencies with a smaller net ef- fect on performance.
•

If
D3-3512-2 Page 2k
DISCUSSICW
Vibration of the human presents two major design problems, assuming that vibration severity does not endanger the operator because of loss of control, physiological and psychological stress, etc. Design engineers need to know how vibration affects human performance and how it will be affected in a specific, randomly vibrating system. Since all specific vibration environments cannot be predicted for human vibration testing, knowledge of human performance correlations, or transfer functions, may permit prediction of performance in the new system.
This exploratory study was designed to investigate performance with the two types of vertical vibration (sinusoidal and random) for possible performance correlations, and to determine feasibility of conversion fac- tors for relating and predicting performance from one vibration condition to the other. If likely relationships were indicated, further research might indicate more exact conversion factors and available data could be applied directly in design efforts. Sinusoidal vibration could then be used exclusively to further define effects of vibration on human perform- ance for application to operational situations.
For the feasibility exploration to be conducted in this study several descriptions of vibration were used, from systematically derived judgment of intensity (reference a) to the structural dynamics concept of RMS power. This method permitted comparisons of performance with sinusoidal versus random vibration as desired and between sinusoidal conditions relative to other hypotheses, such as Judgment of vibration being related to performance.
Only one subtask of the three was found to be differently affected by different vibration conditions. Performance on the vertically moving tracking task with control-display feedback delay was significantly de- graded by 2.5 cps, I.08 inches double amplitude vibration. The horizon- tally mcving tracking task without feedback delay and the response time task were unchanged from one condition to another—evidence of the impor- tance of display-control selection in design. This suggests that a uni- versal transfer function may not be required since some tasks may not be affected by vibration.
The comparisons which were the design purpose of this experiment can be made for the one task which vibration was known to affect from prelimi- nary testing and which was affected differently by the vibration conditions of this test. Performance difference from other test conditions for the 2.5 cps, 1.08 Inches DA condition eliminates Judgment as a potential basis for performance comparisons, since this condition and 0.75 cps> 9-C* inches

D3-3512-2 Page 25
"nad been defined as "extremely annoying" from an earlier experiment. For the same reason, any relationship for random amplitude, PSD, and sinusoidal vibration is rejected.
Of those comparisons made in this experiment (illustrated in figures 3 to 7)> only RMS amplitude power could be indicated as a parameter leading to comparable data since the equal RMS condition was not involved in the 2.5 cycle condition for which performance was different. As indicated in figure 6, sinusoidal and constant period random amplitude vibration, RMS ejnplltude power equal to the RMS amplitude power for the PSD, could be associated with equivalent effects on performance.
In other word6, performance with the PSD vibration condition did not vary considerably from performance with 0»75 cp6 and 2.5 cps conditions, vlth amplitude power equated to the PSD content for these frequencies. The data indicates that an RMS for 2.5 cps (sinusoidal) which is equal to the RMS amplitude power for the 2.5 cycle portion of the PSD results in comparable performance, with similar results for 0.75 cps. Also, no particular difference in performance exists between 0.75 cps (l.7 RMS) and 2.5 cps (0.09"RMS) amplitude power. This leads to the suggestion that the key to a transfer function is some combination of frequency and a factor related to RMS.
The latter comparison leads to a more general question which cannot be answered without more extensive data. It is not clear why a relatively small difference in error is found when the sinusoidal vibration perform- ance is compared to performance with the PSD since the latter includes the full additive component of both 0.75 and 2.5 cps measured sinusoidal conditions tested. Some type of algebraic additive relationship appears likely, such as (a) (0.75 cps) ± (b) (2.5 cps) performance = PSD performance.
lack of variation related to widely differing amplitudes with the same frequencies suggests that relatively no differential change in per- formance occurs as a function of frequency within the amplitude ranges used in thi6 study. This suggests a possible relation to acceleration forces which vary with frequency and amplitude, but no clear-cut distinc- tion could be drawn. Tests are necessary wherein acceleration is constant for distinct performance measures at d1ff«rpnt. frequencies (possibly using more precise performance measures subject to less individual variability) before a clear answer can be derived. If one is to test acceleration as a factor, the areas of body sensitivity must also be considered. It is suspected that establishing a strong relation will still be difficult to accomplish since discomfort would undoubtedly result in data confounding. A systematic relationship could confuse attempts to derive transfer functions.
In summary, there is evidence that a transfer function can be found and that data derived with sinusoidal data may be extended to complex patterns of random vibration. It appears that usable transfer functions
! i i

f '
I ! i '
, J
.
ivuDtimtB \&j>sa?ffffia
D3-3512-2 Page 26
can be attached to mechanical descriptions of vibration without a complete understanding of all effects on human operators. Results of this experiment show that the physical description which could serve this purpose may be a combination of frequency and some factor related to RMS.
More data and analysis is required to examine the tendency for a slight increase in certain tracking errors related to specific vibration conditions. In figure 3 (A, B & C) it can be seen that condition 5 (2.5 period random amplitude, 2.l6 inches DA) is associated with a tendency to greater error. This appears to be influenced by individual deviation, but may be related to a real effect of the condition on performance which cannot be detected because of wide individual variability. In figure 3a, experimental condi- tions 3> 5» 7 and 10 suggest the possibility of some similar unidentified factor. Again, it may be simply a function of individual variability. The plot certainly suggests that further study with these conditions is warranted using tasks less subject to individual variability as indicated earlier, even though there was no statistical indication of differences associated with these conditions in this experiment.
It must be recognized that other displays or vibration conditions may cause the results to differ significantly from those obtained in this test. One must also bear in mind the possibility that more severe vibration intensities or longer exposure time may change seme of the observations and comments herein which are based on thle data. Although considerable differ- ence in performance was found between subjects the issue was considered minor, relative to the purpose of this test, that is, "Is there a common physical parameter of vibration by which different types of vibration can be considered to have an equivalent effect on performance?" The pertinence of the assumption is obvious with the wide range of operator variability which any vehicle designer must consider (and the requirement to design for a bread range of unique individual capabilities). Also, it is desir- able to reiterate the ground rules for this experiment—that the emphasis is on exploration to discover trends toward a transfer function rather than necessarily precise and final answers.
\ \
D3-3532-2 Page 27
APPENDIX A
INSTRUCTIONS
Subject
Emphasis is on performance for this portion of the vibration study. Your job will be to operate the displays that you became familiar with during the first experiment. You will be expected to keep the vertical and horizontal moving lines aligned, or track them.
The lights in the corners of the display will come on at random inter- vals. When this happens, you are to continue tracking but press the button to turn the light off as 60on as you see it. Release the button as soon as the light goes off, and do not press it until you see the next light.
It is essential that you perform at your best on all displays concur- rently. Rest periods are purposely scheduled into the sequence to permit you to relax and prepare for the next test run for the day.
You are asked to avoid any discussion of this test until after the full experiment is completed for two reasons: (l) other studies have shown that such discussion can completely change the data; (2) the data to be collected i„ rather sensitive to changes in viewpoint. We would like your attitude toward the test to remain as nearly the same as possible throughout the experiment.
Are there any questions?
•
•
Procedural Instructions:
A. The red light mounted on top of the panel display will go off when the error count starts. This will be a signal for you to start performing. (Items 1, 2 and 3 are for vibration only.) The sequence leading up to this is as follows:
1. The seat will be raised to the center of the stroke.
2. Final equipment settings will be completed.
3. A 10 second onset rate will be Initiated to 'oring you to the right level of vibration for the test.

&W&0M& wrttiEX/JVA
I
'•
D3 -3512-2 Page 28
h. The red light will go off, you are to start performing, and the error count will start.
5. Srrore will T.e counted for any deviation from the scribed line3. Additional cues on the display are to help you maintain alignment.
6. The horizontal moving line has a fairly direct relation to control movement. The vertical moving line has a two-second delay between control movement and display response.
B. Each vibration period is scheduled tc last four minutes.
C. Are there any questions?
D. Should you want to stop vibration at any time release the cutoff switch.

•
I
V
^
03 -3512-2 Page 29
APPENDIX B
INDIVIDUAL DATA FOR THE TEST
Entries indicate relative error performance error = vibration performance ~- nonvibration performance error.

wma/ffvm awnawsn
D3 -3512-2 Page 30
CO ON VO
CO F-
(N-l s 4 LA
LTN
<n 3 s LA H £ ON
LA 0 LA O 4 ON Cr ON ON LA -J-
$ OJ LA on
rH CO t- NO ON LA LA CO on 0 ON on on OJ H rH aj rH CVJ H H O OJ O
M a)
C rH VO t- NO rH m J* OJ tn on t-- LA rH -> 0 on NO on LA CO LA -d VO IA VO on •H -1 0-. on h- 0 t- O. t- LA 0 on s on
^ 8 HJ -p 0 ro co OJ on VO C0 rH rH ON rH
^c M O H rH H 0 rH rH O 0 rH rH i aj m A Pi
VO on fc- NO & Of m 4 on H r^ O 1 •P 0)
rH •=r OJ r-_ LA rH ON 0 fc- VO F- 8fe CO NO t- CO cb 3 rH P on 3 CO 3 VO 0. rH OJ Oj CO ON OJ CO H OJ 0 < u 0
0 O <M Vl O H H H H O O H rH 0 rH H I = ,1
CM lAr
•d v
if CO LA
LA ON
rH O
on CVJ ON P LA s & on
rH on •VO
-4 OJ t- R LA
VO tn 8 H
O on
VO VO VO 8 f: VO
0 s on rH Ig ill § rH 0 H rH rH rH O H H 0 rH rH $1-
E • IAVO CO • • OVO
Pi on 0 LA rH LA CO rH 8
on rH
-* LA ON CO Tj H rH O •
at »H EH +»
S VO O
LA on
VO 3 CO
ON CO LA
s CO
LA ON
CO
CVJ
8 s ON
ON
rH
Sn O
O • H •H 00 CO (4 Pi Pi CO CO
O 0> O O Pi PI »A .-I 0 rH O rH rH rH H O rH rH rH . CU, O CJ
^ t- t-1 5! <n ON -4 a LA LA ON t-
tA IA IA t— t^- lAlTx
0 • • E CVJ O O CM CM £y
on VD H on CO CO in CO rH on a) -P 60
S IA OJ O
LA on s 8 ON
H O rH
LA rH ON 5 OJ
LA on on
eo cu 3 C r< V
K VO fN-OO ONO
fa OJ OJ H H H rH O H H O rH rH r*
W t- 0^ m CM On Jf r- on on t~ £ vo i •H PlW
1*1 rH Jt on P rH rH O on -4- ON 1 • -4 rH
00 £ rH rl & r-
OJ LTN
H CO CO Pi m
H CO OJ
vo OJ
CJN t»» CH ^ H -P O
rH rH H 0 O H rH H rH rH rH rH
rrjl at W
•H C^ rH 9 -d- H t- CVJ 3 LA ON vo OJ CO +> t-vo i i41 on 8
«n rH
H C\J F- 5 on
H
on t- CTN CO •H • rH on LA
LA
H
on H
H NO
rH
8 rH
H O
rH
3 rH
OJ ON
0
2x rH
Jn rH
rH H H .
i* -,C" Jlrlrl > Ofl
O _
_ 9 «} A .d • @ 3 "3 -p 0 -p
LA m LA VO rH s s on 3 CO OJ LA Tj t-H -P ^i W 0 f- m VO rH 8 CO LA ON
V -P
OJ nn C\ -H"
0 0
r-N H
V r-\
ON LA, O
NO ON 0
on on
O on
rH H H rH CNJ O H rH O rH H rH p 1 ^ y •» 0 s c 0 c
fir. "0 O a m 0 CO LA H VO VO CO CO on OJ ON LA t- P
w 0 "d •rH TH O
S -H in m !- VO 0 rH
H
ON OJ rH r*- VO W p f-i 4) -P H on
ON P VO LA
OJ rH
r- -4
LA O
VO O
F- C? 0 on
-H- CN
PM CO CM
rl 3 C V o< 0 OJ 0 rH rH rH H H r-l 0 rH r-\ rH
9 tJ r«
^^ Pi CQ O rH rl -H
•H O il«h s~^ r^S H P. CM PI « • H > B P. M 0 O .--"^ • rH IA IA M
EH 0 K H)
HcvifC t—t-IA M
C_) v_^ » * "^—<" • • • 6) OOOI fl R rH CVJ 00 -4 LTN •O t- CO ON O § t: C E9 H a a 3 s 1 1 1 • • • • •
H CVJ W4 UN 2

.
D3-351^-2 Page 31
r-- O t- ir\ H tn CO fe- Q\ VO rn
VO ON o\ H
*— P -4- ftj
C\J CO
ON
g a • H VO o s
C\l C\J H CO m vo o-i o o m
C'.
CO
g
g VO O o
I-
CM
Q0W-*<0^,t-HOt—COQ\.tf t^-ojc\j-?coir\ifNcoir\cocoo\<n £-C\JC0-^-V0HrOt— COt— lf\ Q CO C\t— C0i-ICOOVHOO\COO\00 «>
• • • • • • • • • * • • • <^
OOOrHOOrHiHOOO«-t 3 P •r* r-l
VOl^OCOO\QHCV|HHmH LT\t— ir\ ON m co m co -* m -* t— t— -* CVJ CVJ ONCVJOOCVIHOJCvlVOVO OCVC\ICOCOOCOHOO>iOO\C\l
HHrHOO-HOHHOHO 5 Q
£ £ p <5 c\j
VO rHHOOrOOQCScQOfO • VO lAf— V0 1AC\jC\JHVOO-5t--CVl<irt CO -* <M POt-OCTvHcOVOOOO\OCV|rH £ <
HOHOHdHHrHOHH S S2 P
6' V- 2: • UAVO CO
HVBf-f-ONOOVOHvOir\t~-000 "CfHHO- -*vof— vofirooNoocot— f- i/\ cp o • H OONOVt— COOOONCVOONCOO T-IOJOJ
• • • • • • • • • • • • • bPiPiGQCQ r-IOOOOHiHOOHOO U'JOftP.
PL, V V
\i\ •— t— ir\ i/\ ir\ro-3-coi^OVompr-)_4-t— ip. L^CM roiAVO-5oo t— i/\ co o\ir\ ojoocucvi C\JQOCVJ0OVOt-CVjq0-?CVJl-PO
OrHHHHOHOHi-tHO VO t—CO Ov O
CVIVOCVimCVIIfVfOGvHOVlAO ° ^•J-OlACOl^OVCVICMCVJrHO ~ t~-oo<nt— ov^-Hcpt— <norovo "^ ONCOOvOOniAt— OSCOHOOCVI
OHOHHOOOOHHH &
3 r -^OCVjONONCOCUfiavCCflO •pf-.o -^•rycou%cooovi5HOuSt-t— -H • H t— o vo t— t—coeovooSirvovoci H1-1- OHCVIOOt^-aaOOOJHOrH §* 0J
\ OPS CVIt— CO ON Q t— O C— CO O UN O t) -H P CO IA O CVI -3 f— CQOQr-it-- t— CO fi H cooro-*-*0\covococvj-*i'N a) ft t— ChCVIHt— COOCOVOHOVO ^ .5 ddHHOOHOOHOH Qo
- | g co<nt-ir»Hdcvit-'c\i-*t-o\ Q'JPCTJ m-s-voocoONOOiAcof-iA to p °t 3 £ ir\rHHir\t— cyWHirs^fcoco (X, to .* « 3 ONHONOOCOONC— CM O ON ON PHCET
• ••••••••••• QJ *n *n OHOHHOOOHHOO -3 fc O O -d
•H O • • M '-* T» H PH (m pu, B H > P. PH O Q <-» BHIMTV o OS M <Ht-t-ir\
HtMfe d d OJ HCUrnj-lAVOh-OOOvO c g fi
S S S HW CO-* l/\
US'
I

D3-3512-2 Page 32
CD Q ON Ov t— 00 OCO-* IT* m H UNoSeooNr-ir-toot— t— oo-*
Or-HOOQt— rHCVJOOCOMDOJt— ro HONOONOOOrHOOONOONfO
OHOHHr-jHHHOHO
COt— Oi/\cn^ c0CV|O-*CVJj-fa"»
OONCOOOSOONCOONOONOO 4)
r-JoOrHOHOOOHOH 3 •P •H f-1
t— J-cjcvjoco<2>^tONir»coo ir\ vo vo H HcovO mo t~ ir\ rn
co r-i is\ ^t ir\ ir\ l~ t— ON t— i-l o> <*"» vo OOONOOOOVOONOONONCVJ
HHOHHrHHOOrHOO OP "d 3 C = O a) CM
VOCVIHONCVJVOHVOVDQONH « IA = -3- cvi m LCN en -4 ON O O V\ ir\ U\ -VO
C— t— t— -* H t- ^- Q CO C— -* CO Q f> CO ,J N O ON ON O ON ON ON O ON ON ON O H S< K Q W <
o o\= S § H O t— « r EH • lAVO CO M rHOOOO-^QOOHlAt— CVJVO • • O>0 P t— CVJ O m CM VO D\ VO f"» H CO H <»*> "d H H O • SvOlf\0\00-*-*CNH!/\irkJ-lAOCO O • H O ONOOOOCOOONOONOONONOO T< o » t_3 . . . . . . . . . . . . . u P< P. to <&
OOOOHOHOHOOrH OJ o y P< p. •3 PH O O
ITNC-- t- I/N if\ -*r«-ivoirNOVOvoo<-Ht/\-*t— ro co r«-> CM ON t— ct> f- o\ 4 tn w CM o o CM CM
ITN t— iA t— vo co -* CM t- CM ON op ir\m C00t-OHOOCOOOOSO<0
OHr-Hr-HHHHOHOHH VO t— 00 ON O
i-nCVIt— ON O t— -* CO -3" ON P"> ON 5» t- CMCQVOfOOJCQQfOCOCVJCO o
^J-i-tO\v3rOOifNv3-?VOt— rot— VO *-> COO\OONONCOONCOONO\0\ONCM Q^
dd>Addddddddd . dF n s •OK
t— oo-*cot— HCMCOCM-*-* Pr-q -*CMC— -*VOcOON-*0\t--3-l/N -rt.H
m v£> rn ON t— OHOvoir\HcO--tro d H • 0CC0O\O\CVJ0vO\OOOCT\Oi-t §* W
ddddrHdoHr-lrHOH < J| •> _ *d v B 3 -d O +> 3
OOCOON-^COflOOCVIVOrinVO tirt *) OOirvif\0NkTki/NHiA^-»^m KHri
CJQOCMCVJOOOVOONrnt-QVO ,g &H OOOOOHr-IOOvONONOON °^ J3 §*
rAriridrirAiAdddrAd < „ < Q S
. Jl VOir»J-t— ^HrOOOONQrHOv P _ SG HLrNOcovocvjif\fOi-t5cviO Bp oj
H-*irNCOtfNONONO\.-<VOQONVO PHCO-^- ONCOONOONONONCN.-HOONON ft
ddoHodddHHod -d ^ ° o •d £ 5 u u -H TlO I) V h
^ •—» HPH PH PH «>
o o ^^ a H "> "* CJ K tO < H i— t- i^
HmfS o o cvj HCMnl-d-iAvOC— COONO g C C
fl fl) 01 • • • • • S S S H CVJ C1-3- IT«
PS
s
a
r-K
I

D3-3512-2 Page 33
VERTICALLY HORIZONTALLY MOVING MOVING RESPONSE
SUBJECT DISPLAY DISPLAY TIME
1 0.0 1.25
2 1-77 0.926 1.06
3 1.U35 1.11 1.055
k I.2V7 0.919 1.06
5 I.70U 1.13 1.18
6 l.kk 0.73 I.O8
7 I.96 0.985 1.18
8 1.38 0.872 0.9^5
9 i.5te 0.995 0.992
10 1.01U 1.122 0.993
TABLE VI. PERFORMANCE ON TASKS USED IN THIS TEST
WITH THE SECOND PSD APPROXIMATION

D3-3512-2 Page 3U
ACKNOWLEDGEMENT
Cooperation of the following individuals, who served a6 subjects for this experiment, was appreciated.
M. E. Arnold J. K. Davis W. D. Fagan G. D. Goodwin D. M. Heller' A. E. Lee A. D. Ogle 0. Praeger A. A. Sullivan R. G. Thomas

..
•
UNCLASSIFIED
UNCLASSIFIED
* ... -...»••* #c,..j