i nstrumentation development, measurement and …
TRANSCRIPT

Instrumentation Development, Measurement and Performance Evaluation of Environmental Technologies
Quarterly Technical Progress Report for the period January 1, 2001 - March 31, 2001
Dr. John Plodinec, Principal Investigator
Report No. 40395R11
Prepared for the U.S. Department of Energy Agreement No. DE-FC26-98FT40395
Diagnostic Instrumentation and Analysis LaboratoryMississippi State University205 Research BoulevardStarkville, Mississippi 39759-9734
[email protected]/Dept/DIAL

NoticeThis report was prepared as an account of work sponsored by an agency of the United States Government. Neither the United States Government nor any agency thereof, nor any of their employees, makes any warranty, express or implied, or assumes any legal liability or responsibility for the accuracy, completeness, or use-fulness of any information, apparatus, product or process disclosed or represents that its use would not infringe privately-owned rights. Reference herein to any spe-cific commercial product, process, or service by trade name, trademark, manufac-turer, or otherwise does not necessarily constitute or imply its endorsement, recommendation, or favoring by the United States Government or any agency thereof. The views and opinions of authors expressed therein do not necessarily state or reflect those of the United States Government or any agency thereof.

Contents
Table of Contents
Executive Summary . . . . . . . . . . . . . . . . . . . . . . . . . . . . . . . . . . . . . . . 1
Characterization of Heavy Metals, Radionuclides and Organics in Heterogeneous Media . . . . . . . . . . . 1
Environmental Control Device Testing . . . . . . . . . . . . . . 2Waste Treatment and D&D Support: Process
Monitoring and Control . . . . . . . . . . . . . . . . . . . . . . . 4Diagnostic Field Applications, Coordination and
Testing Support (DFACTS) . . . . . . . . . . . . . . . . . . . . . 7
Task 1 Characterization of Heavy Metals, Radionuclides and Organics in Heterogeneous Media . . . . . . . . . . . . . . . 8
Volatile Organic Compound Monitoring Using Diode Lasers . . . . . . . . . . . . . . . . . . . . . . . . . . . . . . . . 8
Isotopically Selective Monitors for Transuranic Elements . . . . . . . . . . . . . . . . . . . . . . . . . . . . . . . . . . . 14
Laser-induced Breakdown Spectroscopy . . . . . . . . . . . . . 26
Task 2 Environmental Control Device Testing. . . . . . . . . . . . . . . 33
Performance Enhancement of the Ionizing Wet Scrubber . . . . . . . . . . . . . . . . . . . . . . . . . . . . . . . . . . . 33
Testing of a Ceramic Regenerative Heat Storage Device for Dioxin Control and Heat Recovery. . . . . . 35
Transportable Calibration Test Stand for Diagnostic Instrumentation . . . . . . . . . . . . . . . . . . . . . . . . . . . . . . 40
Evaluation and Performance Enhancement of a Submerged Bed Scrubber . . . . . . . . . . . . . . . . . . . . . . 42
DIAL 40395-11 iii

Contents
Task 3 Waste Treatment and D&D Support: Process Monitoring and Control . . . . . . . . . . . . . . . . . . . . . . . . . . 46
Dioxin and PCB Studies . . . . . . . . . . . . . . . . . . . . . . . . . . 46On-line Multi-Spectral Imaging of Thermal
Treatment Processes . . . . . . . . . . . . . . . . . . . . . . . . . . 51Imaging Instrumentation Application and
Development: Thermal Imaging . . . . . . . . . . . . . . . . . 56Imaging Instrumentation Application and
Development: Profilometry . . . . . . . . . . . . . . . . . . . . 58Saltcake Dissolution . . . . . . . . . . . . . . . . . . . . . . . . . . . . . 61Feed Stability and Chemistry - Solids Formation. . . . . . . 75
Task 4 Diagnostic Field Applications, Coordination and Testing Support (DFACTS) . . . . . . . . . . . . . . . . . . . . . . . . . 99
HEPA Filter Testing . . . . . . . . . . . . . . . . . . . . . . . . . . . . . 99
DIAL 40395-11 iv

Contents
List of Figures
FIGURE 1. Chlorobenzene absorption data obtained using CRDS and multi-pass absorption . . . . . . . . . . . . . . . . . . 11
FIGURE 2. CRDS calibration plot for chlorobenzene. . . . . . . . . . . . 12
FIGURE 3. CRDS calibration plot for toluene . . . . . . . . . . . . . . . . . 13
FIGURE 4. Schematic of cavity ringdown spectroscopy (CRDS) apparatus . . . . . . . . . . . . . . . . . . . . . . . . . . . . . . 17
FIGURE 5. Schematic of the laser-induced fluorescence spectrometry technique . . . . . . . . . . . . . . . . . . . . . . . . . . 18
FIGURE 6. Schematic of isotopic energy shifts and the associated LIF spectrum . . . . . . . . . . . . . . . . . . . . . . . . . 19
FIGURE 7. CRDS wavelength scan of U II absorption at 286.6 nm and of unknown interference from argon plasma . . . . . . . . . . . . . . . . . . . . . . . . . . . . . . . . . . . . . . . 20
FIGURE 8. CRDS calibration curve for U II absorption at 286.6 nm, showing absorbance per pass as a function of uranium concentration . . . . . . . . . . . . . . . . . 21
FIGURE 9. CRDS calibration curve for U I absorption at 358.448 nm, showing absorbance per pass as a function of uranium concentration . . . . . . . . . . . . . . . . . 21
FIGURE 10. Image of 424-nm U emission from a 20-ppm solution of uranium in an argon ICP plasma . . . . . . . . . 22
FIGURE 11. LIBS CEM setup in DIAL test stand . . . . . . . . . . . . . . . 27
FIGURE 12. Variation of Cr concentration during the RM sampling . 29
FIGURE 13. Schematic of the transportable calibration test stand for diagnostic instrumentation . . . . . . . . . . . . . . . . . . . . 41
FIGURE 14. Scale model of West Valley submerged bed scrubber. . . 43
FIGURE 15. Spectral image of 424-nm U emission from a 20-parts-per-million solution of uranium in an argon ICP plasma . . . . . . . . . . . . . . . . . . . . . . . . . . . . . . . . . . . 54
FIGURE 16. Intensity of 424-nm U spectral image emission as a function of uranium concentration (in parts-per-million) . . . . . . . . . . . . . . . . . . . . . . . . . . . . . . . . . . . . . . 54
FIGURE 17. Surface roughness and volumetric calculations . . . . . . . 59
DIAL 40395-11 v

Contents
FIGURE 18. Solids speciation for BY-109 saltcake as function of cumulative diluent addition (diluent–inhibited water) . . . . . . . . . . . . . . . . . . . . . . . . . . . . . . . . . . . . . . . 67
FIGURE 19. Liquid phase concentrations for fluoride anion – saltcake BY-109 . . . . . . . . . . . . . . . . . . . . . . . . . . . . . . . 67
FIGURE 20. Liquid phase concentrations for sulfate anion – saltcake BY-109 . . . . . . . . . . . . . . . . . . . . . . . . . . . . . . . 68
FIGURE 21. Comparison of experimental and predicted dissolution profiles – saltcake BY-109 . . . . . . . . . . . . . . . . . . . . . . . 69
FIGURE 22. Solubility envelopes for sodium-fluoride-sulfate-hydroxide system at 25˚C . . . . . . . . . . . . . . . . . . . . . . . . 70
FIGURE 23. Solubility envelopes for sodium-fluoride-sulfate-hydroxide system at 50˚C . . . . . . . . . . . . . . . . . . . . . . . . 71
FIGURE 24. Temperatures and pressures measured along the channel during the low Reynolds number flow experiment. . . . . . . . . . . . . . . . . . . . . . . . . . . . . . . . . . . . 79
FIGURE 25. Representative frames of a single NaPHOH particle observed during the start of plug formation and the scale associated with the distance from the end of the heat exchanger . . . . . . . . . . . . . . . . . . . . . . . . . . . . . . . . 80
FIGURE 26. Example of particle agglomeration and deposition observed during the low Reynolds number flow experiments . . . . . . . . . . . . . . . . . . . . . . . . . . . . . . . . . . . 81
FIGURE 27. Particles and agglomerates observed in the digital images and the upstream pressure obtained during the experiment. . . . . . . . . . . . . . . . . . . . . . . . . . . . . . . . . . . . 84
FIGURE 28. Calculated and visually estimated number of particles which comprise the agglomerates. . . . . . . . . . . . . . . . . . 86
FIGURE 29. Images illustrating the formation and subsequent growth of a particle agglomerate . . . . . . . . . . . . . . . . . . 87
FIGURE 30. Resulting bed area and pressure obtained at a Reynolds number of 225. . . . . . . . . . . . . . . . . . . . . . . . . 88
FIGURE 31. Example of a single particle undergoing deposition. . . . 91
FIGURE 32. Particle size distributions employed in the engineering tool model sensitivity study . . . . . . . . . . . . . . . . . . . . . . 94
FIGURE 33. Local density plots for the three distributions in Figure 32 and for the average particle size of 250 microns . . . . . . . . . . . . . . . . . . . . . . . . . . . . . . . . . . . . . . 94
DIAL 40395-11 vi

Contents
FIGURE 34. Data showing the effect of the stream velocity on the deposition process for the broadest particle size distribution in Figure 32 . . . . . . . . . . . . . . . . . . . . . . . . . 95
FIGURE 35. Effect of the solids density on deposition behavior forthe broad distribution . . . . . . . . . . . . . . . . . . . . . . . . . . . 96
DIAL 40395-11 vii

DIAL 40395-11
viii
Contents
List of Tables
TABLE 1. Analysis results from LIBS CEM and RM-29 sampling at DIAL test stand . . . . . . . . . . . . . . . . . . . . . . 30
TABLE 2. EPA Method 5 test results . . . . . . . . . . . . . . . . . . . . . . . . 44
TABLE 3. Surface roughness numerical representation of acquired controlled target images - sandbox surfaces . . . . . . . . . . . . . . . . . . . . . . . . . . . . . . . . . . . . . . 60
TABLE 4. Surface roughness numerical representation of acquired field soil surface images. . . . . . . . . . . . . . . . 60
TABLE 5. Compositions of saltcakes examined (weight %) . . . . . . 65
TABLE 6. Results for the image analysis for single particles . . . . . 82
TABLE 7. Characteristic parameters determined from images of agglomerated particles . . . . . . . . . . . . . . . . . . . . . . . . 83
TABLE 8. Characteristic dimension calculated from velocities of Table 6 . . . . . . . . . . . . . . . . . . . . . . . . . . . . . . . . . . . . 90

Executive Summary
Characterization of Heavy Metals, Radionuclides and Organics in Heterogeneous Media
Volatile organic compound monitoring using diode lasers. New sample introduction and high-vacuum systems have been assembled and tested with the diode laser cavity ringdown system (DL-CRDS). New DL-CRDS data for chlorobenzene demonstrate near perfect agree-ment with previous multipass absorption results with orders of mag-nitude improvement in sensitivity. Early multipass absorption efforts used relatively high pressures of chlorobenzene that were not seri-ously perturbed by slight losses to O-rings, etc. However, the low pressures employed in DL-CRDS measurements necessitated the use of all-metal valves and seals in the vacuum and sample systems. The absorption characteristics and expected detection sensitivity for tolu-ene are currently being evaluated. To date, DL-CRDS data have been obtained for benzene, chlorobenzene, and toluene. We plan to con-tinue to expand our database to include additional VOCs of impor-tance to DOE applications while interfacing the DL-CRDS system to gas-stream sampling and supersonic expansion systems.
Isotopically selective monitors for transuranic elements. The opera-tional conditions for the inductively coupled plasma have been opti-mized and limits of detection have been determined for selected
DIAL 40395-11 1

Exective Summary
uranium transitions. This work was carried out using depleted ura-nium standards. Very recent progress has been dependent upon obtaining uranium standards enriched in U-235. Enriched standards are necessary for determining the accuracy of isotopic abundance measurements by permitting preparation of sample solutions of dif-fering relative isotopic abundance. During this quarter, a source of enriched U-235 was identified and a sample was obtained. Enriched uranium standard solutions are in preparation and isotopic abundance experiments are being initiated. Due to the delay in the arrival of the enriched standards, results will be available in the next quarter.
Laser-induced breakdown spectroscopy . A continuous emission mon-itoring (CEM) system using LIBS was tested on the combustion test stand at DIAL. During the test, the aqueous solutions of Be, Cd, Cr, and Pb were injected into the stream of exhaust gases. Samples of the exhaust were collected using RM-29 during the CEM test. The results from LIBS and RM method were compared and summarized.
Environmental Control Device Testing
Performance enhancement of the ionizing wet scrubber. DIAL cur-rently is in possession of an ionizing wet scrubber (IWS) provided for testing by Ceilcote, Inc. This scrubber is currently a part of the off-gas system at the TSCA-Oak Ridge incineration facility, and is under consideration for use in the DOE waste treatment processes. We will primarily investigate the relationship of plate voltage with respect to particulate removal in this system. Since the system is a commercial scale system with high flow rates, we had anticipated getting a loss of weight particulate feeder from the One Tenth Scale Combustion facil-ity at the Savannah River Site and installing it at our site. This would give us a particulate feed rate compatible to what is required for test-ing. The IWS has been implemented at the DIAL facility, and we are in the process of acquiring the particulate feed system.
DIAL 40395-11 2

Exective Summary
Testing of a ceramic regenerative heat storage device for dioxin control and heat recovery. A novel regenerative heat recovery device promises to reduce dioxin emissions from incinerators, in addition to recover-ing waste heat for preheating the combustion air. At the end of the previous quarter, the test article had been assembled and testing was almost ready to begin. Unfortunately, an unexpected hard freeze in early December 2000 damaged the cooling circuits for DIAL's com-bustion test stand, and a roughly three- month delay ensued while the damaged components were replaced. We anticipate that the planned test program will be completed during the next quarter.
Transportable calibration test stand for diagnostic instrumentation. A transportable calibration test stand is being developed for the purpose of constructing a test train used for calibration of optical diagnostic instrumentation. In the present quarter, we have developed a sche-matic and engineering drawings for constructing such a test stand. We have put together a pre-heater and two mass flow controllers for air and propane injection into this two-inch diameter combustion system. The dopant is being injected into the stream using a conventional neb-ulizer, although we will be trying an acoustic injection system. The DIAL-LIBS system is currently being used to measure metals con-centrations in pre-heated air on this test bed. A burner has been designed and tested for use in this calibration stand. This same (pro-pane/air) burner was used in the injection of metals solutions into the combustion test stream for testing of an ICP system being developed at Ames Lab.
Evaluation and performance enhancement of a submerged bed scrubber. This task focuses on the evaluation and performance enhancement of a submerged bed scrubber for cleanup of effluent gas from low-flow-rate incinerations systems. We have completed the engineering drawings for the test system and are in the process of acquiring materials to assemble the test bed.
DIAL 40395-11 3

Exective Summary
Waste Treatment and D&D Support: Process Monitoring and Control
Dioxin and PCB studies. The formation of dioxins and furans during combustion processes has become a significant focus of concern over the past few years. EPA has initiated an intensive effort to character-ize the different sources of dioxins in the US and to reduce the overall annual rates of emissions. The 1999 MACT for Hazardous Waste Combustors establishes an emission limit for dioxins and furans that will be technically difficult to achieve. Large strides to control dioxin and furan emissions from combustion processes will most easily come from an enhanced understanding of their mechanisms of forma-tion. The work being conducted by DIAL will seek to reduce uncer-tainties associated with the locus of formation of these compounds and factors that contribute to their formation.
On-line multi-spectral imaging of thermal treatment processes. During this quarter while waiting for delivery of components of the multi-species system, we concentrated our efforts on development of a computerized spectral imaging system utilizing a five-position filter wheel. The software control package allows the user to select spectral region (via the choice of the filter position of the filter wheel), num-ber of images to be recorded for each spectral region, time interval between consecutive image acquisitions, and frame rate (i.e., number of images recorded per second with a maximum rate of 30 frames per second). Testing of this system has begun.
In preparation for our effort for the next grant year to investigate the feasibility of using spectral images of plants as a monitor of the spread of ground-based pollutants, we have reviewed the scientific lit-erature and chosen plant species to study. (This project is an out-growth of our study of the spectral images of cotton.)
DIAL 40395-11 4

Exective Summary
Imaging instrumentation application and development: thermal imaging. In an effort to expand the sensor’s spectral response region, a near infrared (NIR) camera system has been identified and is in the procurement process. Prototype NIR system development will con-tinue. This expansion will greatly improve the current system’s tem-perature measurement range limits on the low end and increase the system’s sensitivity. In support of the RIC project, we used the ther-mal imaging systems to monitor two batch-melting processes. The melt-surface temperature map is provided to the system operator in near real time. A new version of the imaging system drivers has been installed. The modification of current system packages is underway.
Imaging instrumentation application and development: profilometry. We have improved upon Fourier transform imaging techniques, and we have begun to develop several routines/modules for calculating the surface parameters. We have developed the specific surface roughness and volume computation modules for the region of interest (ROI). The development of a frequency-multiplex FTP algorithm has been completed. The development of an imaging system using a high-reso-lution camera, for increasing the target sampling frequency into the current system, is near completion. A new version of the imaging sys-tem drivers has been installed. Modification of current system pack-ages is also underway.
Saltcake dissolution. Model simulations have been completed for saltcake samples from Hanford tanks BY-109, S-110 and U-107. The saltcakes from BY-109 and S-110 are from Hendrickson sort groups 10 and 18, respectively. Compositions from either of these designa-tions have not been analyzed previously. The sample from U-107 is applicable to a demonstration program currently in progress at the site and expected to be completed in FY 2001. Data are reported for the analysis of the BY-109 core sample. ESP predictions were found to be in good agreement with the experimental dissolution tests. Dif-ferences were observed in fluoride ion partitioning, especially with regard to double salt formation. These effects have been observed previously and are being addressed through the experimental pro-
DIAL 40395-11 5

Exective Summary
gram. Laboratory data for solubility studies on the Na3FSO4 system are presented and comparisons made between model predictions from ESP and SOLGASMIX. Future work describing data base develop-ment from these experiments is detailed.
Solids formation. Results are given describing the particle dynamics observed during phosphate plug formation. For these experiments a clear section of channel was inserted into the salt well pumping flow loop and images were collected using the DIAL imaging system. The transport of single sodium phosphate dodecahydrate particles and particle agglomerates were captured and analyzed. Particle sizes and shapes, velocities, agglomerate sizes, the number of particles forming the cluster, single particle and agglomerate growth rates, and charac-teristics of the deposits, moving bed and the eventual plug were deter-mined. Taken together, the sodium phosphate plug formation process is initially characterized by an induction period followed by a period of time where single particles grow. Once these particles achieve a critical dimension, that is dependent on the stream velocity and parti-cle and carrier fluid densities, sedimentation occurs. The later stages of the plug formation process involve the assembly of aggregate par-ticles and subsequent deposition into a moving bed. The large amount of deposited solids collecting within the channel gives rise to reduced stream velocities and the particle agglomeration process continues eventually resulting in a solid plug. All of these processes take place in less than 4 minutes under the investigated experimental conditions. Similar times may be achieved during actual salt well pumping cam-paigns where heat-tracing and/or the dilution of the supernate waste is not optimum. The results indicate that sufficient operational care is needed to prevent phosphate plugs during Hanford waste transfers.
Additional results are presented for initial studies of transport module model sensitivity. Calculations were performed using differ-ent particle size distributions to assess the effect of the shape of the distribution on the particle sedimentation process. Large changes in particle sedimentation was not observed on comparing an average
DIAL 40395-11 6

Exective Summary
particle size with particle size distributions of various widths but the same average size. The larger particles of the broader distributions tended to settle more rapidly but the overall volume fraction of these particles, as compared to that of the total distribution was small. The results indicate that the larger particle sizes may require additional consideration but this is strictly dependent on the shape of the distri-bution. Effects of the particle density and the solution viscosity appeared to be more important than that of the particle size distribu-tion.
Diagnostic Field Applications, Coordination and Testing Support (DFACTS)
HEPA filter testing. DIAL is part of a National Technical Work Group that is developing a research plan for evaluating certain aspects of HEPA filter performance and failure modes as well as eval-uating small particle measurement techniques. Key to the success of the project is the ability to acquire or develop fine particle measure-ment instrumentation that will operate at extremely low particle load-ing ranges as well as the development of calibration techniques for these devices. At the present time the group has agreed upon Data Quality Objectives and is proceeding toward development of an ini-tial Test Plan based on critical path elements and certain needs of the DOE and EPA. The next step is to determine what known elements of the work to be done can actually begin in April without regard to a Test Plan. This will include such actions as procurement of equip-ment and supplies.
The group is communicating via conference calls at two to three week intervals. This is a cost-effective if not expeditious technique for information exchange. However, a meeting of as many of the group members as can attend the International Conference on Incin-eration and Thermal Treatment Technologies in May is planned.
DIAL 40395-11 7

TASK 1 Characterization of Heavy Metals, Radionuclides and Organics in Heterogeneous Media
Volatile Organic Compound Monitoring Using Diode Lasers
C. B. Winstead
Introduction
The United States Department of Energy currently operates three mixed waste thermal treatment facilities (the TSCAI at Oak Ridge, WERF at INEL, and CIF at Savannah River). A concern for these and future DOE facilities is monitoring and controlling the release of vol-atile organic compounds in the facility off-gas. For example, at least five needs are listed in the year 2000 DOE Needs Database that directly request continuous emission monitors (CEMs) for species including organics. Of these five listed needs, four (SR00-1004, ID-2.1.18, ID-S.1.02, and ID-2.1.41) are rated as Priority 1 needs, imply-ing that they are critical to the success of a given mission. The fifth (ID-3.2.32) is rated as Priority 2, indicating that a substantial benefit would be realized if the need were fulfilled. According to the Savan-nah River Site Need Statement (full text available at http://www.srs.gov/general/srtech/stcg/Needs/sr-1004.htm), for CEM pur-poses the desired detection limit for most organics other than dioxins is approximately 1 ug/m3. This corresponds in general to detection
DIAL 40395-11 8

Task 1. Characterization of Heavy Metals, Radionuclides and Organics in Heteroge-
limits in air just below the parts-per-billion range (e.g., 1 ug/m3 of chlorobenzene or trichloroethane is approximately 0.2 ppb). In addi-tion, solutions for numerous other organic monitoring applications are needed throughout the DOE complex (e.g. organic species in groundwater).
This project is a continuation of our previous work that focused on the evaluation of near-infrared diode laser spectroscopy for moni-toring selected volatile organic compounds (VOCs) in air. That work utilized simple multipass absorption techniques to determine the effect of pressure broadening on the sensitivity of VOC detection at available diode laser wavelengths. Extrapolating from these experi-mental results for VOCs in air suggests that a technique known as diode laser cavity ringdown spectroscopy (DL-CRDS) could poten-tially achieve CEM level detection limits with no preconcentration. While our previous multipass absorption experiments indicated a detection limit of 20 ppm for benzene, DL-CRDS should be four to six orders of magnitude more sensitive. This level of detection is approximately equal to just slightly worse than the sensitivity required for an organic CEM. Therefore, an experimental evaluation of the achievable detection limits for VOCs using DL-CRDS is needed. The primary objective of this project is to construct a labora-tory DL-CRDS system and determine its detection limits for selected VOCs. This information will be used to determine if a DL-CRDS sys-tem should be constructed for process gas monitoring next year.
The data gathered this year also will be used to guide the design and construction of an appropriate sampling interface for VOC mea-surements. Although it may be possible that a very advanced DL-CRDS system could achieve CEM detection limits directly in an offgas sample (pending the effects of pressure), for a robust industrial system it may be preferable to use preconcentration in a sampling system to reach lower detection limits. Preconcentration using adsor-bent or cryotrap technology (e.g. a “purge and trap” method) is well developed for on-line gas chromatography (GC). The potential sensi-
DIAL 40395-11 9

Task 1. Characterization of Heavy Metals, Radionuclides and Organics in Heteroge-
tivity of a DL-CRDS system should allow minimal preconcentration (10X - 50X) to be used, allowing for rapid measurements (e.g. every 15 minutes) without the operational complexity, maintenance, and calibration issues associated with GC. Thus, this year’s laboratory measurements are essential to guide the design for the next year’s sampling system. This work will also clarify our capabilities for meeting other DOE needs such as monitoring underground organic plumes, making perimeter or ambient air VOC measurements, or potentially monitoring particulate concentrations at very low levels.
Work Accomplished
Two major physical changes to the DL-CRDS system resulted in greatly improved performance. First, a high vacuum system consist-ing of a liquid nitrogen trap and diffusion pump was integrated with the existing vacuum chamber. This allowed for a significant reduction in the baseline operating pressure of the system and correspondingly a lower concentration limit for introducing analyte molecules. Although the ringdown measurement works wells even at atmo-spheric pressure, a low baseline pressure is needed in order to intro-duce very small partial pressures of volatile organic compounds (VOCs). The new baseline pressure is sufficiently low for mixing VOC calibration standards equivalent to partial pressures of approxi-mately 20 parts-per-billion at atmospheric pressure. The use of such low concentration calibration gases is necessitated by the excellent sensitivity of the ringdown system. Secondly, a new all-metal sample introduction system has been constructed and installed on the ring-down unit. Our earlier multipass absorption efforts used relatively high pressures of chlorobenzene that were not seriously perturbed by slight losses to O-rings, etc. However, the low pressures employed in DL-CRDS measurements necessitated the use of all-metal valves and seals in the vacuum and sample system.
The changes described above have greatly improved the accuracy of sample introduction and the reproducibility of the data. Figure 1
DIAL 40395-11 10

Task 1. Characterization of Heavy Metals, Radionuclides and Organics in Heteroge-
displays data obtained in 1999 using a standard multipass absorption technique together with our latest ringdown results for chloroben-zene. Absorption coefficient, an absolute quantity dependent on the concentration of an analyte, is plotted on the y-axis with chloroben-zene pressure plotted on the x-axis. Note that logarithmic scales have been used to present this data. Because of the vastly improved sensi-tivity of the DL-CRDS data, it is impractical to use linear scales to plot both sets of data. A sample of the new DL-CRDS data is pre-sented on a linear scale in Figure 2. In addition to the new vacuum and sample systems, this data was also taken using an external cavity diode laser (ECDL) system. The ECDL provides much greater wave-length tunability that the distributed feedback (DFB) laser used for the multipass experiments and our early DL-CRDS efforts. Counter-intuitively, to date we have experienced a slight reduction (2X - 3X) in baseline stability when using the ECDL rather than the DFB. We are presently trying to understand this slight reduction, given that the CRDS literature implies at least equivalent, if not improved, stability using ECDLs. However, any system implemented commercially would likely use the more stable DFB lasers manufactured for the appropriate wavelength.
FIGURE 1. Chlorobenzene absorption data obtained using CRDS and multi-pass absorption.
Chlorobenzene
R 2 = 0.9988
1.00E-07
1.00E-06
1.00E-05
1.00E-04
1.00E-03
0.001 0.01 0.1 1 10
Pressure (Torr)
Multipass Cell CRDS Both Linear (Both)
Abs
. Coe
ff. (
1/cm
)
DIAL 40395-11 11

Task 1. Characterization of Heavy Metals, Radionuclides and Organics in Heteroge-
FIGURE 2. CRDS calibration plot for chlorobenzene.
The cavity mirrors used for obtaining the DL-CRDS data in Fig-ures 1 and 2 had an effective reflectivity of 99.983%, slightly below our target value of 99.99%. For a system baseline stability of 0.15% with a 58.4 cm long cavity, these mirrors allow a partial pressure detection limit equivalent to 107 ppb to be obtained. Since this data was taken, we have obtained mirrors of 99.99% reflectivity. At this value, the detection limits would improve to approximately 60 ppb. In Figure 3, a corresponding plot for toluene is presented. The sensitiv-ity is slightly reduced from chlorobenzene. This may be due to a reduced molecular absorption cross-section for toluene vs. chlo-robenzene, although this has not yet been verified. The scanning function of the ECDL is not working properly at present, preventing us from ensuring that we are tuned to the maximum absorption wave-length for toluene. Calculating the current detection limit for toluene as described above for chlorobenzene yields a detection limit of ~300 ppb with 99.99% reflective mirrors. This value may improve with fur-ther experimentation. To date, we have obtained DL-CRDS data for benzene, chlorobenzene, and toluene.
Chlorobenzene DL-CRDS at 1660 nm
0.00E+00
1.00E-07
2.00E-07
3.00E-07
4.00E-07
5.00E-07
6.00E-07
7.00E-07
8.00E-07
9.00E-07
0 0.001 0.002 0.003 0.004 0.005 0.006 0.007
Pressure (Torr)
Abs
. Coe
ff. (
1/cm
)
DIAL 40395-11 12

Task 1. Characterization of Heavy Metals, Radionuclides and Organics in Heteroge-
FIGURE 3. CRDS calibration plot for toluene.
Work Planned
The new configuration for the DL-CRDS system should allow for much more rapid evaluation of the system sensitivity for various VOCs. We plan to continue to expand our database to include addi-tional VOCs of importance for DOE monitoring applications. Addi-tionally, a sampling system has been designed and will soon be under construction that will allow the DL-CRDS system to be connected to a process or combustion gas flow. Such a sampling system can be used for preconcentration and direct introduction of VOCs into the DL-CRDS system. Also, the sampling and DL-CRDS systems will be used in conjunction with a slit-jet supersonic expansion for cooling the VOC molecules to reduce the rotational excitation of the mole-cules. Such cooling will increase sensitivity and selectivity by con-verting the broad absorptions observed at elevated temperatures into sharp, well-defined spectral signatures. Such work will continue in conjunction with other efforts aimed at development of monitors for semi-volatile species such as the dioxins and furans. Both the sam-
Toluene DL-CRDS at 1680.0 nm
0.00E+00
5.00E-08
1.00E-07
1.50E-07
2.00E-07
2.50E-07
3.00E-07
0 0.002 0.004 0.006 0.008 0.01
Pressure (Torr)
Abs
. Coe
ff. (
1/cm
)
DIAL 40395-11 13

Task 1. Characterization of Heavy Metals, Radionuclides and Organics in Heteroge-
pling and slit-jet expansion systems are described in detail in DIAL’s cooperative agreement for 2001 along with development schedules.
Nomenclature
VOC volatile organic compound
CEM continuous emission monitor
GC gas chromatography
DL-CRDS diode laser cavity ringdown spectroscopy
Isotopically Selective Monitors for Transuranic Elements
D. L. Monts and C. B. Winstead
Introduction
A number of DOE needs have been established that are related to the treatment or characterization of waste contaminated with uranium or transuranic (TRU) elements. For example, the Hanford site lists as needs the development of a technology for treating TRU waste con-taminated with PCBs and ignitables (Need RL-MW06) and the devel-opment of a sensitive screening method for selected transuranic elements in soils in a near real time manner (Need RL-SS-14). Although these needs are very different in nature, each will no doubt require the development of a robust, yet sensitive detection system capable of quantifying TRU element concentrations with isotopic res-olution. Such a system would serve as a process monitor in one case or as an on-site analytical tool in another. In addition to needs listed in the DOE needs database, the Idaho National Engineering and Envi-ronmental Laboratory (INEEL) has expressed a need for monitoring residual TRU elements in treated high level waste. Specifically, a need exists for on-line monitoring of the low activity fraction of this
DIAL 40395-11 14

Task 1. Characterization of Heavy Metals, Radionuclides and Organics in Heteroge-
treated waste after dissolution and partitioning. Such a system could replace expensive off-line sampling and analysis and eliminate the need for holding tanks in the Idaho HLW process. This project is pri-marily directed toward on-line monitoring application and thus is most relevant to the efforts of the High-level Waste Tank Remediation Focus area. However, future applications of the developed technology should make this effort relevant to additional needs in process control and on-site monitoring.
In spite of their radioactivity, detecting TRU elements at ultra-sensitive levels has proven to be problematic for traditional radiologi-cal counting methods due to the very long half-lives of these predom-inantly alpha-emitting elements. A new approach is required to allow for rapid measurement of TRU elemental concentrations in an on-line or rapid on-site manner. Optical spectroscopic methods offer signifi-cant promise in such an application and are capable of reaching detection limits far below counting techniques in a very short mea-surement period. This proposal is concerned with the evaluation of two sensitive laser spectroscopic methods, laser-induced fluorescence (LIF) and cavity ringdown spectroscopy (CRDS), for potential use as TRU monitors. In laser-induced fluorescence, a laser is used to excite atoms of the selected element from one electronic state to another. The subsequent fluorescence emitted by the excited atom is moni-tored using a spectrometer and photomultiplier tube arrangement. Under appropriate conditions, the fluorescence intensity is directly proportional to the concentration of the element. In cavity ringdown spectroscopy, the time for a laser pulse to decay in an optical cavity is measured. Analyte atoms introduced into the cavity reduce this “ring-down” time by absorbing light from the laser pulse. For both the LIF and CRDS efforts, atomic species will be generated by injecting stan-dard or surrogate sample solutions into an inductively coupled plasma (ICP). The first step of both the LIF and CRDS processes is the same, namely absorption of laser photons by analyte atoms. The isotopic resolution of each technique is achieved in this first step by using a narrow linewidth laser to excite only one particular isotope of the ele-
DIAL 40395-11 15

Task 1. Characterization of Heavy Metals, Radionuclides and Organics in Heteroge-
ment being measured. Although CRDS theoretically will detect all absorption events and thus might be expected to be the more sensitive of the two techniques, the simpler implementation and better signal-to-noise ratio of LIF could result in LIF being the preferred monitor-ing technique. Experimental evaluation of each technique is required. Recent regulatory approval for the use of uranium in our facility will allow this evaluation to proceed.
Purpose
The primary purpose of this project is to evaluate LIF and CRDS for use as robust, isotopically selective, cost-effective, on-line TRU monitors for the INEEL high-level waste processing facility. Knowl-edge of isotopic abundances is necessary since different isotopes can have widely differing activities. The niche for this technique is deter-mination of concentrations and isotopic abundances for cases where current techniques are severely limited by low throughput: such as (1) cases where the radioactivity is so low that radioactive decay disinte-gration counting techniques cannot analyze samples during accept-able counting periods; and (2) cases where lengthy sample preparation is required for mass spectrometric determination. The performance of these techniques will be evaluated using uranium standards and surrogate waste solutions provided by INEEL. The suc-cessful development and implementation of a TRU monitor could save millions of dollars through the elimination of holding tanks cur-rently planned for the INEEL process. These tanks would be used to hold the treated waste prior to release while TRU analyses are per-formed on the tank contents. Clearly, this particular effort is most rel-evant to the effort of the High level Waste Tank Remediation Focus Area. However, such a system could ultimately provide solutions for needs in other focus areas such as Mixed-Waste Characterization, Treatment, and Disposal. At the end of this project, a full analysis of the sensitivity and selectivity of LIF and CRDS for uranium monitor-ing will be reported, and recommendations for how to proceed in the
DIAL 40395-11 16

Task 1. Characterization of Heavy Metals, Radionuclides and Organics in Heteroge-
construction of an isotopically selective, on-line TRU monitor will be presented.
Methodology
Cavity ringdown spectroscopy. Cavity ringdown spectroscopy (CRDS) is an extremely sensitive variant of absorption spectroscopy that has been demonstrated in a variety of studies. Thus the ringdown technique will be only briefly summarized here. In the original form of CRDS, a laser pulse from a tunable pulsed laser is introduced into a stable optical cavity formed from two highly reflective mirrors (Fig. 4). A fraction of the laser pulse is injected through one cavity mirror
FIGURE 4. Schematic of cavity ringdown spectroscopy (CRDS) apparatus.
and is trapped, propagating back and forth between the mirrors. A photomultiplier tube placed behind the second cavity mirror is used to monitor the time constant for the pulse to decay (also known as the “ringdown” time). The reflectivity of the mirrors and the absorption of a sample in the cavity determine the pulse decay time. The pulse interacts with an absorbing medium in the cavity over the course of potentially thousands of round trips, vastly increasing CRDS sensitiv-ity over standard absorption methods. As the absorption in the cavity increases, the increased optical losses cause the decay time for the light in the cavity to decrease. By inserting into the cavity an appro-priate atomization source, such as an inductively coupled plasma (ICP), very low concentrations of the various chemical forms of TRU elements can be atomized and detected by measuring changes in the
CAVITYMIRROR
CAVITYMIRROR
LASERPULSE
SAMPLEPMT
DIAL 40395-11 17

Task 1. Characterization of Heavy Metals, Radionuclides and Organics in Heteroge-
cavity ringdown time constant. ICP-CRDS, developed at DIAL, is capable of very sensitive detection and has previously been used to demonstrate sub-part-per-billion (sub-ppb) detection limits for lead and a 20-ppb detection limit for mercury.
Laser-induced fluorescence spectrometry. Laser-induced fluorescence (LIF) spectrometry is a well-established, robust technique for detect-ing species of interest at low concentrations. In the LIF technique (Fig. 5), an electronic state of the species of interest is excited with a
FIGURE 5. Schematic of the laser-induced fluorescence spectrometry technique.
tunable laser and the resulting fluorescence intensity is monitored as a function of laser wavelength. Since the masses of isotopes are differ-ent from one another, the corresponding atomic energy levels are slightly different (Fig. 6). Consequently, when a sufficiently high-res-olution tunable laser is scanned across an atomic electronic transition, the resulting LIF spectrum contains a peak associated with each iso-tope present; the intensities of the isotopic peaks are directly related to the concentration of the isotope. Hence the isotopic abundances can readily be obtained from the LIF spectrum. In order that the indi-vidual isotopic transitions can be resolved, it is necessary that the species of interest be in the gas-phase. For the TRU elements of inter-
NARROWBANDLASER
LENS
SPECTROMETER
DETECTOR
ATOMIZATIONSOURCE
DIAL 40395-11 18

Task 1. Characterization of Heavy Metals, Radionuclides and Organics in Heteroge-
est, an atomization source is required in order to volatilize and atom-ize the sample. A calibration curve is obtained by recording the LIF signal intensity as a function of concentration. Using the calibration curve, unknown concentrations can be determined.
FIGURE 6. Schematic of isotopic energy shifts and the associated LIF spectrum.
Work Accomplished
Cavity ringdown spectroscopy. Evaluations of CRDS performance have been carried out for two absorption lines of uranium, 286.6 nm and 358.4 nm. These lines represent ionic and atomic transitions, respectively. Optimization of plasma conditions has been carried out and detection limits determined for each transition using depleted uranium. Figure 7 displays a wavelength scan of the ionic absorption at 286.6 nm with and without injecting uranium into the ICP. As is evident from the figure, a background absorption line from the plasma is coincident with the uranium absorption at this wavelength. This increased background loss decreases the sensitivity of the sys-tem in its present configuration by approximately a factor of five. However, even with this increased background loss a detection limit of 600 ppb (600 ng/ml) is obtained (see Fig. 8 for calibration plot). This detection limit was achieved at an input power of 350 Watts, an optimum power level somewhat higher than determined previously for lead or mercury. The cavity mirrors used for this experiment were
U-235
U-235
U-235
U-238
U-238
U-238
ISOTOPE SHIFT
EMISSIONINTENSITY
λWAVELENGTH
DIAL 40395-11 19

Task 1. Characterization of Heavy Metals, Radionuclides and Organics in Heteroge-
originally coated for 280 nm use, so that the reflectivity at 286.6 nm is only 99.65%. Mirrors can be obtained with a reflectivity approach-ing 99.9% at 286.6 nm. The use of such mirrors would improve the detection limit to 170 ppb, with continuing improvement as the mir-ror reflectivity is improved. Note that the uranium transition depicted in the Figure 7 is due to the U-238 isotope dominant in depleted ura-nium. The U-235 transition will be shifted by 8.67 pm and will be resolvable from the U-238 absorption in the ICP-CRDS spectra. We have previously demonstrated resolution of features separated by as little as 1.1 pm in the isotopic spectrum of mercury. Standard solu-tions of enriched uranium (97% U-235) are in preparation for demon-stration of this isotopic resolution and evaluation of interference effects.
FIGURE 7. CRDS wavelength scan of U II absorption at 286.6 nm and of unknown interference from argon plasma.
286.56 286.57 286.583.40E-007
3.60E-007
3.80E-007
4.00E-007
4.20E-007
4.40E-007
4.60E-007
4.80E-007
5.00E-007
5.20E-007
5.40E-007
5.60E-007
Rin
gdow
n T
ime
1/15/01 12:22:54
U(II)
Unknown interference line from argon plasma
U(286.6 nm) and background spectrascan speed: 0.0006 nm/s
Wavelength
DIAL 40395-11 20

Task 1. Characterization of Heavy Metals, Radionuclides and Organics in Heteroge-
FIGURE 8. CRDS calibration curve for U II absorption at 286.6 nm, showing absorbance per pass as a function of uranium concentration. A linear least squares fit obtains a linear-correlation coefficient R2 value of 0.9943.
In Figure 9, the calibration curve for uranium neutral atom absorption at 358.448 nm is presented. This line was subject to a
FIGURE 9. CRDS calibration curve for U I absorption at 358.448 nm,showing absorbance per pass as a function of uranium concentration. A linear least squares fit obtains a linear-correlation coefficient R2 value of 0.999.
more unusual interference than was observed for the 286.6 nm transi-tion. This line demonstrated a strong response when a blank acidic solution was injected, but only if uranium had been previously used
U II at 286.6 nm
R2 = 0.9943
0.00E+00
2.00E-04
4.00E-04
6.00E-04
8.00E-04
1.00E-03
0 1 2 3 4 5 6
U (ppm)
Abs
orba
nce
per
Pas
s
U I at 385.4 nm
R2 = 0.999
0.00E+00
5.00E-06
1.00E-05
1.50E-05
2.00E-05
2.50E-05
0 1 2 3 4 5 6
U (ppm)
Abs
orba
nce
per
Pas
s
DIAL 40395-11 21

Task 1. Characterization of Heavy Metals, Radionuclides and Organics in Heteroge-
in the ultrasonic nebulizer. Although this is suggestive of a memory effect in the sample introduction system, the behavior was not observed at the 286.6-nm absorption line, suggesting a simple mem-ory effect was not responsible. We are still working to understand this very unusual behavior. Because of this effect, the detection limit was limited ~1 ppm under our current conditions.
Laser-induced fluorescence spectrometry. During this quarter, a source of enriched U-235 was identified and a sample was obtained. Isotopi-cally enriched standards are necessary for determining the precision and accuracy of isotopic abundance measurements by permitting preparation of sample solutions of varying relative isotopic abun-dance. U-235 enriched standard solutions are in preparation and iso-topic abundance measurements are being initiated. Due to the delay in the arrival of the enriched U-235 standards, results will be avail-able in the next quarter.
FIGURE 10. Image of 424-nm U emission from a 20-ppm solution of uranium in an argon ICP plasma. The image was recorded using a 3-nm bandwidth notch filter with a center wavelength of 422.7 nm. Background emission from the argon ICP plasma has been subtracted from this image. An image of a ruler has been superimposed on the image of the plasma to enable determination of uranium emission intensity as a function of height above the ICP torch.
DIAL 40395-11 22

Task 1. Characterization of Heavy Metals, Radionuclides and Organics in Heteroge-
During this quarter, spectral imaging was utilized to determine where in the ICP plasma is the optimum location for laser excitation of the uranium. Figure 10 shows a background-subtracted spectral image of 424-nm U emission from a 20-ppm solution of uranium in an argon ICP plasma.
Work Planned
Cavity ringdown spectroscopy. Experiments aimed at demonstrating the isotopic resolution capability of ICP-CRDS are beginning now that enriched uranium has been obtained. Given successful results for these experiments, CRDS efforts toward isotopic uranium monitoring will focus on the construction of a small unit using a direct blue diode laser system. These small external cavity diode lasers are available for wavelengths ranging from 388 to 430 nm and are only slightly larger that a typical helium-neon laser, yet possess an extremely nar-row linewidth easily capable of isotopic resolution. Interestingly, Human et al. achieved a fluorescence detection limit for uranium in an ICP of 20 ppb using 409 nm excitation.1 They were unable to iso-topically resolve the 4.74 pm splitting2 of this transition due to the large linewidth of their laser (12 pm). In contrast, our previous CRDS efforts using a narrow-linewidth pulsed dye laser have demonstrated isotopic resolution of mercury in an air-ICP, quantifying isotopic abundance using features separated by as little as 1.1 pm.3 Combining results from Ref. 1, our CRDS results for mercury, and the recent availability of blue diode lasers suggests that a small, sensitive, and isotopically selective ICP-CRDS or ICP-LIF monitor is feasible.
Laser-induced fluorescence spectrometry. We are beginning experi-ments using uranium solutions with varying isotopic abundances. A prerequisite for successful completion of this project is for a suffi-ciently narrow-linewidth, tunable laser system that can be reproduc-ibly scanned. In collaboration with the CRDS group, we will soon perform experiments using CRDS’ moderately high-resolution dye laser system to evaluate whether or not that laser is sufficiently nar-
DIAL 40395-11 23

Task 1. Characterization of Heavy Metals, Radionuclides and Organics in Heteroge-
row to isotopically resolve uranium. If as expected these LIF experi-ments prove that such a moderately high-resolution tunable laser system has sufficient resolution for uranium, then a comparable dye laser system will be purchased for this effort; if those experiments indicate that even higher resolution is required, then additional fund-ing will be sought in order to purchase an ultra-high resolution tun-able laser system.
For LIF detection, it is preferable to detect fluorescence emission at a different wavelength than the laser excitation; this enhances the ability to distinguish between signal due to the species of interest and signal due to scattered laser radiation. To date, our choice of excita-tion/detection transition pairs has been limited by our detection sys-tem, which utilizes a low-resolution spectrometer. During the next quarter, we expect to purchase a detection system that will enable us to detect excitation/detection wavelengths that are more closely spaced (such as the 286-nm/289-nm pair) than we are currently capa-ble of utilizing.
Our efforts will concentrate on selection of the optimum excita-tion/detection transition pairs for LIF detection. The ideal excitation/detection pair has large intrinsic transition strength, a relatively wide isotopic splitting, and occurs in a spectral region where relatively large laser powers can readily be achieved; many of the possible exci-tation/detection transition pairs have only one or two of these attributes. A variety of different excitation/detection transition pairs will be investigated and the optimum pair will be selected. For excita-tions that occur within the tuning range of CRDS’ blue diode laser, we will evaluate the feasibility of utilizing the blue diode laser for detection; however, the blue diode laser’s modest laser power (3 mW) may limit the achievable limit of detection.
DIAL 40395-11 24

Task 1. Characterization of Heavy Metals, Radionuclides and Organics in Heteroge-
References
1. H.G.C. Human, N. Omenetto, P. Cavalli, and G. Rossi. 1984. Laser excited analytical atomic and ionic fluorescence in flames, furnaces and inductively coupled plasmas-II. fluorescence characteristics and detection limits for fourteen elements. Spectrochemica Acta 39B:9-11:1345-1363.
2. J.A. Vera, G.M. Murray, S.J. Weeks, and M.C. Edelson. 1991. Isotopic abundance determination by inductively coupled plasma high-resolution laser excited atomic and ionic fluorescence spectroscopy. Spectrochemica Acta 46B:13:1689-1700.
3. C. Wang, F.J. Mazzotti, G.P. Miller, and C.B. Winstead. Cavity ringdown as a diagnostic tool for inductively coupled plasmas. In preparation for submission to Spectrochemica Acta.
Nomenclature
CRDS cavity ringdown spectroscopy
DIAL Diagnostic Instrumentation and Analysis Laboratory
DOE U.S. Department of Energy
HLW high-level waste
ICP inductively coupled plasma
INEEL Idaho National Engineering and Environmental Labo-ratory
LIF laser-induced fluorescence
ng nanograms
nm nanometer
PCB polychlorinated biphenyl
pm picometer
ppb parts-per-billion
ppm parts-per-million
TRU transuranic
DIAL 40395-11 25

Task 1. Characterization of Heavy Metals, Radionuclides and Organics in Heteroge-
Laser-induced Breakdown Spectroscopy
H. Zhang, F. Y. Yueh and J. P. Singh
Introduction
This technical task has been focused on the development and application of laser-induced breakdown spectroscopy (LIBS) to mon-itor Resource Conservation and Recovery Act (RCRA) metals from thermal treatment processing facilities. LIBS is a laser-based, non-intrusive, and sensitive optical diagnostic technique for measuring the concentration of various atomic and molecular species in test media.4,5 It uses a high-power laser beam to produce a laser-induced plasma at the test point. The plasma atomizes and electronically excites the various atomic species present in the test volume in a sin-gle step. The intensities of the atomic emission lines observed in the LIBS spectrum are used to infer the concentration of the atomic spe-cies. LIBS has been successfully demonstrated its real time monitor-ing capability in various field tests.6-13
Work Performed
The CEM tests were performed on October 25, 26, and 27, 2000 on the DIAL combustion test stand. LIBS system was installed in a vertical section of the exhaust as shown in Figure 11. The exhaust gas was flowing vertically down the pipe. The reference method (RM) sampling system was installed at a port about seven feet above the LIBS port. The metal aerosols were injected into the exhaust stream at the bottom of an n-shape pipe (see Fig. 11) using a nebulizer. The test stand was operated with 500 lb/hr air and a stoichiometry (phi) of 1.05 during the CEM test. The air was preheated to the temperature of 200˚C before mixing with the fuel. The temperature at the test loca-tion was maintained at ~ 150˚C during the test. The water content of the gas stream was about 9.5%. The appropriate concentrations of
DIAL 40395-11 26

Task 1. Characterization of Heavy Metals, Radionuclides and Organics in Heteroge-
aqueous solution of Be, Cd, Pb, and Cr were prepared from the stan-dard solution and nebulized into the exhaust gas. While LIBS was recording the data, samples of the exhaust stream were collected with RM-29. The standard RM sampling time was 60 minutes. The sam-ples collected by RM-29 were later sent to a certified laboratory for quantitative analysis. The results from RM-29 were received on Janu-ary 29, 2001.
FIGURE 11. LIBS CEM setup in DIAL test stand.
The on-site calibrations were done by injecting the known con-centration of metal aerosols into the gas stream with a probe. The sample injection probe was mounted on the opposing port across the gas stream. The laser beam was focused very close to the nozzle of
Laser Spark
Wall
LIBS
RM-29
SampleInjection
DIALCombustionFurnace
DIAL 40395-11 27

Task 1. Characterization of Heavy Metals, Radionuclides and Organics in Heteroge-
the sample injection tube to achieve a reliable calibrations. Calibra-tion data for Cr, Pb, Be, and Cd were obtained from test stand one day before the test started and every day after the test. Two spectral regions were monitored to study the four interested test elements. Cr 425.4 nm and Pb 405.8 nm lines were monitored in the spectral region 402 - 432 nm with a 1800 l/mm grating and Be 234.86 nm and Cd 226.5 nm lines were monitored in the spectral region 225 - 236 nm with a 3600 l/mm grating. During the system checkup operation, we noticed that Cr signal was present even without the solution injec-tion. This signal came from the Cr in the refractory used in the upstream.
On October 25, the standard solution of 2500 ppm Be, Cd, and Pb was injected into the gas stream to record the LIBS spectra. The observed LIBS signals were very weak. We later discovered that two optics (a harmonic separator and a dichroic mirror) were damaged, which reduced the laser energy in the focal volume. We also found that the dichroic mirror has poor transmission for UV. Therefore, Cd was not detected in this test day. The Pb signal has a poor signal-to-noise ratio. We replaced the damaged optics after the test. Calibration curves were obtained with the new optics. The new dichroic mirror had greatly improved the detection limit of Cd.
On October 26, the standard solution of 1250 ppm Be, Cr, Cd, and Pb was injected into the gas stream. The data were analyzed using the calibration data obtained on October 25. Figure 12 shows the variation of Cr concentration during the RM sampling. The results for Pb was not very reliable because of the poor signal-to-noise ratio. We injected the solution of 5000 ppm Cd and Pb after the RM sam-pling. After this a good signal-to-noise ratio for Cd and Pb were obtained at this concentration level.
DIAL 40395-11 28

Task 1. Characterization of Heavy Metals, Radionuclides and Organics in Heteroge-
FIGURE 12. Variation of Cr concentration during the RM sampling.
Two test runs were conducted on October 27. In the first run, we used a solution of 200 ppm Be, 300 ppm Cr, 1000 ppm Cd, and 2000 ppm Pb. The RM sampling time was 90 minutes. In the second run, we used the standard solution of 1250 ppm Be, Cd, Cr, and Pb. The RM sampling time was 60 minutes for this run.
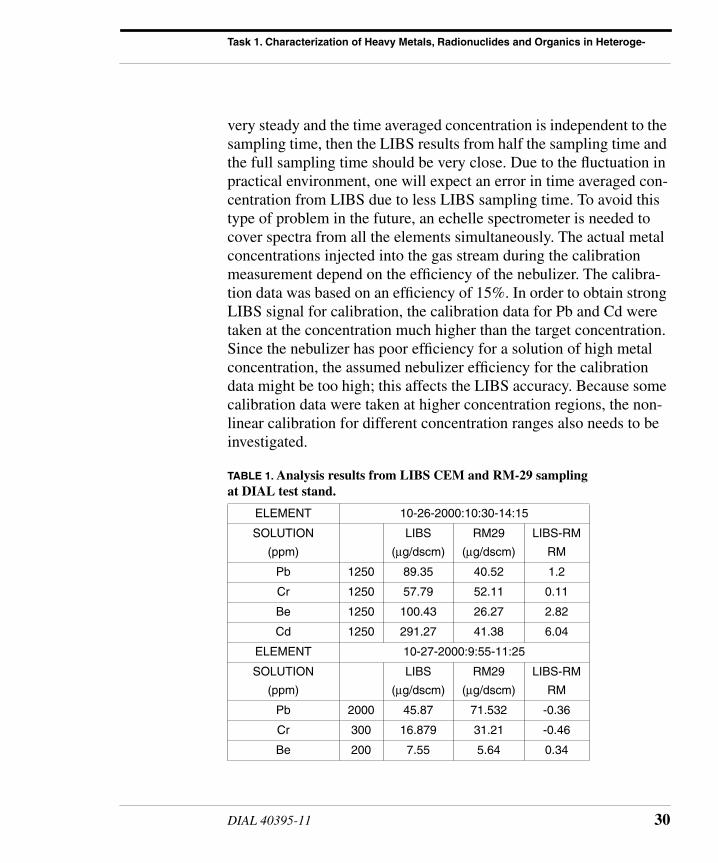
The metal concentrations determined by LIBS and RM-29 are summarized in Table 1. The relative accuracy defined as (LIBS-RM)/Rm is also reported in Table 1. The data from October 25 were not included because no valid calibration data could be used. LIBS results for Cr are in good agreement with the RM-29 results except the first RM of October 27. The inferred concentration of Be, Pb, Cd are all higher than the RM results. The Pb and Cd have the detection limit close to the target concentration in this test, therefore, the accu-racy for Pb and Cd are expected poor. The reasons for higher Be con-centration are still under investigated. Since we monitor four elements in two different spectral regions, we can only monitor one element about half the sampling time. If the gas stream condition was
10/26/00
0
10
20
30
40
50
60
70
13:16:19 13:23:31 13:30:43 13:37:55 13:45:07 13:52:19 13:59:31 14:06:43 14:13:55
Time
Time Averaged Concentration: 38.1 µg/acm
Cr
Con
cent
ratio
n (µ
g/ac
m)
DIAL 40395-11 29
Task 1. Characterization of Heavy Metals, Radionuclides and Organics in Heteroge-
very steady and the time averaged concentration is independent to the sampling time, then the LIBS results from half the sampling time and the full sampling time should be very close. Due to the fluctuation in practical environment, one will expect an error in time averaged con-centration from LIBS due to less LIBS sampling time. To avoid this type of problem in the future, an echelle spectrometer is needed to cover spectra from all the elements simultaneously. The actual metal concentrations injected into the gas stream during the calibration measurement depend on the efficiency of the nebulizer. The calibra-tion data was based on an efficiency of 15%. In order to obtain strong LIBS signal for calibration, the calibration data for Pb and Cd were taken at the concentration much higher than the target concentration. Since the nebulizer has poor efficiency for a solution of high metal concentration, the assumed nebulizer efficiency for the calibration data might be too high; this affects the LIBS accuracy. Because some calibration data were taken at higher concentration regions, the non-linear calibration for different concentration ranges also needs to be investigated.
TABLE 1. Analysis results from LIBS CEM and RM-29 sampling at DIAL test stand.
ELEMENT 10-26-2000:10:30-14:15
SOLUTION
(ppm)
LIBS
(µg/dscm)
RM29
(µg/dscm)
LIBS-RM
RM
Pb 1250 89.35 40.52 1.2
Cr 1250 57.79 52.11 0.11
Be 1250 100.43 26.27 2.82
Cd 1250 291.27 41.38 6.04
ELEMENT 10-27-2000:9:55-11:25
SOLUTION
(ppm)
LIBS
(µg/dscm)
RM29
(µg/dscm)
LIBS-RM
RM
Pb 2000 45.87 71.532 -0.36
Cr 300 16.879 31.21 -0.46
Be 200 7.55 5.64 0.34
DIAL 40395-11 30

Task 1. Characterization of Heavy Metals, Radionuclides and Organics in Heteroge-
Work Planned
Liquid LIBS data will be collected under an external steady mag-netic field to study the effect of magnetic field on the LIBS signal enhancement.
References
4. D.A. Cremers and L.J. Radziemski. 1987. Laser plasmas for chemical analysis. In Laser Spectroscopy and its Application, L.J. Radziemski, R.W. Solarz, J.A. Paisner, eds. New York: Marcel Dekker, 5:351.
5. L.J. Radziemski and D.A. Cremers. 1989. Spectrochemical analysis using plasma excitation. In Laser Induced Plasmas and Applications, L.J. Radz-iemski and D.A. Cremers, eds. New York: Marcel Dekker, 7:295-326.
6. J.P. Singh, F.Y. Yueh, H. Zhang. 1997. Process Control and Quality, 10:247.
7. J.P. Singh, H. Zhang, F.Y. Yueh and K.P. Carney. 1996. Applied Spectros-copy, 50:764.
8. J.P. Singh, H. Zhang and F.Y. Yueh. February 1996. Transportable Vitrifi-cation System Shakedown Test. Westinghouse Savannah River Corpora-tion and Diagnostic Instrumentation and Analysis Laboratory: Laser-
Cd 1000 51.85 39.97 0.297
ELEMENT 10-27-2000:13:24-14:24
SOLUTION
(ppm)
LIBS
(µg/dscm)
RM29
(µg/dscm)
LIBS-RM
RM
Pb 1250 46.3 38.45 0.2
Cr 1250 36.2 36.57 -0.011
Be 1250 65.46 22.66 1.88
Cd 1250 160.97 40.7 2.95
TABLE 1. Analysis results from LIBS CEM and RM-29 sampling at DIAL test stand.
DIAL 40395-11 31

Task 1. Characterization of Heavy Metals, Radionuclides and Organics in Heteroge-
induced Breakdown Spectroscopy Measurements. US DOE Contract No. DE-FG02-93CH-10575. DIAL 10575 Trip Report 96-1.3.
9. J.P. Singh, H. Zhang and F.Y. Yueh. April 1996. DOE and EPA Continuous Emission Monitoring Test at EPA National Risk Management Research Laboratory (NRMRL). US DOE Contract No. DE-FG02-93CH-10575. DIAL 10575 Trip Report 96-2.
10. Singh, J.P., Zhang, H., Yueh, F.Y. 1996. “Plasma Arc Centrifugal Treat-ment PACT-6 Slip Stream Test Bed (SSTB) 100-hour Duration Controlled Emission Demonstration (CED) Test”,DIAL Trip Report 96-3.
11. Singh, J.P., Zhang, H., Yueh, F.Y. September 1997. DOE and EPA Contin-uous Emission Monitoring Test at EPA National Risk Management Research Laboratory (NRMRL), DIAL Trip Report 97-1.
12. Zhang, H., Yueh, F.Y., and Singh, J.P., 1999. Appl. Opt. 38:1459-1466.
13. Zhang, H., Yueh, F.Y., and Singh, J.P. 2001. J. Air & Waste Manage. Assoc. 51:174-180.
DIAL 40395-11 32

TASK 2 Environmental Control Device Testing
Performance Enhancement of the Ionizing Wet Scrubber
R. ArunKumar
Introduction
The IWS is one of the few commercial effective micron and sub-micron particulate removal systems used to treat effluent gas from incineration and waste processing systems. The system operates essentially like a wet-electro static precipitator, but some its theory of operation differs slightly, primarily with respect to the development of particulate charges. In this study, we plan to enhance the perfor-mance of the IWS and overcome some of the problems associated with its operation. Current problems include plate life and perfor-mance with respect to plate spacing and applied voltage. Information obtained from this task should enable DOE operators of the IWS to operate this particulate cleaning device more confidently.
Baseline measurements of the IWS unit will initially be con-ducted in regard to its performance and particulate removal effi-ciency. In order to complete this task we will need a particulate feeder of a sufficiently large size to simulate particulate loading at the incin-erator facilities. We hope to obtain the feeder that is currently at the
DIAL 40395-11 33

Task 2. Environmental Control Device Testing
One Tenth Scale Combustion facility at the Savannah River Site and install it at our site. We will survey the DOE incinerator sites to deter-mine the order of importance of the operational issues that need to be addressed with the IWS. These may include some problems that we have not yet identified. We will then select the most important tasks that we think can be solved in the given time frame. As part of our technology transfer mission, and in exchange for lending the IWS unit to DIAL, we will share the information gained with ITEQ, the manufacturer of the unit.
Work Accomplished
We have finished evaluating other commercial sources of fine par-ticulate feed systems and have issued a purchase order for a volumet-ric powder feeder. This powder feeder will be at DIAL after another four weeks or so. We were not able to get the powder feeder from the one-tenth scale facility at the WSRC site.
Work Planned
There is no budgetary allocation in the next cooperative year for completion of this project, but we will have all the elements for per-forming tests on the IWS. We shall work on IWS testing as time per-mits, using an EPA Method 5I sampling to determine particulate removal efficiencies.
DIAL 40395-11 34

Task 2. Environmental Control Device Testing
Testing of a Ceramic Regenerative Heat Storage Device for Dioxin Control and Heat Recovery
O. P. Norton
Introduction
The new MACT standards for dioxins (0.2 ng/dscm TEQ) will challenge incinerator operators, the DOE included. DOE waste reme-diation facilities that will be impacted by these rules include the Con-solidated Incineration Facility (CIF) at Savannah River and the TSCA incinerator at Oak Ridge. Also, we note that the processes that form dioxins and furans could also occur in other thermal waste treatment systems, such as vitrification systems and plasma torch-based sys-tems, so the impact on DOE's EM program could be considerable.
Although our knowledge of dioxin formation mechanisms and kinetics is incomplete, it is generally accepted that dioxins and furans are formed as combustion products (flue gases with associated partic-ulates and products of incomplete combustion) are cooled down-stream of the combustor. Tuppurainen et al.14 give the dioxin formation range as 250 to 650°C, with the maximum at about 300°C. Karasek and Dickson15 found that the optimum temperature range for the formation of dioxins from pentachlorophenol was 250 to 350°C. Altwicker et al.16 give the critical temperature range as 250 to 400°C. Although these different sources report slightly different critical tem-perature ranges for dioxin formation, it is clear that dioxins and furans are formed at fairly low temperatures as the combustion prod-ucts cool.
This insight suggests that dioxin could be controlled by quench-ing—cooling the exhaust gases as quickly as possible through this critical temperature band. Rapid quenching is indeed a common
DIAL 40395-11 35

Task 2. Environmental Control Device Testing
dioxin control mechanism in municipal solid waste incinerators, and dioxin formation can be minimized by this strategy.14
Santoleri and Budin17 report: “Systems that are able to quench the high temperature combustion gases from 1000 - 1200°C to adiabatic [sic] (75 - 90°C) in fractions of a second have emissions well below the levels established by the MACT standards (0.2 ng/dscm TEQ).”
Thus, rapid quenching—cooling the flue gases through the criti-cal temperature range as quickly as possible—is an effective method of dioxin control. Water sprays have been effective for dioxin control, but this method essentially wastes the thermal energy in the combus-tion products. Also, for hazardous and radioactive waste incineration, a secondary waste stream will be created.
We propose that a regenerative heat recovery system can be used to control dioxin emissions. Regenerators have long been used to recover waste heat from flue gases, using this heat to preheat the incoming combustion air. If the cooling of the hot gases in the regen-erator is sufficiently rapid, dioxin formation should be minimized as well.
A novel regenerative heat storage device is proposed that can be used to suppress dioxin formation in the off-gas of a thermal waste treatment plant. The flue gas is rapidly cooled as it passes through the device to prevent the formation of dioxins and furans from the precur-sors that are present in the gas. When integrated into a waste incinera-tion plant, this device can also be used to recover the sensible heat in the flue gas and provide preheated combustion air.
During the previous year, a computer model was developed for a pebble-bed regenerator and was used to size a regenerator for DIAL's combustion test stand.
DIAL 40395-11 36

Task 2. Environmental Control Device Testing
This computer model was used to size a pebble-bed regenerator for DIAL's combustion test stand. Our calculations indicate that this design will quickly cool the combustion products through the critical dioxin formation temperature range—with a mean residence time of 0.6 to 0.7 seconds. Thus, this regenerator design should provide effective dioxin control.
During the current year, we will build and test this device on DIAL's combustion test facility. With a newly designed and built piece of equipment, testing should proceed incrementally, at each step verifying that the equipment performs according to design. The test sequence will proceed as follows: First, cold flow tests will be performed with no combustion to verify that the flow switching valves work properly and that our control system is sequencing the valves properly. Then, hot testing will begin. These tests will be per-formed to verify the correct operation of the system: that the flow switching valves work at the high temperatures for which they were designed and that the pebble beds cool the combustion gases as they should. During this phase of testing, the pebble beds will be instru-mented with thermocouples to measure the inlet and outlet gas tem-peratures, as well as temperatures inside the pebble bed at selected locations. The flow rates of gases through the beds will be measured. Also, the pressure drop across each bed will be measured.
These results will verify proper operation of the regenerator. The temperature measurements will be compared to the predictions of our model, and we hope that this comparison will validate the model. Also, the temperature measurements will verify that the desired quenching rate has been achieved.
The ultimate objective of this test program will be to demonstrate that the degree of quenching produced by the pebble bed is effective in reducing dioxin emission. To do this, we would like to perform a series of tests on DIAL's combustion test stand, injecting dioxin pre-cursors upstream, and measuring dioxin levels downstream.
DIAL 40395-11 37

Task 2. Environmental Control Device Testing
The dioxin level downstream of the regenerator will be measured and compared to the control—the same test facility without the regenerator. We will, of course, ensure that the combustion parame-ters, such as the fuel/air ratio, are the same in both cases. DIAL main-tains an in-house capability to perform dioxin measurements using EPA Method 23.
However, we must point out that there is currently some uncer-tainty about our permission to carry out tests of this nature. Once this situation is resolved, a detailed test plan for the dioxin testing will be written before the start of these tests, and submitted to the Task Mon-itor for approval.
After the computer model has been validated by experiment, and we have verified that the rate of quenching is effective in reducing dioxin emissions, the validated computer model will be used to assess various approaches to scaling up. Maximum pebble bed size will be determined. Multiple regenerator configurations will also be studied as a possible approach to large-scale operation.
Work Accomplished
Fabrication work has been completed. The system has been installed in DIAL's Combustion Test Stand (CTS). The refractory lin-ing has been cast and cured, the regenerator towers have been packed with alumina ceramic balls, and thermocouples have been installed in these packed beds.
The freeze damage suffered by the CTS, noted in the previous quarterly report, has been repaired and the CTS is again operational.
DIAL 40395-11 38

Task 2. Environmental Control Device Testing
Work Planned
DIAL's Chief Test Engineer, R. Arunkumar, has scheduled the week of April 16, 2001 for testing the ceramic pebble bed regenera-tor. We plan to complete the testing of the device during this week.
We will not be able to perform actual dioxin testing in DIAL's CTS. Therefore, the test program will be limited to validating our computer model predictions of pebble bed regenerator performance and verifying that the quenching of the combustion products is suffi-ciently rapid.
References
14. K. Tuppurainen, et al. 1998. Formation of PCDDs and PCDFs in munici-pal waste incineration and its inhibition mechanisms: a review. Chemo-sphere, 36:7:1493-1511.
15. F.W. Karasek and L.C. Dickson. 1987. Model studies of polychlorinated dibenzo-p-dioxin formation during municipal refuse incineration. Science, 237:754-756.
16. E.R. Altwicker, et al. 1990. Polychlorinated dioxin/furan formation in incinerators. Hazardous Waste and Hazardous Materials, 7:1.
17. J.J. Santoleri and M.L. Budin. May 1998. The impact of thermal oxidation quench systems on dioxin formation. IT3 Conference: International Con-ference on Incineration and Thermal Treatment Technologies, Salt Lake City, Utah.
DIAL 40395-11 39

Task 2. Environmental Control Device Testing
Transportable Calibration Test Stand for Diagnostic Instrumentation
R. ArunKumar
Introduction
With the advent of modern diagnostic techniques for continuous emission monitors (CEM) and process monitors (PM), a need has evolved for the development of a bench-scale test train that can be used for process simulation as well as for calibration of such instru-mentation. The application of some of these instruments is limited by the availability of calibration streams, especially for low concentra-tions. In this task, we will construct a versatile test bed that will be used for calibration of optical diagnostic instrumentation over a range of temperature and concentration levels, for both combustion and non-combustion applications.
The system, as shown in Figure 13, consists of air-flow, fuel-flow, and dopant-delivery streams. The air-delivery system contains a pres-sure regulator, followed by a thermal mass flow measurement and control system, and an electric air heater. A dopant solution is deliv-ered to a nebulizer or acoustic atomizer, which injects it as a fine mist of droplets into the throat of a venturi in the air-delivery system. Pro-pane is regulated, and its flow is controlled by a similar thermal mass flow meter/controller and injected into the throat of a second venturi in the air-delivery system. The throat of a venturi provides a conve-nient place for injection of secondary streams, providing a lower pressure and also a smaller cross-section for more uniform disper-sion. This combustible air stream is then ignited using a spark plug in the burner. The burner itself consists of a short water-cooled section followed by a hotter un-cooled tube to maintain flame stability.
DIAL 40395-11 40

Task 2. Environmental Control Device Testing
FIGURE 13. Schematic of the transportable calibration test stand for diagnostic instrumentation.
Work Accomplished
The system has now been put together and is in operation. As reported in the previous quarterly report, the combustion aspect of the system has been tested and is working well. We have not fully over-come the dopant delivery to the inlet stream, but we are running tests on a modified configuration. It looks promising, although the flow rates of the dopant into the stream will be restricted. In order to vary the concentration of metals in the gas stream, we will alter dopant concentrations rather than the dopant flow rates. We are in the process of conducting LIBS measurements on this system. Although we have not been able to take this task to its completion during this fiscal year, we will continue working on it over the next year as time permits, since this system can be a vital component in the calibration of instru-mentation being developed at DIAL.
T e m p .Contro l lerT
SparkGenerator
PressureRegulator
PressureRegulator
FlowControl ler
FlowControl ler
Air Heater(Electr ic)
Inject ion Pump(Syringe/Peristalt ic)
Spark Plug
Ventur i
Ventur i Opt ical Ports
Propane
Air
Exhaust
MetalSolut ion
Nebu l i ze r /Acous t i cEvaporator
(opt ional )
Burner Cool ingWater
DIAL 40395-11 41

Task 2. Environmental Control Device Testing
Evaluation and Performance Enhancement of a Submerged Bed Scrubber
R. ArunKumar
Introduction
Submerged bed scrubbers (SBS) were originally developed by PNNL for treatment of offgas from nuclear reactors. SBSs have been proposed for use on the cleanup systems for scrubbing off-gases from liquid-fed ceramic melters used to vitrify high-level waste, and from other thermal processes. SBSs serve dual purposes in that they act as a quench for high temperature exhaust gas and remove at least 90% of the airborne particulate matter. These scrubbers are, however, suscep-tible to certain kinds of problems, including poor gas distribution, gas surging, channeling, and bumping. In this task, we propose to add a better gas distribution system under the SBS, as well as replace the conventional spherical bed media with an engineered aggregate pro-duced by Ushers, Inc. This “tetrajack” material more efficiently fills the bed volume than do spheres (> 90% fill) and forces the gas stream to follow a tortuous path through the SBS.
Figure 14 shows a scale model of the West Valley SBS that has been constructed. It is primarily split into two parts: the gas distribu-tion section and the scrubber bed section. Constructed of clear acrylic, the dual section assembly will allow us to observe, as well as readily test, different configurations of the gas distribution system.
DIAL 40395-11 42

Task 2. Environmental Control Device Testing
FIGURE 14. Scale model of West Valley submerged bed scrubber.
Operation of the test bed without modification will first be per-formed to develop baseline performance data. The gas distribution in the bed will be observed visually, as will gas surging through the sys-tem. If needed, a positive air pressure delivery system can also be used to study gas distribution. Flow stability and surge parameters can be detected using differential pressure sensors. The first aspect of the testing will be to ensure that a uniform distribution of the gas is obtained under the submerged bed using a positive pressure feed sys-tem. This will be followed by testing using an induced draft fan, where surge effects can be determined and minimized. EPA measure-ments to determine particulate retention will be completed in the final stage of the testing. Capture of fine particulate material (talc or titania particles) and of simulated semi-volatile material (Cs salt) will be monitored, as will SBS operating parameters (e.g., flow rate, pressure drop).
To ID Fan
22.00
AirDistr ibutor
AirConverger
16.00
12.00
24.00
4.00
SUBMERGEDBED COLUMN
INLETAIR
SUPPORTGRID
AIRINLET
DIAL 40395-11 43

Task 2. Environmental Control Device Testing
At this point, the system will be cleaned, and the spherical bed material will be replaced by Ushers’ proprietary material. The base-line testing will be repeated to evaluate the performance of this mate-rial. Then, the SBS model will be disassembled, and a flow distribution system will be inserted and tested with conventional (spherical) bed material. The same parameters will be monitored and evaluated.
Work Accomplished
We have completed the bulk of the measurements using both the marble bed and the tetra jack bed. Testing was accomplished using two different bed heights for both the materials. In the initial tests, with the DIAL-designed air distribution system, we had initial water column heights of about 21 inches in the bed. Particulate removal efficiencies with this were in excess of 99.99% in every test that we carried out using the marble bed. We decided to remove the distribu-tor plate and lower the height of the water column so that we could compare the efficiencies of the two different materials. The scrubber bed was lowered from the top to the lower section, and water column height was reduced to 13 inches. Reduced water column heights lead to better efficiencies from an energy standpoint, but cause some decrease in particulate removal.
The first test was conducted using a marble bed, at a column height of six feet, and the second test with a marble column height of 12 inches. These same tests were repeated with the tetra-jack mate-rial. Results from EPA Method 5 tests, which were each one hour (sampling time) in duration, are shown in Table 2.
TABLE 2. EPA Method 5 test results.
Run # Media Bed HeightParticulate
Catch
AshInjected
(lb) Efficiency
030101a Marbles 6 inches 3.5 1.288 99.9785
DIAL 40395-11 44

Task 2. Environmental Control Device Testing
The submerged bed scrubber used here is a very efficient cleaning device for particulates as compared to other gas-cleanup/particulate devices, but the penalty for acquiring this high efficiency is the increased power consumption required to operate the fan. There is not much difference in the efficiencies of the marble and tetra-jack beds.
Work Planned
There are two more tests planned with the submerged bed scrub-ber, which will be completed in the coming month. We don’t expect much difference in the results from those tests. In the first test, we will vibrate the tetra-jack material into place on the bed, as the manu-facturer recommends. The second test will involve using a slightly larger volume marble for comparison with the tetra-jack efficiency.
031501a Marbles 12 inches 7.8 2.1 99.9706
031501b Marbles 12 inches 7.3 1.35 99.9572
031901a Tetra-Jack 6 inches 8.7 1.126 99.9388
031901b Tetra-Jack 6 inches 10.5 1.201 99.9308
032001a Tetra-Jack 12 inches 11.8 1.67 99.9441
032101a Tetra-Jack 12 inches 6.8 1.513 99.9644
TABLE 2. EPA Method 5 test results.
DIAL 40395-11 45

TASK 3 Waste Treatment and D&D Support: Process Monitoring and Control
Dioxin and PCB Studies
Charles Waggoner
Introduction
Selected congeners of the families of dioxins and furans (D/F) are potentially some of the most carcinogenic compounds known to exist. Recognition of the potential risk to the U.S. population spurred the implementation of a national inventory of D/F sources. A significant outcome of this initiative has been the establishment of a strategy to reduce emissions in a targeted fashion. One of the centerpieces of the D/F reduction strategy is the Maximum Achievable Control Technol-ogy (MACT) standard just issued for hazardous waste combustors (HWC). Each of the DOE hazardous or mixed waste incinerators falls subject to this new standard, and stringent emission levels will need to be met in the near future.
The 0.2 ng/dscm emission standard called for under the HWC-MACT stresses the technical limits of operational control and emis-sions testing. USEPA reference-method stack-sampling accuracy and method-quantification limits for the 17 D/F congeners having non-zero toxicity equivalence factors have led to uncertainties, which will
DIAL 40395-11 46

Task 3. Waste Treatment and D&D Support: Process Monitoring and Control
invite skeptical review of the measurements made by facilities to demonstrate compliance with this new standard.
Of the six needs listed on the DOE EM-Needs web page related to dioxin/furan problems, three (ID-3.2.32, ID-S.1.02, and SR00-1021) recognize the lack of knowledge associated with the specific locus of D/F formation, the distribution of D/F congeners between adsorbed and gaseous phases at temperature, and/or the behavior of these classes of compounds in the sampling train. This lack of knowledge is an impediment to minimizing emissions by process control or design/operation of pollution control devices. Additionally, a much fuller understanding of the phase behavior in off-gases is essential to the development of a functional continuous emission monitor or verify-ing the accuracy of extractive sampling methodologies. Finally, a clearer picture of the gas phase chemistry is the best hope of identify-ing a dependable analytical surrogate, if one exists.
Intensive research has been undertaken throughout the past two decades to gain a more complete understanding of the mechanism(s) of dioxin/furan formation in combustion processes. The majority of controlled mechanistic studies of D/F formation tend to be carried out using bench top and micro-scale apparati. A significant body of data has also been accumulated from off-gas samples collected from solid waste incinerators and industrial processes. However, the large num-ber of variables associated with fuel feed and operational history of incinerators makes it difficult to extrapolate from bench to full scale. A series of studies is proposed to take advantage of bench scale results and, in a two-stage manner, extend these investigations to pilot scale.
The primary focus of this effort will be to determine the behavior of D/Fs associated with fly ash particulates in an isothermal off-gas environment for the temperature range of 300 to 800˚F. This will include analysis of samples for D/F homologues to determine the
DIAL 40395-11 47

Task 3. Waste Treatment and D&D Support: Process Monitoring and Control
extent of formation, destruction, and dechlorination under test condi-tions.
All of the results from these investigations will be used, along with literature information, in the initial development and evaluation of a hybrid artificial intelligence system (combination neural net-work-expert system) to project D/F formation, identify areas of needed research, and search for analytical surrogates.
Work Accomplished
In the fall of 2000, D/F research at DIAL shifted significantly, fol-lowing discussions between DIAL researchers, Dr. Bryan Gullett of the EPA laboratory in Research Triangle Park, Dr. Steve Priebe of the MWFA, and Dr. Stephan Weeks of the CMST. The importance of having a sampling system that can bridge a combustion source (incin-erator, industrial boiler, or test stand) with a near real-time analytical instrument like REMPI or CRDS is becoming more fully recognized.
Delivering a representative sample of D/F congeners to the instru-ment in higher-than-level-of-quantification concentrations and free of particulate matter is a difficult task. DIAL personnel have developed the design of a system along with a general set of acceptance criteria for each functional element. Materials selection for each of the func-tional units has been completed and fabrication of system parts has begun.
A database of congener profiles has been assembled to provide guidance on the range of D/F concentrations that may be encountered in incinerator ash samples. Incinerator ash is the most common source of D/Fs for experiments conducted in sub-pilot scale test stands like the ones at DIAL and EPA. This database is needed to pre-dict the sampling times and sample masses needed to obtain usable analytical data from a near real-time instrument like REMPI or CRDS. A mathematical model of the sampling system has been
DIAL 40395-11 48

Task 3. Waste Treatment and D&D Support: Process Monitoring and Control
devised to help evaluate the feasibility of collecting a sufficient sam-ple for analysis by REMPI or CRDS. It has also been used to conduct a parametric analysis of the different size and operational parameters for the sampling system.
DIAL has continued to develop a small-scale test stand that can be used for D/F mechanistic studies. Significant problems have been encountered with the burner section of the test stand, and several design modifications have been tried. Original designs included a water-cooled nozzle that has proved to be prone to leaking water into the test stand and lowering the temperatures that can be achieved in the flight tube. This has also resulted in significant condensation forming in the lower portions of the unit. Auxiliary heater elements have been added to boost the temperature of the test section of the unit and to enhance the ability to maintain isothermal conditions for the full length of the flight tube section. An air-cooled burner design is currently being used, and the system is now capable of providing the desired testing conditions.
A control system software package similar to the one used on the Combustion Test Stand has been developed and installed on a note-book computer. This software will log operational parameters that are necessary to document test conditions and facilitate scaling up any experiments to pilot scale on the combustion test stand.
Drs. David Crosley and Harold Oser of the Stanford Research Institute visited DIAL facilities to discuss ways in which the two organizations could collaborate in D/F research. Since DIAL has shifted its efforts to the development of a sampling system to use with its Cavity Ring Down instrumentation, there is increased opportunity for collaboration. The sampling system will be equally applicable with the Jet REMPI units that are operated by SRI in California and EPA at Triangle Park. DIAL will make plans to visit the SRI facility later this year and evaluate how functional the sampling system is with the REMPI unit. We also discussed how the REMPI unit could
DIAL 40395-11 49

Task 3. Waste Treatment and D&D Support: Process Monitoring and Control
be field tested on the DIAL Small Scale Test Stand or the Combustion Test Stand.
Work Planned
DIAL will continue to develop its small-scale test stand for D/F research and the evaluation of its isokinetic and isothermal sampling system. Particular attention will be paid to characterization of the DIAL test stand relative to the USEPA equivalent unit. Efforts will be continued toward determination of the gas-to-solid partition coeffi-cient for D/Fs as a function of temperature. Attention will also be directed toward designing and developing a sampling system that is capable of serving as an analytical bridge between either the DIAL or USEPA test stands for D/F research and an optically-based instru-ment package such as REMPI or CRDS.
References
18. K.L. Froese, O. Hutzinger. 1997. Environmental Science and Technology 31:542-547.
19. A. Addink, H.A.J. Govers, K. Olie. 1998. Environmental Science and Technology 32:1888-93.
20. P.M. Lemieux and J.V. Ryan. 1998. Waste Management 18:361-370.
21. P.H. Taylor and B.J. Dellinger. 1999. Analytical and Applied Pyrolysis 49:9-29.
22. F. Iino, T. Imagawa, M. Takeuchi, M. Sadakata 1999. Environmental Sci-ence and Technology 33:1038-43.
DIAL 40395-11 50

Task 3. Waste Treatment and D&D Support: Process Monitoring and Control
On-line Multi-Spectral Imaging of Thermal Treatment Processes
D. L. Monts and Yi Su
Introduction
Purpose
Many of the DOE waste streams, particularly those currently stored in steel barrels, are poorly characterized or even uncharacter-ized. Given the variety of contents that can dramatically vary from barrel to barrel, it is necessary for thermal treatment systems (TTS) to quickly change operating parameters and/or implement divert-and-treat measures when specific species of environmental concern (such as mercury) are suddenly introduced into the TTS. It is desirable to monitor species of concern inside the primary TTS chamber in order to provide the maximum possible response time and because concen-trations will be higher here and hence easier to detect.
Digital images contain a wealth of information that, if extracted, could be of immense value for monitoring/controlling a process. Imaging spectroscopy combines conventional imaging, spectroscopy, and radiometry technologies to produce images for which a spectral signature is associated with each spatial resolution element (pixel). The emphasis of this project is on extending previous work to include extraction of information on concentrations, concentration distribu-tions, and other parameters of use for process control of thermal treat-ment systems of interest to DOE. Using visualization and neural network techniques, the information can be presented in such a man-ner as to assist decision-making. Extraction of information from the primary thermal treatment chamber will provide sufficient time for operational parameters to be changed to maintain optimum opera-tional performance and/or to allow divert-and-treat actions to be
DIAL 40395-11 51
Task 3. Waste Treatment and D&D Support: Process Monitoring and Control
taken for species of environmental concern. Previous work at DIAL has shown utility of digital images for visual display of thermal distri-bution contours and for determination of average temperatures.
Methodology
Combining spectral and spatial analyses allows application of imaging technology to species characterization and detection inside primary chambers of thermal treatment sources for mixed hazardous waste processing. We are developing a spectral imaging system by combining a charge-coupled device (CCD) camera with narrowband optical filters. For the proof-of-concept experiments, a series of nar-rowband interference filters is used to obtain images of the com-bustion chamber at wavelengths characteristic of selected metal species. Subsequent efforts will employ an acousto-optic tunable fil-ter (AOTF) in order to significantly increase the number of different wavelengths (and hence species) that can be monitored by the imag-ing system. The digital images are analyzed using commercially available software, which is being modified to meet the needs of this project. We are also developing the methodology to calibrate the spectral imaging system. Analysis of the spectral images will be com-bined with neural network techniques in order to provide facility operators with practical information on a time scale short enough to enable process control decisions to be made.
Work Accomplished
Previously we assembled a prototype spectral imaging system by using narrow band interference filters with CCD cameras and suc-cessfully demonstrated proof-of-concept for the application of spec-tral imaging to quantitative detection of metal species in a practical thermal treatment system. After completion of the “proof-of-concept” experiments, we began working toward our next milestone: purchas-ing essential equipment and assembling the imaging spectrometry system for multi-species detection. The ultraviolet acousto-optic tun-
DIAL 40395-11 52

Task 3. Waste Treatment and D&D Support: Process Monitoring and Control
able filter (UV AOTF) was ordered during March with delivery expected in July. Delivery was delayed because the manufacturer experienced technical difficulty providing the specified system. Dur-ing this quarter, the manufacturer finally determined that it couldn’t provide the UV AOTF with the desired 10-mm aperture; the best that is feasible is a 6-mm aperture. This smaller aperture will result in a smaller field-of-view. Delivery of the UV AOTF system is currently expected during February. Progress on the “hardware” portion of our development effort is dependent upon receipt of the UV AOTF unit.
While waiting on delivery of the UV AOTF system, we have con-centrated our efforts on developing a computerized spectral imaging system using a five-position filter wheel; this enables us to record sequential spectral images in five different spectral regions. The real-time software control package we have developed allows the user to select a spectral region (via the choice of the filter position of the fil-ter wheel), the number of images to be recorded for each spectral region, the time interval between consecutive image acquisitions, and the frame rate (i.e., the number of images recorded per second with a maximum rate of 30 frames per second). (It should be noted that the maximum frame rate of 30 frames per second is the maximum achievable with the current CCD camera and that the frames-per-sec-ond rate determines the time resolution.)
In order to test the capability of the filter-wheel spectral imaging system and also to assist the Isotopically Selective Monitors for Tran-suranic Elements project, we used the filter-wheel spectral imaging system to determine the optimum position for laser irradiation of ground state uranium within an inductively coupled plasma (ICP). Figure 15 presents a background-subtracted spectral image of 424-nm emission from uranium in an ICP plasma. The optimum position for laser irradiation was obtained by superimposing the image of a rule over the image in Figure 15. As shown in Figure 16, the spectral image intensity of uranium varies linearly with increasing uranium concentration.
DIAL 40395-11 53

Task 3. Waste Treatment and D&D Support: Process Monitoring and Control
FIGURE 15. Spectral image of 424-nm U emission from a 20-parts-per-million solution of uranium in an argon ICP plasma. The image was recorded using a 3-nm bandwidth notch filter with a center wavelength of 422.7 nm. Background emission from the argon ICP plasma has been subtracted from this image.
FIGURE 16. Intensity of 424-nm U spectral image emission as a function of uranium concentration (in parts-per-million).
y = 0.0063x + 0.0005
R2 = 0.9997
0.00
0.05
0.10
0.15
0.20
0.25
0.30
0.35
0.40
0 10 20 30 40 50 60
Concentration (ppm)
Inte
nsity
(A
rb. U
nit)
DIAL 40395-11 54

Task 3. Waste Treatment and D&D Support: Process Monitoring and Control
By selecting appropriate spectral regions or ratios of spectral regions, we hope to discern the presence of heavy metal pollutants in plants; thus, remotely sensed spectral images could be used as indica-tors of pollutant spread for DOE’s long-term monitoring effort. In preparation for our effort for the next grant year to investigate the fea-sibility of using spectral images of plants as a monitor of the spread of ground-based pollutants, we have reviewed the scientific literature and chosen plant species to study the phytoremediation process of selected heavy metals. (This project is an outgrowth of our study of the spectral images of cotton.)
Work Planned
During the next grant year, our efforts will concentrate on DOE needs for inspection of off-line Joule-heated melters to determine wear patterns and the location and composition of deposits; this infor-mation can be used in the design of the next generation of HLW melt-ers. Narrow bandpass filters will be combined with cameras to enable spectral imaging within the melter. DIAL’s imaging capability will be extended to the near-infrared spectral region.
To date, techniques have been developed to detect hot spots, ther-mal distribution, characterization of vegetation, detection of uneven surfaces, etc. from imaging data. The new effort during the next grant year also aims at enhancing the techniques already developed here and to develop new techniques and capabilities utilizing statistical as well as intelligent system approaches.
When the UV AOTF arrives, we will assemble the multi-species system and begin optimization of the system. We will begin a series of DIAL test stand experiments to simulate inspection of Joule-heated melters.
DIAL 40395-11 55

Task 3. Waste Treatment and D&D Support: Process Monitoring and Control
Acronyms
AOTF acousto-optic tunable filter
CCD charge-coupled device
DIAL Diagnostic Instrumentation and Analysis Laboratory
DOE U.S. Department of Energy
TTS thermal treatment systems
UV ultraviolet
Imaging Instrumentation Application and Development: Thermal Imaging
Ping-Rey Jang
The main thrusts of this task are 1) Thermal Imaging—to develop and maintain DIAL’s on-line thermal imaging systems and 2) Profilo-metry—to develop imaging instrumentation using the Fourier trans-form profilometry (FTP) technique.
Introduction
DIAL’s thermal imaging system has been successfully applied to monitor the thermal distribution on various types of waste treatment furnaces. The viscosity of the melt, and volatility of species in the melt, is a function of the temperature and composition of the melt. Thus, it is essential to measure the melt temperature during the treat-ment process. It is also critical that the facility operator be able to view the surface of the melt bath from the temperature distribution point of view so that on-line the appropriate process control/adjust-ment procedure can be justified.
DIAL 40395-11 56

Task 3. Waste Treatment and D&D Support: Process Monitoring and Control
Temperature measurement is based on Planck’s radiation law assuming a gray body radiator.23 An ideal radiator, called a black-body, will have a hemispherical spectral emissive power given by Planck's law,
eB(λ,T) = C1λ-5/[exp(C2/λT)-1] (EQ 1)
where eB is the emissive power, λ is the wavelength, T is the absolute temperature of the blackbody, C1 and C2 are constants. By measuring the spectral emittance of a blackbody at any wavelength, one can determine the temperature. In order to receive the radiation from the target, a sensor unit, a focal plane array (FPA), converts the radiation energy into an electronic readable format. The acquired raw images are then analyzed to yield a surface temperature map. Different types of FPA detector material respond to the radiation at different spec-trum regions and at different temperature ranges. The selection of the FPA detector unit may vary due to the to the desired target tempera-ture range, especially on the lower limit. DIAL’s current thermal imaging system has a low limit of 900 EC. An FPA unit that will respond to lower target temperatures is needed to improve the temperature measurement range and to increase the system’s sensitiv-ity.
Work Performed
We have expanded the sensor’s spectral response into the near infrared region. An NIR camera system has been identified and is in the procurement process. Also, a new set of imaging acquisition and process drivers has been installed. The modification of current ther-mal imaging system packages is underway. In support of the RIC project, we used the thermal imaging systems to monitor batch-melt-ing processes. The melt-surface temperature map is provided to the system operator in near real time.
DIAL 40395-11 57

Task 3. Waste Treatment and D&D Support: Process Monitoring and Control
Work Planned
Prototype NIR system development will continue for the obtained NIR camera system. We will also continue modifying the thermal imaging system software due to the installation of new system driv-ers. We plan to continue using the thermal imaging system in the RIC project to provide online melt-surface-temperature data.
Imaging Instrumentation Application and Development: Profilometry
Ping-Rey Jang
Introduction
DIAL’s profilometry system has been developed to measure sur-face profiles before and after a surface has been changed or scabbed.24 By utilizing Fourier transform profilometry (FTP), an image process-ing technique, the volume of material and depth of material removed from the surface can be calculated.
The technique for the decontamination and decommissioning (D&D) of concrete structures within the Department of Energy and the nuclear industry is to remove a specific amount of material from the surface using a technique known as scabbling. The profilometry system developed at DIAL uses a structured light pattern projected onto a surface, and by analyzing the distortions of the pattern, using a digital camera, the shapes of the object can be determined. As a wall removal monitor, the technique uses a projected light pattern that is cast onto the target surface. An image is captured before work is started on the surface, and a second image is captured after the work has been completed. Processing the two images yields the new sur-face profile relative to the original surface. The volume and depth of
DIAL 40395-11 58

Task 3. Waste Treatment and D&D Support: Process Monitoring and Control
the material removed from the surface can be calculated. The devel-opment of this system addresses the needs of the DOE-EM and the nuclear industry in the area of decontamination and decommissioning (D&D) of concrete structures.
Work Performed
We have developed new techniques for image Fourier transform experimentation. We have also begun to develop several routines/modules for calculating the surface parameters. As shown in Figure 17, the computation modules for the ROI specific surface roughness and volume computation have been developed and integrated into the FTP system.
FIGURE 17. Surface roughness and volumetric calculations.
DIAL 40395-11 59

Task 3. Waste Treatment and D&D Support: Process Monitoring and Control
Surface roughness results from the various targets surface are shown in Tables 3 and 4.
All of these modules have been integrated into the Fourier Trans-form Profilometry (FTP) system. Also developed is the algorithm for frequency-multiplex FTP. This imaging analysis technique will solve the phase discontinuity problem (during the phase unwrapping pro-cess) caused by the target area of large height jumps and/or surface isolations. Tests on the simulated/controlled targets will be continued. Integration of a higher resolution camera (for increasing the target sampling frequency) into the current system will continue. A new version of imaging system drivers has been installed. Modification of current system packages is also underway.
TABLE 3. Surface roughness numerical representation of acquired controlled target images - sandbox surfaces.
Target
RMSHeight(cm)
AdjustedRMS(cm)
Corr.Length
Two Heaps 2.01 1.99 8.76
Two Heaps 3.53 3.41 9.38
Multiple Heaps 0.78 0.77 2.32
Chessboard Pattern 0.57 0.52 4.60
TABLE 4. Surface roughness numerical representation of acquired field soil surface images.
Target
RMSHeight(cm)
AdjustedRMS (cm)
Corr.Length
Weathered Soil A 1.89 1.40 12.58
Weathered Soil B 2.38 1.21 14.19
Weathered Soil C 6.55 4.57 16.76
Fresh Tilted Soil 2.71 2.60 6.94
DIAL 40395-11 60

Task 3. Waste Treatment and D&D Support: Process Monitoring and Control
Work Planned
Work continues on the study on the phase unwrapping algorithms25,26 for target areas that have large height discontinuities and/or surface isolations. Efforts for the integration of a higher reso-lution digital camera to increase the target sampling frequency will continue. Modification of current system packages for the new set of system drivers will continue.
References
23. P-R. Jang, R.D. Benton and R.L. Cook. June 1994. Some Observations on the Spectral Response in Pyrometry. AIAA 94-2445.
24. M.E. Henderson and R.D. Costley. June 1998. Wall Removal Monitor. DIAL Technical Memo FTP 698.
25. D.C. Ghiglia and M.D. Pritt. 1998. Two-dimensional Phase Unwrapping. John Wiley & Sons, Inc.
26. Mitsuo Takeda, et al. August 1997. Frequency-multiplex Fourier-trans-form Profilometry: A Single Shot Three-dimensional Shape Measurement of Objects with Large Height Discontinuities and/or Surface Isolations. Applied Optics 36:22.
Saltcake Dissolution
R. K. Toghiani, J. S. Lindner and V. A. Phillips
Introduction
This project is a continuation of the work previously reported on the dissolution of Hanford waste saltcakes. A main portion of the work is to continually validate and upgrade a thermodynamic equilib-rium model, the Environmental Simulation Program (ESP) as applied
DIAL 40395-11 61

Task 3. Waste Treatment and D&D Support: Process Monitoring and Control
to the Hanford wastes. Toward this end a number of significant accomplishments have been reported previously.27-31 These include the evaluation of the code for the dissolution of saltcakes varying in composition through a comparison of model predictions with experi-mental results on core samples performed at the site; the use of the model to aid in the development of remediation strategies for Hanford tank 241-SY-101, an evaluation of data preprocessing; and the exper-imental determination of the solubility of natrophosphate, a double salt observed in the tank wastes.
A main focus is in bolstering the predictions of the code through comparison with experimental data and with other thermodynamic models such as SOLGASMIX. Accurate data called by the model are an essential requirement for quantitative code predictions; however, it must be noted that evaluation of the thermodynamic interactions between all of the species existing in the waste streams is not possi-ble. The path, therefore, has been to concentrate on those anions such as nitrate, nitrite, hydroxide, sulfate, phosphate, fluoride, oxalate, car-bonate, and cations, sodium, aluminum, calcium, nickel, uranium, etc., and the associated solids from these species that comprise the majority of the waste composition. Once assured that the code predic-tions accurately reflect the thermodynamics of these systems, we can further upgrade the model to include other species of considerably lower concentration. The project is divided into three tasks as sum-marized below.
Task 1. Comparison of ESP to Other Thermodynamic Equilibrium Codes
The model has been shown to agree with literature data for the solid liquid equilibrium behavior of many of the saltcake constituents at both high and low ionic strengths. Nonetheless, questions will remain regarding the application of the model to situations in which the ionic strength is high, owing to the extrapolation of fundamental electrolyte theory to regions of high ionic strength. Theoretical calcu-lations for the most prevalent solid in the waste, sodium nitrate, will
DIAL 40395-11 62

Task 3. Waste Treatment and D&D Support: Process Monitoring and Control
be performed at high ionic strength and compared to an alternate model developed by M. Ally at ORNL. Comparisons with the SOL-GASMIX model, in collaboration with C. F. Weber (ORNL), will be performed for the sodium-fluoride-sulfate system. Companion solu-bility experiments will be made on this system to improve the ESP database (Task 3).
Task 2. Comparison of ESP Predictions to Saltcake Dissolution Experiments
Previous work has characterized saltcakes with roughly four typi-cal compositions, as anticipated in the Hanford tank wastes. These studies have indicated that ESP can be used to predict the dissolution behavior of the majority of the solids present. An exhaustive search for other types of saltcake compositions was conducted recently by D. L Herting of Fluor Hanford, resulting in the identification of two additional tanks with different composition distributions. A sample from tank TX-113 will be evaluated this year. In addition, recent interest in pretreatment and retrieval operations has indicated that there may be some concern when supernates from different waste streams are combined. ESP will be used with the predicted supernates from some of the previous saltcake dissolution studies to examine the propensity of solids formation under expected operating conditions. Predictions will be compared with ongoing experimental work at the site.
A conference on the dissolution of saltcake will be organized and this forum will provide for extended discussions on the progress and results of the work and on future programmatic directions. Reports on the saltcake dissolution studies and on the outcomes of the saltcake dissolution conference will be provided.
Task 3. Improvements and User Documentation for the ESP Model
Some deficiencies have been shown to exist within the ESP data-banks.27 Of high interest is the determination of solubility data for
DIAL 40395-11 63

Task 3. Waste Treatment and D&D Support: Process Monitoring and Control
double salts. Solubility studies for Na3FSO4 will be conducted and compared to the results of the prior literature and the calculations per-formed in Task 1. Additional studies on the extent of hydration as a function of ionic strength will be performed for Na2CO3 and Na3PO4.32 Experiments are also planned for NaF at elevated ionic strength and in the presence of NaNO3.
Considerable effort has been expanded in learning the most appropriate ways in which to develop and run ESP simulations. These will be documented and forwarded to customers at Hanford for incor-poration in the ESP User Manual.
Work Accomplished
Results and Discussion
Saltcake dissolution studies. During this quarter, preliminary simula-tions for saltcake dissolution experiments on three tanks were com-pleted: BY-109, U-107, and S-110. These saltcakes were chosen because of their unique compositions, as illustrated in Table 5, as well as other factors. Saltcake from tank U-107 was selected because a sprinkler system is to be installed in the tank during Spring 2001 and a retrieval demonstration is planned. Saltcake BY-109 is from Hen-drickson sort group 10, which has not been examined before. It con-tains higher levels of fluoride (5.32 wt. %) than saltcakes examined in previous years and also contains moderate levels of phosphate (2.56 wt. %) and sulfate (11.76 wt. %). The presence of the sodium-fluo-ride-phosphate and sodium-fluoride-sulfate doubles salts will influ-ence the dissolution behavior of this saltcake. The saltcake from S-110 is classified as Hendrickson sort group 18, which has not yet
DIAL 40395-11 64

Task 3. Waste Treatment and D&D Support: Process Monitoring and Control
been examined and contains significant amounts of aluminum (1.6 wt. %) and carbonate (4.91 wt. %).
Data pre-processing strategies, developed in earlier efforts, were successfully used to perform the charge reconciliation and provide a molecular stream with proper loading of the various cations and anions. The experimental procedure used by D. Herting for the salt-cake dissolution experiments was altered from ‘series dissolution’ to ‘cascade dissolution’ method.33 In the series dissolution procedure, six composite saltcake samples were each contacted with a differing amount of diluent, with ion chromatography analysis yielding equi-librium liquid concentrations for the various anions in the original saltcake. In the cascade dissolution method, a single composite salt-cake sample was contacted with 50% diluent by weight and allowed to equilibrate overnight. The liquid supernate was separated from the
TABLE 5. Compositions of saltcakes examined (weight %).
BY-109 U-107 S-110
H2O 33.2 24.5 16.6
Al 1.97 1.25 1.6
Cr 0.27 0.24 1.29
K 0.232 0.104
Na 24.9 21.8 22.9
F 5.32 0.025 0.103
Cl 0.192 0.25 0.227
NO2 2.8 2.96 2.14
NO3 6.94 35.8 34.5
PO4 2.56 5.33 0.63
SO4 11.76 0.195 1.45
C2O4 1.96 1.47
CO3 2.34 1.31 4.91
OH 1.54 2.26 1.23
DIAL 40395-11 65

Task 3. Waste Treatment and D&D Support: Process Monitoring and Control
undissolved solids by centrifuge and the liquid supernate analyzed by ion chromatography. The undissolved solids were then contacted with additional diluent (50% diluent by weight compared to original com-posite saltcake) and the equilibration/separation procedure repeated. This cascade was repeated until a cumulative diluent addition of at least 300% by weight was achieved. The data obtained from these experiments are somewhat different from that obtained the earlier experimental studies, but can be compared to ESP predictions of the cascade dissolution experiment. Two profiles can be compared: 1)% of an anion dissolved as a function of cumulative diluent addition; and 2) liquid phase anion concentration as a function of cumulative diluent addition.
At this date, experimental data are available for ambient tempera-ture only, with experimental data for the 50˚C studies to be available prior to the end of FY 01. Simulations of ambient and 50˚C experi-ments have been completed, but only the simulations at ambient tem-perature are discussed in this quarterly.
Figure 18 provides a profile of the dissolution behavior for the various salts present in the solid phase as a function of cumulative diluent addition for saltcake BY-109. Due to the high fluoride content of this saltcake, the double salts, Na7F(PO4)2
.19H2O and Na3FSO4, dominate the solid phase, but there is sufficient fluoride, that sodium fluoride is also present in the solid phase through 300% cumulative diluent addition. Figure 19 provides a comparison of the fluoride con-centration in the liquid phase with the experimental data as a function of cumulative diluent addition. From the figure it is evident that ESP predictions at higher diluent levels are lower than those obtained experimentally. This may in part be due to ESP’s prediction of sodium fluoride in the solid phase at these higher cumulative diluent addition levels. At the lower diluent addition levels (50% and 100%), the ESP predictions are in good agreement with the experimentally measured values.
DIAL 40395-11 66

Task 3. Waste Treatment and D&D Support: Process Monitoring and Control
FIGURE 18. Solids speciation for BY-109 saltcake as function of cumulative diluent addition (diluent–inhibited water).
FIGURE 19. Liquid phase concentrations for fluoride anion – saltcake BY-109.
0 5 0 100 1 5 0 200 250 300
N A 2 C 2 O 4
N A FNAFPO4.19H2O
N A 3 F S O 4
0
1
2
3
4
5
6
7
8
9
Gra
ms
in S
olid
Ph
ase
(g
)
Cumu la t i ve D i luen t (% by we igh t )
BY-109 - 21 C
NA2C2O4
NAF
NAFPO4.19H2O
NA3FSO4
BY-109 - 21 C
0
2
4
6
8
10
12
14
16
18
20
0 50 100 150 200 250 300 350
Cumulat ive Di luent Addit ion, (Wt. %)
Flu
ori
de
Co
nce
ntr
atio
n in
Su
pe
rna
te (
g/L
)
F , ESP
F, Exper imental
DIAL 40395-11 67

Task 3. Waste Treatment and D&D Support: Process Monitoring and Control
Figure 20 provides a similar comparison for the sulfate concentra-tion. While the general trend in the experimental sulfate concentra-tion is reproduced by the ESP predictions, there are some differences. Of particular note is the prediction of identical concentrations in the liquid phase at 100 and 150% cumulative diluent addition. While the liquid phase concentrations for sulfate (as well as phosphate) are identical for these two streams, the amount of solids present decreases from 100 to 150% cumulative diluent addition. The identi-cal liquid phase concentrations would indicate that the system is equilibrated at an invariant point (in a ternary system, a single liquid phase would be in equilibrium with two solid phases—with no degrees of freedom according to the Gibbs phase rule, the liquid phase concentration could remain the same as one moves across this region in the phase diagram). The behavior evidenced in the plot is under investigation.
FIGURE 20. Liquid phase concentrations for sulfate anion – saltcake BY-109.
BY-109 - 21 C
0
10
20
30
40
50
60
70
0 5 0 100 150 200 250 300 350Cumulative Diluent Addit ion, (Wt. %)
Su
lfate
Co
nce
ntr
atio
n in
Su
pe
rna
te (
g/L
) SO4, ESP
SO4, Experimental
DIAL 40395-11 68

Task 3. Waste Treatment and D&D Support: Process Monitoring and Control
FIGURE 21. Comparison of experimental and predicted dissolution profiles – saltcake BY-109.
Figure 21 provides information about the dissolution process in an alternate fashion. In this figure, the percentage of each anion dis-solved as a function of cumulative diluent addition is provided. ESP predictions as well as experimental data are plotted. From this figure, it is evident that ESP predictions of the percent fluoride dissolved are in good agreement with the experimental data over the full diluent addition range examined. The ESP predictions of percent sulfate dis-solved all fall above the experimental data, indicating that ESP is pre-dicting more sulfate in solution than is measured experimentally. The primary solid phase containing sulfate is the sodium-fluoride-sulfate double salt. This result is not surprising in light of the basis of the thermodynamic data for this species in the PUBLIC database. Based on available literature data, the thermodynamic information in the PUBLIC database is based on solubility of this species in aqueous solution, not in higher ionic strength solutions. Thus, the discrepan-cies are not unexpected. Previous simulations of saltcake dissolution
0.00
1.00
2.00
3.00
4.00
5.00
6.00
7.00
8.00
9.00
10.00
190.00 195.00 200.00 205.00 210.00 215.00 220.00 225.00
Time after Heat Exchanger Activation (sec)
Par
ticle
Are
a (m
m2)
Pre
ssur
e 1
(psi
g)
DIAL 40395-11 69

Task 3. Waste Treatment and D&D Support: Process Monitoring and Control
experiments have also indicated that the PUBLIC database is lacking with regards to prediction of the sodium-fluoride-sulfate double salt in higher ionic strength solutions. Experimental solubility studies on this double salt were initiated during FY 00 and the data obtained is discussed in the following section.
Experimental studies of select double salt systems. Experimental mea-surements of the solid-liquid-equilibria (SLE) for the sodium-fluo-ride-sulfate-hydroxide system were completed during this reporting period. The solubility of Na3FSO4 was examined as a function of tem-perature (25˚C and 50˚C) and hydroxide concentration (aqueous solu-tion, 1-m hydroxide solution, and 3-m hydroxide solution). The depression of the double salt solubility as a function of increased hydroxide concentration is evident from examination of Figure 22.
FIGURE 22. Solubility envelopes for sodium-fluoride-sulfate-hydroxide system at 25°C.
On this comparison, ESP predictions are provided at the experimental conditions, as are the available literature data. The aqueous solubility measurements are in agreement with the existing literature data. These literature data are the basis for the thermodynamic information
0
0.5
1
1.5
2
2.5
0 0.2 0.4 0.6 0.8 1 1.2
Fluoride (m)
Su
lfate
(m
)
P u b l i c a n d N a 2 S n a c l 2 5 C 1 m O H
S o l g a s m i x 1 m O H 2 5 C
P u b l i c a n d N a 2 S n a c l W a t e r 2 5 C
S o l g a s m i x W a t e r 2 5 C
Foote and Sha i re r (1930)
P u b l i c a n d N a 2 S n a c l 3 m O H 2 5 C
S o l g a s m i x 3 m O H 2 5 C
E x p e r i m e n t a l W a t e r 2 5 C
E x p e r i m e n t a l 1 m O H 2 5 C
E x p e r i m e n t a l 3 m O H 2 5 C
DIAL 40395-11 70

Task 3. Waste Treatment and D&D Support: Process Monitoring and Control
contained in the ESP PUBLIC database for the Na3FSO4 solid spe-cies. However, the ESP predictions used the special database, Na2snacl, supplied by OLI Systems, Inc., which allows for proper prediction of anhydrous sodium sulfate as the stable solid species under the higher ionic strength conditions present at 1 m and 3 m hydroxide concentrations.
Verification of the experimental methods is evident from the com-parison of the solubility measurements in aqueous solution (labeled water) with the literature data. ESP predictions in 1-m hydroxide solution are markedly less than the experimental data measured in this work. Figure 23 provides a comparison of the experimental data at 50˚C with the available model predictions from SOLGASMIX and from ESP. Regression of these data to fit the solubility of Na3FSO4 as a function of temperature and hydroxide concentration will be accomplished during FY 01. The model fit by this regression will then be incorporated into ESP and model predictions revised. Regres-sion of the experimental data obtained during FY 00 for the sodium-fluoride-phosphate-hydroxide system will also be completed.
FIGURE 23. Solubility envelopes for sodium-fluoride-sulfate-hydroxide system at 50°C.
0
0.5
1
1.5
2
2.5
3
3.5
4
0 0.2 0.4 0.6 0.8 1 1.2
Fluoride (m)
Su
lfate
(m
)
P u b l i c a n d N a 2 S n a c l 5 0 C 1 m O H
S o l g a s m i x 1 m O H 5 0 C
P u b l i c a n d N a 2 S n a c l W a t e r 5 0 C
S o l g a s m i x W a t e r 5 0 C
P u b l i c a n d N a 2 S n a c l 3 m O H 5 0 C
S o l g a s m i x 3 m O H 5 0 C
E x p e r i m e n t a l W a t e r 5 0 C
E x p e r i m e n t a l 1 m O H 5 0 C
E x p e r i m e n t a l 3 m O H 5 0 C
DIAL 40395-11 71
Task 3. Waste Treatment and D&D Support: Process Monitoring and Control
Experimental studies were initiated on the sodium-carbonate-sul-fate-hydroxide system and on the sodium-fluoride-nitrate-hydroxide system. The sodium-carbonate-sulfate-hydroxide system is of interest for a number of reasons. The double salt, burkeite [Na6(SO4)2CO3], is predicted by ESP during saltcake dissolution simulations conducted at 50˚C, but not at 25˚C. At 25˚C, the stable solid phases for sulfate and for carbonate in aqueous solution are the decahydrates: Na2SO4
.10H2O and Na2CO3.10H2O. However, in high ionic strength
solutions, the temperatures for the sodium sulfate decahydrate/anhy-drous sodium sulfate transition and for the sodium carbonate decahy-drate/sodium carbonate monohydrate transition are depressed. In higher ionic strength solutions, the stable solid phases for sulfate and for carbonate at 25˚C are the anhydrous sodium sulfate salt and sodium carbonate monohydrate. Thus, it is possible that the double salt formed by these anions may also be formed at this lower temper-ature when the ionic strength of the solution is high. Solubility mea-surements as a function of temperature (25˚C and 50˚C) and as a function of hydroxide concentration (aqueous solution, 1m and 3m hydroxide solution) will allow the determination of whether this dou-ble salt can be formed at the lower temperature under higher ionic strength conditions. Literature data for this system in aqueous solu-tion are available and have been compared with ESP predictions of the solubility envelope in this system at 25˚C and 50˚C. Additionally, ESP predictions for the solubility of sodium carbonate as a function of temperature and as a function of hydroxide concentration have been compared with available literature data. Similar comparisons for the sodium sulfate system have been completed.
Experimental studies of the solubility of sodium fluoride in nitrate solutions were also initiated. The influence of nitrate concentration on the solubility of sodium fluoride must be understood to improve the ESP predictions in the low dilution region of the saltcake dissolution experiments. The high levels of nitrate in saltcakes result in nitrate-rich supernate in equilibrium with a solid phase containing the sodium-fluoride-phosphate and sodium-fluoride-sulfate double salts.
DIAL 40395-11 72

Task 3. Waste Treatment and D&D Support: Process Monitoring and Control
These experiments will provide additional information regarding the sodium fluoride solubility.
Conclusion
ESP simulation of saltcake dissolution experiments for three salt-cakes conducted by Herting has been completed. These saltcakes, chosen because of their unique compositions, provide a means to assess the predictive capabilities of ESP with respect to higher levels of certain species, in particular, fluoride, than have previously been examined. The high levels of fluoride in saltcake BY-109 provide a means to better identify the strengths and weaknesses of ESP with respect to speciation of fluoride in the solid phase. A full comparison of experimental results and model predictions will be published at the end of FY 01. Discrepancies between model predictions and experi-mental data are primarily due to the thermodynamic data available in ESP for the sodium double salts involving fluoride. Experimental measurements of the solubility for the sodium-fluoride-sulfate double salt and the sodium-fluoride-phosphate double salt recently com-pleted provide additional thermodynamic data that will be regressed and incorporated into the ESP database.
Project Status
Preparations were made for the Saltcake Dissolution Workshop and Program Review to be held in May at the site. Work continues on the FY 2001 objectives.
Work Planned
Regression of the available laboratory data for the fluoride double salt system is in progress. This analysis will result in a database that is expected to alleviate current deficiencies within the ESP model with regard to double salt partitioning and solubility.
DIAL 40395-11 73

Task 3. Waste Treatment and D&D Support: Process Monitoring and Control
References
27. R.K. Toghiani, J.S. Lindner, C. Barfield, and E.C. Beahm. 1998. Saltcake Dissolution Modeling, FY 1998 Status Report. DIAL-40395-TR98-1. Diagnostic Instrumentation and Analysis Laboratory, Mississippi State University, Mississippi State, MS.
28. R.K. Toghiani and J.S. Lindner. 1999. Saltcake Dissolution Modeling, FY 1999 Status Report. DIAL-40395-TR99-1. Diagnostic Instrumentation and Analysis Laboratory, Mississippi State University, Mississippi State, MS.
29. J.S. Lindner, R.K. Toghiani and C. Barfield. August 1998. Thermody-namic Simulation of Tank 241-SY-101 Dissolution, Part 1: In-Situ Crust Dissolution. DIAL 40395-TR98-1. Diagnostic Instrumentation and Analy-sis Laboratory, Mississippi State University, Mississippi State, MS.
30. J.S. Lindner and R.K Toghiani. October 1998. Thermodynamic Simula-tion of Tank 241-SY-101 Dissolution, Part 2: Supernate Transfer followed by In-Tank Dilution. DIAL 40395-TR98-1.2. Diagnostic Instrumentation and Analysis Laboratory, Mississippi State University, Mississippi State, MS.
31. J.S. Lindner and R.K Toghiani. April 1999. Thermodynamic Simulation of Tank 241-SY-101 Dissolution, Part 3:Crust Solids Dissolution Modeling and Associated Gas Release. DIAL 40395-TR98-1.3. Diagnostic Instru-mentation and Analysis Laboratory, Mississippi State University, Missis-sippi State, MS.
32. D.L. Herting. October 1999. Personal communication.
33. D.L. Herting. September 2000. Saltcake Dissolution 2000 Status Report. HNF-7031, Rev. 0. Fluor-Hanford, Richland, WA.
DIAL 40395-11 74

Task 3. Waste Treatment and D&D Support: Process Monitoring and Control
Feed Stability and Chemistry - Solids Formation
J. S. Lindner, V. Raju, R. K. Toghiani and H. Al Habbash
Introduction
Tank farm operations at Hanford include the interim stabilization program where the supernate and interstitial liquor in the single-shell tanks is reduced. Benefits from this process include the minimization of leakage from aging tanks, thereby limiting migration of waste into the soil, and the temporary reduction of waste within the tank. The process consists of jet-pumping the liquid in a given tank, obtained through a screen or salt well to a double-shell holding tank and then to an evaporator. Dilution water is added at the pump head. Recently, solids formation and plugging have been noted during transfers from tanks 241-SX-104, 241-U-103, and 241-BY-102.34 The primary solid responsible for the plugs from the first two tank wastes has been ten-tatively assigned, through experiments conducted on the waste liquid
in the laboratory, as Na3PO4.12H2O. The plug formed during salt well
pumping of BY-102 was believed to arise from sodium carbonate.
Other solids may participate in the plug formation process, which will largely depend on the solid-liquid equilibrium of the species con-tained in the waste stream. Aside from the laboratory screening experiments, little information is known regarding the mechanisms of plug formation and, more importantly, the required change in pres-sure that would indicate the beginning of plug formation. From oper-ations-measured records, we can determine the time needed for a plug, and by knowing the pressures and flow rates, the approximate location of the plug can be estimated. However, prevention of inad-vertent plugs may be possible based on a suitable engineering tool that will allow operators to tailor waste transfers.
DIAL 40395-11 75

Task 3. Waste Treatment and D&D Support: Process Monitoring and Control
Developing an engineering tool that can describe slurry transfers and salt well pumping is also an objective of this program. In the case of slurry transport, experimental data is being obtained at Florida International University, and information on solids behavior, size, and growth rates is being measured at AEA Technologies. A test loop for obtaining data on supernate transfers does not currently exist. The lack of a test loop for salt well pumping, the need to understand the process in greater detail, and the need for the fundamental data required in developing the engineering tool provided the basis for the work described below.
Work Accomplished
Results and Discussion
Salt Well Pumping Flow Loop Experiments
Particle behavior during plug formation. Investigation of the forma-tion of sodium phosphate dodecahydrate plugs continued. The fluid used in these experiments was derived from the Best Basis Inventory compilation for the supernate from Hanford tank 241-SX-104.35 Pre-vious laboratory screening experiments using a surrogate derived from the waste in Hanford tank 241-SX-104 (1 M aluminate, 7 M nitrate, 2 M hydroxide, 0.3 M phosphate and 0.1 M carbonate with sodium was the cation in all cases) have shown that
Na3PO4.12H2O
.0.25NaOH (NaPHOH) forms large rod-like crystals at temperatures around 40˚C.35 Above this temperature the predominant crystal form is the octahydrate and these particles are small (micron and sub-micron) and do not participate in plug formation. Solids for-mation does not occur above 50˚C. ESP model predictions are in agreement with the experimental findings.35
As a consequence of the formation of the NaPHOH crystals, operations during salt well pumping should be tailored either to main-tain channel temperatures at greater than 50˚C or to dilute the waste
DIAL 40395-11 76

Task 3. Waste Treatment and D&D Support: Process Monitoring and Control
sufficiently to reduce saturation. In-line dilution of the waste is a rela-tively new procedure (see, for example, Ref. 34) and, thus, previous plugs that have occurred during stabilization have resulted from tem-perature excursions. Even with dilution of the waste, solids formation is still possible but at reduced temperatures.35 Furthermore, the addi-tion of water creates additional waste.
The salt well pumping flow loop has been described previously.35 In brief, the system consists of two 20-L stainless steel holding tanks (one for the surrogate and the second for dilution fluid), a pump that conveys the surrogate through a 0.25-inch stainless steel channel, and a receiver tank with a second pump to permit recycles. Temperature control of the waste is accomplished using tube-in-shell heat exchangers. Valves are located in strategic positions and allow for the sampling of the stream during pumping. The channel is approxi-mately ten feet long and instrumented with thermocouples and pres-sure transducers. Experimental results are collected with a data acquisition system and transferred to spreadsheet files.
Recent experiments have been centered on further understanding of the formation of the plug. A six-foot portion of the channel was replaced with a clear plastic channel. Video analysis of the plug for-mation event has allowed for the determination of a critical particle size, the growth of single particles and agglomerates, the growth of the deposited solids bed as a function of time, and velocities associ-ated with these events.
The information is of value with regard to the sedimentation behavior and eventual formation of the plug. The ability of a particle to remain suspended in the flow field will be a function of the particle size and density, the solution viscosity, the carrier fluid density, and the velocity of the stream.36 In the case of a two-phase flow with aggregating particles, the particle density will be a function of the agglomerate structure and will necessarily be lower than the chemical density of the solid. The density of NaPHOH has been reported as
DIAL 40395-11 77

Task 3. Waste Treatment and D&D Support: Process Monitoring and Control
1.62 g/cm3.35 This value can be contrasted to the densities of typical sludge components such as chromium hydroxide or zirconium oxide
(3.53 and 5.89 g/cm3 respectively). At the same velocity, viscosity, and particle size, a particle with a higher density will settle faster than a particle of lower density. In a similar manner and under the same conditions, particles with a lower density can grow to larger sizes and still remain entrained. The video imaging analysis was developed to determine the processes inherent in NaPHOH plug formation.
The series of experiments was initially performed using an avail-able color video camera. The system was mounted on a tripod normal to the channel. Images were collected at 60hz. The camera was equipped with an automatic zoom feature and automatic exposure. Analysis of the bed growth as a function of time was possible; how-ever, the magnification of the optical system prevented the establish-ment of the critical particle size. In addition, the contrast of the particles and associated aggregates against the background color schemes attempted were difficult to discern. While it proved to be possible to section the video stream frame by frame, this is a time-consuming process. For these reasons we decided to use one of the existing DIAL imaging systems. However, it should be noted that the color video analysis has proven quite beneficial with regard to unplugging experiments and the permeation of pressurized water through formed plugs (to be reported).
The DIAL imaging system consisted of a small black-and-white camera (640 x 480 pixels) equipped with a 75-mm lens that was dou-bled to an effective focal length of 150 mm. Images were collected at 12.5 frames/second. The lens combination corresponded to a spatial resolution of 13.1 pixels/mm or 13.1 pixels/1000 microns. Images were initially collected in a bitmap format and then converted to 8-bit gray scale. Image processing was accomplished in the software used for the polarizing light microscope. The frames were cropped to the channel dimensions and then contrast enhanced. Measurements were
DIAL 40395-11 78

Task 3. Waste Treatment and D&D Support: Process Monitoring and Control
confined to an approximate 2-inch length of the channel 19 inches downstream of the heat exchanger.
Temperatures and pressures recorded for an experiment with a Reynolds number of 235 are collected in Figure 24. The data have been confined to the time at which the heat exchanger was activated and when a complete plug was formed. The tank temperature as well as the temperatures upstream of the heat exchanger remained con-stant. The temperature downstream of the heat exchanger decreased gradually as tap water flowed through the unit, eventually approach-ing 39 - 40˚C. Pressures were monitored at the entrance to the chan-nel and downstream of the plastic tube. The upstream pressure remained constant to 150 seconds and thereafter increased until a constant value, indicative of plug formation, was attained. The low values observed for the pressure measurement at the end of the chan-nel (Pressure 2) indicate that the plug was formed in the channel and not in the plumbing downstream of the inserted pipe.
FIGURE 24. Temperatures and pressures measured along the channel during the low Reynolds number flow experiment.
-5
5
15
25
35
45
55
0 50 100 150 200
Time after activation of heat exchanger (sec)
Pre
ssur
e (p
sig)
or
Tem
pera
ture
(C
)
Pressure 1Pressure 2T 1T 2T 4T Tank 1
DIAL 40395-11 79

Task 3. Waste Treatment and D&D Support: Process Monitoring and Control
Images were collected from approximately 150 seconds after the heat exchanger was turned on until plug formation was complete. Ini-tial precursor events to plug formation may well commence prior to the 150-second “induction” time. Results of the image analysis indi-cate that the first observable particles were found after 150 seconds. These particles correspond to a finite size, and other, smaller particles are expected to be present prior to this time. The resolution of the sys-tems allowed the determination of particles greater than about 80 microns in both directions (13.1 pixels = 1000 microns, 1 pixel = 76 microns). Representative frames for the growth and transport of a small particle observed at a time of 208.72 seconds after the cooling water was applied are given in Figure 25.
FIGURE 25. Representative frames of a single NaPHOH particle observed during the start of plug formation and the scale associated with the distance from the end of the heat exchanger.
Frame#3109
Frame#3110
Frame#3111
Frame#3112
Scale AOI
DIAL 40395-11 80

Task 3. Waste Treatment and D&D Support: Process Monitoring and Control
In the first frame the particle lies above the 19 7/8-inch mark on the scale and exhibits a rod-like shape. The second frame, taken directly after the first, shows the movement of the particle and also indicates growth.
The frames in Figure 25 represent the transport of a single particle at the initial velocity of the experiment. Other processes involving particle growth as well as particle aggregation, both with eventual deposition, were observed. Figure 26 shows the growth of a particle agglomerate and subsequent deposition. In the top frame a small group of particles can be observed in the middle left-hand portion of the image. Growth and condensation of these particles is seen in sub-sequent frames.
FIGURE 26. Example of particle agglomeration and deposition observed during the low Reynolds number flow experiments.
DIAL 40395-11 81

Task 3. Waste Treatment and D&D Support: Process Monitoring and Control
St(se
196
202
208
209
212
214
217
218
1 T
As seen in Figure 26, the depositing particles that make up the bed are moving with the flow. Plug formation starts with the growth of the NaPHOH crystals, and when the crystals attain a critical size, they begin to deposit.
Single particles that remained entrained though the portion of the channel examined, as well as particles that were undergoing sedimen-tation and agglomerates that eventually settled into the moving bed, were identified and analyzed using the image analysis software. Posi-tions of the particles and average length and widths were determined. The length/width represents an average axial ratio. Data for individ-ual particles that did not sediment are collected in Table 6. The start and end times indicate the first observation of the particle and that time at which the particle exited the probe volume. The lengths, widths, and particle areas correspond to the last observation of the particle in the image sequence. Calculated axial ratios were averaged over all frames as well as the velocity in the direction of the flow. The average axial ratios ranged from 3.5 to 6.7, indicative of a non-spher-ical shape; the area of the particles has been calculated assuming an elliptical geometry.
TABLE 6. Results for the image analysis for single particles.
art c)
End (sec)
Length (mm)
Width (mm)
Avg. L/W Std. L/W Area1
(mm2)
Vx
(cm/sec)
Std. Vx (cm/sec)
.24 196.56 2.21 0.47 4.86 0.69 0.82 7.96 0.18
.08 203.32 2.77 0.51 5.44 1.64 1.10 7.92 0.26
.72 208.96 2.10 0.58 4.94 1.13 0.95 7.42 0.33
.60 209.92 1.92 0.31 4.59 1.83 0.47 6.77 0.38
.56 212.80 2.22 0.56 3.63 1.04 0.98 6.96 0.22
.96 215.28 2.15 0.62 3.45 0.24 1.05 6.48 0.38
.92 218.40 3.46 0.56 5.81 1.10 1.53 6.27 0.31
.96 219.28 3.30 0.45 6.71 0.59 1.16 6.21 0.24
he area calculated is based on that of an ellipse.
DIAL 40395-11 82

Task 3. Waste Treatment and D&D Support: Process Monitoring and Control
The data indicate that the ultimate size of a non-sedimenting par-ticle does not change significantly as the bed formation process pro-ceeds. The calculated velocities are in accord with the increase in pressure observed from the upstream pressure transducer and the accumulation and transport of solids along the bottom of the channel. Final particle sizes are included in the table, owing to the fact that the particles, once observed, continue to grow. Similar data are collected in Table 7 for the agglomerates.
TABLE 7. Characteristic parameters determined from images of agglomerated particles.
Start
(sec)
End
(sec)
Length
(mm)
Width
(mm)
Avg. L/W Std. L/W Vx
(cm/sec)
Std. Vx
(cm/sec)
204.08 204.40 3.48 1.38 4.67 2.03 7.85 0.23
206.00 206.48 4.54 1.69 2.60 0.28 7.51 0.57
206.40 206.64 3.18 1.10 4.19 1.52 6.14 0.48
206.72 207.04 4.37 1.25 3.55 0.66 7.42 0.38
207.44 207.60 2.87 1.30 3.50 1.15 6.32 1.13
207.84 208.40 3.36 1.63 2.69 0.44 7.23 0.35
208.48 208.72 3.61 1.25 3.40 0.45 6.14 0.37
213.44 213.68 5.15 1.39 3.00 1.27 5.47 0.73
213.84 214.32 3.54 1.48 2.78 0.73 5.52 0.15
215.28 215.60 4.01 2.15 2.20 0.66 5.42 0.09
215.92 216.56 4.37 1.84 2.47 0.87 5.13 0.29
216.72 217.04 2.92 1.90 2.12 0.88 5.08 0.13
217.04 217.52 3.88 1.16 3.59 0.66 4.75 0.58
217.52 217.84 4.02 1.33 4.00 1.74 5.09 0.37
217.92 218.16 3.86 2.14 1.63 0.21 4.75 0.50
217.92 218.32 5.95 1.54 4.27 0.90 4.61 0.15
220.08 220.48 4.02 1.91 3.92 2.14 4.62 0.64
220.16 220.32 4.37 2.06 2.29 0.22 4.61 0.22
221.84 222.08 4.61 2.48 2.30 0.45 4.01 0.56
222.08 222.40 5.18 2.14 2.32 0.44 3.80 0.15
DIAL 40395-11 83

Task 3. Waste Treatment and D&D Support: Process Monitoring and Control
Comparison of the data in Table 7 with that for the single particles (Table 6) indicates that the axial ratios of the agglomerates are smaller than those of the individual particles. This tends to suggest that, upon assembly of individual particles into an agglomerate, the width grows faster than the primary, or axial, dimension.
FIGURE 27. Particles and agglomerates observed in the digital images and the upstream pressure obtained during the experiment. Data points as triangles correspond to single particles and the data points as open circles denote agglomerates.
Examples of particle growth are collected in Figure 27. Data are included for the particle discussed in Table 6 as well as for the agglomerates. Each of the particles and agglomerate clusters was fol-lowed until either deposition occurred or until the particle exited the probe volume. The measured lengths and widths were used to calcu-late the elliptical areas that are plotted against time in the figure. The plot indicates the presence of single particles and depositing particles until ca. 213 seconds, at which time agglomerate formation begins to dominate the sedimentation and bed-forming process. Some single
0.00
1.00
2.00
3.00
4.00
5.00
6.00
7.00
8.00
9.00
10.00
190.00 195.00 200.00 205.00 210.00 215.00 220.00 225.00
Time after Heat Exchanger Activation (sec)
Par
ticle
Are
a (m
m2)
Pre
ssur
e 1
(psi
g)
DIAL 40395-11 84

Task 3. Waste Treatment and D&D Support: Process Monitoring and Control
particles are still observed after 213 seconds; however, the images primarily showed agglomerate formation, deposition, and further development of the moving bed.
The solid line in Figure 27 corresponds to the measured upstream pressure. Prior to 150 seconds the pressure is non-increasing and thereafter begins to increase. This event is thought to correlate to the formation of single particles and small clusters. The pressure then increases further, and this region corresponds to the predominance of single particles and small aggregates that are forming the bed. Finally, particles are forming large agglomerates, which further con-tribute to the development of the bed. During the pressure increase, the stream velocity is decreased; this can be found in the measured velocities given in Tables 6 and 7. Processes occurring 150 seconds after the heat exchanger was activated do not depend on local temper-ature. The temperature within the channel was observed to stay rela-tively constant, and even to increase slightly during the experiment (Fig. 24). Additional crystallization due to a further decrease in tem-perature was not found.
Large increases in the effective size of the sodium phosphate dodecahydrate particles are observed in short time increments of less than a second. Growth rates of the two particle types (single and agglomerate) were determined by regressing the calculated elliptical areas against time. The majority of the particle growth curves in Fig-ure 27 are linear. For the single particles that were identified in the images, the rate of area growth was determined as 2.0 ± 0.49 mm2/sec. The area growth rate of the single particles did not vary with the duration of the experiment. Agglomerates were found to grow at an average rate of 13.6 ± 8 mm2/sec. Here, however, there was an overall increase in the growth rate with increasing run time (see Fig. 27).
The fact that the growth rate for the single particles was constant over the experimental run implies that the number of particles partici-pating in the formation of the agglomerate controls the overall growth
DIAL 40395-11 85

Task 3. Waste Treatment and D&D Support: Process Monitoring and Control
rate. Thus, by dividing the growth rate of the agglomerate by the average value of the single particles, we can determine the number of particles participating in the formation of the agglomerate. This data is presented in Figure 28, along with the visual estimate of the num-ber of individual particles in the clusters. Of interest in the data is the overall increase in the number of particles that eventually comprise the agglomerate. This number increases as the run progresses. One possible reason for the increased particle participation is the gradual decrease of the velocity as the run continues. The lower velocities result in an increase in time the particles are observed, allowing for a more detailed understanding of the aggregation process.
FIGURE 28. Calculated and visually estimated number of particles which comprise the agglomerates.
In all images of the single particles (for example, Fig. 25), the elliptical particles have been aligned with the primary axis parallel to the direction of flow. The lower axial ratios of the agglomerate parti-cles, as compared to the single particles, imply that the agglomerate grows in a direction normal to the flow at a higher rate than axially.
0
5
10
15
20
25
204 206 208 210 212 214 216 218 220 222 224
Time after heat exchanger activation (sec.)
Num
ber
of In
divi
dual
par
ticle
s in
Agg
rega
te
Calculated Number of Particles
Visual Observation
Linear (Calculated Number ofParticles)
DIAL 40395-11 86

Task 3. Waste Treatment and D&D Support: Process Monitoring and Control
Length and width growth rates (similar to those based on the elliptical areas) were calculated for the single particles and the assemblies. For the single particles the length growth rate was determined as 3 ± 1.7 mm/sec, while the growth in width was found as 0.8 ± 0.7 mm/sec. For the aggregates these rates were 6.4 ± 4.5 mm/sec and 3.1 ± 1.5 mm/sec, respectively. The agglomerates appear, therefore, to grow in width faster than the single particles, and this can be observed in Fig-ure 29. The higher axial growth rate for the aggregates, compared to the single particles, implies that the coalescence of the elliptical or rod-like particles occurs when the particles are horizontally displaced from one another. This behavior is observed in Figure 29 as well as in the previous example of a particulate cluster, shown in Figure 26. The behavior is typical of all of the image sequences in which agglomer-ates were observed. Individual elliptical particles of high axial ratio are bridged and then continue to grow. The process is thought to involve the growth of the individual particles to a size sufficiently large to result in deposition. Larger particles will deposit on smaller ones, and the associated bridging between the particles will also lead to increased sedimentation.
FIGURE 29. Images illustrating the formation and subsequent growth of a particle agglomerate. Similar behavior is observed in Figure 26.
DIAL 40395-11 87

Task 3. Waste Treatment and D&D Support: Process Monitoring and Control
The rapid particle growth and subsequent deposition of the parti-cles result, in short order, with the development of a moving bed that eventually becomes a plug. Figure 30 shows the area fraction of the bed as a function of time and the corresponding pressure trace from Figure 24. Bed development becomes complete at a fraction of one, observed around 225 seconds. The pressure attains a maximum value at about 240 seconds, which corresponds to the cessation of flow. Between these two times, the bed is slowing down and additional par-ticle growth is occurring.
FIGURE 30. Resulting bed area and pressure obtained at a Reynolds number of 225.
Determination of the critical velocity. Many expressions are available for the determination of the critical velocity of two-phase (particle and fluid) flows.37 The SX-104 surrogate does not initially contain particles at the 50˚C starting temperature of the experiment; however, particles are formed upon cooling the stream. Expressions for the critical deposition velocity and the associated critical particle size can shed light on the physics of the deposition process. These values are expected to change at different Reynolds numbers and with the pres-
0
1
2
3
4
5
6
7
8
9
190 195 200 205 210 215 220 225
Time (seconds after activation of heat exchanger)
Ups
trea
m p
ress
ure
(psi
g) ,
Bed
Are
a F
ract
ion
Pressure at P1
Bed Area Fraction
DIAL 40395-11 88

Task 3. Waste Treatment and D&D Support: Process Monitoring and Control
ence of additional constituents that may exist in the actual waste streams. Thus, values of the critical velocities or characteristic critical dimensions reported under the experimental conditions investigated here should be considered as upper bounds for the NaPHOH system. The presence of additional particles would, a priori, be expected to hinder the particle growth process and the formation of the aggre-gates, although the extent of reduction in the growth rates would be a function of the solids volume fraction of the additional constituents. During nominal salt well pumping operations, a supernate stream is transferred from the single shell tank. Nominally, this stream does not contain a significant number of entrained particles.
Determination of the critical velocity will depend upon the stream velocity, V, the gravitational constant, g, a characteristic particle dimension, W*, (taken here as the width of the particle), the channel diameter, d, and the densities (ρ values for the particles and carrier fluid):37
Vcrit = (V2/2gW*){2gd((r - ri)/ri)}0.5 (EQ 2)
The data in Table 6 provide dimensions and velocities for single particles. A value for the critical dimension, W*, can be determined from the velocities and then compared to the measured dimensions (width). The calculation would then provide an estimate of the small-est critical dimension that would undergo sedimentation at the given velocity. Other particles with the same or larger dimensions would be expected to deposit in the channel. In a like manner, particles that are about the same dimension or smaller would remain entrained in the flow.
Table 8 lists the stream velocities (cm/sec) determined from the single non-sedimenting particles and the critical dimension deter-mined using the equation above.
DIAL 40395-11 89

Task 3. Waste Treatment and D&D Support: Process Monitoring and Control
For this analysis the particle density was taken as that value cited in the literature (1.62 g/cm3) while the carrier fluid density of 1.39 was from the ESP calculations.35
In most cases the critical dimension calculated is the same or larger than that calculated from the image analysis program. Excep-tions exist for the particle observed in sets 6 and 7. Both of these par-ticles were observed in the regime of Figure 27, where single particles are sedimenting and agglomeration is occurring. One possi-ble reason for the differences in the calculated and measured critical dimensions pertains to the developed moving bed observed at this time. At the same overall stream velocity, the moving bed may, in fact, have a slower velocity than that of the stream, indicating that individual particles will proceed to larger particle sizes prior to incor-poration in the deposition zone.
The critical widths in the table imply that particles with larger widths will undergo sedimentation, as is the case with all of the parti-cles identified in Figure 27, with the exception of the single particles. All of the particles will eventually deposit downstream of the probe section once the critical size has been attained.
TABLE 8. Characteristic dimension calculated from velocities of Table 6.
Set
Number
Start Time
(sec)
End Time
(sec)
Area1
(mm2)
W = L
(mm)
Vx
(cm/sec)
W*
(mm)
1 196.24 196.56 0.82 0.47 7.96 0.58
2 202.08 203.32 1.10 0.51 7.92 0.58
3 208.72 208.96 0.95 0.58 7.42 0.54
4 209.60 209.92 0.47 0.31 6.77 0.50
5 212.56 212.80 0.98 0.56 6.96 0.51
6 214.96 215.28 1.05 0.62 6.48 0.47
7 217.92 218.40 1.53 0.56 6.27 0.46
8 218.96 219.28 1.16 0.45 6.21 0.45
DIAL 40395-11 90

Task 3. Waste Treatment and D&D Support: Process Monitoring and Control
Only one example was observed for a single particle that was undergoing deposition and, therefore, exceeded the critical particle length. Figure 31 shows a single sedimenting particle observed prior to the formation of (and obscuration by) the moving bed. The perti-nent particle data are represented as the first single-particle growth line in Figure 27 and the first entry in Table 6. The velocity of the par-ticle decreases from 8.11 to 7.45 cm/sec, and the corresponding parti-cle widths increased from 0.47 to 0.64 mm in going from panels 1 through 4. The final particle width is greater than the width calculated for a velocity of 7.42 cm/sec, resulting in deposition of the particle.
FIGURE 31. Example of a single particle undergoing deposition
Summary of current salt well pumping experiments. The above experi-ments have detailed the formation of a plug from a surrogate Hanford supernate stream containing phosphate. As the temperature of the stream is decreased to around 40˚C, long crystals, consistent with the formation of sodium phosphate dodecahydrate, are formed. The plug formation process begins with an induction period followed by the eventual appearance of rod-like or ellipsoidal particles. These parti-cles grow in both dimensions until reaching a critical size, at which
cale AOI
DIAL 40395-11 91

Task 3. Waste Treatment and D&D Support: Process Monitoring and Control
point the particles begin to sediment. At later times, multiple particles undergo sedimentation, forming large aggregates. The number of par-ticles participating in cluster formation increases as the process con-tinues. The deposited single particles and the deposited aggregates form a bed at the bottom of the channel. The bed continues to grow until the channel velocity is severely reduced. Further “hardening” of the plug continues until the flow stops completely.
Particle growth rates are reported which are consistent with the phenomenological process given above and which indicate the danger of phosphate plug formation. It should be noted that the reported growth rates are strictly associated with the surrogate composition; sodium phosphate growth rates in the actual waste are expected to be similar or less than the values given dependent on other solid constit-uents in the stream.
Regardless of these findings, the rapid formation of phosphate plugs should be considered in staging waste streams prior to transfer. At the investigated Reynolds number of 223 the entire process, induc-tion, single particle formation, deposition and agglomerate formation, and bed development and complete plugging, occurs in less that four minutes. The cooling rate is expected to influence the speed of the process, and future experiments will involve measurements at higher Reynolds numbers.
In the actual salt well pumping process, supernate waste is passed through a salt well screen and pumped at low Reynolds numbers to a holding tank. The velocity of the flow (or the Reynolds number) is dependent on the infusion of the liquid into the salt well pump.34 This value is limited and cannot be controlled; therefore, the velocity of the stream cannot readily be increased in an attempt to exceed some value of the critical velocity. The most practical way to avoid sodium phosphate plugs during salt well pumping is to ensure that the phos-phate concentration is below saturation and that the temperature of
DIAL 40395-11 92

Task 3. Waste Treatment and D&D Support: Process Monitoring and Control
the stream remains above that temperature (ca. 43˚C) so that the dodecahydrate crystals do not form.
The ability to maintain a fluid above a given temperature requires that all of the transfer lines be heat-traced. This becomes a compli-cated and potentially expensive task for the site. The possibility of phosphate plug formation will, however, always exist, and means are needed to remediate a plug once formed. Work is currently in progress and will be reported later on the disruption/dissolution of the phosphate plugs.
Feed stability and prevention of solids formation model(s). Further development of an engineering tool, linking the chemistry of the waste streams with the physical processes involved in waste transfers and other site operations, has centered on a parametric study of the effects of particle size distribution on particulate sedimentation. In most transfer equations, such as the expression by Durand given above, the physics of the process centers on an average particle size or particle dimension. Workers at the site were interested in the valid-ity of the assumption of using an average particle size, so simulations were developed to identify the relative effect of the particle size dis-tribution on the particle sedimentation behavior.
Figure 32 shows three normal particle size distributions that were used, along with the average particle size, for the simulations. All of the distributions have the same average value. CFD transport calcula-tions were performed for each of the distributions and for the average particle size. The results are given in Figure 33. Only minor differ-ences were observed in the resulting densities. On comparing the result for the broad distribution (top panel) with that of a single parti-cle size (bottom panel), we observed that the only main difference is at the end of the channel. Additional sedimentation was observed, and further analysis of the results indicated that these particles were from the large particle sizes of the distribution.
DIAL 40395-11 93

Task 3. Waste Treatment and D&D Support: Process Monitoring and Control
FIGURE 32. Particle size distributions employed in the engineering tool model sensitivity study
FIGURE 33. Local density plots for the three distributions in Figure 32 and for the average particle size of 250 microns. The top panel corresponds to the broad PSD in Figure 32 and the bottom panel corresponds to particles of the 250 micron (average) size.
0 50 100 150 200 250 300 350 400 450 5000
5
10
15
20
25
Particle Size Distribution
Particle Diameter ( micrometer )
Per
cent
of T
otal
Par
ticle
Fra
ctio
n
DIAL 40395-11 94

Task 3. Waste Treatment and D&D Support: Process Monitoring and Control
All of the plots indicate that a moving bed was formed. It is not known at this time where or if a plug would form if the simulations were continued to longer particle sizes. The sedimentation is increased; however, the magnitude of this increase is small and could probably be accounted for through the use of a z-average quantity. Additional calculations and correlation with existing empirical expressions are needed.
The simulations shown in Figure 33 were all performed at a stream velocity of 1.0 m/sec. We then observed the effects of the moving bed and deposition zones at higher velocities (see Fig. 34). As predicted by the various empirical relations (see, for example, the Durand equation above), an increase in the velocity results in less particle deposition. What the correlation-type models do not predict is the effect on the moving bed. Although intuitively expected, the length of the moving bed decreases as the velocity increases. Most importantly, a moving bed, indicative of stratified flow, can still be observed when the velocity is raised 300%.
FIGURE 34. Data showing the effect of the stream velocity on the deposition process for the broadest particle size distribution in Figure 32. The top panel is that in Figure 33 with a velocity of 1.0 m/sec. The velocities in the succeeding panels are all increased by 0.5 m/sec with the final panel corresponding to 3.0 m/sec.
DIAL 40395-11 95

Task 3. Waste Treatment and D&D Support: Process Monitoring and Control
Similar calculations were performed for changes in the particle density. These results are presented in Figure 12 and indicate that as the particle density increases there is a propensity of sedimentation. This result is in agreement with the base correlations.
FIGURE 35. Effect of the solids density on deposition behavior for the broad distribution. For these calculations the velocity was set at 1.5 m/sec. Density starts at 1.62 g/cm3 for the top panel increases to 2.3 g/cm3 and 3.5 g/cm3 in the two middle panels and the bottom panel corresponds to a density of 4.2 g/cm3. Water was assumed as the carrier fluid for all of the simulations.
Additional work is needed to more fully evaluate and understand the behavior of moving bed flows. This work is currently in progress, along with studies of the overall solution viscosity that can result in buoyancy effects, thereby reducing the stratification in the channel. Finally, efforts are needed to correlate these results with actual condi-tions at the site and further evaluate the available empirical expres-sions.
Project Status
Work on both aspects of this project, salt well pumping experi-ments and the development of the engineering tool, are continuing.
DIAL 40395-11 96

Task 3. Waste Treatment and D&D Support: Process Monitoring and Control
Conclusions
Laboratory experiments on the salt well pumping of a supernate surrogate for Hanford tank 241-SX-104 has revealed that the forma-tion of a sodium phosphate dodecahydrate plug is a step-wise process involving an induction period, the formation of single particles, and the subsequent deposition of large single particles and particle agglomerates into a moving bed. Characteristic dimensions and growth rates were obtained from high-resolution images of the stream as it flowed through a transparent pipe. Details of the plug formation process have been determined. The growth rates of the phosphate crystals are large, averaging 2 mm/sec in area for the single particles. This rate impacts the formation of the plug that occurs in about four minutes’ time following the initial cooling of the stream. The results indicate the potential dangers associated with inadequate temperature control and/or control of the waste composition through dilution.
Parametric studies were initiated on the development of the engi-neering tool. The results show that only the larger particles of the par-ticle size distribution are critical with regard to deposition. The need to include the entire particle size distribution in the analysis of the transport behavior will depend on the overall shape of the distribu-tion, especially at large particle sizes. The use of an appropriate sta-tistical averaged quantity, such as a z-average particle diameter, should properly account for these effects.
Work Planned
Efforts on salt well pumping are continuing with investigations at higher Reynolds numbers and with efforts to develop and evaluate chemical treatments for plug remediation. Further studies on develop-ment of the engineering tool will focus on the completion of the sen-sitivity study and on the validity of the underlying assumptions implied in empirical representations of slurry transport.
DIAL 40395-11 97

Task 3. Waste Treatment and D&D Support: Process Monitoring and Control
References
34. D.A. Reynolds. May 2000. Status of Waste Transfers, Criteria, and Plans. Presented at the 3rd Saltcake Dissolution and Feed Stability Workshop, Richland, WA.
J.R. Jewett. January 2000. Personal communication. “Tank Farm Informa-tion for TFA Workers” and “Saltwell Pumping from Tank SX-104”. Numatec Hanford Corporation, Richland, WA.
35. J.S. Lindner, H. Al-Habbash and R.K. Toghiani. 2000. Instrumentation Development, Measurement and Performance Evaluation of Environmen-tal Technologies. Technical Progress Report, DIAL 40395-10, p. 81. Diag-nostic Instrumentation and Analysis Laboratory, Mississippi State University, Mississippi State, MS.
36. R. Durand. 1952. The Hydraulic Transportation of Coal and Other Materi-als in Pipes. Colloq. National Coal Board, London.
37. See for example, E.J. Wasp, et al. 1977. Solid-liquid flow slurry pipeline transportation. In Series on Bulk Materials Handling. Clausthal, Germany, Trans Tech Publications, 1:4.
Acknowledgement
We thank P. R. Jang for use of the DIAL imaging system.
DIAL 40395-11 98

TASK 4 Diagnostic Field Applications, Coordination and Testing Support (DFACTS)
HEPA Filter Testing
J. A. Etheridge
Introduction
DIAL is part of a National Technical Work Group that is develop-ing a research plan for evaluating certain aspects of HEPA filter per-formance and failure modes as well as evaluating small particle measurement techniques. Key to the success of the project is the abil-ity to acquire or develop fine particle measurement instrumentation that will operate at extremely low particle loading ranges as well as the development of calibration techniques for these devices.
Work Accomplished
At the present time the group has agreed upon Data Quality Objectives and is proceeding toward development of an initial Test Plan based on critical path elements and certain needs of the DOE and EPA.
DIAL 40395-11 99

Task 4. Diagnostic Field Applications, Coordination and Testing Support (dfacts)
Work Planned
The next step is to determine what known elements of the work to be done can actually begin in April without regard to a Test Plan. This will include such actions as procurement of equipment and supplies.
The group is communicating via conference calls at two to three week intervals. This is a cost-effective if not expeditious technique for information exchange. However, a meeting of as many of the group members as can attend the International Conference on Incin-eration and Thermal Treatment Technologies in May is planned.
DIAL 40395-11 100