marketing science future: measurement development … · marketing accountability standards board...
TRANSCRIPT
Marketing Accountability Standards Board of the Marketing Accountability Foundation
Marketing Science Future:
Measurement Development and
Process Management
Characteristics of an ―Ideal Metric‖
and Practices
Allan Kuse, Chief Advisor
The MMAP Center
Charter Director of the MASBMarch 2010
Chicago

2Copyright © 2010 MASB
Forecasting Models 4
Measurement 1
Integrated Data Bases
Research-On-Research
Knowledge 2
Better Practice 3
Improvement
Hindsight
Near sight
Foresight
Insight
1 Reliably identify business opportunities (or threats) given current context & (potential) actions (MR Vision 2003); Process of achieving & maintaining measurement reliability, predictive validity, sensitivity & calibration.
2 Profound understanding (of the business process or human & customer behavior) that yields a clear prioritization of action; Learning or principles that yield true predictions with unvarying uniformity (IBID);
Process of explaining variance/identifying the causal drivers of the business or human behavior.
3 Documented method of operating that yields higher level of performance than other operating behaviors (IBID); Process of applying Knowledge to the operating process for improved performance.
4 Analytical technique that represent causal relationships among various conditions & actions taken to achieve specific business results, and forecast future outcomes of various potential actions & conditions (IBID)
Measurement is The Foundation for
Reporting, Forecasting & Improving Return
Source: ―The Improvement Pyramid,‖ MASB Project Agenda, Work in Process

Marketing Accountability Standards Board of the Marketing Accountability Foundation
Marketing
Accountability Standards
Measuring and
Improving the Return
from TV Advertising
(An Example)
April 2008
Posted on
MASB WebsiteFor Feedback

4
Purpose of TV Project
The purpose of this TV Project is to serve as an example
of how to evaluate marketing metrics according to
the Marketing Metrics Audit Protocol (MMAP), the learning
that can come from using an ―ideal‖ metric over time and conditions,
and how to improve return from the activity by applying the metric
and learning to better marketing practice (process management).
The TV Project was selected, conducted and reviewed
by members of The Boardroom Project (10/06–7/07),
and reviewed by the MASB Board (8/07–3/08).
Areas of potential improvement in the overall MMAP process
as well as questions regarding the content of
this particular project were, and will continue to be addressed
Source: ―Measuring and Improving the Return from TV Advertising (An Example),‖ MASB, April 2008
Copyright © 2010 MASB

5
Pre-Market Metrics Commonly Used by Practitioners
Recall
% recalling key message elements
Likeability
% judging product/service ―likeable‖
Different
% judging product/service positively ―different‖
New Information
% judging ad provides ―news‖ or ―new information‖
Persuasion
% judged to be positively persuaded
These metrics/classes of measures were listed as commonly used by
practitioners in the ANA Marketing Accountability Task Force Report ; they
are based on varying theories of what to measure; in the report, none were
tied to financial performance.
Source: ―Measuring and Improving the Return from TV Advertising (An Example),‖ MASB, April 2008
Copyright © 2010 MASB

6
Body of Knowledge: Recall
―Recall is a very poor measure of a commercial‘s effect on consumer purchase‖
(Ross 1982)
―We know that recall data are inherently weak—we know that the theory on which recall data are based is empirically shaky. We know that the
evidence for validity of recall is—to be charitable—‗checkered‘ ‖ (Gibson 1983)
―A powerful body of evidence has established that there is no simple and direct connection between factual recall on the one hand,
and preference and buying behavior on the other‖ (Jones 1986)
―Recall correctly indicated a sales effect in only 12 of 20 (split cable) spend tests and two of seven copy tests . . . 52 percent success rate‖
(Blair 1989, Kuse 1991)
―The combined evidence (9 papers) suggests that it is unwise to look to recall for an accurate assessment of a commercial‘s sales effect‖
(Jones et al, 1996)
Copyright © 2010 MASB
Source: ―Measuring and Improving the Return from TV Advertising (An Example),‖ MASB, April 2008

7
Body of Knowledge: Likeability
―Across 30 years of . . . published large-scale . . . validation work
(including studies performed by rsc, IRI, and the ARF) . . .
the predictive (to sales) track record of . . . liking,
related recall, and brand-name recall have fared
no better than the 50-50 coin toss, hit-or-miss odds‖
(Wells, 1997)
―Likeability does not necessarily imply preference‖
(ANA 2005)
Copyright © 2010 MASB
Source: ―Measuring and Improving the Return from TV Advertising (An Example),‖ MASB, April 2008

8
Body of Knowledge: ―Different‖ & ―New Information‖
No published studies regarding
the relationship between these measures
(or classes of measures) and purchase behavior
could be found.
―News itself is not necessarily persuasive‖
(ANA 2005)
Source: ―Measuring and Improving the Return from TV Advertising (An Example),‖ MASB, April 2008
Copyright © 2010 MASB

9
Body of Knowledge: Persuasion
―The selling power of advertising can be measured (pre-market)‖ (Blair 1988)
―Ads which are not persuasive do not increase sales and do not improve over time-related-to-spending. Ads which are persuasive do increase sales . . . ;
and they wearout in the process ‖ (ibid)
―The implications from this (forward validation) story speak to the request for advertising accountability‖
(Adams et al 1992)
―The (persuasion) measure has successfully indicated the split-cable . . . results 91 percent of the time‖
(Blair et al, 1994)
―It is possible to identify sales-effective advertising before airing if the proper (persuasion) measurement tools are used‖
(Jones et al, 1996; citing 15 papers)
―This evidence supports the use of this measurement as the primary source of feedback during the advertising development and management process‖
(Wells, 1997)
Copyright © 2010 MASB
Source: ―Measuring and Improving the Return from TV Advertising (An Example),‖ MASB, April 2008

10
Feedback after Posting the TV Example
Would be more useful if measure and provider were named
The metrics piece is confusing – call it ARS persuasion
comScore announces acquisition of ARS Group (2/10/10)
May be time to name the measure for clarity and context
At least for today‘s presentations
Perhaps in posted MASB TV document
Copyright © 2010 MASB
11
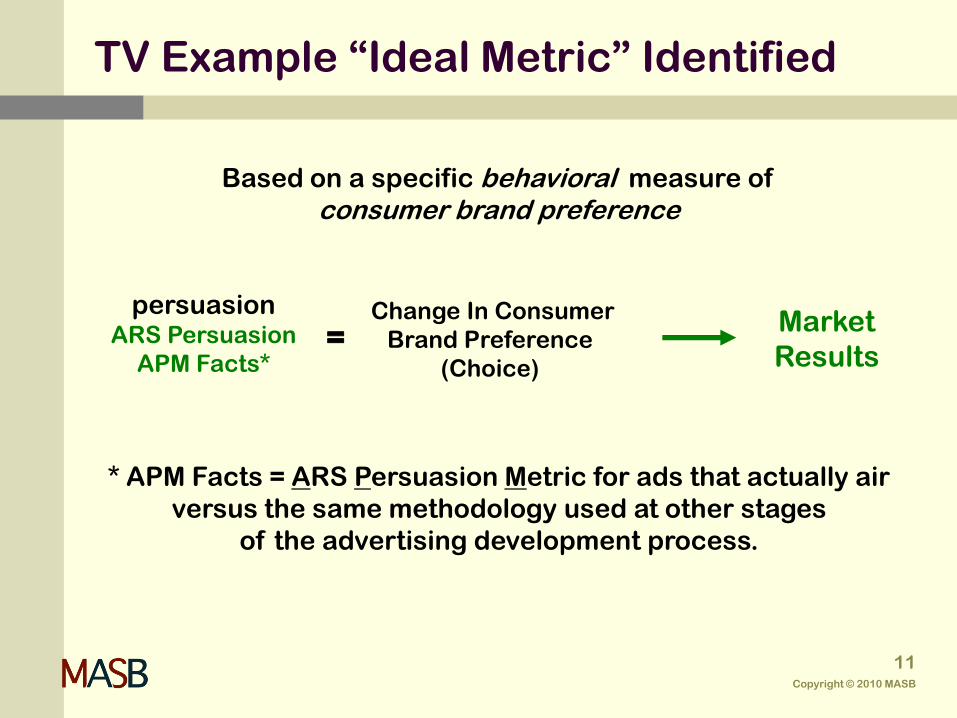
Market
Results
Change In Consumer
Brand Preference
(Choice)=
persuasionARS Persuasion
APM Facts*
Based on a specific behavioral measure of
consumer brand preference
* APM Facts = ARS Persuasion Metric for ads that actually air
versus the same methodology used at other stages
of the advertising development process.
TV Example ―Ideal Metric‖ Identified
Copyright © 2010 MASB

12Copyright © 2010 MASB
MMAP
The Marketing Metric Audit Protocol (MMAP)
is a formal process for connecting marketing activities
to the financial performance of the firm.
The process includes the conceptual linking of
marketing activities to intermediate marketing outcome metrics
to cash flow drivers of the business, as well as the validation
and causality characteristics of an ideal metric.
Cash flow both short-term and over time is the ultimate metric
to which all activities of a business enterprise,
including marketing, should be causally linked through
the validation of intermediate marketing metrics.
The process of validating the intermediate outcome metrics
against short-term and/or long-term cash flow drivers is
necessary to facilitate forecasting and improvement in return.

13
MMAP (Conceptual Linking)
Marketing
Activity
Cash FlowCash Flow
DriverIntermediate
Marketing
Outcome
Intermediate
Marketing
Outcome
Intermediate
Marketing
Outcome
Cash Flow
Driver
Source: The Boardroom Project (2006)Copyright © 2010 MASB

14
MMAP TV Example: Activity, Measures & Conceptual Links
TV Ads
Cash Flow
Sales
Volume
Price
Premium
Leverage
Velocity
Source: MASB (2008)
Brand
Preference(Choice)
Market
Share
Profit
Margin
Copyright © 2010 MASB

15Copyright © 2010 MASB
MMAP
Validation & Causality Audit
Every Intermediate Marketing Outcome Metric Should Be
Validated Against Short-Term and/or Long-Term Cash Flow
Drivers and Ultimately Cash Flow
(or to the Drivers of the Cash Flow Drivers).
Source: The Boardroom Project (2006)

16
MMAP: (ARS Persuasion) Brand Preference Metric
1) Relevant . . . addresses and informs specific pending action
Is proposition strong enough to proceed w/ad development? How much weight behind each ad to achieve desirable impact?
2) Predictive . . . accurately predicts outcome of pending action
Predicts ad impact on quarterly sales volume impacted and market share
3) Calibrated . . . means the same across conditions & cultures
2 is a 2 and 7 a 7 in US, Latin America, Europe . . . for new, restaging, and established brands . . . no indexing or modeling in derivation
4) Reliable . . . dependable & stable over time
Test-retest reliability @ >.90 over 3 decades
5) Sensitive . . . identifies meaningful differences in outcomes
A 2-point difference is detectable, and a 2-point difference results in a .04 difference in quarterly market share
Source: ―Measuring and Improving the Return from TV Advertising (An Example),‖ MASB, April 2008
Copyright © 2010 MASB
17
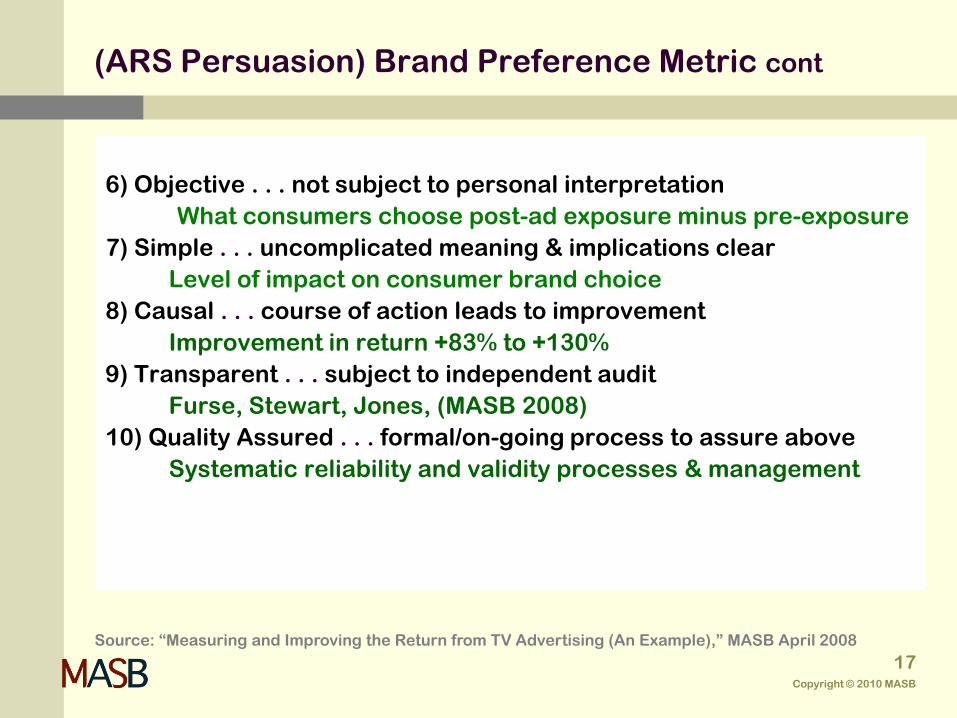
(ARS Persuasion) Brand Preference Metric cont
6) Objective . . . not subject to personal interpretation
What consumers choose post-ad exposure minus pre-exposure
7) Simple . . . uncomplicated meaning & implications clear
Level of impact on consumer brand choice
8) Causal . . . course of action leads to improvement
Improvement in return +83% to +130%
9) Transparent . . . subject to independent audit
Furse, Stewart, Jones, (MASB 2008)
10) Quality Assured . . . formal/on-going process to assure above
Systematic reliability and validity processes & management
Source: ―Measuring and Improving the Return from TV Advertising (An Example),‖ MASB April 2008
Copyright © 2010 MASB

18
Summary & Conclusions
The (ARS Persuasion) consumer Brand Preference Metric has met the MASB Marketing Metric Audit Protocol
(MMAP).
Its characteristics would deem it ―ideal‖ for serving as a standard for measuring and forecasting the impact of TV advertising and for managing and improving the return.
Application of the metric during the advertising development and management processes has enabled
improvement in return greater than that needed to offset the rises in TV Media costs.
Note: While various metrics may be called the same and even look alike in many ways, specific methodologies within classes and types of metrics often yield very different levels of reliability and validity (see Appendix B)
Source: ―Measuring and Improving the Return from TV Advertising (An Example),‖ MASB, April 2008
Copyright © 2010 MASB

19Copyright © 2010 MASB
The Practices & Processes
Underlying the Development & Management
of an ―Ideal Metric‖
Source: The Boardroom Project (2006)

20
Triumvirate in operating structure
Research
Operations
Marketing
Research structure
Measurement Standards
Reliability, validity, etc
Integrated data bases
Knowledge
Identification of drivers (causals)
Better Practice implications & application
Customer Support
Teaming w/Marketing (inc customer service)
Customer specific research-on-research
30% of activity was self-funded research (on-research)
Corporate Practices
Copyright © 2010 MASB

21
MMAP: 10 Characteristics of an Ideal Metric
1. Relevant . . . addresses specific pending action
2. Predictive . . . accurately predicts outcome of pending action
3. Objective . . . not subject to personal interpretation
4. Calibrated . . . means the same across conditions & cultures
5. Reliable . . . dependable & stable over time
6. Sensitive . . . identifies meaningful differences in outcomes
7. Simple . . . uncomplicated meaning & implications clear
8. Causal . . . course of action leads to improvement
9. Transparent . . . subject to independent audit
10. Quality Assured . . . formal/on-going process to assure 1–9
Copyright © 2010 MASB

22
Behavioral nature of methodology
Relevant (#1)
Objective (#3)
Simple (#7)
Systematic test-retest reliability process (ARSAR)
Reliable (#5)
Sensitive (#6)
Systematic validity process (ARSAV)
Predictive (#2)
Calibrated (#4)
Sensitive (#6)
On-going better practice insight process (BPI)
Causal (#8)
Documentation, publication, academic audits & collaboration
Transparent (#9)
Practices: Measurement Standards & Knowledge
Copyright © 2010 MASB

23Relevant, Objective, Simple
ARS Brand Preference (choice) Methodology
Copyright © 2010 MASB

24
Behavioral nature of methodology
Relevant (#1)
Objective (#3)
Simple (#7)
Systematic test-retest reliability process (ARSAR)
Reliable (#5)
Sensitive (#6)
Systematic validity process (ARSAV)
Predictive (#2)
Calibrated (#4)
Sensitive (#6)
On-going better practice insight process (BPI)
Causal (#8)
Documentation, publication, academic audits & collaboration
Transparent (#9)
Practices: Measurement Standards & Knowledge
Copyright © 2010 MASB

25
Process managed by ―Standards‖ research team
Systematic test-retesting
All key measures
Continuous monitoring
Feed to management (dashboard)
Collaboration w/Operations when required
Operating process improvement
Summary & publication every other year or so
Reliability Process (ARSAR)
Copyright © 2010 MASB

26Copyright © 2010 MASB
Global Reliability of the ARS Persuasion® Measure, ARS®
Validated Drivers, and Diagnostic Measures
February 2005 & February 2008Documents
The ARS® Group
rsc THE QUALITY MEASUREMENT COMPANY
110 WALNUT STREET EVANSVILLE, INDIANA 47708 NA
TEL: (812) 425-4562 FAX: (812) 425-2844
©2005 rsc. All rights reserved.
The following list of rsc trademarks is provided for your information only. This is not a complete list of every service mark owned by rsc. Each mark, whether
indicated to be a trademark in this document or not, is protected by state, national, or international law.
rsc trademarks are On The Global Playing Field and Now That's A Global Idea. rsc service marks include, but are not limited to, the following: APM, ARS, the
ARS logo, ARS Context, ARS StarBoard, ARS WOWWW, ARS WOWWW CI, ARS Persuasion, ARSAR, C2C, CATS, Fair Share, Firstep, Outlook, PPD,
Persuasion Points Delivered, StarBoard, Television Preview, VOC, and Window On the World Wide Web. The ARS method, process, and application/software
for forecasting advertising's impact on sales (as determined by Market Mix Modeling output) are the subject of one or more pending patents.
Excerpted with Permission

27
Outline
Background & Objectives
Design/Data Collection (Database)
Empirical Findings
Business Implications & Applications
Study Data and Inclusion Criteria (Appendix)
27
Publication is ~45 pages and includes

28Copyright © 2010 MASB
Analysis/Findings
ARS Persuasion MeasureTest for Inconsistent (“Other”) Error Variance
ARS Persuasion
Measure1
Number of Commercial Test-Retest Pairs 214
Test-Retest Variation Observed2 +1.36
Variation Expected From Random Samples2 +1.52
F-Ratio 0.80
Conclusion Not Significant3
1 Includes testing in Europe, Latin America, and North America for the time period January 2005 to December 2007.2 In standard deviation units.3 At the 95 percent confidence level.
Globally, the ARS Persuasion measure is as reliable as the laws of random sampling allow. “Other” error
variance is not a factor.
28

29Copyright © 2010 MASB
Analysis/Findings
ARS Persuasion MeasureChi-Square1 “Goodness-of-Fit” Analysis
1 See Appendix A2 Includes testing in Europe, Latin America, and North America for the time period October 2005 to September 2007.3 N = 256
For the combined data set, the distribution of test-retest t-values does not differ significantly from what is
expected.
Expected Actual Percent
t-Value Percent of Cases of Cases2,3
0.000–0.674 50% 52%
0.675–0.842 10 12
0.843–1.036 10 10
1.037–1.282 10 8
1.283–1.644 10 10
1.645–1.959 5 4
> 1.960 5 4
Needed for
Significance Observed
X2 at 90 Percent Cutoff 11.07 2.30
X2 at 95 Percent Cutoff 12.59 2.35
10% 8%
29

30Copyright © 2010 MASB
Empirical Findings
ARS Validated Drivers of the ARS Persuasion Measure1
Test-RetestPositive Content Elements Criterion Agreement2,3
Brand Differentiation Presence 99%
New Product/New Feature Presence 100
Product Convenience4 Presence 99
Competitive Comparison Presence 99
Superiority Claim4 Presence 99
Brand Name Reinforces Benefit5 Presence 100
Demonstration of Product in Use4 Presence 100
Setting Directly Related to Use4,5 Presence 100
Time Actual Product on Screen4,5 Time 100
Number of Brand Name Mentions4 Count 100
Time Brand Name/Logo on Screen Time 98
Time Until Category Identified Time 99
Time Until Product/Package Shown Time 100
1 See: “Summary of Factors That Differentiate Television Commercials That Are More or Less Sales Effective and the Business Implications and
Applications of This Knowledge”; The ARS Group, December 2003.2 Percent of time the test and retest measures give the same “indication.”3 N=1444 Element also ARS Validated Driver of ARS Related Recall.5 Element also ARS Validated Driver of ARS Key Message Communication.
These positive elements have been validated in The ARS Group’s databases as helping to explain superior and
below average ARS Persuasion outcomes relative to the Fair Share degree-of-difficulty benchmark and on absolute
levels. All exhibit sufficient test-retest correspondence for use as drivers of the ARS Persuasion measure.
30

31Copyright © 2010 MASB
Business Implications (Better Practices)
Globally, the sales-related ARS Persuasion measure is behaving as reliably as random sampling
will allow and is free of extraneous sources of variance. It is therefore appropriate to use
standard t-tests to assess the significance of differences when analyzing ARS Persuasion
results on an operational basis.
The secondary measures validated as predictive of ARS Persuasion outcomes and the consumer
feedback elements have high enough test-retest agreement to be useful in advertising development
and in the explanation of test results.
31

32
Region Case Number
ARS Persuasion Level
(Original Test) Standard Error
ARS Persuasion
Level (Re-Test) Standard Error t-Value
US 1 7.6 1.78 0.8 1.72 2.74*
US 2 6.1 1.02 2.3 0.87 2.79*
US 3 3.9 0.81 3.1 0.77 0.71
US 4 0.9 1.50 2.2 1.21 0.68
US 5 18.6 1.86 16.8 1.72 0.71
US 6 2.4 1.70 -1.3 1.98 1.42
US 7 3.1 1.07 3.0 1.49 0.06
US 8 1.9 0.73 1.8 0.80 0.09
US 9 8.6 1.40 11.3 1.42 1.33
US 10 2.6 1.73 1.2 1.51 0.61
US 11 10.7 2.01 9.9 1.68 0.32
US 12 0.2 0.94 -1.2 1.06 0.99
US 13 25.8 2.00 20.4 2.04 1.87*
US 14 3.2 0.80 2.8 0.85 0.34
US 15 11.2 2.10 11.8 1.90 0.21
US 16 7.4 1.61 7.2 1.62 0.09
US 17 1.7 1.56 2.8 1.66 0.47
US 18 6.4 1.32 5.6 1.36 0.42
US 19 2.1 0.85 1.6 1.12 0.35
US 20 2.8 1.80 2.6 1.47 0.09
US 21 3.4 1.04 1.4 0.89 1.48
US 22 1.8 0.58 3.2 0.74 1.48
US 23 15.0 2.13 12.9 2.41 0.65
US 24 3.2 1.31 7.2 1.46 2.06*
US 25 5.0 1.41 8.0 1.89 1.31
US 26 3.4 1.23 4.3 1.35 0.50
US 27 2.8 1.13 1.8 1.09 0.64
US 28 11.3 1.81 11.2 1.67 0.04
US 29 4.3 1.86 5.2 1.93 0.34
US 30 2.5 1.40 0.7 1.06 1.03
US 31 3.7 1.57 1.1 1.29 1.29
US 32 0.4 0.16 0.8 0.28 1.28
US 33 -0.4 0.31 0.4 0.47 1.38
US 34 3.8 0.93 5.1 1.01 0.94
US 35 5.1 1.02 4.1 0.92 0.73
US 36 7.9 1.48 7.6 1.45 0.15
US 37 3.3 1.72 2.0 1.61 0.55
US 38 4.8 1.08 3.1 1.13 1.10
US 39 1.4 1.15 0.5 1.02 0.57
US 40 4.2 1.53 2.7 1.40 0.72
US 41 0.0 2.88 -2.6 2.89 0.64
US 42 1.2 1.48 1.2 1.23 0.00
US 43 1.0 0.94 1.2 1.09 0.14
Region Case Number
ARS Persuasion Level
(Original Test) Standard Error
ARS Persuasion
Level (Re-Test) Standard Error t-Value
US 44 4.7 1.02 4.3 0.92 0.29
US 45 2.2 1.46 3.2 1.45 0.49
US 46 -0.6 1.68 -2.9 1.67 0.97
US 47 5.1 2.11 5.7 1.68 0.23
US 48 3.3 1.32 3.8 1.19 0.28
US 49 3.0 1.20 5.3 1.35 1.29
US 50 0.9 0.75 2.8 0.98 1.56
US 51 13.3 2.12 13.1 2.01 0.07
US 52 2.2 1.99 1.4 1.91 0.29
US 53 1.8 0.90 4.0 1.03 1.63
US 54 3.3 1.42 4.1 1.81 0.35
US 55 1.6 1.20 3.3 2.07 0.72
US 56 6.0 1.46 4.1 1.27 1.00
US 57 11.0 1.36 7.6 1.17 1.89*
US 58 3.7 1.69 5.0 1.68 0.55
US 59 3.9 2.00 1.6 2.02 0.81
US 60 -0.2 1.10 1.3 1.28 0.89
US 61 1.8 0.37 0.7 0.45 1.90*
US 62 51.5 2.40 56.6 2.38 1.51
US 63 9.0 1.38 5.8 1.11 1.81*
US 64 2.9 1.09 4.5 1.22 0.98
US 65 3.1 1.44 0.5 1.27 1.33
US 66 1.3 0.47 1.2 0.47 0.15
US 67 3.6 1.70 0.2 1.87 1.34
US 68 3.2 1.18 5.0 1.29 1.04
US 69 1.7 0.62 0.8 0.42 1.23
US 70 3.1 1.14 1.1 0.90 1.39
US 71 20.4 2.50 23.7 2.40 1.05
US 72 4.7 1.89 6.2 1.76 0.58
US 73 2.7 1.06 4.1 1.09 0.92
US 74 0.0 1.09 1.3 0.95 0.90
US 75 -0.2 0.97 1.2 1.00 1.01
US 76 -2.5 1.36 1.4 1.45 1.96*
US 77 13.8 1.60 11.9 1.49 0.87
CD 78 0.00 1.55 -1.70 2.48 0.59
CD 79 4.40 1.74 1.60 1.64 1.18
CD 80 4.70 2.05 -1.50 1.83 2.21*
CD 81 4.80 2.09 3.60 1.62 0.45
CD 82 9.80 2.76 5.10 2.81 1.21
CD 83 0.00 0.39 0.70 1.15 0.62
CD 84 4.40 1.53 4.70 1.73 0.13
CD 85 1.00 2.21 0.90 1.96 0.03
* Significant difference at 90 percent confidence level.
** Individual region codes: US = United States; CD = Canada, LA = Latin America; EU = Europe. 32

33
Behavioral nature of methodology
Relevant (#1)
Objective (#3)
Simple (#7)
Systematic test-retest reliability process (ARSAR)
Reliable (#5)
Sensitive (#6)
Systematic validity process (ARSAV)
Predictive (#2)
Calibrated (#4)
Sensitive (#6)
On-going better practice insight process (BPI)
Causal (#8)
Documentation, publication, academic audits & collaboration
Transparent (#9)
Practices: Measurement Standards & Knowledge
Copyright © 2010 MASB

34
Process also managed by ―Standards‖ research team
Tracking of all customer ads airing (eg Monitor Plus)
Matching to ads tested
Obtaining market data (eg third party Nielsen, IRI, IMS)
Other data from customers (eg GRPs & Marketing Mix Results)
Continuous monitoring
Feed to management (dashboard)
Collaboration with Marketing (Customer Service) when required
Test design process improvement (eg Lysol)
Summary & publication every other year or so
Journal publication of key learning (eg wearout)
Validity Process (ARSAV)
Copyright © 2010 MASB

35Copyright © 2010 MASB
Summary of The ARS Group’sGlobal Validation and Business Implications
November 2005 & January 2008Documents
The ARS® Group
rsc THE QUALITY MEASUREMENT COMPANY
110 Walnut Street, Evansville, Indiana 47708
TEL: (812) 425-4562 FAX: (812) 425-2844
©2005 rsc. All rights reserved.
The following list of rsc trademarks is provided for your information only. This is not a complete list of every service mark owned by rsc. Each mark, whether indicated to be a trademark in
this document or not, is protected by state, national, or international law.
rsc service marks include, but are not limited to, the following: APM, ARS, the ARS logo, ARS Context, ARS StarBoard, ARS WOWWW, ARS WOWWW CI, ARS
Persuasion, ARSAR, Brand Preference Monitor, BP, BP Monitor, C2C, CATS, Fair Share, Firstep, HeartZone, HZ, MindZone, MZ, Outlook, PPD, Persuasion Points Delivered, rsc Brand Preference, Preference Points Delivered, StarBoard, Television Preview, VOC, and Window On the World Wide Web. The rsc method, process, and application /software for forecasting advertising's impact on sales (as determined by Market Mix Modeling output) and for tracking consumer brand preference over time are the subject of two or more pending patents.
ADSAM is a registered mark of ADSAM Marketing, LLC.
Excerpted with Permission

36
Outline
36QMS036
• Background & Objectives
• Design/Data Collection (Database)
• Analysis
• Empirical Findings/Knowledge (Better Practice Insight)
• Business Implications (Better Practices)
• Business Applications (Best Practice Tools)
• Frequently Asked Questions/Additional Findings
• Study Data and Inclusion Rules (Appendix)
Publication is ~116 pages and includes

371 Source: R. L. Polk New Vehicle Registration, IMS HEALTH, IRI InfoScan, Markettrack, Nielsen SCANTRACK, or Nielsen Retail Index.
-5
0
5
10
15
20
25
-5 0 5 10 15 20 25 30 35 40 45
The relationship between APM Facts and in-market effects remains strong and is calibrated across brands, categories, and countries. A “2” is a “2” and a “7” is a “7” in the USA, Mexico, Germany, etc.
In fact, the strength of television advertising alone, as measured via the ARS methodology, explains over 50 percent of the variance in market share change across brands, categories, and countries. To our knowledge, no other single variable in the marketing mix has been shown to have such a dramatic influence over a 4-week period of time.
Mark
et
Sh
are
Ch
an
ge
1
Analysis
APM Facts and Market Share Change
(Period Before Airing to Period After Airing)
APM Fact
37QMS036
n = 379
r = 0.72
r2 = 0.51
175 brands
78 categories
33 advertisers
7 countries

38
-5
0
5
10
15
20
25
-5 0 5 10 15 20 25 30 35 40 45
1 Source: R. L. Polk New Vehicle Registration, IMS HEALTH, IRI InfoScan, Markettrack, Nielsen SCANTRACK, or Nielsen Retail Index. 2 Quarterly share data were only available for 320 cases in the overall data set.
The strong relationship between APM Facts and market share change (r = 0.72) continues when the analysis period is expanded over a quarter.
Improving APM Facts just “two points” is associated with a +0.4 market share improvement over a quarter.
Analysis
APM Facts and Market Share Change
(Over a Quarter)
APM Fact
38QMS036
n = 3202
r = 0.72
r2 = 0.52
Qu
art
erl
y S
hare
Ch
an
ge
1
39
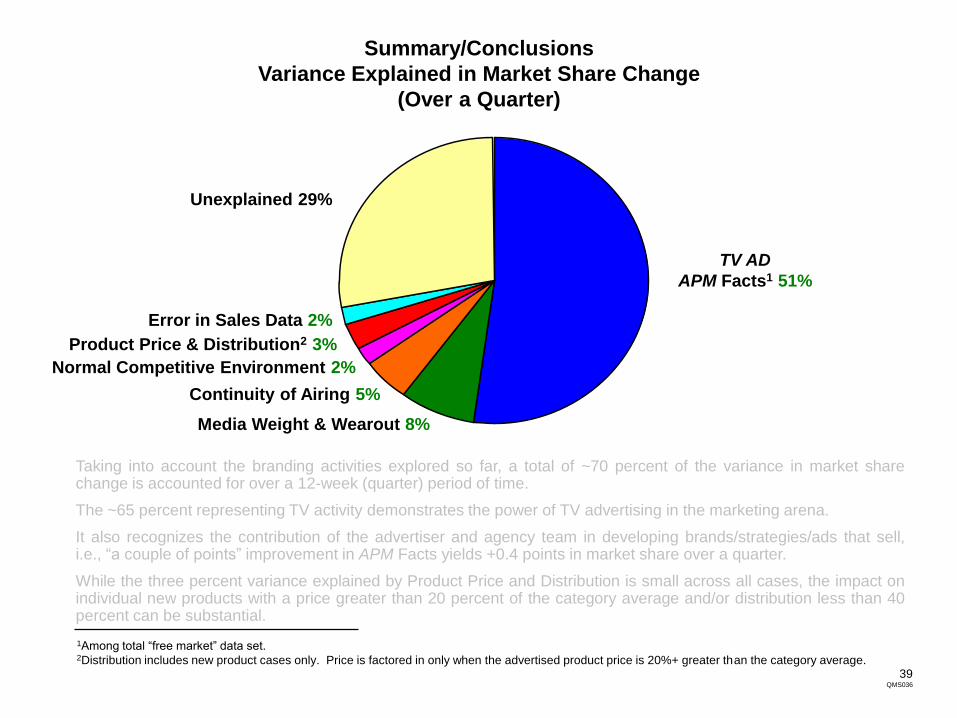
1Among total “free market” data set. 2Distribution includes new product cases only. Price is factored in only when the advertised product price is 20%+ greater than the category average.
Taking into account the branding activities explored so far, a total of ~70 percent of the variance in market sharechange is accounted for over a 12-week (quarter) period of time.
The ~65 percent representing TV activity demonstrates the power of TV advertising in the marketing arena.
It also recognizes the contribution of the advertiser and agency team in developing brands/strategies/ads that sell,i.e., “a couple of points” improvement in APM Facts yields +0.4 points in market share over a quarter.
While the three percent variance explained by Product Price and Distribution is small across all cases, the impact onindividual new products with a price greater than 20 percent of the category average and/or distribution less than 40percent can be substantial.
Summary/Conclusions
Variance Explained in Market Share Change
(Over a Quarter)
39QMS036
TV AD
APM Facts1 51%
Media Weight & Wearout 8%
Unexplained 29%
Continuity of Airing 5%
Normal Competitive Environment 2%
Product Price & Distribution2 3%
Error in Sales Data 2%

40Copyright © 2010 MASB
I. Do the findings hold for:
A. Established and new brands?
B. Large and small brands?
C. Different regions?
D. Different types of products?
E. 30" and 15" ads?
F. Rational and emotional ads?
G. Advertised products and the total product line?
H. Different relationships to the Fair Share benchmark?
I. Samples containing men and women and women only?
J. Category purchasers?
K. Multiple purchase categories?
L. Seasonal categories?
M. Ads containing a competitive comparison?
N. Frames showing multiple product packages?
O. Categories with a strong store brand presence?
P. Old Pre/New Post frame methodology?
Q. “Halo” Effects?
R. Bi-monthly data?
S. A longer time period?
T. The most recent data set?
Frequently Asked Questions/Additional Findings
40QMS036

4141
QMS036
Ma
rke
t S
ha
re C
ha
ng
e2
Ma
rke
t S
ha
re C
ha
ng
e2
APM Fact APM Fact
I. B. 1. Do the Findings Hold for Large and Small1 Established Brands?
Large Small
Large and small brand cases show a relationship similar to that of the overall data set.3
1 Large brands are defined as brands with a pre choice of 20% or greater; small brands have a pre choice of less than 20%.2 Source: R. L. Polk New Vehicle Registration, IMS HEALTH, IRI InfoScan, Markettrack, Nielsen SCANTRACK, or Nielsen Retail Index. 3 At the 95% confidence level based on “Tests of Difference of Data Sets” as described under Design/Data Collection.
-5
0
5
10
15
20
25
-5 0 5 10 15 20 25 30 35 40 45
All Others
Large Brands
Best Fit Line
-5
0
5
10
15
20
25
-5 0 5 10 15 20 25 30 35 40 45
All Others
Small Brands
Best Fit Line

42
-5
0
5
10
15
20
25
-5 0 5 10 15 20 25 30 35 40 45
All OthersVery Large BrandsBest Fit Line
42QMS036
I. B. 2. Do the Findings Hold for Very Large1 Established Brands?
A strong relationship exists between advertising effectiveness and market share change among very large brands.3
1 Very large brands are defined as brands with a pre choice of 40% or greater. 2 Source: R. L. Polk New Vehicle Registration, IMS HEALTH, IRI InfoScan, Markettrack, Nielsen SCANTRACK, or Nielsen Retail Index. 3 At the 95% confidence level based on “Tests of Difference of Data Sets” as described under Design/Data Collection.
Mark
et
Sh
are
Ch
an
ge
2
APM Facts and Market Share Change
APM Fact

43Copyright © 2010 MASB
43QMS036
II. Additional Findings
A. Is airing an APM Fact of zero the same as going dark?
B. Does airing low(er) APM Facts (less than 2.0) produce greater
sales effects than not advertising/going dark?
C. Does continuing to air low(er) APM Facts (less than 2.0) produce
greater sales effects than going dark?
D. What percentage of tested ads score zero or less?
E. Does the share decline when going dark vary by category?
F. Can the share point decline when going dark be verified with an
independent data set?
G. Why is using the PPD metric a more accurate and actionable
method than using just GRPs or impact per 100 GRPs?
H. Is ARS Related Recall predictive of market results?
I. What protocols are applied for understanding ad impact within the
context of other marketing activities?
J. How do APM Facts relate to ad impact when isolated from other
elements of the marketing mix?
K. Has TV APM Facts and GRPs (PPDs) continued to explain similar
variance in market share change over time?
L. Is the ARS Persuasion measure reliable?
Frequently Asked Questions/Additional Findings

44
For Zero Level APM Facts
Going to Air Continue to Air Going Dark
Best Fit Market Best Fit Market Best Fit Market Share Change
Share Change1 Share Change1 for the Typical Category1
- 0.4 - 0.4 - 0.4
II. A. 3. Is Airing an APM Fact of Zero
the Same as Going Dark?
44QMS036
From the market share change model, going to air in the typical category with an ad having an APM Fact of0.0 and continuing to air an ad that has worn down to an APM Fact of 0.0 have the same sales impact asgoing dark over the course of a quarter. This converges with the findings from our lab.
1Based on the typical, moderately elastic category. Categories with greater elasticity will experience greater drops and
categories with lower elasticity will experience lower drops.

45Copyright © 2010 MASB
45QMS036
II. Additional Findings
A. Is airing an APM Fact of zero the same as going dark?
B. Does airing low(er) APM Facts (less than 2.0) produce greater sales
effects than not advertising/going dark?
C. Does continuing to air low(er) APM Facts (less than 2.0) produce
greater sales effects than going dark?
D. What percentage of tested ads score zero or less?
E. Does the share decline when going dark vary by category?
F. Can the share point decline when going dark be verified with an
independent data set?
G. Why is using the PPD metric a more accurate and actionable
method than using just GRPs or impact per 100 GRPs?
H. Is ARS Related Recall predictive of market results?
I. What protocols are applied for understanding ad impact within the
context of other marketing activities?
J. How do APM Facts relate to ad impact when isolated from other
elements of the marketing mix?
K. Has TV APM Facts and GRPs (PPDs) continued to explain similar
variance in market share change over time?
L. Is the ARS Persuasion measure reliable?
Frequently Asked Questions/Additional Findings

46
1Days of incremental category volume. Calculated by dividing Incremental Volume from TV advertising by average category
volume per day.2With Normal Competitive Environment
PPD Metric Predicts the Sales Impact
(Free Market—Isolated Impact From Market Mix Modeling)
46QMS036
How do APM Facts relate to ad impact when isolated from other elements
of the marketing mix?
-2
0
2
4
6
8
10
12
14
-2 0 2 4 6 8 10 12 14 16 18
Incre
men
tal
Days o
f C
ate
go
ry S
ale
s1
Persuasion Points Delivered Metric
n = 112
r = 0.90
r2 = 0.81
The relationship between the Persuasion Points Delivered metric and Market Mix Modeling outcomes data has a strong 0.90 correlation among the 112 cases in this data set.
rsc
0108

47Copyright © 2010 MASB
The power of the ad accounts for most of the overall variation in TV impact as derived independently by Marketing Mix Modelers; metrics of GRPs for media
weight, (APM Facts) for the TV messages, the wearout function and normal competitive environment function explain ~ 90% of variance.
* Marketing Mix Modeling Output: Sales Volume Impacted from TV.
Media Weight
& Wearout
16%
Unexplained 10%
Competitive Environment
6%
Error in Sales Data 2%
TV Ads
(APM Facts)
66%
Total
Explained
90%
Explaining Variation in TV Impact* Business Quarter-to-Quarter
Source: ―Measuring and Improving the Return from TV
Advertising (An Example),‖ MASB April 2008
TV Overview: The Media & The Message

48Copyright © 2010 MASB
Summary of Validity
Correlation with
Trial/Volume/Share
1970s New Product Reported Trial (isolated impact) r = +.85
1980s Split-cable Copy Tests (isolated impact) (7/7)
1990s Split-cable Weight Tests (isolated impact) r = +.90
2000s Marketing Mix Modeling Output (isolated impact) r = +.91
2000s Scanner Share Change (non-isolated impact) r = +.72
. . . (ARS Persuasion) predicts TV advertising‘s impact on market results at ~.90 level when the TV activity is isolated from other elements of the marketing
mix (about as high a relationship as possible, given sampling probability);
And at the ~.70 level within the context of other marketing activities (demonstrating the relative leverage of TV in the marketing mix, as well as the
precision of this consumer brand preference/choice methodology).
Source: ―Measuring and Improving the Return from TV Advertising (An Example),‖ MASB, April 2008

49
Note About Predictability, Reliability & Sensitivity (Precision)
What are the Financial Implications of Precision?
(ARS Persuasion) detects about 2 points as significant at the
90% level of confidence . . . and a 2 point difference in results
(airing just one ad) is associated with a .04 difference
in market share over a business quarter.
In a category with sales of say $500M per quarter
using just one ad scoring 2 points higher
returns ~$2M more in sales for the same media costs
and multiple ads return even more.
Source: ―Measuring and Improving the Return from TV Advertising (An Example),‖ MASB, April 2008
Copyright © 2010 MASB

50
Behavioral nature of methodology
Relevant (#1)
Objective (#3)
Simple (#7)
Systematic test-retest reliability process (ARSAR)
Reliable (#5)
Sensitive (#6)
Systematic validity process (ARSAV)
Predictive (#2)
Calibrated (#4)
Sensitive (#6)
On-going better practice insight process (BPI)
Causal (#8)
Documentation, publication, academic audits & collaboration
Transparent (#9)
Practices: Measurement Standards & Knowledge
Copyright © 2010 MASB

51
Process managed by ―Insight‖ research team
Continual search for ―drivers‖
Drivers are things that can be acted upon
As opposed to traditional use of ―diagnostics‖
Collaboration with Operations
Experiments to find additional drivers (hypothesis testing)
Collaboration with Marketing (inc Customer Service)
Listening for hypothesis generation
Summary & publication every other year or so
Journal publication of key learning (eg brand differentiation)
Better Practice Insight Process (BPI)
Copyright © 2010 MASB

Summary of Factors Affecting ARS Persuasion Scores
March 2005 & July 2007Documents
The ARS® Group
rsc THE QUALITY MEASUREMENT COMPANY
110 Walnut Street, Evansville, Indiana 47708
TEL: (812) 425-4562 FAX: (812) 425-2844
©2005 rsc. All rights reserved.
rsc service marks include, but are not limited to, the following: APM, ARS, the ARS logo, ARS Context, ARS StarBoard, ARS
WOWWW, ARS WOWWW CI, ARS Persuasion, ARSAR, C2C, CATS, Fair Share, Firstep, Outlook, PPD, Persuasion Points
Delivered, StarBoard, Television Preview, VOC, and Window On the World Wide Web. The ARS method, process, and
application/software for forecasting advertising's impact on sales (as determined by Market Mix Modeling output) are the
subject of one or more pending patents.
Excerpted with Permission

53Copyright © 2010 MASB
Outline
• Background & Objectives
• Design/Data Collection
• Analysis/Finding
• Business Implications (Better Practice Insight and ROI)
• Business Applications (Best Practice Tools)
• Frequently Asked Questions
• Additional Findings/Other Questions
• Future Investigations
• Study Data and Inclusion Criteria (Appendix)
Publication is ~156 pages and includes

MASBMASB
The several hundred conditions and elements explored over 3 decades explain 85
percent of the total variation in (ARS Persuasion) outcomes. . .
Market
Structure
51%
Value Proposition
19%
Unexplained
15%
Content & Communication
Drivers
8%
Sampling Error
7%
Total
Explained
85%
What Has Been Learned About TV Ads(Factors Explaining Effectiveness of TV Ads)
Source: ―Measuring and Improving the Return from TV Advertising (An Example)‖ MASB April 2008

55
Behavioral nature of methodology
Relevant (#1)
Objective (#3)
Simple (#7)
Systematic test-retest reliability process (ARSAR)
Reliable (#5)
Sensitive (#6)
Systematic validity process (ARSAV)
Predictive (#2)
Calibrated (#4)
Sensitive (#6)
On-going better practice insight process (BPI)
Causal (#8)
Documentation, publication, academic audits & collaboration
Transparent (#9)
Practices: Measurement Standards & Knowledge
Copyright © 2010 MASB

56
Stewart & Furse audit (1980‘s)
JP Jones audit (1990‘s)
MASB audit (2000‘s)
Hundreds of publications by multiple firm members
Dozens of journal papers
With customers (eg Adams, Schroiff)
With academics (eg Stewart, Furse, Jones, Pechman)
Transparency
Copyright © 2010 MASB

57
Disclosure (5): Management Changes
(These findings are) based on validation and causality audit results
regarding the (ARS Persuasion) Metric as of February 2006, with
updates provided to MASB in February 2008.
Significant changes in the company‘s management team occurred
shortly thereafter (2006 & 2008).
In light of the management changes, MASB recommends an
―intermittent audit‖ in order to ensure transparency and continuity
in provider‘s quality assurance programs.
Source: ―Measuring and Improving the Return from TV Advertising (An Example),‖ MASB, April 2008
Copyright © 2010 MASB

Marketing Accountability Standards Board of the Marketing Accountability Foundation
Thank you!