i5: data aggregation using areas, zones, interfaces, super areas ... · arrows to view other zones...
TRANSCRIPT

[email protected]://www.powerworld.com
2001 South First StreetChampaign, Illinois 61820+1 (217) 384.6330
2001 South First StreetChampaign, Illinois 61820+1 (217) 384.6330
Introduction to PowerWorld Simulator: Interface and Common Tools
I5: Data Aggregation using Areas, Zones, Interfaces, Super Areas,
Injection Groups
2© 2015 PowerWorld CorporationI5: Data Aggregation
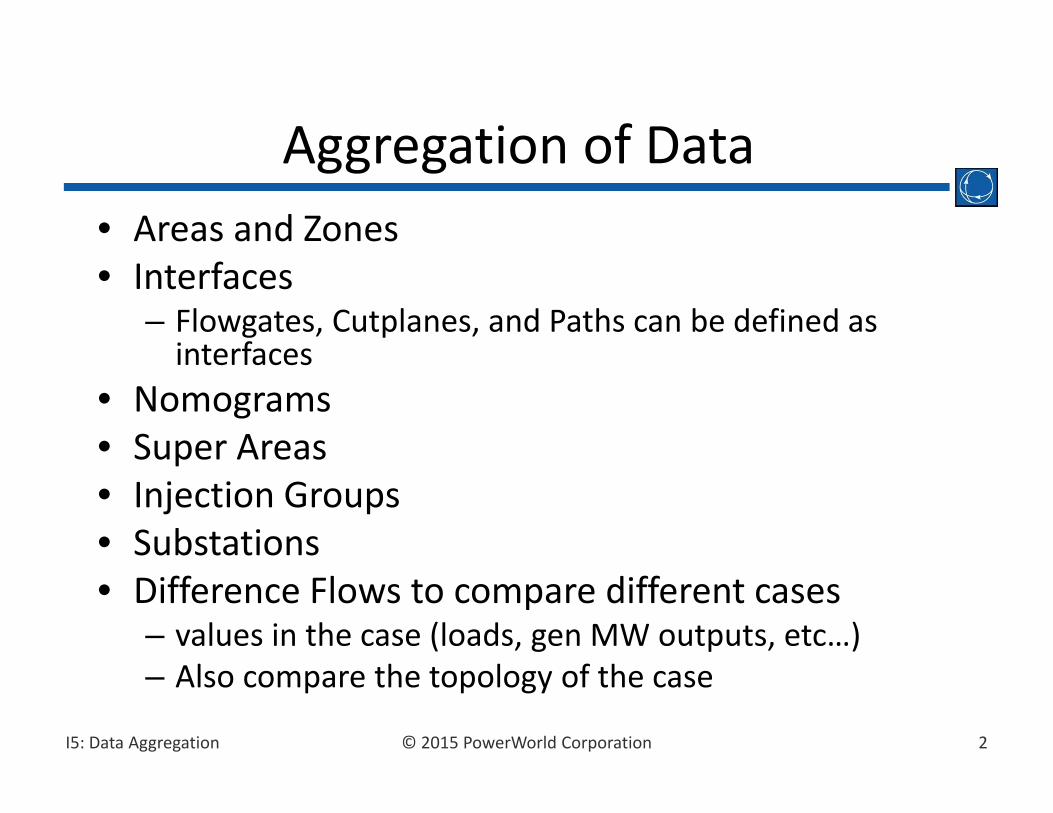
• Areas and Zones• Interfaces
– Flowgates, Cutplanes, and Paths can be defined as interfaces
• Nomograms• Super Areas• Injection Groups• Substations• Difference Flows to compare different cases
– values in the case (loads, gen MW outputs, etc…)– Also compare the topology of the case
Aggregation of Data
3© 2015 PowerWorld CorporationI5: Data Aggregation
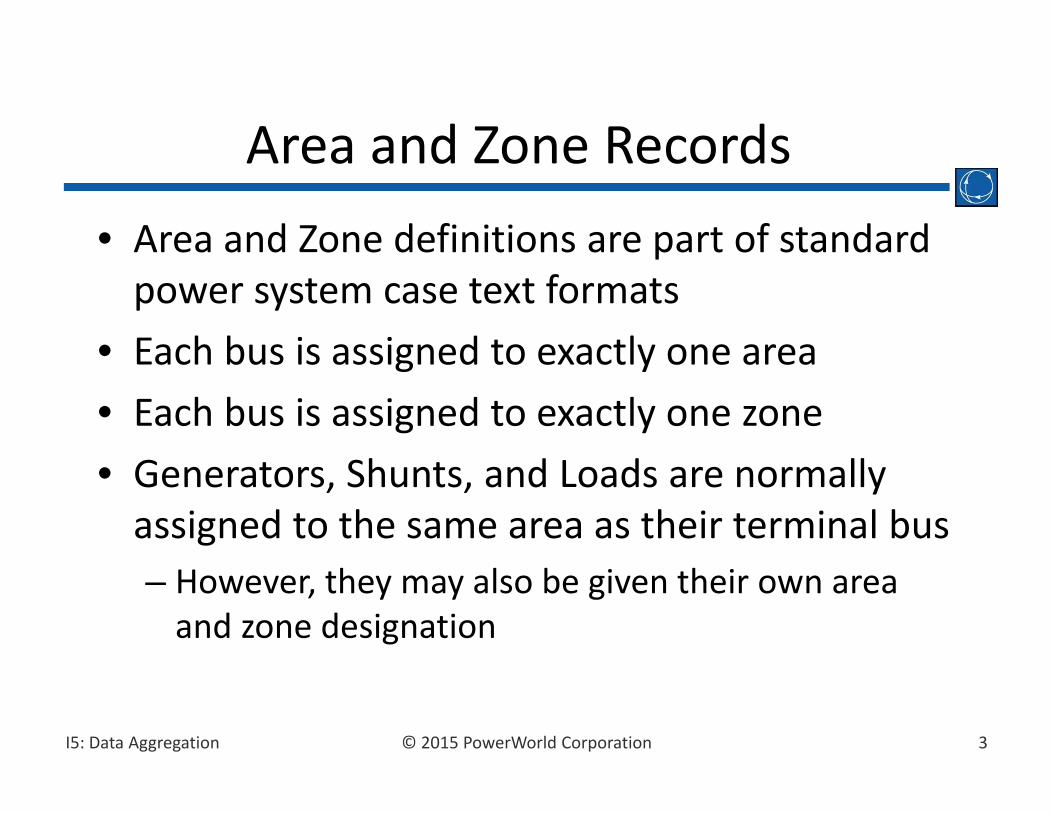
• Area and Zone definitions are part of standard power system case text formats
• Each bus is assigned to exactly one area• Each bus is assigned to exactly one zone• Generators, Shunts, and Loads are normally assigned to the same area as their terminal bus– However, they may also be given their own area and zone designation
Area and Zone Records

4© 2015 PowerWorld CorporationI5: Data Aggregation
• Areas and Zones do NOT have to be contiguous• Zones are often “sub‐areas”, but this is NOT required. They can overlap as shown below– Areas (thick lines)– Zones (shaded/nonshaded)– A single area may consist of multiple zones, while a single zone can include buses from multiple areas
Area and Zone Layouts
Area 1 Area 2Zone 1
Zone 2
5© 2015 PowerWorld CorporationI5: Data Aggregation
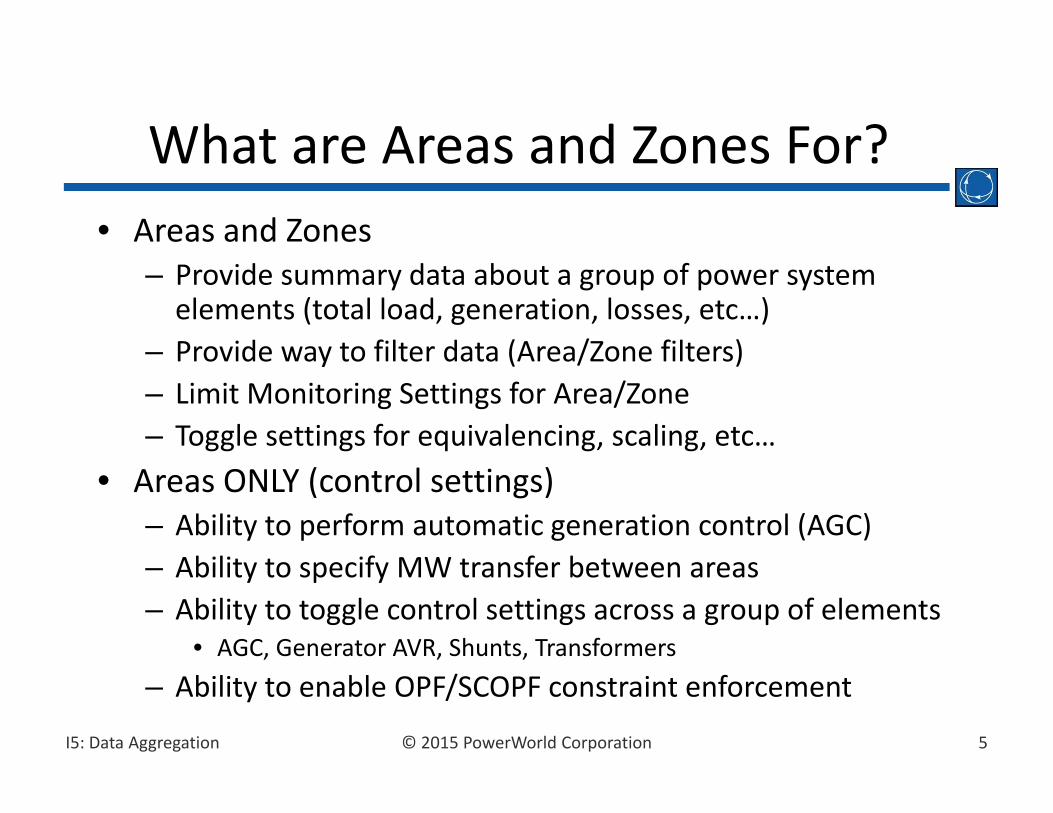
• Areas and Zones– Provide summary data about a group of power system elements (total load, generation, losses, etc…)
– Provide way to filter data (Area/Zone filters)– Limit Monitoring Settings for Area/Zone– Toggle settings for equivalencing, scaling, etc…
• Areas ONLY (control settings)– Ability to perform automatic generation control (AGC) – Ability to specify MW transfer between areas– Ability to toggle control settings across a group of elements
• AGC, Generator AVR, Shunts, Transformers– Ability to enable OPF/SCOPF constraint enforcement
What are Areas and Zones For?

6© 2015 PowerWorld CorporationI5: Data Aggregation
• To create a new Area or Zone– Make sure you’re in Edit Mode (for all methods)– Open Model Explorer and choose Network Buses or open the Bus Dialog and assign an existing bus to a new Area/Zone number; OR
– Select Insert… from the local menu (right‐click) in Area Records or Zone Records; OR
– Auxiliary files or Copy/Paste from Excel
Assigning Area and Zone Designations
Enter a new number to create a new Area

7© 2015 PowerWorld CorporationI5: Data Aggregation
Moving Bus Zones and Creating New Zones via the Zone Dialog
• Buses can be assigned individually to zones using the Bus dialog.
• Groups of buses can be moved to different zones using the Zone Information dialog.
• The Zone Information dialog is available by right‐clicking on the zone name on the Zone Records display.
Show ZoneInformation dialog
8© 2015 PowerWorld CorporationI5: Data Aggregation
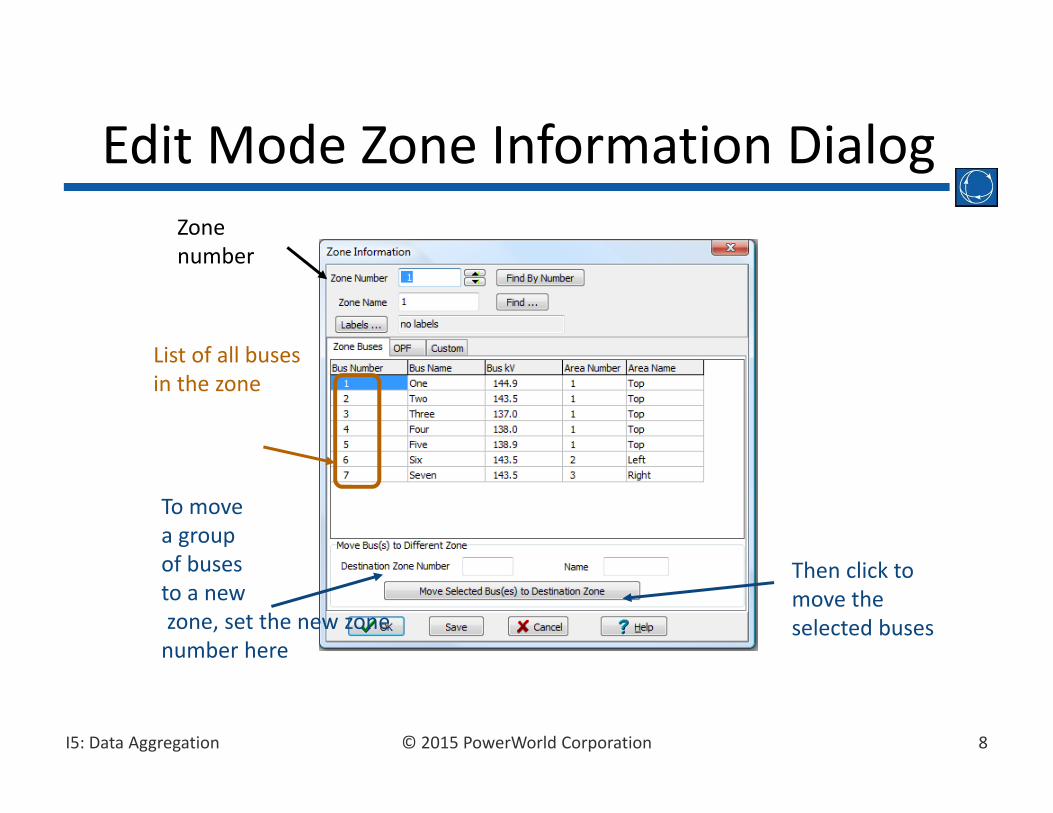
Edit Mode Zone Information DialogZonenumber
List of all buses in the zone
To movea groupof buses to a newzone, set the new zone number here
Then click to move the selected buses

9© 2015 PowerWorld CorporationI5: Data Aggregation
Run Mode Zone DialogUse combo box and/or arrows to view otherzones
Zones can have tie‐lines,but AGC on zones is not allowed
Tells range of AGC generation in zone
Can also set new zone numbers here

10© 2015 PowerWorld CorporationI5: Data Aggregation
• Interfaces are groupings of branches and sometimes other elements
• The sum of the flows on these elements can then be monitored in the analysis tools
• Common interfaces are the grouping of tie lines between areas, and groupings of lines between important parts of the system.
• Interfaces can be used to model several commonly described groupings of lines– Flowgates – term used in the Eastern United States– Cut‐Planes – term used in the Western United States– Paths – term used in the state of California– Nomograms – Used throughout the industry
Interface Definition

11© 2015 PowerWorld CorporationI5: Data Aggregation
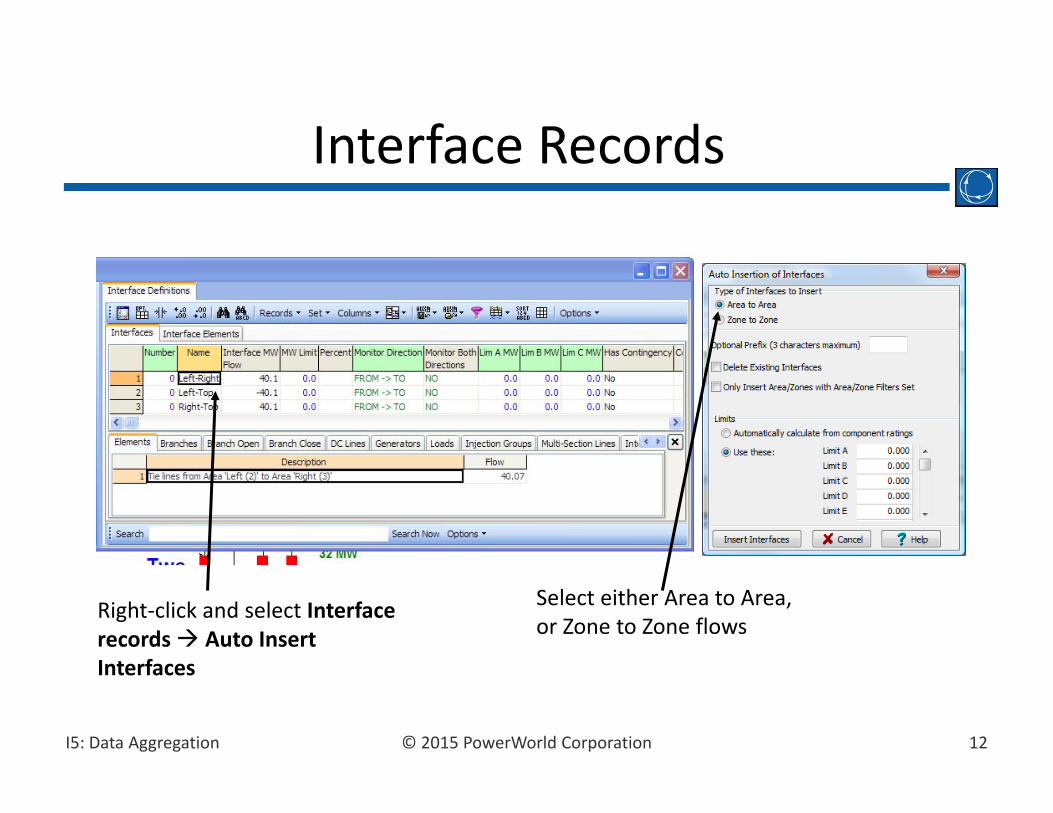
• Interface records can be used to show flows between areas and/or zones.
• Interface records showing area to area flows can be automatically inserted by– Open Model Explorer and choose Aggregations Interfaces to display interface records
– Select Interface records Auto Insert Interfaces from the local menu to display Auto Insertion of Interfaces Dialog
Interface Records
12© 2015 PowerWorld CorporationI5: Data Aggregation
Interface Records
Right‐click and select Interface records Auto Insert Interfaces
Select either Area to Area, or Zone to Zone flows

13© 2015 PowerWorld CorporationI5: Data Aggregation
• Open Model Explorer and choose Aggregations Interfaces to view the Interface display.
• Right‐click and select Insert to add a new interface.
• The Interface Dialog is shown.
• We’ll set up an interface showing flowon two parallel lines.
Defining Custom Interface Records
14© 2015 PowerWorld CorporationI5: Data Aggregation
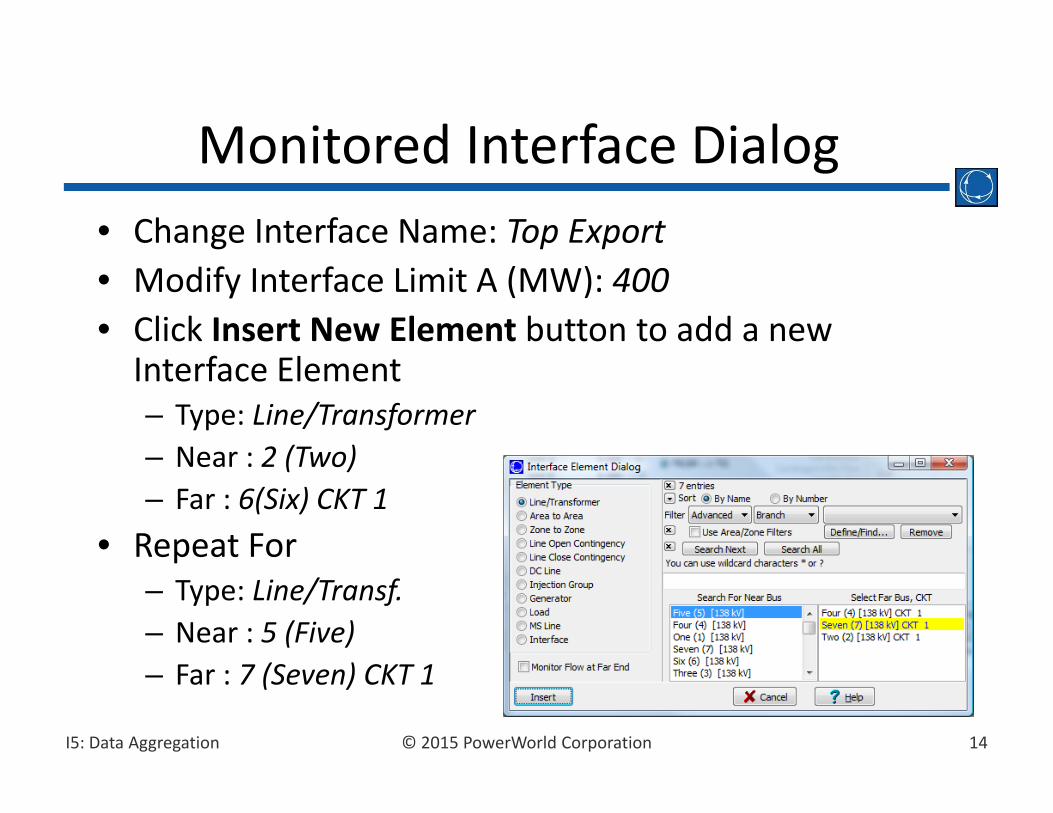
• Change Interface Name: Top Export• Modify Interface Limit A (MW): 400• Click Insert New Element button to add a new Interface Element– Type: Line/Transformer– Near : 2 (Two)– Far : 6(Six) CKT 1
• Repeat For– Type: Line/Transf.– Near : 5 (Five)– Far : 7 (Seven) CKT 1
Monitored Interface Dialog

15© 2015 PowerWorld CorporationI5: Data Aggregation
• Line/Transformer– Monitor the flows on a line (direction is important!)
• Area to Area, and Zone to Zone– Monitor the sum of the flows on all tie lines
• Line Open/Close Contingency– When defining these, it means that all monitoring on this interface is done after
this Line Open/Close contingency• DC Line
– Monitor the flow on a DC Line• Injection Group, Generator, Load
– Monitor the output of a group of generators or loads– Allows you to put a limit on the sum of outputs
• MS Line– Monitor the flow on a multi‐section line
• Interface– Monitor the flow/output of another interface– Be careful not to create circular references
Interface Element Type

16© 2015 PowerWorld CorporationI5: Data Aggregation
Monitored Interface Dialog
Interface Name
Use spin button to view other interfaces
Addor delete interfaces
Lists all elements in interface. Right‐Click and Choose Show Dialog to modify
Add a new elementto the interface
Set weighting of individual elements

17© 2015 PowerWorld CorporationI5: Data Aggregation
• Right‐click on the list of elements and choose Display/Column Options
• Add the columns Weighting and Pre‐Weight Flow
• This allows your interface to monitor the weighted sum of flows instead of the pure sum
• This will be used extensively with Nomogram Definitions
Interface Element Weightings

18© 2015 PowerWorld CorporationI5: Data Aggregation
• Nomograms allow definition of 2‐dimensional limit spaces using 2 interfaces
Nomograms
Nomogram Breakpoints
19© 2015 PowerWorld CorporationI5: Data Aggregation
• Open Model Explorer and choose AggregationsNomograms to bring up a list of Nomograms
• Right‐click and choose Insert… to bring up the Nomogram Dialog for adding a new Nomogram
• A nomogram is defined by– Interface A– Interface B– A set of breakpoints
• Breakpoints MUST create a “convex” region
• Nomogram limits can be used in ATC, contingency analysis, and OPF/SCOPF
Nomograms

20© 2015 PowerWorld CorporationI5: Data Aggregation
Nomogram Dialog
Define Interface A
Define Interface B
Specify Breakpoints
graphical representation of the breakpoints; operating region may span 4 quadrants
Interfaces are defined the same as before
21© 2015 PowerWorld CorporationI5: Data Aggregation
Nomogram Interfaces
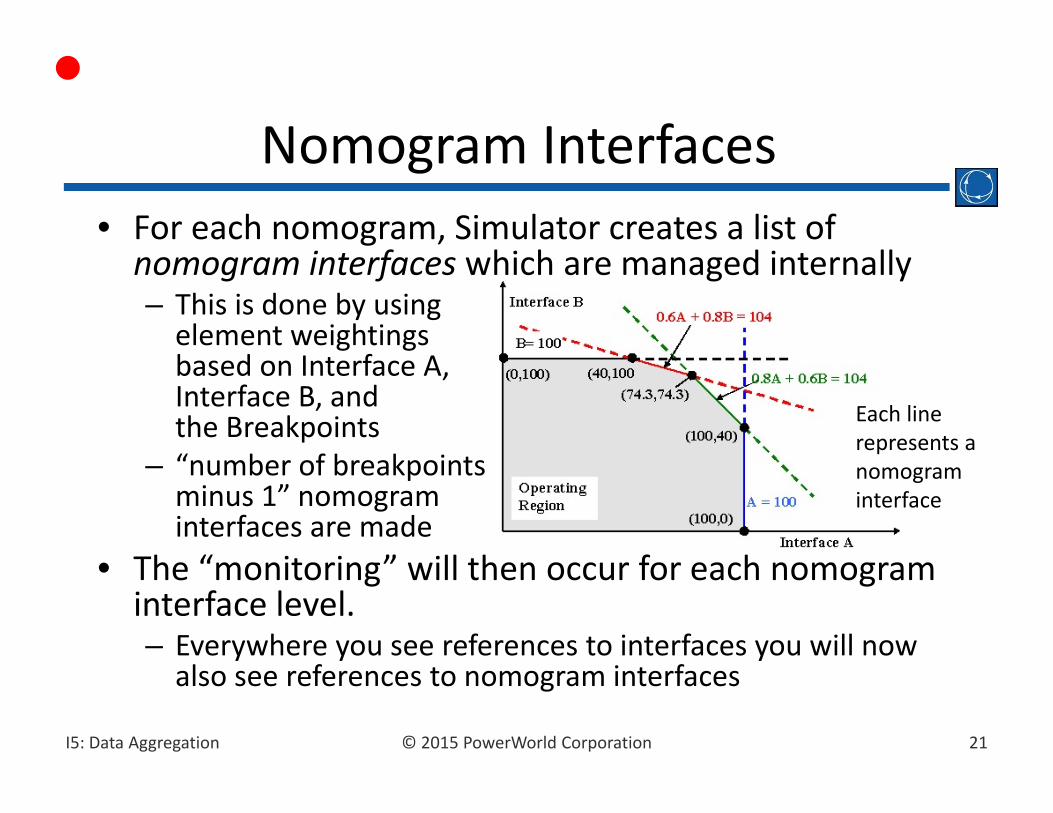
Each line represents a nomograminterface
• For each nomogram, Simulator creates a list of nomogram interfaces which are managed internally – This is done by using element weightings based on Interface A, Interface B, and the Breakpoints
– “number of breakpoints minus 1” nomograminterfaces are made
• The “monitoring” will then occur for each nomograminterface level. – Everywhere you see references to interfaces you will now also see references to nomogram interfaces
22© 2015 PowerWorld CorporationI5: Data Aggregation
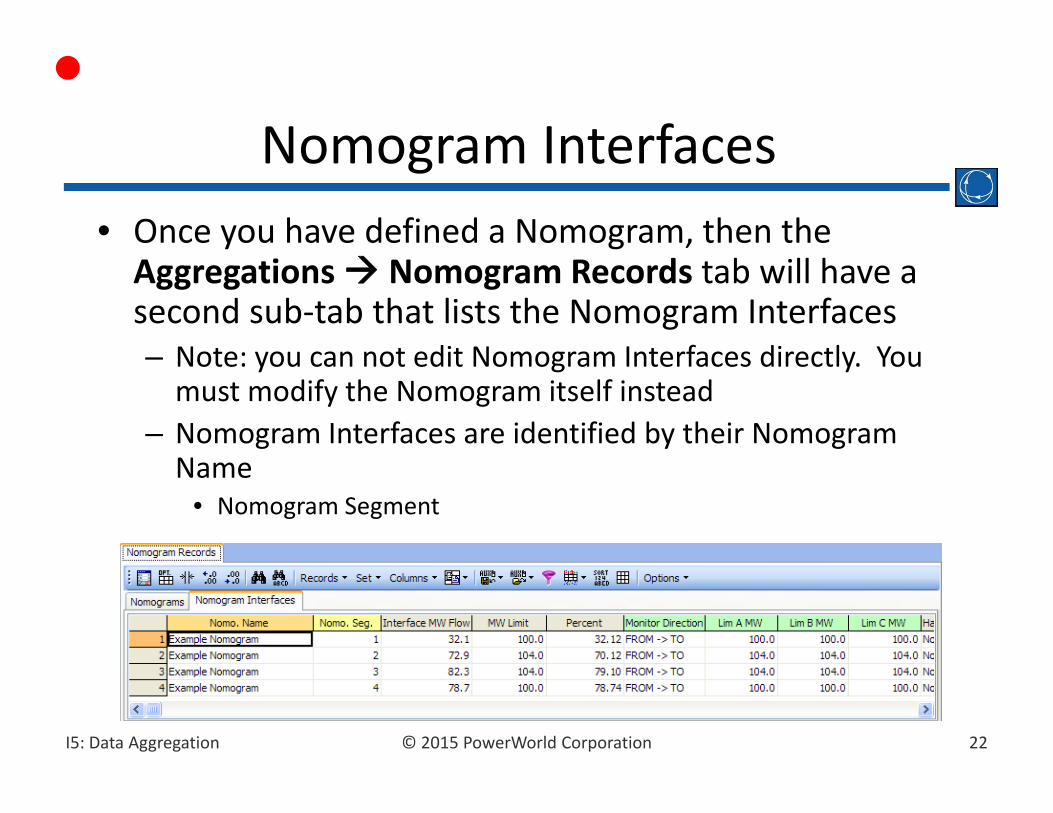
• Once you have defined a Nomogram, then the Aggregations Nomogram Records tab will have a second sub‐tab that lists the Nomogram Interfaces– Note: you can not edit Nomogram Interfaces directly. You must modify the Nomogram itself instead
– Nomogram Interfaces are identified by their Nomogram Name
• Nomogram Segment
Nomogram Interfaces

23© 2015 PowerWorld CorporationI5: Data Aggregation
• Oneline diagrams traditionally contain information regarding individual power system elements (buses, lines, generators, etc…)
• Simulator also allows you to create diagrams based off the aggregate data objects
Area/Zone/InterfaceOneline Graphics

24© 2015 PowerWorld CorporationI5: Data Aggregation
• Area fields can be added to onelines to show a number of area fields.
• Area fields can also be used to specify base transactions.
• Area fields are inserted in Edit Mode from the Draw ribbon tab, choosing Field Area Field
• By default, area fields are linked to the area associated with the closest bus on the oneline.
Area Fields

25© 2015 PowerWorld CorporationI5: Data Aggregation
Area Field DialogUse combobox to selectan area orentire case
Anchor the field to the area object so that both can be moved together; include units suffix
OtherAreaNumberRequired for certainfield types
AGC Status can be toggled on the oneline
Area number 0 (zero) represents the whole system!
26© 2015 PowerWorld CorporationI5: Data Aggregation
• Add several area fields to the B7FLAT case– Area Name– Area MW Flow to Other Area (or case)– Scheduled Flow to Other Area– Load Schedule Multiplier– AGC Status
Area Field Example

27© 2015 PowerWorld CorporationI5: Data Aggregation
B7FLAT with Area Fields
Text fields
Area fieldsLeft‐clickto toggle AGC in Run Mode
ScheduledMW flows

28© 2015 PowerWorld CorporationI5: Data Aggregation
• Separate oneline object types for Areas, Zones, and Super Areas
• On B7FLAT case– From the File Menu, select New Oneline to make a new oneline
– Add area objects for each of three areas– From the File Menu, select Save Oneline to save the oneline. Use b7flata for the name.
• Zone and Super Area objects are similar
Area, Zone, and Super Area Objects

29© 2015 PowerWorld CorporationI5: Data Aggregation
B7FLATA DisplayRight‐click on object, then select Information Dialog… for the Area Display Options
Same procedure for zones or super areas

30© 2015 PowerWorld CorporationI5: Data Aggregation
• Similar to the Bus Palette, you can also bring up an Area or Zone Palette– On the Draw ribbon tab, select Show Insert Palette For Zones (or Areas)
Area or Zone Palette
31© 2015 PowerWorld CorporationI5: Data Aggregation
• Several types of objects are used to display interface data on the oneline– Interface Objects: like transmission lines– Interface Fields: like line fields– Interface Pie Charts: like line flow pie charts
Interface Fields
32© 2015 PowerWorld CorporationI5: Data Aggregation
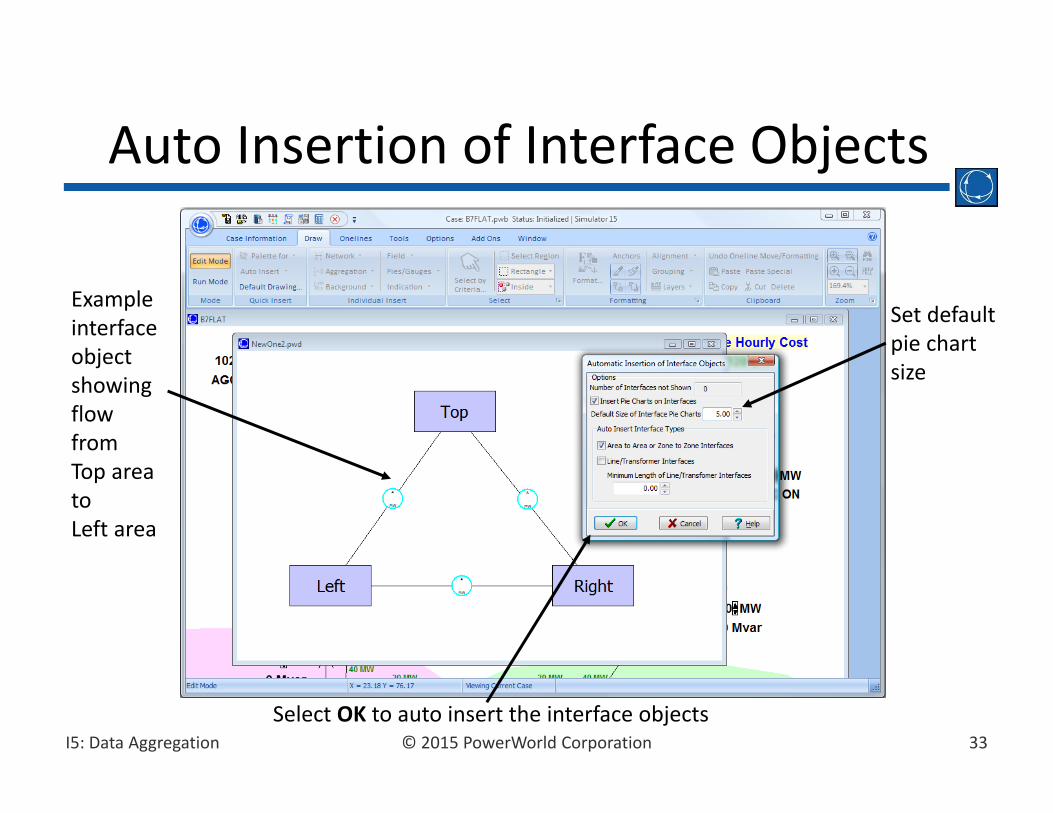
• Interface objects can be auto inserted (just like line objects).
• In edit mode, from the Draw ribbon tab, select Auto Insert Interfaces.
• Allows insertion of interfaces and pie charts.• Interfaces are automatically anchored to area/zone objects.
Auto Insertion of Interface Objects
33© 2015 PowerWorld CorporationI5: Data Aggregation
Auto Insertion of Interface Objects
Set defaultpie chartsize
Exampleinterfaceobjectshowingflowfrom Top areatoLeft area
Select OK to auto insert the interface objects
34© 2015 PowerWorld CorporationI5: Data Aggregation
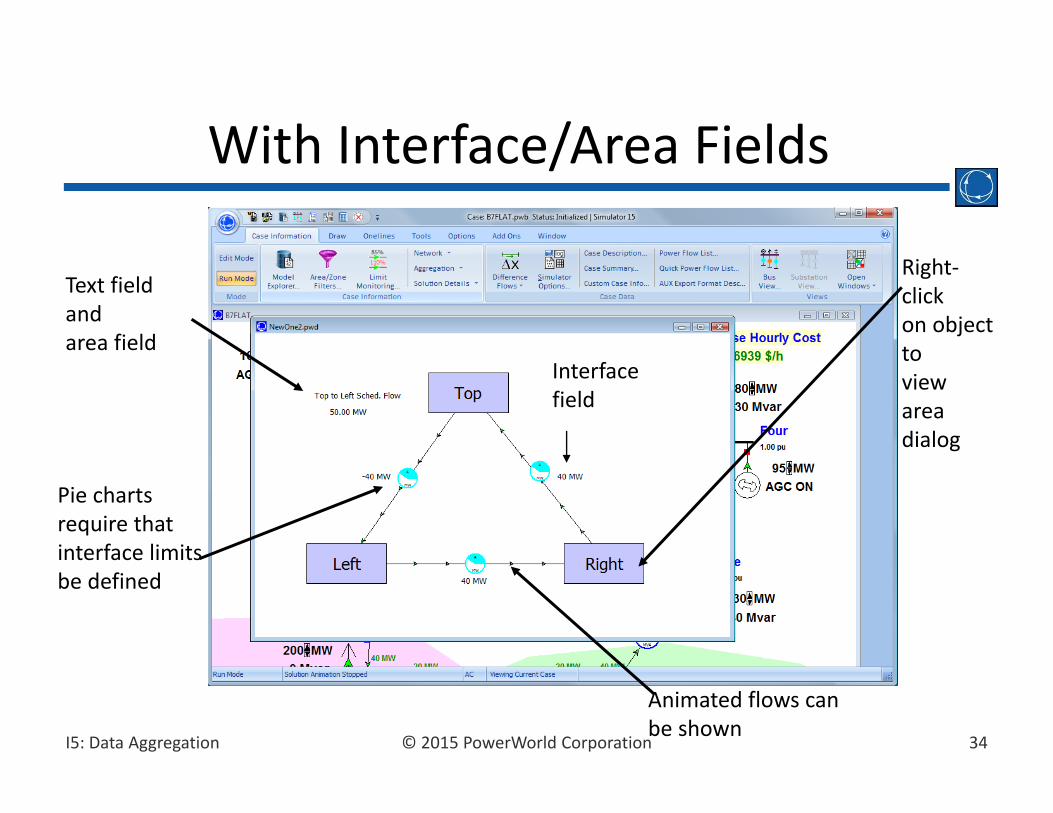
With Interface/Area Fields
Pie charts require that interface limits be defined
Interfacefield
Animated flows canbe shown
Text fieldand area field
Right‐clickon object to viewareadialog
35© 2015 PowerWorld CorporationI5: Data Aggregation
• Super areas are groupings of individual areas; analogous to an area being a grouping of individual buses
• Super areas can be used to control several areas together
• Open Model Explorer and choose Aggregations Super Areas to see the Super Area Records– Right‐click and select Insert…– Super Area Dialog is displayed with default name assigned to the new super area
Super Areas

36© 2015 PowerWorld CorporationI5: Data Aggregation
Super Area Dialog
Add by nameor add bynumbers
Areas alreadyincluded
Control forSuper Area;this controloverrides allindividual areacontrol settingsunless on No SuperArea Control
37© 2015 PowerWorld CorporationI5: Data Aggregation
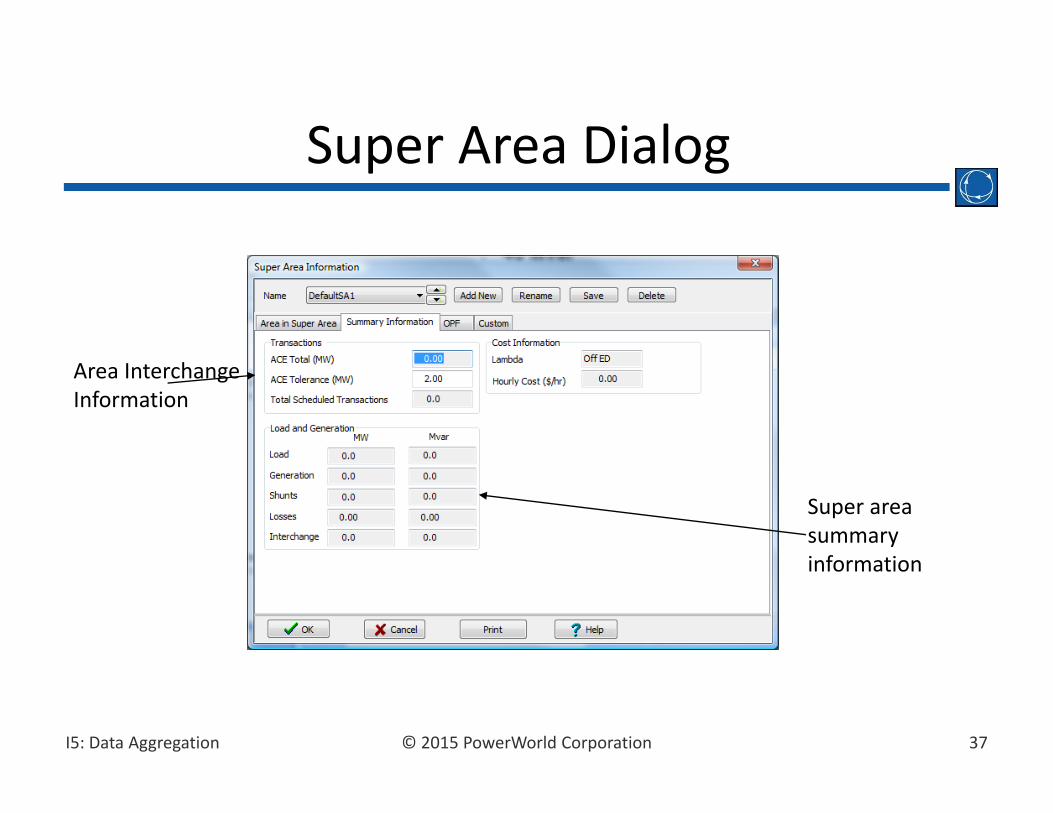
Super Area Dialog
Area InterchangeInformation
Super area summary information
38© 2015 PowerWorld CorporationI5: Data Aggregation
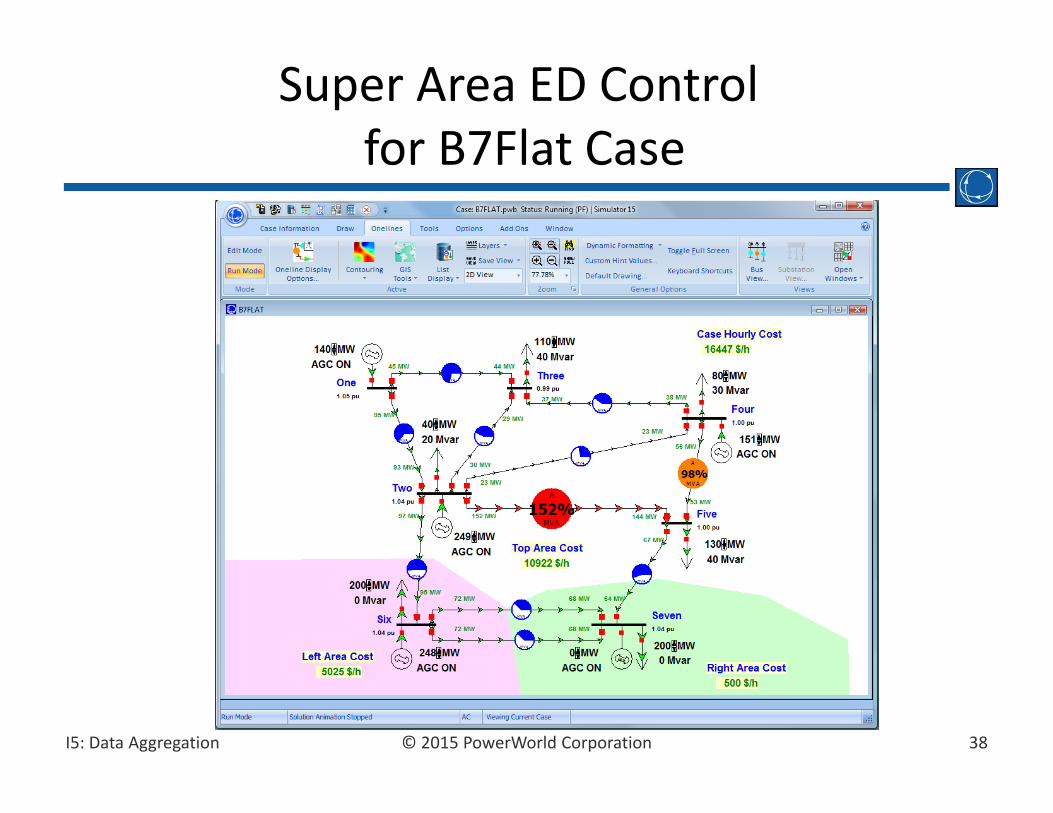
Super Area ED Controlfor B7Flat Case

39© 2015 PowerWorld CorporationI5: Data Aggregation
• Represents grouping of injections of power– Loads– Generators– Switched Shunts– Other Injection Groups (be careful of circular references)
• Useful for defining more specific groups of sources and sinks in many tools– Especially useful for ATC, PVQV tools; also for Sensitivities (PTDF, TLR, etc…)
– Also useful for general reporting, e.g. make an aggregation of generators and show the sum of their output
Injection Groups

40© 2015 PowerWorld CorporationI5: Data Aggregation
• Open Model Explorer and choose Aggregations Injection Groups– Right‐click, select Insert…– Injection Groups Dialog is displayed with default name assigned to the new injection group
– Right‐click in the Participation Points grid and Insert elements into the injection group or click Insert Points
• Auto Insertion also available from the local menu in Model Explorer
Injection Groups
41© 2015 PowerWorld CorporationI5: Data Aggregation
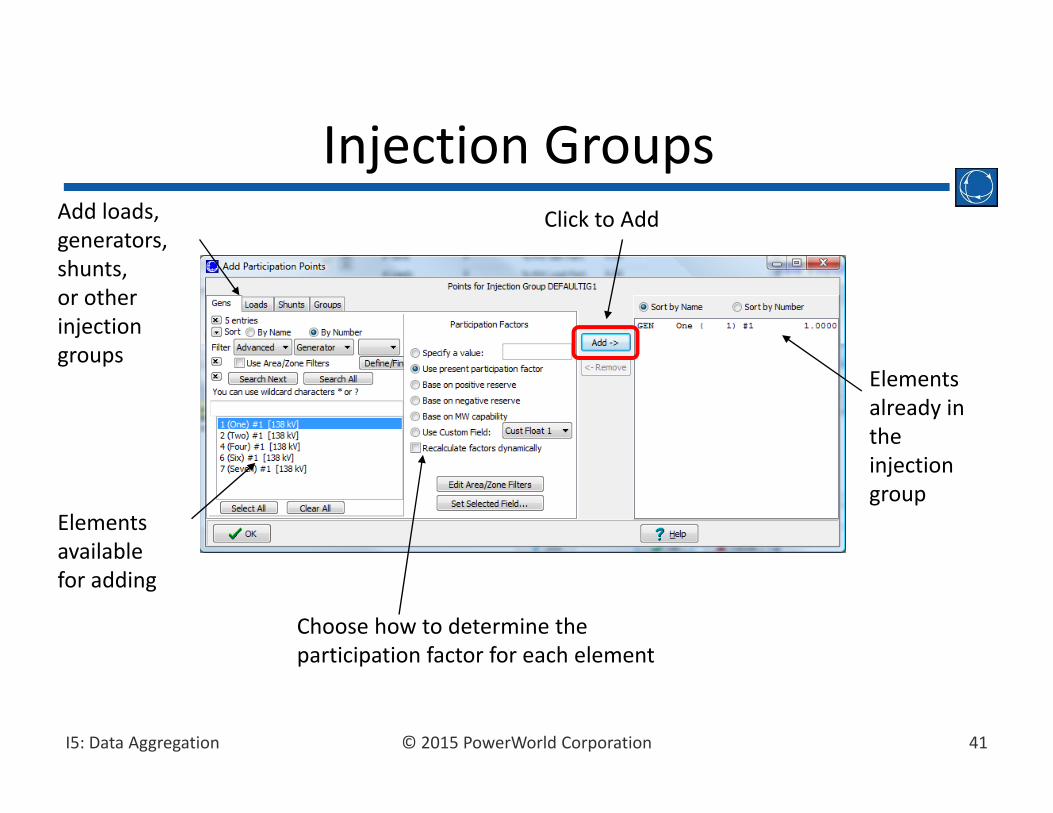
Injection GroupsAdd loads,generators,shunts,or otherinjectiongroups
Elementsavailablefor adding
Choose how to determine theparticipation factor for each element
Elementsalready inthe injectiongroup
Click to Add

42© 2015 PowerWorld CorporationI5: Data Aggregation
• Injection Groups are made up of “Participation Points” which have two main attributes– Reference to a generator, load, switched shunt, or another injection group
– Participation factor• Note: this participation factor is independent of the generator object’s participation factor
• When you create a participation point, you can define the initial participation factor for the point using various methods.– This is depicted on the following slide
Injection GroupParticipation Points
43© 2015 PowerWorld CorporationI5: Data Aggregation
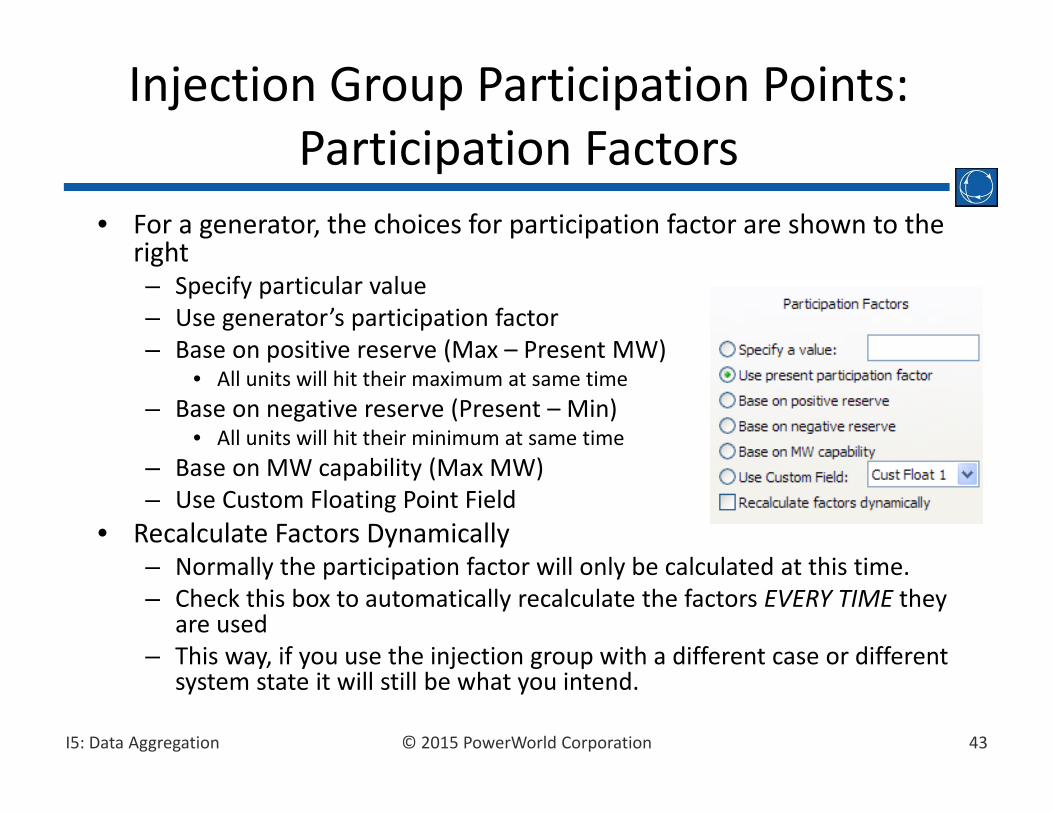
• For a generator, the choices for participation factor are shown to the right– Specify particular value– Use generator’s participation factor– Base on positive reserve (Max – Present MW)
• All units will hit their maximum at same time– Base on negative reserve (Present – Min)
• All units will hit their minimum at same time– Base on MW capability (Max MW)– Use Custom Floating Point Field
• Recalculate Factors Dynamically– Normally the participation factor will only be calculated at this time. – Check this box to automatically recalculate the factors EVERY TIME they
are used– This way, if you use the injection group with a different case or different
system state it will still be what you intend.
Injection Group Participation Points:Participation Factors

44© 2015 PowerWorld CorporationI5: Data Aggregation
• You can also insert display objects which represent Injection Groups
• On the Draw ribbon tab, choose Aggregation Injection Group
• Click on the oneline where you would like to place the injection group
• Display objects show the generation and load which exist inside the group
Injection Group Display Objects
Generators767.94 MW
360.00 MW

45© 2015 PowerWorld CorporationI5: Data Aggregation
• Some substations in a power system have a large number of buses in them– Large power stations – Other important places in a power system
• Traditional Power System Cases do not have any reference to which “substation” a bus is inside.
• Simulator allows you to define this relationship and then create substation‐based diagrams
Substations
COULEE
COULEE
COULEE&1
COULEE
COULEE&2
COULEE&3
COULEE&4
COULEE19
COULEE&1
COULEE20
COULEE&A
COULEE21
COULEE22
COULEE23COULEE24
COULEE&2
COULEE&B
COULEE&C
COULEES1
COULEES2COULEES3
COUL2GPD
95%
95% 94%
93%
670 MW
46 MVR
670 MW 46 MVR
0 MW 0 MVR
777 MW 58 MVR
770 MW 57 MVR 0 MW
0 MVR
COULE 15
COULE 69
COULE AD
COULE EJ
110 MW 4 MVR
110 MW 4 MVR
110 MW 4 MVR
110 MW 4 MVR
110 MW 4 MVR
107 MW 5 MVR
107 MW 5 MVR
107 MW 5 MVR
107 MW 5 MVR
107 MW 10 MVR
107 MW 10 MVR
0 MW 0 MVR
0 MW 0 MVR
0 MW
0 MVR
0 MW 0 MVR
0 MW 0 MVR
0 MW 0 MVR
0 MW 0 MVR
98% 98% 98% 92%
90% 90%
Grand Coulee 500 Kv Switchyard
27 500kV
27 Grand Coulee Buses are placed in a single substation

46© 2015 PowerWorld CorporationI5: Data Aggregation
• To create a new Substation– Make sure you’re in Edit Mode (for all methods)– Open Network Buses in the Model Explorer or open the Bus Dialog and assign an existing bus to a new Substation number; OR
– Select Insert… from the local menu (right‐click) in Substation Records; OR
– Auxiliary files or Copy/Paste from Excel
Creating Substations
Enter a new number to create a new Substation
47© 2015 PowerWorld CorporationI5: Data Aggregation
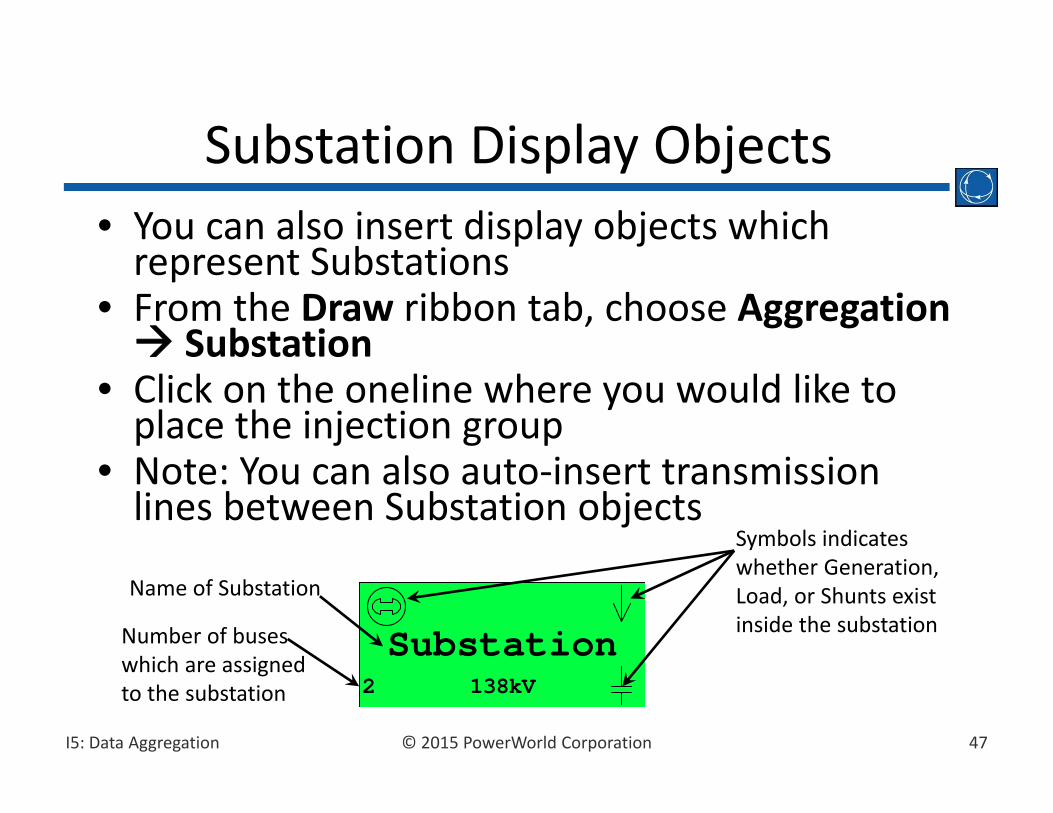
• You can also insert display objects which represent Substations
• From the Draw ribbon tab, choose Aggregation Substation
• Click on the oneline where you would like to place the injection group
• Note: You can also auto‐insert transmission lines between Substation objects
Substation Display Objects
Substation2 138kV
Symbols indicates whether Generation, Load, or Shunts exist inside the substationNumber of buses
which are assigned to the substation
Name of Substation
48© 2015 PowerWorld CorporationI5: Data Aggregation
• Simulator allows two different power system cases to be simultaneously loaded– Present Case– Base Case
• Difference flows allow viewing of either case or of the differences between the cases
• Changes in status are shown using OPEN/CLOSED fields (present case status listed first)
Difference Flows
49© 2015 PowerWorld CorporationI5: Data Aggregation
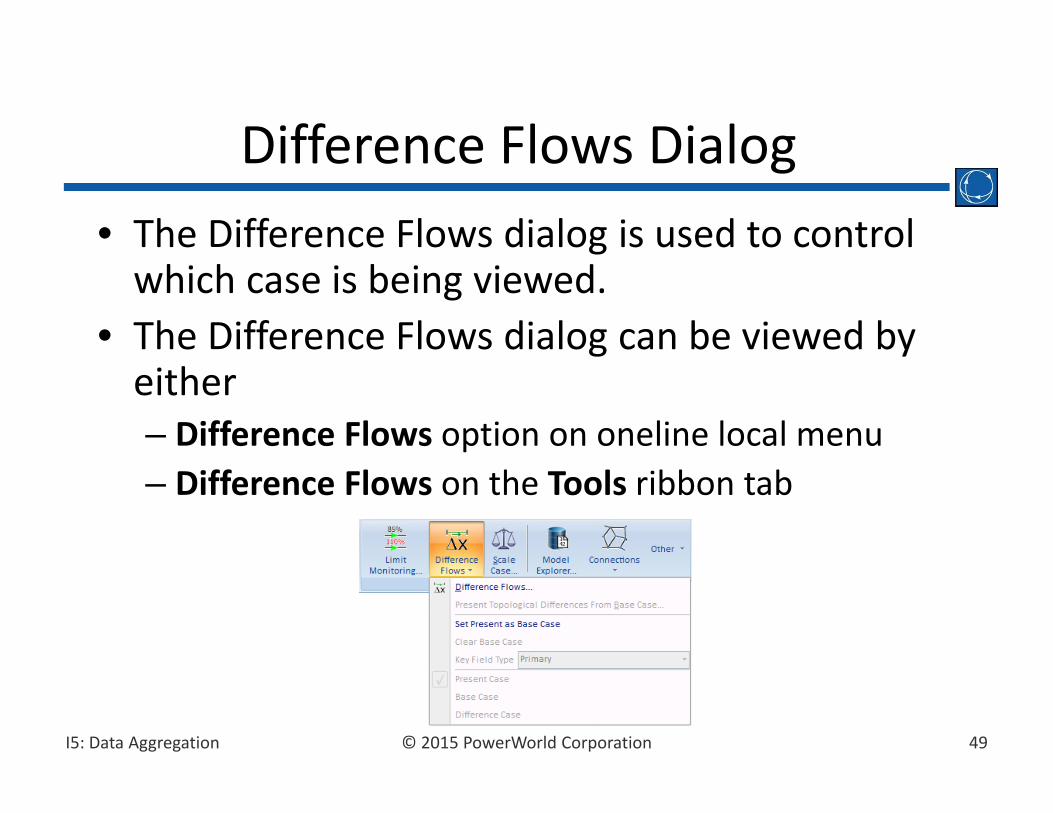
• The Difference Flows dialog is used to control which case is being viewed.
• The Difference Flows dialog can be viewed by either– Difference Flows option on oneline local menu– Difference Flows on the Tools ribbon tab
Difference Flows Dialog
50© 2015 PowerWorld CorporationI5: Data Aggregation
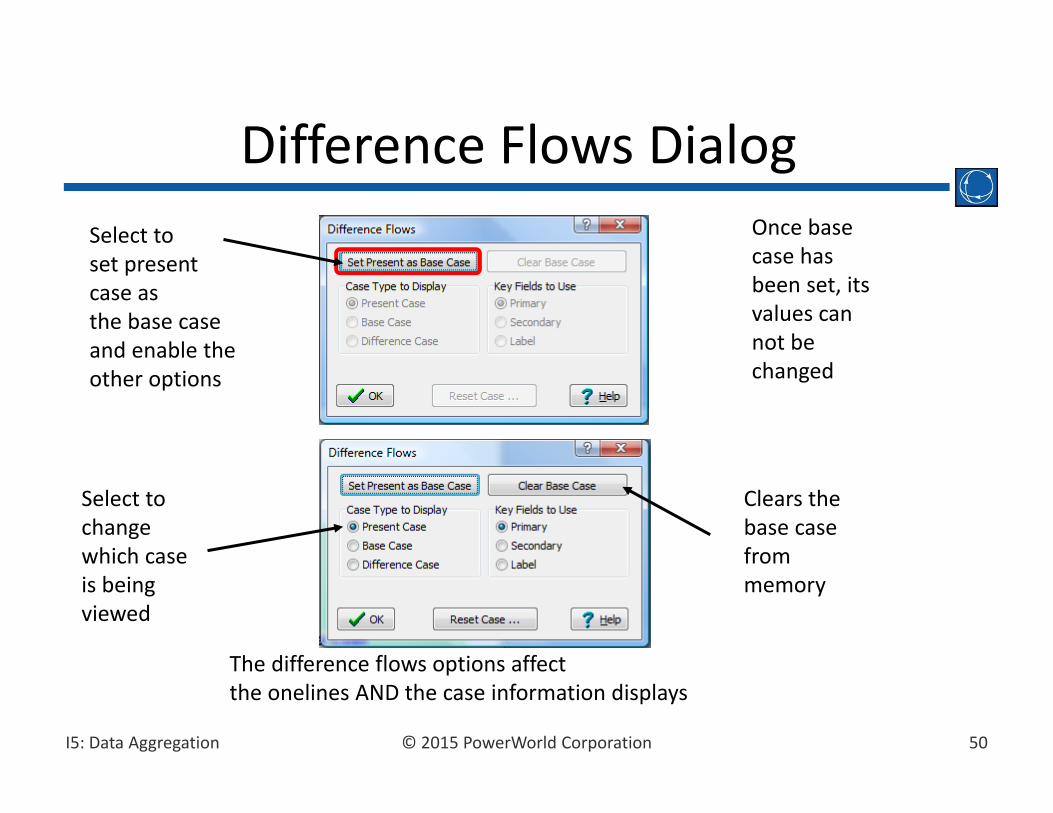
Difference Flows DialogSelect toset presentcase asthe base case and enable the other options
Clears thebase casefrom memory
Select tochangewhich caseis beingviewed
The difference flows options affectthe onelines AND the case information displays
Once basecase hasbeen set, itsvalues cannot bechanged
51© 2015 PowerWorld CorporationI5: Data Aggregation
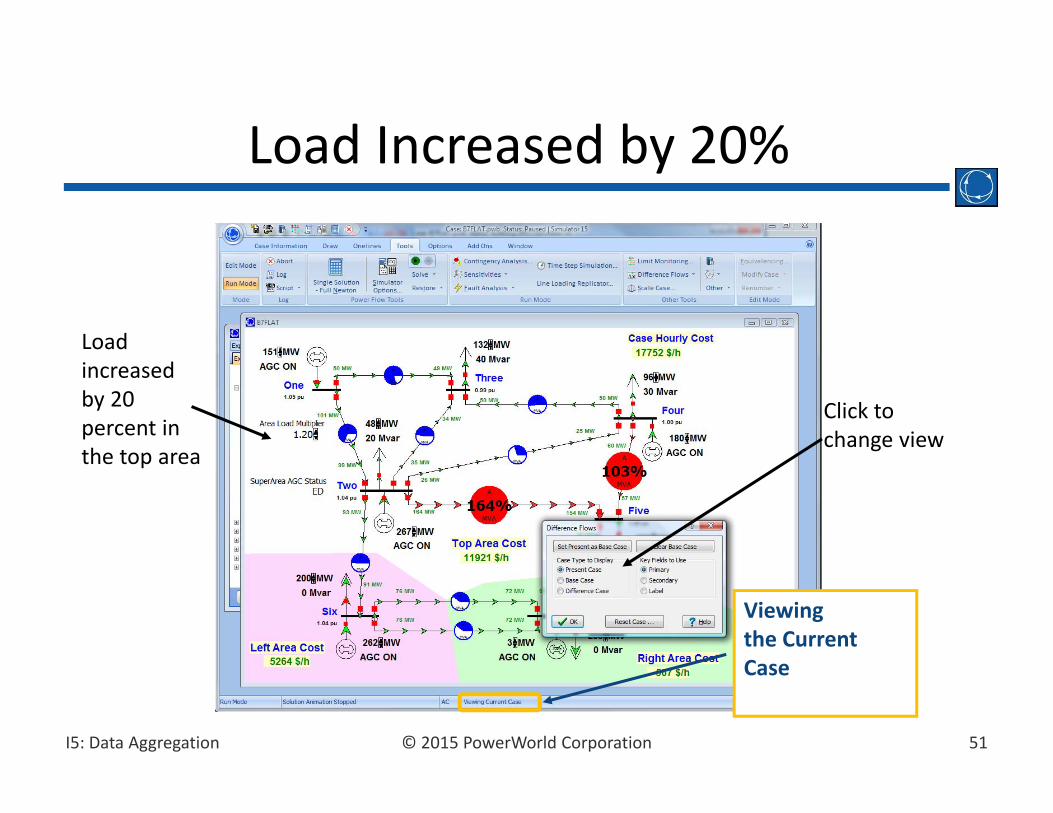
Load Increased by 20%
Viewing the CurrentCase
Load increased by 20 percent in the top area
Click to change view

52© 2015 PowerWorld CorporationI5: Data Aggregation
Difference Flows
Viewing the DifferenceCase
All fields now show the differencebetween the present case and the base case
CaseInformationDisplaysalso showdifferences
You can NOT change values in the difference mode!
53© 2015 PowerWorld CorporationI5: Data Aggregation
• Simulator only allows one case to be open at a time.
• When you open a case, all information about the previously opened case is removed, with one exception– The Difference flows information is kept
• Thus to compare two cases, you– Open case #1, and go to Run Mode– Open Difference Flows and choose Set Present as Base Case
– Open case #2– Open Difference Flows and change to Difference Case
Comparing Two Different Case Files
54© 2015 PowerWorld CorporationI5: Data Aggregation
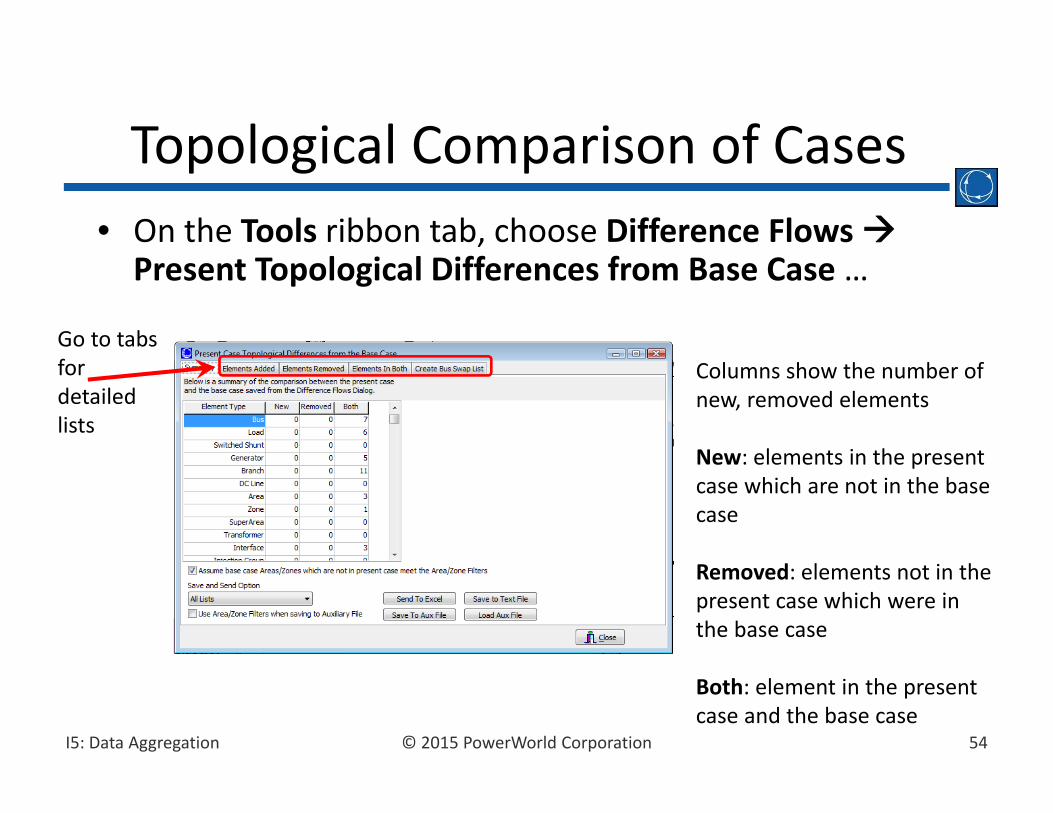
• On the Tools ribbon tab, choose Difference Flows Present Topological Differences from Base Case …
Topological Comparison of Cases
Columns show the number of new, removed elements
New: elements in the present case which are not in the base case
Removed: elements not in the present case which were in the base case
Both: element in the present case and the base case
Go to tabs for detailed lists
55© 2015 PowerWorld CorporationI5: Data Aggregation
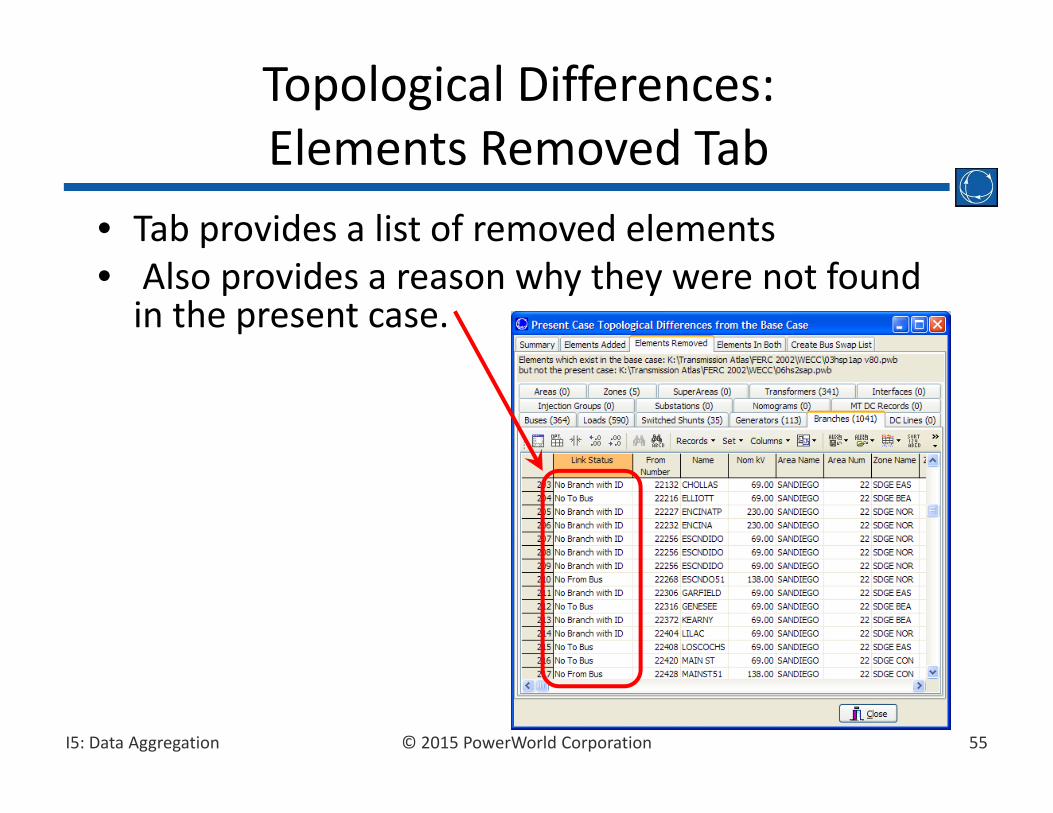
• Tab provides a list of removed elements• Also provides a reason why they were not found in the present case.
Topological Differences:Elements Removed Tab

Blank Page