ict in serbia - vojvodinaictcluster.org · ict in serbia - at a glance published by: vojvodina ict...
TRANSCRIPT

ICT in SerbiaAt a Glance2015
www.vojvodinaICTcluster.org


ICT in Serbia - At a Glance

ICT in Serbia - At a GlancePublished by:Vojvodina ICT Cluster
In cooperation with:GIZ, Provincial Secretariat for Science and Technology & Provincial Secretariat for Economy, Employment and Gender Equality
Supported by:ICT Network,NiCAT & ICT CS
Authors:Milovan Matijević, Milan Šolaja
Editor:Jürgen [email protected]
Design/Layout: Ivan Cosic & Snezana Vukmirovic, Plain&Hill
Contact info:[email protected]@mineco.rs
CIP - Каталогизација у публикацији Библиотека Матице српске, Нови Сад 004(497.11)MATIJEVIĆ, Milovan ICT in Serbia : at a glance : 2015 / [authors Milovan Matijević, Milan Šolaja]. - Novi Sad : Vojvodina ICT Cluster, 2015 (Novi Sad : PRESSNS). - 88 str. : ilustr. ; 25 cm Tiraž 1.000. - Bibliografija.ISBN 978-86-918957-0-9 1. Šolaja, Milan [аутор] a) Информационе технологије - Србија COBISS.SR-ID 297246727

ICT in Serbia - At a Glance // 2015
6
Hello world! ................................................................................................8
Vojvodina ICT Cluster – VOICT ................................................................9
GIZ - An innovative partner for the global challenges of tomorrow ...................................................... 10
Introduction ............................................................................................. 12
General business environment ............................................................. 14
ASSESSMENT OF THE SERBIAN ICT SECTOR ................................ 24
2.1. ICT MARKET - STATISTICAL OVERVIEW ............................. 27
2.1.1. IT Market Value and Structure ...................................... 28
2.1.2. IT and Internet Usage...................................................... 31
2.1.3. Overview of the Telecommunication Market ............. 33
2.2. ICT INDUSTRY – SECTOR ANALYSIS .................................... 35
2.2.1. ICT Industry Summary ................................................... 35
2.2.2. IT Industry and Software sub-sector ........................... 37
2.2.3. ICT Clusters and Support Organizations ....................43
2.3. EDUCATION AND HUMAN RESOURCE DEVELOPMENT... 47
2.3.2. ICT and Higher Education ..............................................48
2.4. RESEARCH AND DEVELOPMENT ..........................................53
2.4.1. Current Situation Regarding R&D in Serbia - in General and ICT Related ......................... 53
2.4.2. EU Support Dimension ................................................... 60
Table of Contents

7
ICT in Serbia - At a Glance // 2015
SOFTWARE SECTOR –OPPORTUNITIES ON INTERNATIONAL MARKET ................................................................... 63
3.1. SOFTWARE EXPORT SECTOR - CURRENT SITUATION .... 63
3.1.1. Who Are the Software exporters in Serbia? ..............64
3.1.2. Added Value in the Serbian IT Industry ....................... 66
3.2. SOFTWARE EXPORT SECTOR - TREND AND POTENTIAL 67
3.2.1. Workforce Trend and Potential ..................................... 67
3.2.2. Market Trend and Potential ............................................ 68
3.2.3. Outsourcing Sector - Trend and Potential ................... 70
3.2.4. Potentials - Standardisation of Serbian IT companies ..................................................... 71
3.3. OUTSOURCING – Opportunities and Barriers for Serbian IT Companies ........................................................77
APPENDIX ............................................................................................. 80
Terminology ........................................................................................ 80
Abbreviations......................................................................................84
References and Key ICT Publications .......................................... 86

ICT in Serbia - At a Glance // 2015
8
FOREWORD
HELLO WORLD!After a lot of anticipation, following huge demand from various stakeholders, here is the new and updated edition of ICT in Serbia – At a Glance. Once more we had help from our friends at Deutsche Gesellschaft für Internationale Zusammenarbeit (GIZ) GmbH, but this time they were joined by the two instiitutions of the Autonomous Province of Vojvodina- Secretariat for Science andTechnology, and Secretariat for Economy, Employment and Gender Equality. We thank them heartily for making this edition possible!
Vojvodina ICT Cluster is in its fifth year of operation (time really flies!) and we can happily report that the Serbian information technology landscape has advanced. ICT is the healthiest sector of the economy, and setting sights at bigger goals. Today IT is in the center of public attention in Serbia as the sector with huge employment capacities and potential for scalable income. However, public awareness is one thing while systemic support, which is needed to advance the sector further, is still quite another.
Such advancement of IT would be extremely beneficial for the rest of the Serbian economy which urgently needs IT solutions to increase competitiveness. Furthermore, including other sectors in development of IT solutions is another avenue to explore. The Serbian gaming industry is showing the way to do just that, while more opportunities and niche markets are hidden, waiting to be discovered.
In the meantime, we do not let our long-term goal out of sight: Serbia as the location of choice for development of sophisticated software and the hotbed of regional IT. We are joining forces with other players and in 2012 a strategic partnership was created among three IT clusters in Serbia – Vojvodina ICT Cluster, ICT Network, and NiCAT. As of 2014, another cluster, ICT Cluster of Central Serbia, was established and has joined this alliance. Also in 2014, Serbian IT clusters participated in foundation of the Balkan and Black Sea ICT Network.
This study will give you a good overview of the Serbian ICT. Whether you are investor or scholar, businessperson or student – we hope you find this study useful. Please, feel free to contact us for more information and consultations 101.
Milan Šolaja
Vojvodina ICT Cluster

9
ICT in Serbia - At a Glance // 2015
VOJVODINA ICT CLUSTER – VOICTThe Vojvodina ICT Cluster - VOICT provides a single point of contact with the best IT companies in Serbia, with the total workforce of 2,500+ experienced IT professionals. VOICT builds long-term relationships based on trust and quality, bringing expertise, experience and passion for excellence to each and every project.
The vision of Vojvodina ICT Cluster is digital Serbia – an environment with strong support to export-oriented IT industry, as well as active usage of IT products and solutions for the benefit of economy and society at large. Cluster - VOICT provides a single point of contact with the best companies in Serbia, with the total workforce of 2,000+ experienced IT. VOICT builds long-term relationships based on trust and quality, bringing expertise, experience and passion for excellence to each and every project.
The member companies made a noticeable breakthrough on world markets, putting Serbia on the map as a very interesting alternative location for development of sophisticated software. Vojvodina ICT Cluster gives institutional support to this trend, while strong support from the University of Novi Sad adds to the strength of the cluster.
Strategic objective of Vojvodina ICT Cluster is to increase visibility of Serbian ICT and put Novi Sad on the world map as the hotbed for software development.
The mission of this organization is to continually improve conditions for ICT development in Vojvodina and Serbia through coordination of our and our partners’ efforts toward a strong positive influence on social and business environment. To our members, the cluster serves as the platform for cooperation and provides a portfolio of services, such as training and education at the Cluster Academy, or opening new business opportunities, forging alliances and lobbying activities.
For more details, visit www.vojvodinaICTcluster.org
ICT in Serbia - At a Glance // 2015
10
GIZ - AN INNOVATIVE PARTNER FOR THE GLOBAL CHALLENGES OF TOMORROWThe wide range of services offered by the Deutsche Gesellschaft für Internationale Zusammenarbeit (GIZ) GmbH are based on a wealth of regional and technical expertise and on tried and tested management know-how. We are a German federal enterprise and offer workable, sustainable and effective solutions in political, economic and social change processes.
Most of our work is commissioned by the German Federal Ministry for Economic Cooperation and Development (BMZ). However, GIZ also operates on behalf of other German ministries and public and private bodies in Germany and abroad. These include governments of other countries, European Union institutions, such as the European Commission, the United Nations and the World Bank. We are equally committed to helping our clients in the private sector attain their goals.
Facts and figures
GIZ operates throughout Germany and in more than 130 countries worldwide. Our registered offices are in Bonn and Eschborn. We have 16,410 staff members around the globe, almost 70% of whom are employed locally as national personnel.* GIZ’s business volume was over EUR 1.9 billion as at 31 December 2013.
(*Figures as at 31 December 2014)
For further information on GIZ, please visit www.giz.de.
ACCESS is a program implemented by GIZ on behalf of the German Ministry for Economic Cooperation and Development (BMZ). It aims to promote the Serbian economic development and to facilitate the future membership of Serbia in the European Union (EU). ACCESS assists Serbian intermediaries in their support to SMEs in selected sectors to make better use of their production, employment and growth potentials and to explore new markets in South Eastern Europe as well as in the EU. The overall objective of the project is the

11
ICT in Serbia - At a Glance // 2015
improvement of the competitiveness of small and medium-sized enterprises and start-up companies in selected sectors and regions.
The program: � Enhances service portfolios for support of entrepreneurship
and startups, such as pre-incubation and incubation phases, technology transfer assistance, QI-trainings and access to capital.
� Provide assistance to Serbian authorities in the process of harmonization of regulatory framework to the EU standards.
� Strengthens public-private dialogue, strategy development, action planning and implementation and monitoring in selected pilot sectors (IT, sustainable agriculture).
� Initiates development of partnerships with German private sector.
Impact � 3 new start-up initiatives, assisting 700 entrepreneurs,
35 established startups attracted over €1.2 million in international venture capital.
� More than 250 producers of organic agricultural products may benefit from export without import permissions to the EU market – thanks to the fact that the EU has recognized the Serbian Organic Control Body (Organic Control System).
� Key contributions to the reform of the Serbian Chamber System were made, modelled after the chamber systems in Central European countries.
� Support provided to the private sector and state administration in the development of Quality Infrastructure and, therefore, in accessing EU market (increasingly positive EU Progress reports).
� 3 National strategies and action plans (IT, Organic Agriculture and Quality Infrastructure) are developed and their implementation is under way.
� The signing of MLA (Multi-Lateral Agreement) between Accreditation Body of Serbia (ATS) and European Accreditation (EA) made it possible for all Serbian producers to certify their products and processes at more than 500 Serbian Conformity Assessment Bodies, resting sure of acceptance of those certificates in the common market.
� After intensive support to the Serbian laboratory (Idvorsky), accredited testing services for electromagnetic compatibility are available in Serbia. This benefits more than 200 producers of electrical products.
� 95% of all European harmonized standards are adopted by Serbian Institute for Standardization and available to Serbian private sector.Strengthening EU funds absorption capacities in Serbia, resulting in 30+ applications for EU funded projects. 14 of them were successful, leading to 260,000+ EUR in received assistance.
ICT in Serbia - At a Glance // 2015
12
INTRODUCTION
Information and Communication Technologies (ICT) undoubtedly constitute one of the key innovations of the last century. ICT are composed of a wide range of product and service technologies including computer hardware, software and services, and a host of telecommunication functions. ICT influenced strongly the fields of socio-economic development, international development, and human rights. The basic hypothesis behind the approach is that more and better information and communication furthers the development of a society (be this to improve income, education, health, security, or any other aspect of human development).
Various studies define the ICT sector differently. The OECD defines ICT sector as a combination of manufacturing and service industries, whose products electronically capture, transmit, or display data and information . In addition, “The production (goods and services) of a candidate industry must primarily be intended to fulfil or enable the function of information processing and communication by electronic means, including transmission and display” (OECD, 2007). This also includes production of electronic components.
In this report, the traditional and simple definition of the ICT sector will be applied. According to this definition, the ICT sector is divided into two sub-sectors: telecommunications and information technologies (IT). Furthermore, the IT sub-sector comprises three segments, which are hardware, software, and services. The main reasons for choosing this definition are: clear and simple review of

13
ICT in Serbia - At a Glance // 2015
particular sub-sectors (IT and telecommunications), which have not significantly converged in Serbia, yet, is possible, and, finally, since it is the focus of this study, to enable presentation of IT sub-sectors (Hardware, IT Services, Software) characteristics.
With a two-digit annual growth in the years prior to the crisis, ICT is among the most vibrant and the fastest growing Serbian sectors, which illustrates the vitality and significance of this sector for the country. However, the economic crisis heavily hit Serbia, creating substantial negative consequences to the ICT industry as well. The Serbian IT market value will most probably stay captured in the “tunnel” between € 400 million and € 450 million, for almost 5-year period (2009-2013). The postponement of the IT projects
caused by the financial crisis created a barrier, which, in turn, led to the accumulation of a great potential. With the improvement of the present economic situation and removing of these barriers, this accumulated potential will get a chance to express itself through double digit growth, again. This study presents an overview of the ICT sector in Serbia. The analysis is structured into three thematic areas: General Business Environment, Assessment of the ICT Sector, Software Sector – Opportunities on International Market.
The study with its analysis and information was designed to primarily serve to the companies interested in business and investing related to ICT in Serbia.
Table 1: ICT Sector Definition
Industry
Sector
Sub-sector IT Hardware Software
Telecomunication Sector
IT Services
IT Sector
ICT Industry

ICT in Serbia - At a Glance // 2015
14
GENERAL BUSINESS ENVIRONMENT
This chapter provides the following information: overview of current business environment in Serbia and legislation framework – in general and IT related.
General Statistics
� Population: 7.16 million � Capital: Belgrade � Territory area: 88,361 km2 � GDP (absolute): € 34.3 billion (per capita: €4,783) � GDP - composition by sector: Manufacturing (16.1%);
Wholesale, retail, and repairs (9.7%); Real estate and other business services (8.7%); Agriculture, hunting and forestry (7.9%); ICT (4.3%) and others (53.3%)
� 59.9% of households have personal computers � 55.8% of households have Internet access � 86.9% of households have mobile phones � 130 Mobile telephone subscriptions/100 pop � 40.9 Fixed telephone lines/100 pop; 99.7% digitalized
network � Percent of GDP spent on R&D: less than 0.8% (government
fund estimated at 0.5%) � Percent of GDP spent on Education: 2.4%
Current Business Environment in Serbia
Fifteen years after the democratic change, the Serbian economy is still in transition, on a roller coaster ride between the years of
15
ICT in Serbia - At a Glance // 2015
growth and recovery and economic stagnation. Although the Serbian economy had a healthy growth during the 2004-2007 period, with an average GDP growth rate of 6.8% (with peaks of 8.4% in 2004 and 7.5% in 2007), it reached only 70% of the country’s 1990 GDP. In the period of still lasting economic crisis (2009-2014) the Serbian economy is mostly stagnating. According to the World Bank estimates, even with a solid annual GDP growth, it will be many years before Serbian GDP reaches previous solid level.
Serbia has a problem with macroeconomic stability. In 2014, the general government deficit of 5.5% of GDP exceeded the initial target and unemployment rate was above 23%. Serbia has secured a three-year loan agreement with the International Monetary Fund at the end of the year to help reach debt and deficit goals.
To overcome the situation, economic development policies in Serbia mainly focus onto the attraction of FDIs. According to the National Bank of Serbia (NBS), in the period from 2005 to 2013, net FDI amounted to € 13.3 billion, having the maximum of € 3.3 billion in 2006.
In the past two years the investments recorded minimums not exceeding € 1 billion per year. The waning interest of investors does not characterize only Serbia but the entire region of Western Balkan countries. The main reasons are the slowed process of joining the EU and the global economic crisis. However, foreign investors, among key reasons for not having more FDI in Serbia, cite the stereotypes such as bureaucratic and insufficiently reformed public administration and high level of corruption.
Evidently, Serbia is not among the top destinations for investment as level of FDI remains low with or without Government incentives. For example, one of the attempts towards the reduction of negative impact of the current economic crisis was the package of measures for foreign companies interested in setting-up their businesses in Serbia. Although having one of the lowest corporate taxes rates in Europe (10%), the Serbian Government was giving non-refundable grants of up to € 10,000 per employee. Contrary to the expectations, this has never produced any positive effects and investments have continued to drop. So, the tax rates were returned to 15% and increase to the grants for new jobs abandoned.
It is not realistic to expect the FDI increase in Serbia in the current exacerbation of the geopolitical situation in Europe. However, there are other possibilities, such as the estimation that during the observed period 2005-2013, remittances from Serbian diaspora were at least twice higher than FDI. So, incentives in this area could be a possible way to compensate missing FDI.
Global IT Index of Serbia
According to the World Economic Forum, the information and communication technology acceptance, infrastructure, and innovation in Serbia are not sufficiently developed, so the capacity for increasing the national competitiveness - is limited. According to the WEF index of technological readiness, in the list of 148 countries, Serbia is ranked 80th, which is the third lowest rank. Behind the Serbia are only Ukraine

ICT in Serbia - At a Glance // 2015
16
Table 2: Network Readiness Index 2014. Serbia Profiles
Source: WEF, Network Readiness Index (NRI) for 2013-2014
Rank(out of148)
Value(1-7)
Networked Readiness Index 2014 80 3.9
Networked Readiness Index 2013 (out of 144) 87 3.7
A. Environment subindex 106 36
1st pillar: Political and regulatory environment 118 3.1
2nd pillar: Business and innovation environment 87 4.0
B. Readiness subindex 53 5.1
3rd pillar: Infrastructure and digital content 49 4.8
4th pillar: Affordability 67 5.4
5th pillar: Skills 63 5.2
C. Usage subindex 72 3.7
6th pillar: Individual usage 54 4.4
7th pillar: Business usage 133 2.9
8th pillar: Government usage 100 3.7
D. Impact subindex 93 3.2
9th pillar: Economic impacts 93 3.0
10th pillar: Social impacts 90 3.4
17
ICT in Serbia - At a Glance // 2015
(81) and Albania (93), while above are better positioned Serbia’s neighbors - Bulgaria (73), Bosnia and Herzegovina (68), Montenegro (52). Croatia is better positioned for even 34 places (46)!
Observing the picture of the international ranking raises some questions: why is Serbia positioned in inglorious surrounding and which key factors are influencing such a bad ranking. Serbia has a noticeable better ranking when it comes to quantitative indicators (comparable statistical data that exist for each of the observed countries) in comparison to qualitative indicators (opinions and attitudes that WEF collect through surveys by local agencies). Respondents from Serbia, in almost all questions from the surveys, express noticeable criticism and significantly underestimate domestic technological readiness in comparison to the vast majority of their colleagues from around the world.
Qualitative indicators, which are the result of the attitudes and opinions of respondents, classified Serbia on 116th place, which deviates to a large extent from 56th place where Serbia is ranked according to the “clean” statistical (quantitative) indicators. The resulting average rank (80) is standing alone between two distant poles, which brings us to the conclusion that this approach to the rank calculating has methodological limitations and, in the case of Serbia, gives non-objective picture. What is more serious, the result of the quantitative analysis almost regularly repeats in all international comparisons that contain surveys with respondents’ views and opinions. Significant discrepancies between qualitative
and quantitative indicators indicate the criticism of the surveyed, which could be positive as respondents wish situation to be improved, but could lead to wrong general conclusions.
WEF uses the index of technological readiness, which equally relies both on the survey results (qualitative indicator) as on the statistically comparable data (quantitative indicator), thus, ignoring the substantial difference between these indicators. Often present bias in opinions and attitudes has a very large impact on the final ranking, which can partly explain the current relatively low Serbian position.
Taking into consideration Kant’s thought that “perception influences reality”, it is not hard to understand the significance of WEF index of technological readiness influence on the picture that others have of Serbia as well as Serbia of itself. The World Economic Forum analyses are the most widely accepted ones and the media most covered international ranking in the past decade. Although WEF has informal authority, ranks are accepted both by experts and ICT policy creators. WEF evaluation creates a perception that affects reality. Because of that a careful analysis of the WEF index of technological readiness framework is recommended.
Despite undeniable importance for comparison of technological readiness of a large number of countries, the analyzed WEF’s model shows deficiencies and limitations for improving the technological position of any country. Therefore, it would be of great importance for Serbia to introduce additional indicators for better identification of its national goals. The introduction of new

ICT in Serbia - At a Glance // 2015
18
Table 3: Discrepancies between Qualitative and Quantitative NRI Indicators Selection 2013-2014
Source: WEF, Network Readiness Index (NRI) for 2013-2014
1st pillar: Political and regulatory environment Rank/148 6th pillar: Individual usage Rank/148
1.02 Laws relating to ICTs 103 6.02 Individuals using Internet, %* 67*
1.03 Judicial independence 124 6.03 Households w/ personal computer, %* 53*
1.08 No. of procedures to enforce a contract* 55* 6.06 Mobile broadband subscriptions/100 pop* 30*
6.07 Use of virtual social networks 112
2nd pillar: Business and innovation environment 7th pillar: Business usage
2.01 Availability of latest technologies 118 7.02 Capacity for innovation (1-7) 133
2.05 No. of procedures to start a business* 58* 7.03 PCT patents, applications/million pop.* 55*
2.07 Tertiary education gross enrolment rate, % 52*
2.08 Quality of management schools 114
3rd pillar: Infrastructure and digital content 8th pillar: Government usage
3.02 Mobile network coverage, % pop.* 49* 8.01 Importance of ICTs to gov. vision 128
3.03 Int’l Internet bandwidth, kb/s per user* 24* 8.02 Government Online Service Index, 0–1 * 48*
3.05 Accessibility of digital content 101 8.03 Government success in ICT promotion 128
5th pillar: Skills 9th pillar: Economic impacts
5.01 Quality of the educational system 111 9.01 Impact of ICTs on new services and products 124
5.04 Adult literacy rate, %* 48* 9.02 ICT PCT patents, applications/mill pop.* 59*
9.04 Knowledge-intensive jobs, % workforce* 46*

19
ICT in Serbia - At a Glance // 2015
statistical indicators would ensure more accurate overview of the current situation, especially of its real faults.
Where is Serbia on the EU Technological Map?
Economic competitiveness as well as the society organization and transparency are best illustrated with the diagram of IT investment according to economic strength (GDP). Significant differences are noticeable among European countries in IT spending, so classification into 6 groups (Tier 1 – 6) according to IT spending vs. GDP per capita is proposed. One of the main observations for the period 2006 – 2013 is validity of tiers robustness against yearly changes of input data. The tier model successfully detects groups of countries which have significant differences in their size and growth dynamics: big and strong, grow faster.
Key observations for the diagram (Figure 1):
� North and west European countries have strong economy and high IT investments (all significantly above average) that are in visible correlation (Tier 1 and Tier 2).
� Mediterranean countries are characterized by strong economy but low IT investments. Provocative, pejorative acronym PIGS for these countries (Portugal, Italy, Greece, and Spain) indicates that they belong to the “second league” (Tier 3 and Tier 4).
� All the countries from EU 10 (10 new members, which joined the EU in 2004) lag behind: they are in the quadrant of weak
Figure 1: Tier levels – classification of European IT spending per capita.
Source: Mineco, EITO, Eurostat (2007-2013)GDP per capita (000)
IT s
pend
ing
per c
apita
(EUR
)
IT MARKET(€ billion)
1 Billion
10 Billion
70 Billion
Tier 1: GBR, DEU, FRATier 2: DNK, SWE, NLD,FIN, AUT, BELTier 3: ITA, ESPTier 4: GRC, PRT, SVNTier 5: CEETier 6: Baltic,West Balkan Countries
ICT in Serbia - At a Glance // 2015
20
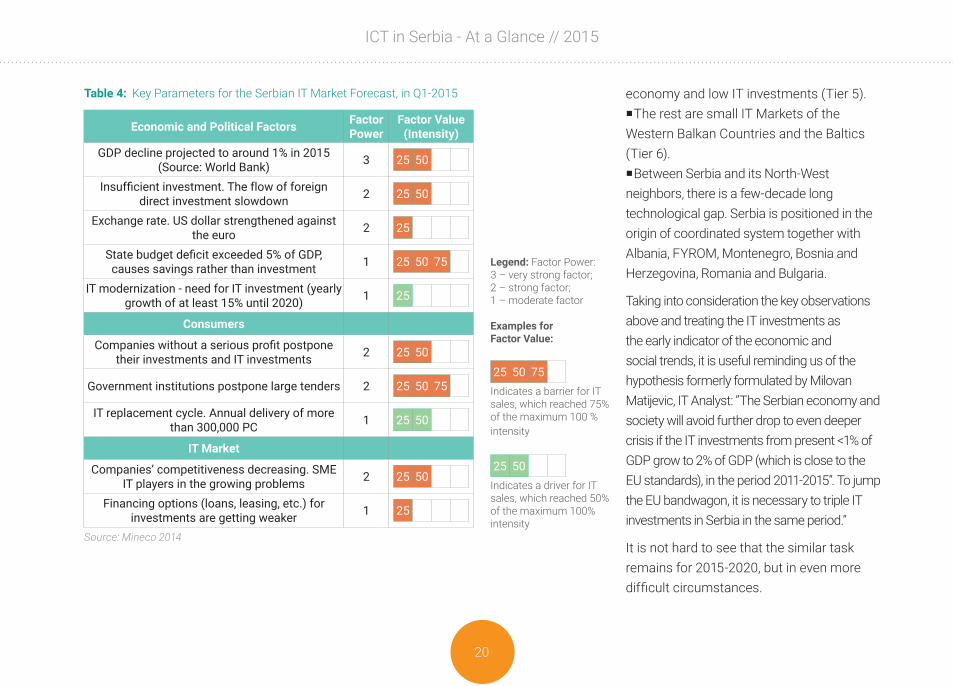
Table 4: Key Parameters for the Serbian IT Market Forecast, in Q1-2015
Source: Mineco 2014
economy and low IT investments (Tier 5). �The rest are small IT Markets of the
Western Balkan Countries and the Baltics (Tier 6).
�Between Serbia and its North-West neighbors, there is a few-decade long technological gap. Serbia is positioned in the origin of coordinated system together with Albania, FYROM, Montenegro, Bosnia and Herzegovina, Romania and Bulgaria.
Taking into consideration the key observations above and treating the IT investments as the early indicator of the economic and social trends, it is useful reminding us of the hypothesis formerly formulated by Milovan Matijevic, IT Analyst: ”The Serbian economy and society will avoid further drop to even deeper crisis if the IT investments from present <1% of GDP grow to 2% of GDP (which is close to the EU standards), in the period 2011-2015”. To jump the EU bandwagon, it is necessary to triple IT investments in Serbia in the same period.”
It is not hard to see that the similar task remains for 2015-2020, but in even more difficult circumstances.
Legend: Factor Power:3 – very strong factor;2 – strong factor;1 – moderate factor
Examples forFactor Value:
25 50 75Indicates a barrier for IT sales, which reached 75% of the maximum 100 % intensity
25 50Indicates a driver for IT sales, which reached 50% of the maximum 100% intensity
Economic and Political Factors FactorPower
Factor Value(Intensity)
GDP decline projected to around 1% in 2015 (Source: World Bank) 3 25 50
Insufficient investment. The flow of foreign direct investment slowdown 2 25 50
Exchange rate. US dollar strengthened against the euro 2 25
State budget deficit exceeded 5% of GDP, causes savings rather than investment 1 25 50 75
IT modernization - need for IT investment (yearly growth of at least 15% until 2020) 1 25
Consumers
Companies without a serious profit postpone their investments and IT investments 2 25 50
Government institutions postpone large tenders 2 25 50 75
IT replacement cycle. Annual delivery of more than 300,000 PC 1 25 50
IT Market
Companies’ competitiveness decreasing. SME IT players in the growing problems 2 25 50
Financing options (loans, leasing, etc.) for investments are getting weaker 1 25

21
ICT in Serbia - At a Glance // 2015
IT Environment, Drivers, and Barriers
From the perspective of local companies operating in the ICT sector, FDIs are seen more as a threat than a benefit due to the limited human resources available on the market. Namely, foreign companies tend to attract good ICT experts with higher salaries, often putting national companies in the situation where they cannot compete.
Although the quality of Serbian ICT infrastructure is below the level of EU countries, it has been getting better, improving impressively in the past few years. In addition, the quality of ICT infrastructure itself does not present significant obstacles for business in Serbia since the most of the ICT companies are concentrated in urban areas where the quality of ICT infrastructure is up to high standards that allow undisturbed IT business.
Standardization of the Serbian IT companies appears to be driven by foreign partners’ demands. Standardization requirements are usually related to the nature of exported services. For example, embedded industry, which produces innovative goods in the field of medical appliances, requires sector-related standards.
Legislation Framework
Doing business in the ICT field in Serbia is increasingly getting easier and more accessible for (foreign) investors. Legislation and regulations have been impressively improved in recent years. Due to achieving the EU candidate status in March 2012, the process
of streamlining Serbian laws with the EU legislation and global standards has been speeding up. This is confirmed by the EU Serbia 2012 progress report despite differences in sub-sectors and the call for further improvements in the field of e-government and overall IT capacity.
In general, Serbia’s tax regime is conducive to business. Corporate profit tax (15%), VAT (20%), salary tax, and social insurance contributions are at the competitive levels in Central and Eastern Europe.
Doing business in telecommunications is better regulated than in the IT sector. In 2009, a new Law on Electronic Communication was harmonized with the EU Regulatory Framework from 2002. Due to its size, the telecommunications sector has attracted some of the major multinational companies, such as TELENOR and VIP, in the arena of mobile communications providers. By now, the state-owned telecommunication company, TELEKOM SRBIJA, which remains the major provider of fixed telephony services, faces competition of private providers such as Orion Telecom.
The telecommunication sector is regulated by the Republic Telecommunications Agency (RATEL), an autonomous national regulatory authority. RATEL has developed into a robust agency with a strong reputation among all actors in the sector. Since 2006, the RATEL has, on a regular basis, published annual overviews of the telecom market in Serbia - a very good source of information in this sector.
ICT in Serbia - At a Glance // 2015
22
In 2013, a “Strategy for IT Industry Development and Support” was adopted, after respectful amount of time and energy was spent on it by stakeholders form IT business, education, civil, and public sectors, but without expected actions. One of the conclusions from the survey conducted among 200 leading software companies in Serbia at the beginning of 2013, was that “the special Government IT sector support program is necessary”. The goal of the survey as well as of the communication among number of experts was to propose the measures that will intensify this sector development and export potential the most. Although the strategic document came relatively fast after that, nothing has been materialized in terms of actions.
The ICT sector also faces business difficulties that are common for other sectors in Serbia: difficulties in obtaining necessary government licenses (especially building permits), lengthy legal actions, and non-transparent public procurement – to name only a few of the numerous obstacles that harm the businesses in Serbia.
Government ICT Policy
The creation of a National ICT R&D policy framework started in 2005 and the relevant Government institutions were founded: National Council for Science and Technological Development (NC), Ministry of Telecommunication and Information Society (MoTIS), Republic Agency for Telecommunication (RATEL), while the Ministry of Science and Technical Development (MoSTD) and the National Information
Technology and Internet Agency (NITIA) were transformed. However, ICT R&D progress is slow in comparison to the great potential. The possible reasons might lie in frequent changes of the Government. In the period 2005-2014, there were seven Governments, accordingly, seven different Ministers of Science.
In the meantime, the MoSTD was abolished, which caused R&D jurisdiction descend to the lower level. Due to the Government reconstruction in 2011, as a measure towards solving crisis, two ministries: MoTIS and MoSTD, as well as agency NITIA were abolished. The authority (jurisdiction) of the MoTIS has been transferred to the newly established “Digital Agenda” under the Ministry of Culture, Media, and Information Society, while the Ministry of Education and Science overtook the jurisdiction of MoSTD. These changes did not seem to be the best solution for the ICT, particularly because it is expected that the focus of the Government during their expanding mandate is far from the ICT. However, the changes continue. After the elections in 2014, the ICT jurisdictions are split among (1) Ministry of Education, Science and Technological Development (R&D component); (2) Ministry of Trade, Tourism, and Telecommunications (ICT component at the level of assistant Minister for Information Society) and (3) “Digital Agenda” under the Ministry of Public Administration and Local Self-Governance, which was in charge for IT industry and strategic software development. Unfortunately, upon the transformation of the “Digital Agenda” into the Directorate for eGovernment, this responsibility was abolished in 2014.
23
ICT in Serbia - At a Glance // 2015
Finance (Demand and Supply)
The expensive (conventional) capital market in Serbia, a typical transition country capital market, certainly still presents a general obstacle for Serbian companies in any sector. But there are clear and substantial signs of improvement.
Serbian ICT companies aiming at developing their own products are in constant need for seed, start-up, venture, and other capital to cover their specific financial needs in all stages of the business cycle: from patenting the product, through market entry, and finally maintaining the stability of the company. Some highlights in that regard:
� There’s a growing IT entrepreneurship and start-up scene that creates a wealth of new business ideas.
� Once established, it takes about 5-7 years, sufficient funds provided, to prepare a company for IPO.
� Depending on the size and complexity of the products only about 10-20 people/programmers (software developers and others) are needed for development of a new product.
� Companies such as SCHNEIDER ELECTRIC DMS NS, A54, EIPIX and NORDEUS are successful examples of Serbian companies developing and internationalizing their own products.
Increasing potentials for development of new products and services by Serbian companies, as well as the need for (smart)
capital, provoke rapid development of market and funding mechanisms for high-tech start-ups. Both public and private support also grew significantly and following a dynamic development since 2010 and is available through various initiatives, such as: the Serbian Innovation Fund, Balkan Venture Forum – BkVF, Serbian Private Equity Association – SPEA, Serbian Business Angel Network (SBAN), SEE ICT Potkrovlje Hub, ICT Hub, Business incubators in Belgrade, Novi Sad, and Zrenjanin, and the first Serbian/USA accelerator and seed fund – StartLabs.
Also present are the regional seed funds and accelerators LauncHUB and Eleven, but also global ones like SeedCamp.
These institutions and players provide either funds for specific projects or support to companies and investors during the identification of suitable business ideas and the matchmaking and investment process, often with a clear-cut focus and expertise in ICT. Considering strong presence of entrepreneurial spirit within the ICT community in Serbia, this trend of support and increase of available funds will continue and Serbian start-ups can expect ever more support in the future.

ICT in Serbia - At a Glance // 2015
24
ASSESSMENT OF THE SERBIAN ICT SECTOR
IT Market and Industry Current Situation
Serbian IT market accomplished € 433.1 million in 2014, which provides minimal yearly growth of 1.0%. However, the trends of three main market segments deviate from this average. The biggest segment, PC Delivery, stood on decline for near 5%. On the other hand, the solid market growth of IT Services and Package Software segment is estimated to be higher than 6%. Market growth is mostly based on the support to the existing business infrastructure valuable more than € 1 billion.
When it comes to IT industry, it is not possible to summarize the results through few statistical data. In general, IT industry is making bigger steps than the IT Market, but enables a wide range of differences among companies: from extremely successful to unsuccessful. Big deviation from average statistical value is a trait of weak markets, and the Serbian IT market stagnates in the aftermath of the global crisis.
In the past, the Serbian IT Market development was based mainly on entrepreneurs and individual energies and initiatives, which resulted in solid numbers of successful IT companies. The best ones, for example DMS, ASSECO, SAGA, were recognized by foreign investors, therefore, all of them have foreign ownership at present. The so-called “spontaneous” development has advantages, like resulting quality, but also has a flaw – it is slow. It is indisputable that Serbia needs more intensive IT growth, but this growth depends on the
25
ICT in Serbia - At a Glance // 2015
Government large tenders, big investments from the business sector, and the presence of global IT vendors. Due to its high impact, the following part is focused on the Government and its direct/indirect influence and the growing role in ICT area in Serbia.
Trends and Potentials – New IT Goals for the Period 2015-2020
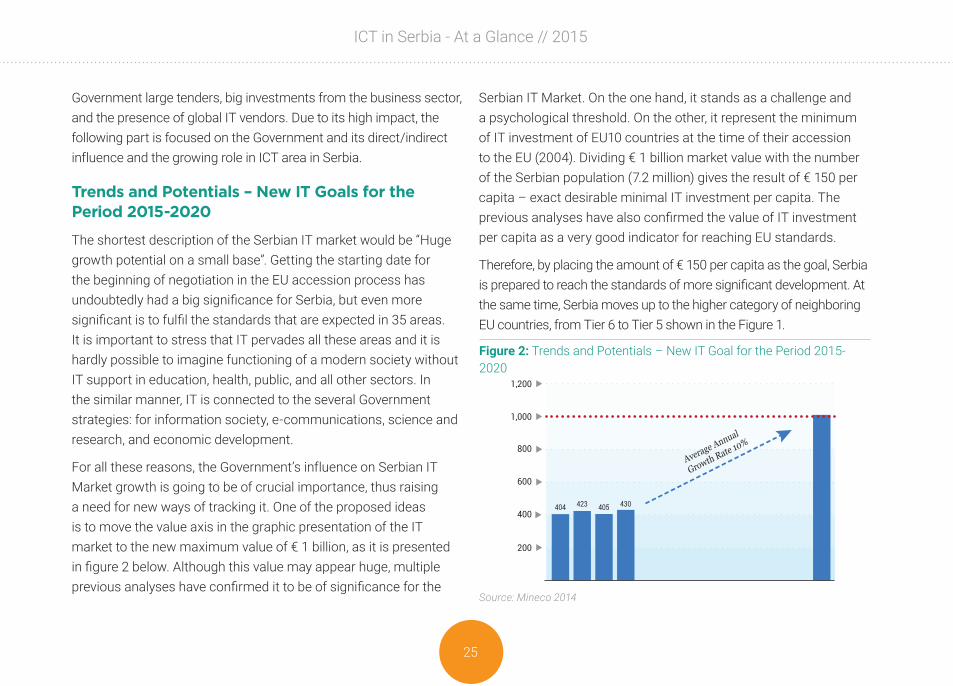
The shortest description of the Serbian IT market would be “Huge growth potential on a small base”. Getting the starting date for the beginning of negotiation in the EU accession process has undoubtedly had a big significance for Serbia, but even more significant is to fulfil the standards that are expected in 35 areas. It is important to stress that IT pervades all these areas and it is hardly possible to imagine functioning of a modern society without IT support in education, health, public, and all other sectors. In the similar manner, IT is connected to the several Government strategies: for information society, e-communications, science and research, and economic development.
For all these reasons, the Government’s influence on Serbian IT Market growth is going to be of crucial importance, thus raising a need for new ways of tracking it. One of the proposed ideas is to move the value axis in the graphic presentation of the IT market to the new maximum value of € 1 billion, as it is presented in figure 2 below. Although this value may appear huge, multiple previous analyses have confirmed it to be of significance for the
Serbian IT Market. On the one hand, it stands as a challenge and a psychological threshold. On the other, it represent the minimum of IT investment of EU10 countries at the time of their accession to the EU (2004). Dividing € 1 billion market value with the number of the Serbian population (7.2 million) gives the result of € 150 per capita – exact desirable minimal IT investment per capita. The previous analyses have also confirmed the value of IT investment per capita as a very good indicator for reaching EU standards.
Therefore, by placing the amount of € 150 per capita as the goal, Serbia is prepared to reach the standards of more significant development. At the same time, Serbia moves up to the higher category of neighboring EU countries, from Tier 6 to Tier 5 shown in the Figure 1.
Figure 2: Trends and Potentials – New IT Goal for the Period 2015-2020
Source: Mineco 2014
ICT in Serbia - At a Glance // 2015
26
The current Serbian IT market is at the low level and planning market value of € 1 billion means setting the bar high. Besides raising the awareness how important it is to jump over this psychological barrier, another prerequisite for achieving this goal is the average annual GDP growth of more than 4%. In the current economic situation, this growing rate is practically impossible. However, Serbia has a chance to reach the projected € 150 per capita (of EU10 countries in 2004) by 2020 and bring the country to the doorstep of EU standards. Certainly, IT also has to be at the top of the Government’s priority list.
Government Initiatives and Influence on IT Market and IT Sector
More than ever before, the year of 2013 was marked with numerous governmental initiatives related to IT topics. However, the real effects were very low. One initiative that made the biggest impression (as well as media attention) was increase of VAT from 8% to 20%, starting from January 1st, 2014. Without a shred of doubt, this measure had the strongest negative influence on the IT market, creating problems in a number of companies dealing with IT sales and supported services. The Government attitude regarding VAT in such an important sector as IT is worrying, following a cyclical pattern.
In 2013, “The Strategy for IT Industry Development and Support” was adopted, after respectful amount of time and energy, but without expected actions. One of the conclusions received from
the survey conducted among 200 leading software companies in Serbia, at the beginning of 2013, was that “the special governmental IT sector support program is necessary”. The goal of the survey, as well as of the communication among number of experts, was to propose the measures to intensify the sector development and boost export potentials. Although the strategic document came relatively fast, no action followed its adoption. This could bring to a conclusion that Serbia has administrative capacities, but it seems that operational ones are lost somewhere in the frequent changes of Government during the past years.
And how does the IT sector see the Government? The Government was and still is seen as an important factor for Serbian IT development, but never appeared to be a partner. Weak communication channel with policy creators are prevalent occurrence, and politicians’ failure to understand huge potentials of the IT industry and its effects on the rest of the economy is omnipresent.
The Government should be doing a lot more for the IT sector when it comes to education. The sharp increase of freshmen enrolling computer-related studies (up to 6,500) has occurred thanks to raising the popularity of IT profession among the young. The main appeals are that unemployment is virtually zero, while offering exciting careers. The current capacities of the Serbian universities to accept students at computer-related studies must be dramatically increased. Even if the education system suddenly

27
ICT in Serbia - At a Glance // 2015
starts to produce tenfold numbers of coders, developers, and software engineers – it would not be enough to satisfy the needs of the IT industry. Also, Serbian higher education system is not harmonized with the HR market needs, in general.
The survey mentioned above clearly states how the lack of personnel cripples growth potentials of the IT industry in Serbia. According to the survey participants, the priority measure should be adjustment of the education system to the needs of the IT industry. For majority of participants (71%) this is the most important measure (highest mark 5), and for 20% of them it is very important (mark 4). Modernizing of curricula and increasing enrolment quotas for IT studies are considered to be very important for the sector as well (marks 4 and 5).
It may sound like the importance of the Government’s influence on the ICT is overemphasized. However, in a situation where there is no Ministry of Information Society (or similar), and where ICT jurisdictions are dispersed among at least three ministries, the lack of focus on the ICT as the one of the key leverages of the future
progress is painfully obvious.
2.1. ICT MARKET - STATISTICAL OVERVIEW This chapter provides basic information needed for an insight into the Serbian ICT sector, such as:
� Market value and market structure � Geographical market dispersion � IT spending and investment in Serbia � Usage of IT by households and business in Serbia
When measured according to the revenue per capita, Serbian ICT market is lagging far more behind than according to the indictors of IT usage. The main reasons for that are:
� Buyers mostly focus on basic ICT solutions and low-end specifications;
� Buyers orientation on non-brand solutions is higher than on the A-brand;
� Low-prices of the ICT solutions are an imperative; � The cost of local IT services and software is up to 50% lower
than the EU average for the same specifications/expertise; � The replacement cycle is far longer than in EU countries
(instead 3-4 years, ICT solutions are replaced after 6-7 years and even longer).
ICT in Serbia - At a Glance // 2015
28
Figure 3: Serbian IT Market and Growth Rates for 2010-2014. (%)
Source: Mineco 2014
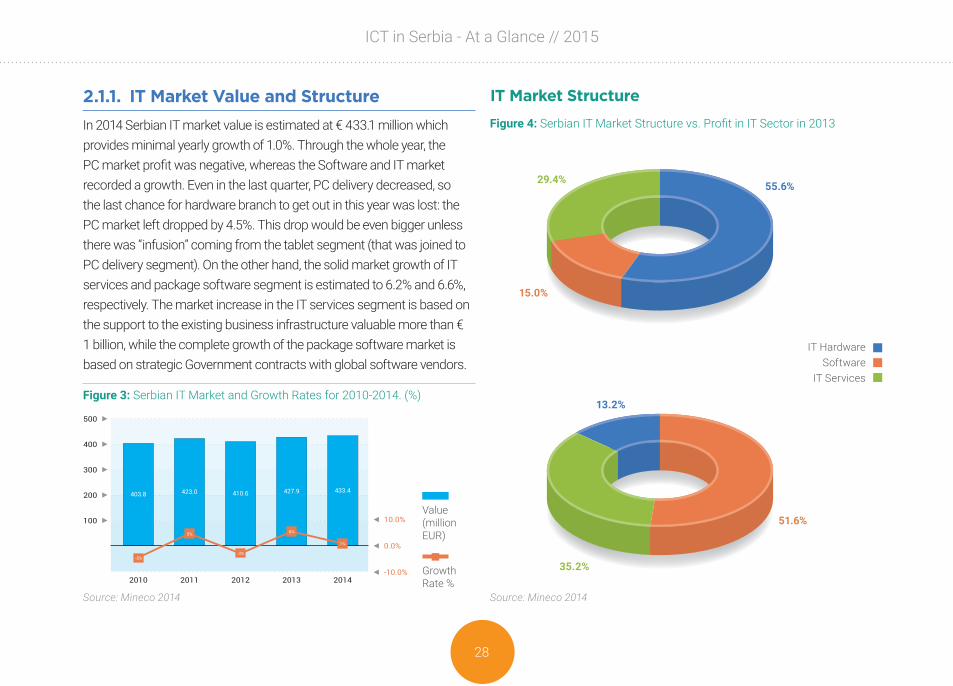
2.1.1. IT Market Value and StructureIn 2014 Serbian IT market value is estimated at € 433.1 million which provides minimal yearly growth of 1.0%. Through the whole year, the PC market profit was negative, whereas the Software and IT market recorded a growth. Even in the last quarter, PC delivery decreased, so the last chance for hardware branch to get out in this year was lost: the PC market left dropped by 4.5%. This drop would be even bigger unless there was “infusion” coming from the tablet segment (that was joined to PC delivery segment). On the other hand, the solid market growth of IT services and package software segment is estimated to 6.2% and 6.6%, respectively. The market increase in the IT services segment is based on the support to the existing business infrastructure valuable more than € 1 billion, while the complete growth of the package software market is based on strategic Government contracts with global software vendors.
IT Market Structure
Value(million EUR)
Growth Rate %
Figure 4: Serbian IT Market Structure vs. Profit in IT Sector in 2013
Source: Mineco 2014
IT HardwareSoftware
IT Services
55.6%
13.2%
29.4%
35.2%
15.0%
51.6%

29
ICT in Serbia - At a Glance // 2015
Key observations from the figure 4:
� In 2013 IT market structure, the segment of the IT Hardware with 55.6% share is still dominant, followed by IT Services segment with 29.4%, and the remaining 15.0% comes from Software. Such a market structure, according to European standards, clearly illustrates the market that is still in the early stage of the IT maturity.
� Although IT Hardware still drives the IT market in Serbia, profit margins of hardware companies are extremely small, consequently their profit is very low. The highest available net profit, almost a half of the total IT industry net profit, is generated by the companies from the Software sector.
IT Services Structure
While the hardware support and installation market will see continued demand in the future, its share of the total services market is expected to contract.
The four major vertical markets: government, finance, manufacturing, and telecommunications are likely to be the largest spenders on IT services in Serbia in the coming years. As the Serbia continues to stabilize both economically and politically, it has the potential to increase its FDI. As in other developing countries in the region, these four sectors have been the prime beneficiaries of the inflow of FDI, which has fostered spending on IT services.
A significant part of IT services is internal (end-user companies rely
on their own IT departments). These services are not included in the analysis.
The strength and number of international vendors operating in the region and Serbia will increase and will have the following implications:
� As service engagements require more intricate and specific solutions, local service firms will have to form strategic partnerships with traditional product vendors or with international service companies, to meet customer needs.
� A number of local IT services companies are stuffed with highly skilled employees and the acquisition of these companies can be a useful tool for international vendor entry into one of the IT markets, as it is already seen all over the CEE region.
Figure 5: Structure of IT Service in Serbia in 2013and CAGRE (5 year period)
Source: Mineco 2014
Value(million EUR)
CAGR – [%] Compound Annual Growth Rate for the five year period (2006-2011)
CAGR %

ICT in Serbia - At a Glance // 2015
30
Application Software Structure In 2013, the Serbian market for application software reached a value of € 36.3 million. Business applications (ERP, SCM, Accounting) hold the largest part, constituting 47.5%. Collaborative applications (DM, CMS, CRM, BI, Portal, Web) follow with 30.2% of the market share.
Local software producers dominate the Accounting and ERP market in Serbia, given their flexibility in developing custom software applications. Custom application development represents an option for a large number of companies (particularly SMEs) seeking a software solution.
Increasing demand for software applications – both ready-made and custom developed packages – will drive growth in this foundation market in the period 2015-2020.
IT Spending and Investments
� Serbian companies invest in IT round 0.5% of their revenue, which is significantly lower than competitive international companies. Taking into consideration that revenues of Serbian companies are low, the absolute amount of their IT spending looks even smaller.
� Similar situation is with IT employment. The diagram below shows that Serbian companies employ even 4 times less IT experts than their competition abroad.
� The growth rate of IT investments (6%) as well as the growth rate of IT employment (4%) are above the world average, so the detected gap could be overcome, but the years will be needed.
One of the core potentials for Serbian IT companies remains to be the local market. The Serbian economy is still under transition, with outdated
Figure 6: Software Market in Serbia 2011-2014
Source: Mineco 2014
2011
2012
2013
2014
Figure 7: Structure of Software Market in Serbia
Source: Mineco 2014
Business applications (ERP, SCM, Accounting)
Collaborative App. (DM, CMS, CRM, BI,
Portals, WebOthers Business
App. (e-Bus. Mobility, Office...)
Engineering applications
47.5%15.6%
30.2%
6.8%

31
ICT in Serbia - At a Glance // 2015
production lines that should be replaced with new technologies. IT solutions are also necessary for increasing efficiency in management.
IT companies in Serbia should invest more time in getting specific knowledge about the economy in Serbia, and by that to position themselves for future opportunities. Furthermore, IT companies should help the technologically outdated Serbian industry with solutions that might increase productivity, innovation, and competitiveness on the international and domestic market. Good examples are domestic companies AB Soft, IIB, Digit and M&I Systems Co., who are the leading ERP solution providers in Serbia, with excellent references and long tradition.
Why Particularly IT Investments?
Investments are always important, especially in a crisis. Since information technologies are in the base of every optimization, the crisis is the right time for strategic investments. The main reasons are:
� IT infrastructure is the important condition for economy, society and government development;
� For taking part in global economy IT industry requires significantly smaller resources than other industries;
� IT industry is significantly cheaper, but more profitable, than other industries;
� ICT industry development prevents the “brain drain”.
2.1.2. IT and Internet UsageSince 2006, the Statistical Office of the Republic of Serbia has published annually statistics on the usage of ICT in households and businesses. ICT at a Glance edition 2013 showed that 59.9% of households have personal computers and 31.6% have laptop computers. Ownership of ICT equipment is mostly concentrated among the urban population with a monthly income of more than € 600 (88.9%). The overall usage of computers in Serbia is still unsatisfactory, with 36.6% of the population having no access to computers. The number of PC users has increased by solid 2.3% in 2013. Among different groups in the population, students are the most active in using computers (99.5%), followed by employees (79.2%). In real figures, more than 2.6 million people in Serbia use computers every day.
Figure 8: IT Spending and Investments in Serbia
Source: Mineco 2013, Gartner – IT Spending and Staffing Report 2013
(%) IT spending as a Percentage of Revenue(%) IT Employees as Percentage of Total EmployeesCAGR (%) 2006-2010 in SRB
World
Serbia
CAGR % 2006-2010 in SRB
ICT in Serbia - At a Glance // 2015
32
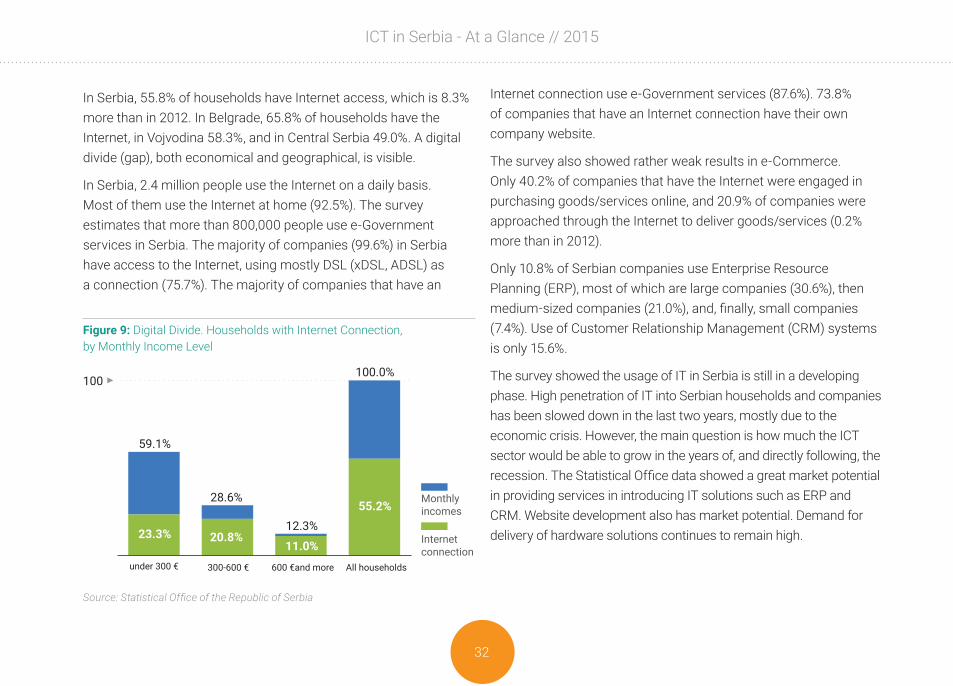
In Serbia, 55.8% of households have Internet access, which is 8.3% more than in 2012. In Belgrade, 65.8% of households have the Internet, in Vojvodina 58.3%, and in Central Serbia 49.0%. A digital divide (gap), both economical and geographical, is visible.
In Serbia, 2.4 million people use the Internet on a daily basis. Most of them use the Internet at home (92.5%). The survey estimates that more than 800,000 people use e-Government services in Serbia. The majority of companies (99.6%) in Serbia have access to the Internet, using mostly DSL (xDSL, ADSL) as a connection (75.7%). The majority of companies that have an
Internet connection use e-Government services (87.6%). 73.8% of companies that have an Internet connection have their own company website.
The survey also showed rather weak results in e-Commerce. Only 40.2% of companies that have the Internet were engaged in purchasing goods/services online, and 20.9% of companies were approached through the Internet to deliver goods/services (0.2% more than in 2012).
Only 10.8% of Serbian companies use Enterprise Resource Planning (ERP), most of which are large companies (30.6%), then medium-sized companies (21.0%), and, finally, small companies (7.4%). Use of Customer Relationship Management (CRM) systems is only 15.6%.
The survey showed the usage of IT in Serbia is still in a developing phase. High penetration of IT into Serbian households and companies has been slowed down in the last two years, mostly due to the economic crisis. However, the main question is how much the ICT sector would be able to grow in the years of, and directly following, the recession. The Statistical Office data showed a great market potential in providing services in introducing IT solutions such as ERP and CRM. Website development also has market potential. Demand for delivery of hardware solutions continues to remain high.
Figure 9: Digital Divide. Households with Internet Connection,by Monthly Income Level
Source: Statistical Office of the Republic of Serbia
100100.0%
under 300 € 300-600 € All households600 €and more
55.2%
11.0%20.8%23.3%
12.3%
28.6%
59.1%
Monthlyincomes
Internetconnection
33
ICT in Serbia - At a Glance // 2015
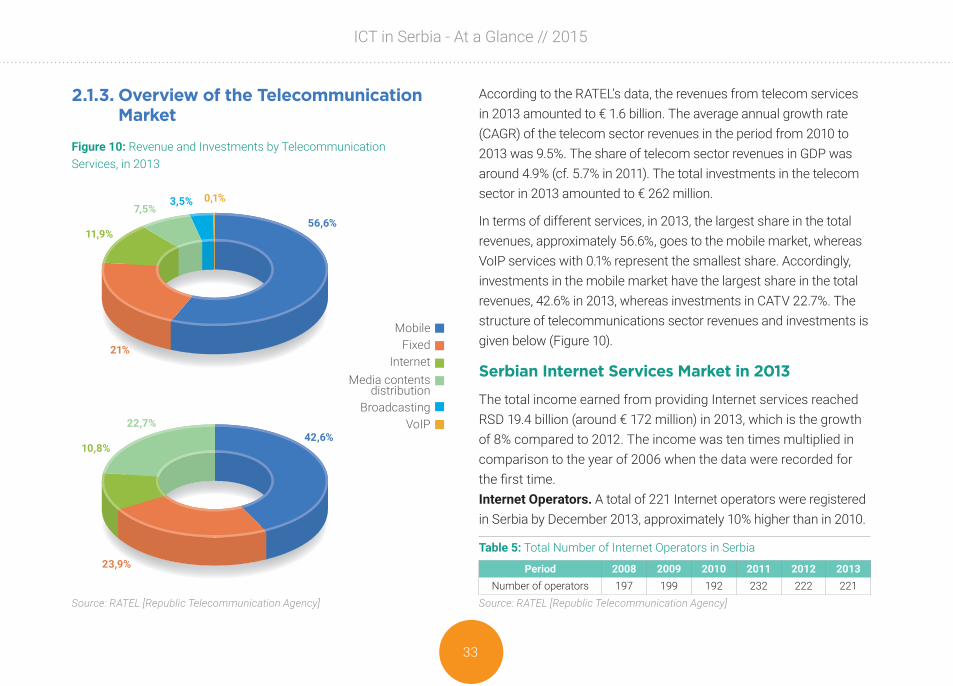
Figure 10: Revenue and Investments by Telecommunication Services, in 2013
Source: RATEL [Republic Telecommunication Agency]
2.1.3. Overview of the Telecommunication Market
According to the RATEL’s data, the revenues from telecom services in 2013 amounted to € 1.6 billion. The average annual growth rate (CAGR) of the telecom sector revenues in the period from 2010 to 2013 was 9.5%. The share of telecom sector revenues in GDP was around 4.9% (cf. 5.7% in 2011). The total investments in the telecom sector in 2013 amounted to € 262 million.
In terms of different services, in 2013, the largest share in the total revenues, approximately 56.6%, goes to the mobile market, whereas VoIP services with 0.1% represent the smallest share. Accordingly, investments in the mobile market have the largest share in the total revenues, 42.6% in 2013, whereas investments in CATV 22.7%. The structure of telecommunications sector revenues and investments is given below (Figure 10).
Serbian Internet Services Market in 2013
The total income earned from providing Internet services reached RSD 19.4 billion (around € 172 million) in 2013, which is the growth of 8% compared to 2012. The income was ten times multiplied in comparison to the year of 2006 when the data were recorded for the first time.Internet Operators. A total of 221 Internet operators were registered in Serbia by December 2013, approximately 10% higher than in 2010.
MobileFixed
InternetMedia contents
distributionBroadcasting
VoIP
56,6%
42,6%
11,9%
10,8%
21%
23,9%
7,5%
22,7%
3,5% 0,1%
Table 5: Total Number of Internet Operators in Serbia
Source: RATEL [Republic Telecommunication Agency]
Period 2008 2009 2010 2011 2012 2013Number of operators 197 199 192 232 222 221

ICT in Serbia - At a Glance // 2015
34
Internet Penetration: In 2013, the number of Internet connections per 100 citizens was approximately 79 and the number of broadband Internet connections per 100 citizens approximately 20.
Broadband Internet Penetration: Unless 3G mobile network subscribers are taken into consideration, the penetration of fix broadband Internet access amounts to 16%, which is above the average in the SEE region (11.0%). However, the penetration of broadband Internet access in Serbia is significantly below the EU27 average (28.8%).
Taking into consideration all relevant parameters, the Serbian Internet market is projected constant growth in the following few years. It is expected that the number of broadband connections per 100 citizens will reach the present level in developed European countries by 2020.
ICT Development Index
In 2007, the International Telecommunication Union (ITU) initiated the process of creating a single Index which can be utilized in measuring the development of information society, the so called ICT Development Index (IDI). This single IDI serves as a benchmarking tool for measuring: the development of the ICT market in UN Member States; digital divide between the developed and developing countries; developmental potential of the ICT market.
This Index combines 11 indicators divided into three sub-groups: (1) ICT Readiness (infrastructure and access); (2) ICT use (primarily by individuals, but also households and undertakings) and the intensity of use; (3) ICT Capability (skills necessary for the effective use of ICTs).
The value of IDI Index for the Republic of Serbia in 2013 amounts to 6.0 which is a significant growth compared to 4.2 in 2008, 4.8 in 2009, 5.1 in 2010, 5.5 in 2011, and 5.6 in 2012. Considering the previous ITU data,
Figure 11: ICT Development Index, IDI Structure
Source: RATEL [Republic Telecommunication Agency]
ICT Readiness(infrastructure,
access)
ICT Impact(outcomes)
ICT Capability(skills)
ICT Use(intensity)
ICTDevelopmentIndex
35
ICT in Serbia - At a Glance // 2015
we may anticipate that, based on the IDI Index value, Serbia will secure a place among the first 50 countries in the list.
The fact that Serbian ICT access indicators have significantly higher values (0.70) than ICT use indicators (0.43) is quite apparent and serves as an illustration of the disparity between the existing telecommunications infrastructure capacity and the use of such capacity in terms of telecommunication services on such infrastructure in Serbia, as is the case with the use of broadband Internet services. ICT skills indicators (0.76) are of the appropriate value.
2.2. ICT INDUSTRY – SECTOR ANALYSISThis chapter provides basic information needed for an insight into the Serbian ICT Industry, such as:
� ICT sector definition and structure � Number of companies, employees, revenue in IT industry
and Software sub-subsector � IT Clusters and Support Organizations
2.2.1. ICT Industry Summary
ICT Sector Definition
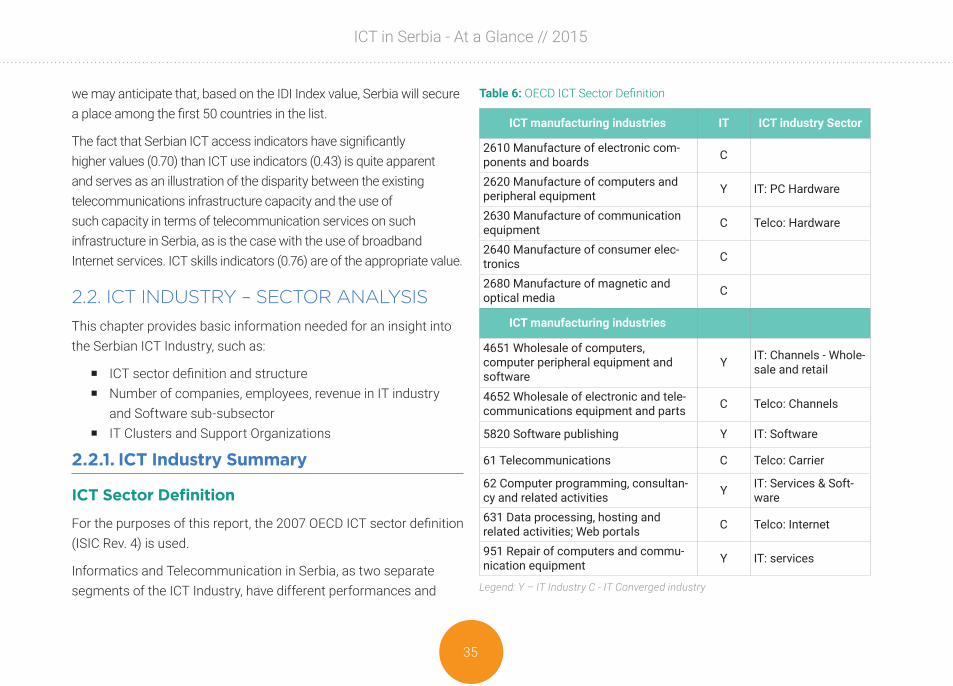
For the purposes of this report, the 2007 OECD ICT sector definition (ISIC Rev. 4) is used.
Informatics and Telecommunication in Serbia, as two separate segments of the ICT Industry, have different performances and
Table 6: OECD ICT Sector Definition
Legend: Y – IT Industry C - IT Converged industry
ICT manufacturing industries IT ICT industry Sector
2610 Manufacture of electronic com-ponents and boards C
2620 Manufacture of computers and peripheral equipment Y IT: PC Hardware
2630 Manufacture of communication equipment C Telco: Hardware
2640 Manufacture of consumer elec-tronics C
2680 Manufacture of magnetic and optical media C
ICT manufacturing industries
4651 Wholesale of computers, computer peripheral equipment and software
Y IT: Channels - Whole-sale and retail
4652 Wholesale of electronic and tele-communications equipment and parts C Telco: Channels
5820 Software publishing Y IT: Software
61 Telecommunications C Telco: Carrier
62 Computer programming, consultan-cy and related activities Y IT: Services & Soft-
ware631 Data processing, hosting and related activities; Web portals C Telco: Internet
951 Repair of computers and commu-nication equipment Y IT: services
ICT in Serbia - At a Glance // 2015
36
trends: while IT is characterized as a fragmented and liberal market with significant presence of SME segmentation, more mature telecommunication sector practically consists of three big mobile operators and one cable operator. Since this report is primarily aimed at potential investors in new IT areas, the focus is set to SME segment and IT service companies while Telecommunication part is reduced to the few key observations.
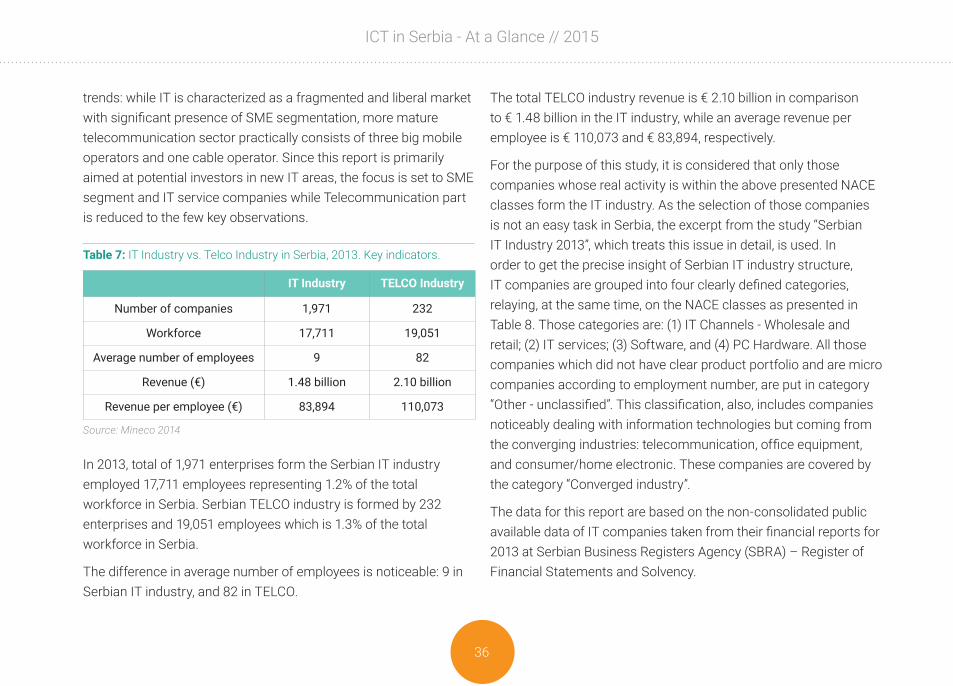
In 2013, total of 1,971 enterprises form the Serbian IT industry employed 17,711 employees representing 1.2% of the total workforce in Serbia. Serbian TELCO industry is formed by 232 enterprises and 19,051 employees which is 1.3% of the total workforce in Serbia.
The difference in average number of employees is noticeable: 9 in Serbian IT industry, and 82 in TELCO.
The total TELCO industry revenue is € 2.10 billion in comparison to € 1.48 billion in the IT industry, while an average revenue per employee is € 110,073 and € 83,894, respectively.
For the purpose of this study, it is considered that only those companies whose real activity is within the above presented NACE classes form the IT industry. As the selection of those companies is not an easy task in Serbia, the excerpt from the study “Serbian IT Industry 2013”, which treats this issue in detail, is used. In order to get the precise insight of Serbian IT industry structure, IT companies are grouped into four clearly defined categories, relaying, at the same time, on the NACE classes as presented in Table 8. Those categories are: (1) IT Channels - Wholesale and retail; (2) IT services; (3) Software, and (4) PC Hardware. All those companies which did not have clear product portfolio and are micro companies according to employment number, are put in category “Other - unclassified”. This classification, also, includes companies noticeably dealing with information technologies but coming from the converging industries: telecommunication, office equipment, and consumer/home electronic. These companies are covered by the category “Converged industry”.
The data for this report are based on the non-consolidated public available data of IT companies taken from their financial reports for 2013 at Serbian Business Registers Agency (SBRA) – Register of Financial Statements and Solvency.
Table 7: IT Industry vs. Telco Industry in Serbia, 2013. Key indicators.
Source: Mineco 2014
IT Industry TELCO Industry
Number of companies 1,971 232
Workforce 17,711 19,051
Average number of employees 9 82
Revenue (€) 1.48 billion 2.10 billion
Revenue per employee (€) 83,894 110,073

37
ICT in Serbia - At a Glance // 2015
This report is focused on Software sub-sector and the presentation of Serbian Software sub-sector through the number of IT companies, their size, structure, and number of employees. The terms: revenue, added value, and net asset in Serbian IT sector are used for the whole IT sector where all active IT companies revenues, added values, and net assets are summarized, respectively [see Terminology].
2.2.2. IT Industry and Software sub-sectorIn its study on Serbian IT industry, the SITO published that the IT industry is significantly more profitable than other industries. Profitability index of the IT sector per employee is 560% of the overall economy profitability index. Additionally, the sector needs for resources are significantly less than in other industries as the sector net assets per employee are close to 49% of the total economy net assets. This IT sector features lead to the conclusion that one IT employee with a half of the average resources - achieves 6 times bigger profit. In addition, the liquidity of IT companies is twice the economy average, and debt and bank loans are at the level of 60% of the economy average. Also, the SITO found that IT companies have the highest average gross wage - 66% higher than the Serbian average. Finally, IT industry development creates the preconditions for IT experts staying in Serbia instead of massively leaving abroad.
When it comes to geographic distribution of ICT companies, in Serbia most companies are located in Belgrade, Nis, and Novi Sad. The vast majority of other municipalities have an insignificant concentration of ICT companies.
Serbian IT industry in 2013 includes 1,971 active enterprises, selected on the basis of generated revenue of more than RSD 1 million (approx. € 10,000) each. The number of IT companies increased by 12.9% in comparison to 2011.
More than a half of the number of the enterprises from this segment is active in the Software sub-sector (180 of 337). Investments and support to SME segment are observed as a decisive factor for the IT industry fast development.
The IT industry structure, according to the industry sub-sectors and enterprise distribution by company size, is presented in the table below.
Table 8: Number of IT companies in Serbia, 2013, according to the IT Sub-sector and Company size
IT industry sub-sector
Mic
roEn
terp
rises
Smal
lEn
terp
rises
Med
ium
Ente
rpris
es
Larg
eEn
terp
rises
Tota
l
IT Channels - Wholesale and retail 23 21 9 1 54
IT services 188 54 11 2 255
Software 380 159 21 2 562
PC Hardware 180 9 189
Other – unclassified 732 5 737
Converged industry 126 43 5 174
Total 1,629 291 46 5 1,971
Total [%] 82.6% 14.8% 2.3% 0.3% 100.0%

ICT in Serbia - At a Glance // 2015
38
Key comments for the table 8:
� In Serbian IT industry, there are only five big IT enterprises (with more than 250 employees). Total number of SME enterprises is 337, which is 17.1% of all IT enterprises. This number is considered as an unfavorable indicator – the number of SME in this sub-sector should be significantly higher.
� More than a half of the enterprises from the SME segment is active in Software sub-sector (180 of 337).
� Huge number of micro companies (1,629), which have low financial capacities, insufficient technological, and managing skills, visibly characterizes Serbian IT industry.
� Investments and support to SME segment are observed as a decisive factor for IT industry fast development.
Number of Software Sub-sector Companies in Serbia
In respect to defined company activity, the Software sub-sector dominates in Serbian IT industry with 562 enterprises, which is 28% of the total IT industry enterprise number. Investments and support to SME segment are observed as a decisive factor for IT industry fast development.
Enterprise distribution according to their size and Software segment is presented in the table below. The key sub-groups: (a) software exporters are companies that generate majority of their income through software export, (b) ERP solution providers are active on
Figure 12: Distribution of IT Industry, according Sub-sector
Source: Register of Financial Statement and Solvency, SBRA, prepared upon Mineco’s demand
IT ChannelsIT services
SoftwarePC Hardware
Other - unclassifiedConverged industry
37%28%
13%
10%
9%3%
Table 9: Number of Software sub-sector according to the segment and Company size
Software segment
Mic
roEn
terp
rises
Smal
lEn
terp
rises
Med
ium
En
terp
rises
Larg
eEn
terp
rises
Tota
l
Software Exporter 67 91 18 2 178
ERP Specialist 52 28 3 83
Other Software 261 40 301
Total 380 159 21 2 562
Total [%] 67.6% 28.3% 3.7% 0.4% 100.0%
39
ICT in Serbia - At a Glance // 2015
domestic market only, (c) others – all other software companies. This segmentation reflects specifities of Serbian software sector well.
Key comments for the table 9:
� In Serbian Software sub-sector, there are only two big IT enterprises (with more than 250 employees). The total number of SME enterprises is 180, which is 32.0% of the total enterprise number in the Software sub-sector. The number of the SMEs in this sub-sector should be significantly higher.
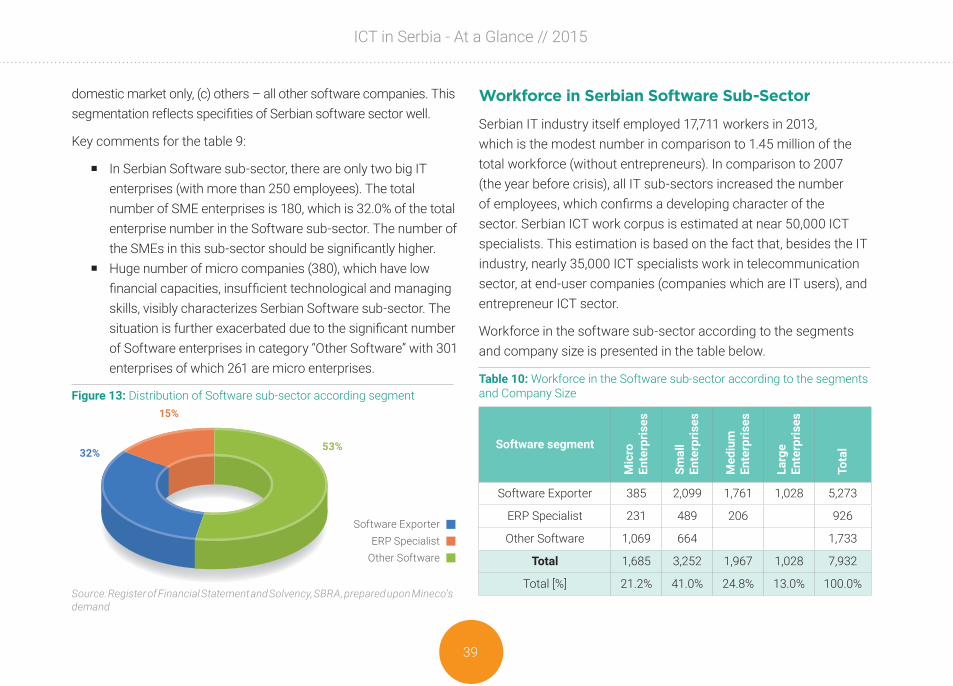
� Huge number of micro companies (380), which have low financial capacities, insufficient technological and managing skills, visibly characterizes Serbian Software sub-sector. The situation is further exacerbated due to the significant number of Software enterprises in category “Other Software” with 301 enterprises of which 261 are micro enterprises.
Workforce in Serbian Software Sub-Sector
Serbian IT industry itself employed 17,711 workers in 2013, which is the modest number in comparison to 1.45 million of the total workforce (without entrepreneurs). In comparison to 2007 (the year before crisis), all IT sub-sectors increased the number of employees, which confirms a developing character of the sector. Serbian ICT work corpus is estimated at near 50,000 ICT specialists. This estimation is based on the fact that, besides the IT industry, nearly 35,000 ICT specialists work in telecommunication sector, at end-user companies (companies which are IT users), and entrepreneur ICT sector.
Workforce in the software sub-sector according to the segments and company size is presented in the table below.
Figure 13: Distribution of Software sub-sector according segment
Source: Register of Financial Statement and Solvency, SBRA, prepared upon Mineco’s demand
Software ExporterERP Specialist
Other Software
32% 53%
15%
Table 10: Workforce in the Software sub-sector according to the segments and Company Size
Software segment
Mic
roEn
terp
rises
Smal
lEn
terp
rises
Med
ium
En
terp
rises
Larg
eEn
terp
rises
Tota
l
Software Exporter 385 2,099 1,761 1,028 5,273
ERP Specialist 231 489 206 926
Other Software 1,069 664 1,733
Total 1,685 3,252 1,967 1,028 7,932
Total [%] 21.2% 41.0% 24.8% 13.0% 100.0%

ICT in Serbia - At a Glance // 2015
40
Key comments for the table 10:
� The employment in the Software sub-sector increased significantly above the average in 2013 and achieved the number of 7,932 employees, which is 45% of the total IT sector workforce.
� The largest number of employees 5,273 (66%) is in the “Software exporter” segment, followed by the “Other Software” 1,733 employees which is 22%. The lowest number of employees is in the ”ERP Specialist” segment (12%). However, this distribution is expected to change due to the Software sub-sector expansion and growing importance of large and medium enterprises.
� The SME segment in the Software sub-sector records significant number of employees (5,219), which is 65.8% of the Software sub-sector segment workforce. The average number of employees in the Software SME segment is 29, more than 3 times higher than the IT industry average (9).
Revenue in the Serbian Software Sub-Sector
Revenue (or turnover) of the IT industry represents the revenue of the whole IT sector - all IT companies revenues summarized. Compared to the value of the IT market, the IT industry revenue is typically three times higher, due to selling multiplications in distribution channel, export, and non-IT revenues of companies’ business.
The Serbian IT Industry generated the total revenue of more than € 1.4 billion in 2013. Based on the previous researches, it is estimated that the revenue from the IT hardware, software, and services makes around 75% of the IT industry revenue (nearly € 1.1 billion), while the remaining 25% came from converging and non-ICT products.
The highest revenue, 38% IT industry sector revenue, was accomplished in the Wholesale and Retail sub-sector (€ 571.4 million). It is followed by the IT Service sub-sector with € 335.8 million (23%) which is similar to the Software sub-sector (22%).
Distribution of the Software sub-sector revenue is in the Table 11.
Figure 14: Software segments Share (%) in Total Number of Employees in Software sub-sector
Source: Register of Financial Statement and Solvency, SBRA, prepared upon Mineco’s demand
66%22%
12%
Software ExporterERP Specialist
Other Software

41
ICT in Serbia - At a Glance // 2015
Key comments for the table above:
� In comparison to 2011, Serbian total Software sub-sector revenue in 2013 raised by 15%, which is 60% higher than the whole IT market growth. The reason lies in growing “Software exporter” segment.
� The highest revenue, 74% Software sub-sector revenue, was accomplished in the “Software exporter” segment (€ 239.3 million). It is followed by “Other Software” segment with € 54.1 million (17%).
� With revenue of almost € 230 million, the SME segment gathered 71% share in the total Software sub-sector revenue. In the same segment, the biggest part, also, came from the “Software exporter” – more than 80% of the total SME segment revenue.
Net Assets of the Serbian Software Sub-Sector
Despite the crisis, the net assets of the Serbian IT industry continued to grow in 2013 and achieved around € 388 million. Compared to 2006, where the IT industry net assets were round € 150 million, the impressive compound annual growth rate (CAGR) of more than 15% was accomplished. This trend is “spiritus movens” for the private sector, which is dominant in the IT industry. The high return rates on net assets will certainly attract foreign investors willing to take the risk and seize the opportunity for a good profit. It is certain that IT sub-sectors: IT services and Software are seen to have sound perspective.
Figure 15: Revenue Structure of Software Sub-Sector (%)
Source: Register of Financial Statement and Solvency, SBRA, prepared upon Mineco’s demand
74%17%
9%
Table 11: Revenue in Software sub-sector [€ million], according to the seg-ment and Company Size
Software segment
Mic
roEn
terp
rises
Smal
lEn
terp
rises
Med
ium
En
terp
rises
Larg
eEn
terp
rises
Tota
l
Software Exporter 21.6 70.7 115.8 31.3 239.3
ERP Specialist 7.4 16.3 7.4 31.0
Other Software 34.1 20.0 54.1
Total 63.0 107.0 123.2 31.3 324.4
Total [%] 19.4% 33.0% 38.0% 9.6% 100.0%
Software ExporterERP Specialist
Other Software

ICT in Serbia - At a Glance // 2015
42
The biggest net assets, over € 142 million, which is almost 37% of the total IT industry net assets, are held by the companies in the Software sub-sector, followed by the IT Service (28%).
Distribution of the net assets in the Software sub-sector according to software segment and company size is in the Table below.
Key comments for the table 12:
� The biggest net assets, around € 109 million and almost 76% of the total Software sub-sector net assets, are held by the companies in the “Software exporter” segment.
� With € 84 million, the SME share was 58% in Software sub-sector net assets in 2013.Table 12: Net Assets of Software sub-sector [€ million], 2013.
Source: Register of Financial Statement and Solvency, SBRA, prepared upon Mineco’s demand
Software segment
Mic
roEn
terp
rises
Smal
lEn
terp
rises
Med
ium
En
terp
rises
Larg
eEn
terp
rises
Tota
l
Software Exporter 8.1 46.7 14.4 39.5 108.7
ERP Specialist 2.1 10.6 5.1 17.7
Other Software 9.3 6.9 16.2
Total 19.5 64.1 19.5 39.5 142.7
Total [%] 13.7% 44.9% 13.7% 27.7% 100.0%
Figure 16: Structure of Software Sub-sector (%) in Net Assets
Source: Register of Financial Statement and Solvency, SBRA, prepared upon Mineco’s demand
76%
11%
13%
Software ExporterERP Specialist
Other Software

43
ICT in Serbia - At a Glance // 2015
2.2.3. ICT Clusters and Support OrganizationsSerbian IT companies have established a strong presence on foreign markets through successful marketing of their own solutions, but also by being able to provide the highest quality outsourcing services and creating solid partnerships. Thus, Serbia has emerged as a very interesting alternative location for development of sophisticated software: hour or two by plane from major European locations, harboring educated and experienced IT workforce, and delivering world-class quality while still keeping it all at the fraction of the costs in the West – no wonder the year on year growth in turnover for the past 6 years was in high 20s or low 30s percentiles!
Setting up clusters helped companies accelerating networking and reap benefits of joint activities. These clusters give necessary institutional support to performances of the Serbian IT industry and make their members visible internationally in a more structured way than it was the case in the previous years.
Vojvodina ICT Cluster – VOICT
Vojvodina ICT Cluster - VOICT provides a single point of contact with the best IT companies in Serbia, employing 2,500+ experienced IT professionals. VOICT builds long-term relationships based on trust and quality, bringing expertise, experience, and excellence to each and every project. It is a fast-growing association, leading the way for similar organizations in Serbia.
9 out of 10 VOICT members do business on foreign markets – mostly EU, North America, and Middle East. The companies from this cluster exhibited strong growth in recent years, ignoring the global recession. Serbian IT companies, in general, made a noticeable breakthrough, putting Serbia on the map as a source of top quality software services and products. VOICT is giving institutional support to this trend, mobilizing players from other domains, such as education, and government, weaving network of support.
Thanks to the University of Novi Sad, and especially the Faculty of Technical Sciences, innovation and entrepreneurship have been fuelled for many years. Today, Novi Sad is the center for IT in Serbia. Strategic objective of Vojvodina ICT Cluster is to increase visibility of Serbian information technology industry and put Novi Sad on the regional and European maps as the hotbed for IT in this part of the world.
VOICT is constantly building ever stronger network of international contacts, creating new business opportunities for its members, lobbying for improvement of business environment in Serbia and popularization of IT solutions and products, enabling more intensive penetration of these technologies throughout other sectors of Serbian economy.
The cluster has its own Cluster Academy, organizing courses, presentations, and lectures according to the needs of the members, as well as a separate Project Office that grows its projects portfolio and revenues every year, making Vojvodina ICT Cluster a leader in excellence among organizations of this type in Serbia.More about VOICT at www.vojvodinaICTcluster.org

ICT in Serbia - At a Glance // 2015
44
ICT Network Serbia Cluster – ICT Net
ICT Network Serbia is an association of companies, individuals, academic and research institutions devoted to the development of the ICT sector in Serbia. It was established in 2010 by the merger of two former cluster initiatives, Serbian Software Cluster and Embedded.rs. As a unique information hub, today, ICT Network Serbia provides its members with access to relevant and up-to-date information from the ICT industry, thus enabling them to boost their competitiveness and grow. As an open organization, it offers its members equality of opportunities and a transparent framework for efficient fulfilment of their interests. One of the Cluster’s main objectives is to encourage its members to suggest their own initiatives or projects which can be implemented either through the Cluster’s extensive network of strategic partnerships or in cooperation with other member companies. It provides its members with a variety of opportunities helping them to build greater visibility while keeping their business operations cost and time effective. Currently, the Cluster is focused on obtaining easier access to public and EU funds for its members, giving them possibility of internationalization of business operations and actively supporting their innovative and enterprising initiatives and projects.
Nis Cluster of Advanced Technologies - Ni CAT
The NiCAT is a cluster initiative that comprises 24 local companies, two scientific research institutions (Faculty of Electronic Engineering and Faculty of Mechanical Engineering - University of Niš), and three economic development support institutions (Regional Development Agency RDA South, Regional Chamber of Commerce and Business Incubator Nis). The Cluster represents companies from five different industries which include electro medicine, electronics and automation, electronics and mechanical engineering, ICT and optoelectronics.
The Niš Cluster of Advanced Technologies was formally registered in March 2011 and started its full operational work in October 2011. NiCAT cluster actively works on building the entrepreneurial ecosystem and has continuously recorded success. Its members employ about 700 people and reached a combined annual turnover of EUR 17 million in 2014. The Cluster’s goals are to increase the turnover of the cluster members both on national and international markets; strengthen the capacities of the companies for technological development and innovations, and to develop new technological products and services. Furthermore, the promotion of the City of Niš as a favorable location for business operations in the advanced technology field is also a strategic focus. In a relatively short period of time, the Niš Cluster of Advanced Technologies has implemented a significant number of things and has established partnerships with important national and international institutions. NiCAT is one of the six best clusters in Serbia.
More about NiCAT at www.ni-cat.org

45
ICT in Serbia - At a Glance // 2015
ICT Cluster of Central Serbia- ICT CS
ICT CS is a business association which gathers ICT enterprises, institutions, and organizations from Central Serbia. The cluster is based in geographical center of Serbia, in the city of Kragujevac. The cluster was established in 2013 with the goal to provide institutional support for further development of the ICT sector in Central Serbia. ICT CS aims to enhance competitiveness of ICT businesses as well as their visibility on domestic and international markets. This is the youngest IT association in Serbia, but gathers 21 members from the ranks of enterprises, institutions, and organizations: 13 companies, two faculties from the University of Kragujevac (Faculty of Science, Faculty of Engineering), 2 technical colleges, Business Innovation Centre Ltd. Kragujevac, Business Development Center Kragujevac, MSP Consulting Ltd., and Business Link.
One of the main focuses of the cluster is to create respectful knowledge base in order to strengthen impact at the regional, national, and international level through building capacities of the cluster’s members, implementation of marketing activities, development of services designed for cluster members, development of services designed according to the market needs, formulation, promotion, and provision of sources of funding for cluster’s initiatives and projects.
More about ICT CS at www.ict-cs.org
South-Eastern Europe ICT - SEE ICT
SEE ICT is a Belgrade based association with the mission to provide meaningful, deep support to start-ups and entrepreneurs improving life and work with technology. SEE ICT is developing the start-up eco-system and IT entrepreneurship in Serbia to foster higher employment and economic growth. Since 2010, more than 5,000 people went through conferences, festivals, and educational programs delivered by this association. SEE ICT established the first start-up school in Serbia, the Startup Academy, in 2012. The academy addresses the lack of entrepreneurial education and spirit among youth, high youth unemployment, and lack of knowledge about key enabling technologies among students of technical faculties. Teams that had graduated founded 20 start-up companies and raised more than EUR 2.5 million in 1st and 2nd of international investments. 50 new jobs were opened in Serbia by these young start-ups and teams. In 2014, SEE ICT focused on the development of innovative, commercial education programs, developed in tune with the needs of IT companies and the demand on the labor market, such as the iOS Academy and Wordpress Academy which enrolled more than 100 students. POTKROVLJE HUB, the pilot Hub program and space was launched and 9 companies went through it during 2013 and 2014. In 2015, the bigger, new hub (Startit Center) will be developed in cooperation with municipality of Savski Venac, Belgrade, to cover the growing needs of young companies and freelancers for working space,

ICT in Serbia - At a Glance // 2015
46
mentoring, and education. The Center will provide networking, education, information, and motivation to young people with entrepreneurial potential in a creative, co-working space with attached legal, financial, and administration support. SEE ICT also runs the leading tech and entrepreneurship blog – Startit.rs, visited by more than 30,000 people every month, and in 2014, launched a job board within it, Startit Poslovi, for IT jobs, quickly becoming the biggest job board of this sort in Serbia, with more than 400 jobs offered by various IT companies.
Serbian Chamber of Commerce
The Chamber of Commerce and Industry of Serbia also serves as a good role model in mobilizing and networking ICT sector companies and professionals. The Chamber’s Association of Information Technologies and its four groups: for hardware, software, communication, and e-commerce, gather all Serbian IT companies.
The Chamber has good communication lines and potential for policy advocacy, recognized by ICT companies. In cooperation with line ministries, SIEPA, clusters and business and professional organizations, the Chamber is active in organizing conferences, forums, international and domestic fairs, vocational training, and other events that serve the purpose of development in the ICT sector. The Chamber is also active in organizing B2B events, networking Serbian ICT companies with their peers from the Western Balkan region and other countries.
Joint Cluster Initiatives
In 2012 the three ICT clusters – ICT Net, Ni CAT, and VOICT – signed the Strategic Partnership Agreement, while the fourth cluster, ICT Cluster of Central Serbia, joined this agreement in 2014. This partnership rapidly turned into a platform for the development of joint activities and coordinated efforts which include support to the publication of the “ICT in Serbia – at a Glance” study and a number of joint events and conferences. This strategic alliance also forms the basis for advocacy initiatives on industry-specific issues on a broad range of issues like education and the improvement of business environment.
These activities include the Serbian-German IT Business Dialogue which was initiated in mid-2012 with the help of the Gesellschaft für Internationale Zusammenarbeit (GIZ) GmbH, as well as Scandinavia IT Business Bridge initiative, started in 2015 and helped by USAID REG project. These initiatives provide an open framework which brings together major Serbian stakeholders with private and public sector stakeholders from the ICT industry in Germany, Austria, Switzerland, Sweden, Norway, Denmark, and Finland, such as clusters, associations, investment and export agencies, relevant ministries, chambers of commerce, NGOs, R&Ds, etc. The objectives of this framework include increasing market knowledge, new business opportunities, stakeholder coordination and cooperation, organization of joint B2B events, and development of joint (EU) projects.

47
ICT in Serbia - At a Glance // 2015
Another important cluster initiative is the Serbian Cluster AssociatioN – SCAN, established in 2015 by the leading clusters. The association is well positioned to take the main role in further development of clusters in Serbia, asserting the position of the key partner for the Serbian Government and other players.
SCAN initially gathered clusters from information technology, automotive industry, fashion and textile industry and metal processing, and is expected to grow fast.
More about SCAN at: www.aska.org.rs
2.3. EDUCATION AND HUMAN RESOURCE DEVELOPMENT
This chapter provides the following information:
� An overview of ICT labour market in Serbia � ICT and higher education in Serbia � Cooperation between Universities and the Private Sector � ICT and vocational trainings
According to the Serbian Republic Statistical Agency (Chapter Education) in 2012/13 school year, 97.2% of the population participated in primary education level, 88.5% in secondary, and 45.9% in tertiary education level.
Number of students in tertiary education increased by 3.1% in 2012/2013 school year. Coverage of generation attending faculties and higher schools is about 45.9%, showing further tendency of slight increase.
In 2012/2013 school year, 38,216 out of 238,945 students are in the technical areas (engineering, manufacturing, and construction). The number of students associated with technical skills is rising year by year.
2.3.1. Overview of the ICT Labour Market Total number of graduates in the technical areas is 7,473, which is 16% of all graduate students in 2012 (47,797). Besides this number, 4,851 more graduates come from natural sciences and mathematics. In general sense, all these graduates can be significant for ICT sector.
In 2012, 4,251 ICT experts have graduated, thereof 2,338 at the first level degree (B.Sc), 1,834 at the second level (M.Sc), and 79 at the
Figure 17: Number of Students (vocational and academic) with ICT Titles, in 2012
Source: Mineco 2014
I Level (B.Sc)2,33855%
II Level (M.Sc)1,83443%
III Level (Ph.D)792%

ICT in Serbia - At a Glance // 2015
48
third level degree (Ph.D). There is certain amount of the graduated in 2012, who had enrolled at their studies before the Bologna reforms of the Serbian High Education. In addition, the quotes for new ICT related enrolees rise year after year.
According to the Skills Gaps Study which was done by USAID in 2008, technical skills on Serbian ICT labor market are strong and stable (software development, hardware design, IT services, and system integration). The same study shows that at the surveyed IT companies, 63% employees are industry specific, while remaining 37% are in managerial and administrative positions. Around 21% employees are at general management positions, project managers, and sales.
The study also acknowledged that the number of marketing and sales managers is very low (only 1%, according to USAID), although these positions are recognized by experts and local companies as very important for future development and growth.
2.3.2. ICT and Higher EducationThe tradition of training personnel in electrical engineering in Serbia is over one century long. The need for staff qualified in informatics was recognized in 80s within the Faculty of Electrical Engineering, Faculty of Mathematics, and Faculty of Organizational Sciences, in Belgrade; Electronic Faculty in Nis; Faculty of Technical Science and Faculty for Natural and Mathematical Sciences, in Novi Sad. With around 1,000 yearly graduated IT experts, the above-mentioned Faculties make the backbone of Serbian high education (Tertiary-type A) in the IT area, as well as the base for research and development in this area. There is almost the same number of IT experts, graduated from other departments, with skills related to informatics. Tertiary-type A education is of strategic importance for ICT industry developing capacities.
In Serbia, ICT education is held at 40 High Education institutions distributed in 21 cities, which helps recruiting a wide base of ICT students.
The Serbian ICT sector absorbs the vast majority of ICT graduates. This has not always been the case as for years Serbia has faced a massive “brain drain” of ICT graduates and professionals. Considering today’s growing demand for ICT products and services, which is a general trend not only in Serbia but throughout Europe, Serbian educational institutions face the challenge of attracting even more students and supplying more experts to the market.
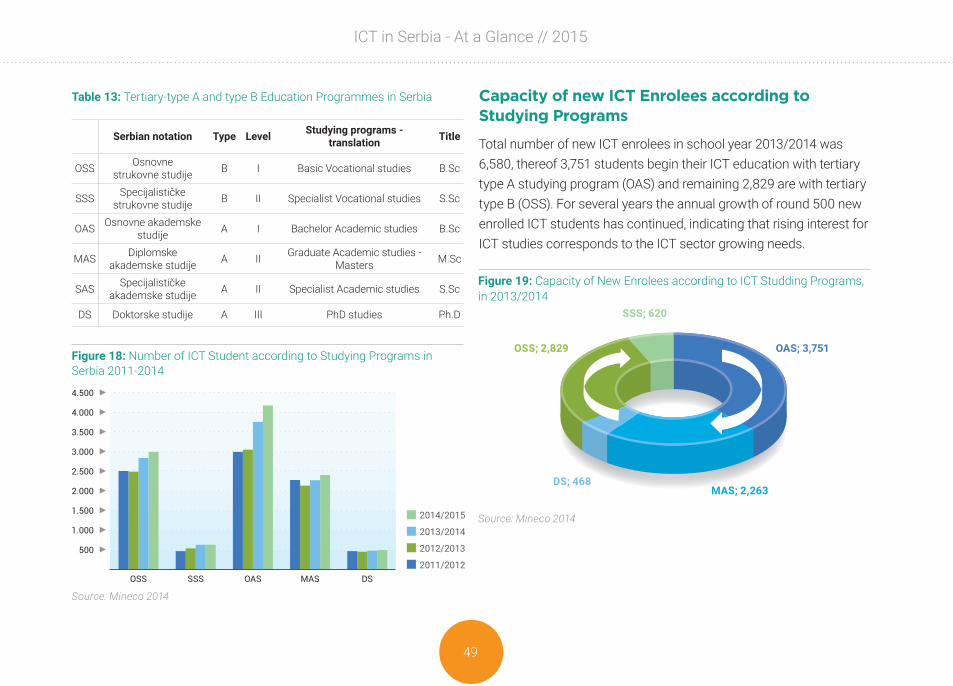
49
ICT in Serbia - At a Glance // 2015
Capacity of new ICT Enrolees according to Studying Programs
Total number of new ICT enrolees in school year 2013/2014 was 6,580, thereof 3,751 students begin their ICT education with tertiary type A studying program (OAS) and remaining 2,829 are with tertiary type B (OSS). For several years the annual growth of round 500 new enrolled ICT students has continued, indicating that rising interest for ICT studies corresponds to the ICT sector growing needs.
Figure 19: Capacity of New Enrolees according to ICT Studding Programs, in 2013/2014
Source: Mineco 2014
OAS; 3,751OSS; 2,829
SSS; 620
MAS; 2,263DS; 468
Table 13: Tertiary-type A and type B Education Programmes in Serbia
Serbian notation Type Level Studying programs -translation Title
ОSS Osnovnestrukovne studije B I Basic Vocational studies B.Sc
SSS Specijalističkestrukovne studije B II Specialist Vocational studies S.Sc
ОАS Osnovne akademske studije A I Bachelor Academic studies B.Sc
MAS Diplomske akademske studije A II Graduate Academic studies -
Masters M.Sc
SAS Specijalističke akademske studije A II Specialist Academic studies S.Sc
DS Doktorske studije A III PhD studies Ph.D
Figure 18: Number of ICT Student according to Studying Programs in Serbia 2011-2014
Source: Mineco 2014
2014/2015
2013/2014
2012/2013
2011/2012

ICT in Serbia - At a Glance // 2015
50
Key messages on the table and figure 19:
� The OAS (dark blue colored) presents the first level degree of tertiary-type A education (B.Sc.) and is, to a high extent, (2,263 candidates or 60%) continued with further studies towards MAS and second level degree (M.Sc), thus securing HR for ICT development
� For the most successful in tertiary type A education, the studies are completed with DS (Doctor studies) and third level degree (Ph.D.), for which 468 places are provided.
� The education that begins with the OSS (dark green colored) preserved mostly B.Sc. ICT experts (2,829 candidates), thereof only 620 candidates (22%) continued the (SSS) specialist studies, which shows the practical character of these studies.
Number of New ICT enrolees according to Cities – Geographical Availability
In Serbia, there are 21 cities where ICT studies are held giving very good geographical availability. Education of personnel near industry centres is Serbian historical (traditional) heritage and that happens to be a good practice. Unfortunately, in the past two decades, industry was almost completely suppressed, but these preserved education capacities give the hope that faster economic recovery is possible.
Figure 20: Number of New ICT Enrolees according to Cities, in 2013/2014
Source: Mineco 2014

51
ICT in Serbia - At a Glance // 2015
Number of New ICT Enrolees according to the Faculties’ Founders
ICT program is held at 40 High Education institutions: 16 state owned universities, 7 private, 15 state owned (Vocational) Colleges, and only one private College.
Low number of students opt for private faculties, only 750 (11%). This is because the state-owned faculties have tradition and studying expenses in their favour. More than 80% of ICT studies held at the state-owned faculties are covered by funds from the state.
Number of ICT Enrolees and Enrolment capacity – Estimations and Trends
More than 12% of all Serbian newly enrolled students in 2013 were ICT enrolees (6.580), which is a clear indicator of interest of Serbian young people in studies related to informatics. The overall enrolment capacity of around 9,500 is bigger, because all studying programs are split into three level degrees. After the first level degree (B.Sc academic title), a student can continue studies towards second (M.Sc.) and third level degrees (Ph.D). Therefore, a student can achieve several academic titles during their studies. Consequently, the number of future ICT experts is limited to the number of new ICT students, but not to the number of academic titles achieved in that year (which we call here “overall enrolment capacity”).
Therefore, the consolidated data show the structure in which the first level degree graduates are mostly expected (3,229 or 53.0%); following are the second level degree graduates (2,415 or 39.0%) and, finally, as expected, the lowest number of the third level degree (468 or 8.0%).
Realistic estimation is that Serbia can count on around 3,000 ICT experts out of 4,251 ICT experts graduated in 2012, as remaining number continued their studies towards the second and third level degree.
The reform of the University education sector (according the Bologna reform) and raising the number of ICT profiled experts are
Figure 21: Number of New ICT Enrolees according to Faculties’ Founders, in 2013/2014
Source: Mineco 2014
State owned University 3,396
52%State owned (Vocational) 2,254
34%
Private Vocational 180
3% Private University 750
11%
ICT in Serbia - At a Glance // 2015
52
yet to show their positive results in the years to come. It seems reasonable to expect that Serbia will have more than 3,500 new ICT experts on an annual basis.
The present analysis covers only technical and technological professions and does not include around 800 IT graduated students from economic and around 500 from mathematical science. Additionally, the corpus of mechanical engineers of almost 1,500 graduated per year is interesting from the aspect of HR with ICT skills.
Cooperation between Universities and the Private Sector
Although cooperation between universities and the private sector in Serbia is still insufficient, successful cooperation between companies and universities has been reported by the Faculty of Technical Sciences at Novi Sad University and at the group of faculties of technical sciences of the University of Belgrade. This trend continues with signing of the Strategic Cooperation Contract between the University Novi Sad and Vojvodina ICT Cluster in December 2012, promising a more intensive cooperation.
ICT and Vocational Trainings
According to the results of the Regional Capability Survey presented in the OECD report, only 13.3% of enterprises provided training to their IT experts, and 10.1% of these did so within their own firms (OECD 2009, p.197).
The most prominent institutions that provide informal trainings and certifications for technical skills are Microsoft and Cisco. More recently, Vojvodina ICT Cluster joined the efforts in the field of informal education for ICT through establishment of its own Cluster Academy. Apart for facilitation of trainings according to the needs of employees in member companies (SCRUM, ISTQB, soft skills), it facilitates informal courses to supply more entry-level programmers to the ICT sector.
Microsoft in Serbia has two major educational programs: (1) academic programs (MSDN Academic Alliance and IT academy) for accredited educational institutions in Serbia and (2) partner in learning program for individuals and educational institutions providing trainings for teachers, instructional resources, and e-learning for teachers. The program of the IT academy prepares students for jobs such as: network administrators, technical support, programmers, designers and programmers for MS office, and also for receiving Microsoft certificates. Five faculties and one University are members of the Microsoft IT academy.
CISCO Entrepreneurship Institute (CEI) in Serbia and Southeast Europe has been established at the Faculty of Technical Sciences at the University in Novi Sad, as a result of cooperation between CISCO, entrepreneurship education on a commercial basis to Serbian entrepreneurs, SMEs, and public sector employees in the following areas: Starting a Business, Growing a Business, and Business and Public Service Improvement through ICT. The CEI

53
ICT in Serbia - At a Glance // 2015
also provides training and certificates in various programs such as: IP Communications, Routing and Switching, Security, as well as training for technical staff including Curriculum Planning Service and access to comprehensive technical knowledge library.
However, the need for project management trainings (SCRUM), standards/maturity models (CMMI, etc.) is still obvious.
Vojvodina ICT Cluster came up with the idea for ICT Cluster Academy Serbia to try and mitigate the problem with lack of programmers to a certain level. In 2014, VOICT and NiCAT clusters got the USAID Local Economic Development project support to implement the project in Novi Sad and Nis. Six-month training with a lot of hands-on learning through internship in companies gave very good results: some 50% of trainees in both cities got employed already during their internship. After this, the four Serbian IT clusters are in the process of development of an informal education model at the national level.
Available Skills and Skills Gaps
The OECD study concludes that strong technical knowledge, coupled with the development of soft skills and a deeper understanding of business processes and verticals, would give Serbia a leading position for attracting IT operations from abroad.
Although limited in overall number, Serbian IT workforce consists of highly qualified IT graduates/engineers with reasonable
labor costs. More than 90% of the annual turnover of Serbian IT outsourcing companies is generated on foreign markets, which indicates that there is no technology gap.
Serbian companies carry high potential, but often have no clear specialization and understanding of business processes. There is an obvious need for networking and linking of companies and market intelligence.
2.4. RESEARCH AND DEVELOPMENTThis chapter provides the following information:
� Current situation regarding R&D in Serbia in general � ICT R&D in Serbia: Infrastructure, Centres of Excellence � EU support dimension
2.4.1. Current Situation Regarding R&D in Serbia - in General and ICT Related
In Serbia, there are 14,643 scientists involved in research and development that is carried out at 60 registered scientific and research institutes and 101 faculties. Most of them are State founded as well as the largest research organizations from the business sector. To avoid misunderstanding about the business sector presence, it is to be mentioned that the official statistics only cover market-oriented institutes which are State founded (e.g. IMP, IRITEL).

ICT in Serbia - At a Glance // 2015
54
Key messages in the table 14 and figure 22:
� 14,643 – Number of researchers in Serbia, and 12,342 – Number of researchers according to FTE (Full time Equivalent) in Serbia, 2013.
� The Serbian business sub-sector counts only 489 researchers. This indicates that only state-owned companies are covered by official statistics.
� In the total number of researchers, in 2013, the business sector was involved with 3.3%, government sector with 21.4%, higher (tertiary) education with 75.2%.
� The number of the researchers employed in the R&D increased in 2013 by 10.5% compared to the previous year, and 27% in comparison to 2008.
� In the total expenses for the R&D (€ 249 million) in 2013, the share of gross investments (investments in infrastructure) is 5.2% while 94.8% are actually salaries for researchers (69.4), and rest (25.4%) for the costs of experiments and operating expenses.
Table 14: Number and Dynamics of Researchers in Serbia, 2008-2013.
Source: Statistical Office of the Republic Serbia
Sector2008 2013 Trend 2013/2008
Number2008
Share2008
Number2013
Share2013
Growth (%)
GainedPoint
Business 372 3.2% 489 3.3% 31.5% 0.1%
Government 2,738 23.7% 3,133 21.4% 14.4% -2.3%
HighEducation 8,412 72.9% 11,015 75.2% 30.9% 2.3%
Other 12 0.1% 6 0.0% -50.0% -0.1%
Total 11,534 100.0% 14,643 100.0% 27.0% 0.0%
Figure 22: Number of Researchers in Serbia by Sector, 2008-2013.
2008
2009
2010
2011
2012
2013

55
ICT in Serbia - At a Glance // 2015
In the diagram above, three components are compared simultaneously: (1) gross domestic expenditure on R&D as a percentage of GDP; (2) Number of researchers, per thousand employed; (3) R&D volumes in Euros.
According to the level of investment in R&D (around 0.9% GDP-a) and R&D value in 2013 (€ 249 million) Serbia is positioned low. On the other hand, with 14,643 researchers, which is about 8.0‰ of total employees, Serbia is at the world average. According to the Lisbon declaration, financial resources for R&D, for EU members and candidate countries, which pretend for membership, should reach 1% of GDP from national budget and 3% of GDP in total.
Value of all investments in Serbian R&D is even not comparable to the world renowned universities or institutes whose annual budgets are above € 1 billion – each. The Government strategic goal for investment in R&D from national budget, excluding infrastructure, to reach 1% GDP, will not be achieved till the end of 2015. It stopped halfway (around 0.5%).
The financing of Serbian science faces the problem of the small amount coming mainly from one source and then being split on a number of projects (more than 1,000, thereof 471 projects in the area of technological development)
The Government plays an active role in strengthening the Serbian ICT R&D capacities for the three main reasons: (1) R&D (and ICT R&D) polices are set at the national level; (2) majority of ICT R&D
Figure 23: R&D in OECD and non-OECD Countries, 2013
Source: OECD Science, Technology and Industry: Scoreboard 2013, Mineco 2014Gross domestic expenditures on R&D as a percentage of GDP
Rese
arch
ers,
per
thou
sand
em
ploy
men
t
R&D Volumes in 2005 USD - constant
prices and PPP1 Billion
10 Billion
100 Billion
BRIICS North AmericaEU27Other OECD members

ICT in Serbia - At a Glance // 2015
56
activities are funded by Government institutions; and (3) majority of relevant ICT R&D research institutions are state-owned.
The total budget for science in 2013 was € 249 million, and around 6% was allocated for both Electronics and telecommunications and Industrial software and informatics.
The private sector in Serbia is only tangentially involved in ICT R&D and the role of ICT R&D business sector in Serbia is a modest one. There is low or no connection to ICT R&D institutes. However, companies from private sector are business oriented and long for applied solutions. Between these steps, currently hidden potential for R&D lies. The Government almost exclusively follows up and regulates the relationships inside ICT R&D area of state-own entities and their financing.
Although the Serbian ICT R&D system is of inadequate efficiency, this sector is alive and active, mainly thanks to the ingenious isolated individuals. A number of activities seems to come from a single or small group of individuals, who invest their knowledge, expertise, authority, and energy – with no or insufficient government support.
Serbian ICT R&D Legal and Policy Framework
The Strategy for Information Society Development and the Strategy for Science and Technological Development (2010-2015) are the key policy documents for continuing ICT R&D development in Serbia. The main document defining the ICT R&D operational framework
in Serbia is The Action Plan for Implementation of the Strategy for Science and Technological Development in Serbia 2010-2015. Unfortunately, this Action Plan was expected to be adopted before the end of 2009, but in 2014 this plan did not exist, yet. The absence of this Action Plan illustrates typical destiny of the most adopted Serbian strategies - dead letter. Consequently, the main function of strategies is reduced to fulfilling the conditions for obtaining candidature for process of joining EU. In brief, if Serbia wants to get closer to the EU, the progress in R&D area has to be far more efficient, faster, and supported by Legal and Policy Framework. Without this support, ICT R&D will develop spontaneously as it has so far, but it could be too slow for EU integrations.
ICT R&D Infrastructure
The analysis based on desk research shows that current infrastructure for ICT R&D activities in Serbia is undeveloped due to low and irregular investments, inadequate – due to short amortization period of this type of equipment and discontinuity in upgrades or renewing, and only partially meets the real needs of Serbian science and research.
Considering planned infrastructure for ICT R&D activities, the main Government plans are connected to the Government project for investment in Serbian R&D infrastructure, SEE Light project, National Supercomputing and Data Storage Centre Project – Blue Danube. For sure, the most important is the Serbian R&D infrastructure investment initiative.
57
ICT in Serbia - At a Glance // 2015
The Government Project for investments in infrastructure, worth € 400 million started in March 2010 and is projected to last till the end of 2015. The budget planned for the ICT infrastructure is between € 50-80 million.
On 04/03/2010 in Belgrade, the European Investment Bank (EIB) and the Serbian Government signed a € 200 million loan for the Public Sector Research and Development (R&D) project. The project, with an estimated investment cost of € 420 million, concerns a series of investments aimed at revitalizing the country’s public R&D activity. The investments include the upgrading of the existing infrastructure, the creation of a centre for promotion of science, the construction of accommodation for students and young scientists, and creation of centres of excellence in priority research fields. Not even a half of the great plans were implemented before the end of 2014. There is an impression that the focus and priorities have been lost. This could bring the Serbian R&D into hard situation after EIB funds have been spent.
ICT R&D Centres of Excellence (CoE)
As a new institutional form - the Centre of Excellence (CoE) was established in Serbia in mid-2008 according to the Law on Research Activities and following the Rule Book and prepared by the National Council for Science and Technological Development. The appearance of CoE in Serbia is more than 5 years late in comparison to EU12 countries.
As in Serbia this type of entity has just begun to develop, it will take significant amount of time and money to achieve its full implementation in the following 3-5 years. The existing CoE as real leaders of ICT R&D activities in Serbia have not been recognized yet. This should happen in the time to come.
Potential CoEs in this analysis include ICT R&D organizations and research units with necessary critical mass of knowledge, resources, and infrastructure, capable of achieving research results.
The adopted criteria for identifying the potential CoE is primarily based on the total number of ICT R&D researchers at particular research unit (not whole organization) combined with achieved success in FP7-ICT projects. Whenever it was possible (based on the public available data or good estimation), the number of implemented projects and number of published scientific works were taken into account. In addition, the high expertise and/or market approval in ICT area of the entities were considered. Based on the criteria above, the selected entities were classified into three groups of potential CoE: a) centres of competence, b) centres of potential for FP7-ICT and c) centres of best practice. One entity was classified into not more than two categories.

ICT in Serbia - At a Glance // 2015
58
(a) Centres of Competence are entities with significant number of published scientific works and implemented projects, which have a number of researchers with PhD. In this group, the majority comes from relevant state owned organizations (faculties’ departments and institutes).
(b) Centres of Potential for FP7-ICT are entities that have been successful in FP7-ICT Theme.
(c) Centres of Best Practice – are exclusively ICT companies (from business and industry sector) which have good market reputation and strong reference list and have been “recognized and well known by specific expert community” or “recommended from the person of authority (in specific area)”.
72 organizations have been identified as potential CoE: 40 centres of competence, 9 centres of potential for FP7-ICT and 30 centres of best practice.
The authors are aware that the presented list is not the complete one. There are ICT entities which have participated in FP7 projects, both successfully and unsuccessfully, in non-ICT areas which have been excluded. In addition, there are ICT entities (research groups and individuals) inside organizations whose basic field of work is not ICT.
Table 15: Centres of Potential for FP7-ICTin Serbia
Source: CORDIS, 2014
ORGANIZATION Number of participationsin FP7-ICT
ERICSSON DOO 8
INSTITUT MIHAJLO PUPIN 7
ETF, UNIVERSITY OF BELGRADE 4
DUNAVNET DOO 4
CIM GRUPA DOO 4
FTS, UNIVERSITY OF NOVI SAD 4
TELEKOM SRBIJA A.D. 3
NISSATECH INNOVATION CENTRE DOO 3
BITGEAR WIRELESS DESIGN DOO 3
BIOIRC D.O.O. KRAGUJEVAC 2
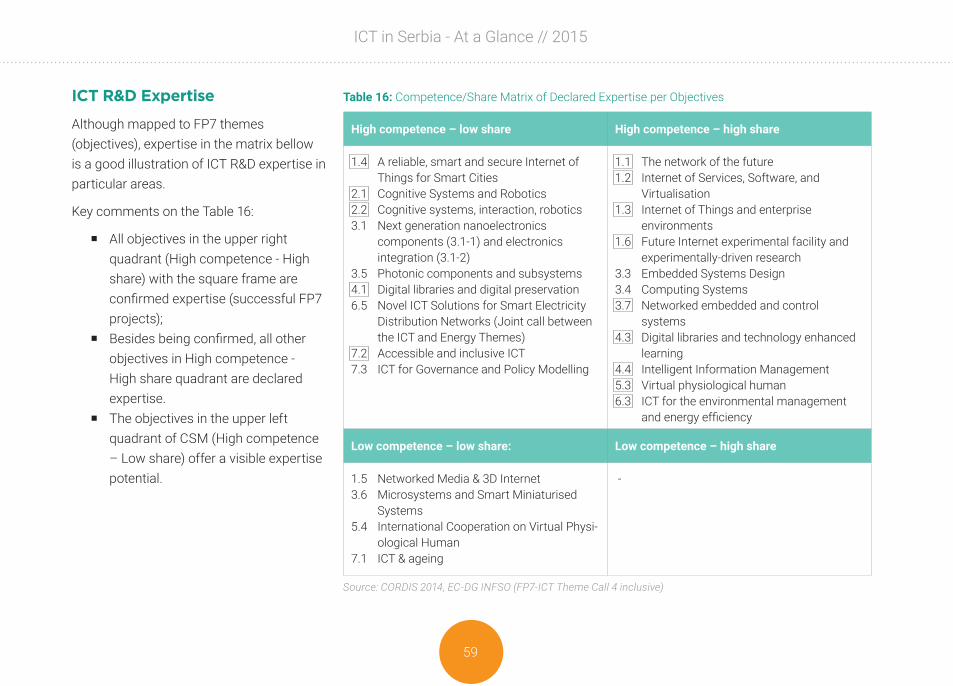
59
ICT in Serbia - At a Glance // 2015
ICT R&D Expertise
Although mapped to FP7 themes (objectives), expertise in the matrix bellow is a good illustration of ICT R&D expertise in particular areas.
Key comments on the Table 16:
� All objectives in the upper right quadrant (High competence - High share) with the square frame are confirmed expertise (successful FP7 projects);
� Besides being confirmed, all other objectives in High competence - High share quadrant are declared expertise.
� The objectives in the upper left quadrant of CSM (High competence – Low share) offer a visible expertise potential.
Table 16: Competence/Share Matrix of Declared Expertise per Objectives
Source: CORDIS 2014, EC-DG INFSO (FP7-ICT Theme Call 4 inclusive)
High competence – low share High competence – high share
1.4 A reliable, smart and secure Internet of Things for Smart Cities
2.1 Cognitive Systems and Robotics2.2 Cognitive systems, interaction, robotics3.1 Next generation nanoelectronics
components (3.1-1) and electronics integration (3.1-2)
3.5 Photonic components and subsystems4.1 Digital libraries and digital preservation6.5 Novel ICT Solutions for Smart Electricity
Distribution Networks (Joint call between the ICT and Energy Themes)
7.2 Accessible and inclusive ICT7.3 ICT for Governance and Policy Modelling
1.1 The network of the future1.2 Internet of Services, Software, and
Virtualisation1.3 Internet of Things and enterprise
environments1.6 Future Internet experimental facility and
experimentally-driven research3.3 Embedded Systems Design3.4 Computing Systems3.7 Networked embedded and control
systems4.3 Digital libraries and technology enhanced
learning4.4 Intelligent Information Management5.3 Virtual physiological human6.3 ICT for the environmental management
and energy efficiency
Low competence – low share: Low competence – high share
1.5 Networked Media & 3D Internet3.6 Microsystems and Smart Miniaturised
Systems5.4 International Cooperation on Virtual Physi-
ological Human7.1 ICT & ageing
-

ICT in Serbia - At a Glance // 2015
60
2.4.2. EU Support Dimension
The Seventh Framework Programme (FP7)
EU Commission, which financed the R&D of Serbian researches through the Seventh Framework Programme (FP7) is the most significant international partner for Serbian science. FP7 spans the period from 2007 to 2013, with a budget of € 50.5 billion. On the basis of the Memorandum of Understanding signed by the Republic of Serbia regarding its Association to the EU Seventh Framework Programme for Research and Technological Development as well as experimental activities, Serbia obtained the status of Associated Country on June 13, 2007.
On the basis of statistical data for the first five years of the programme (by the end of 2011), the researcher groups from Serbia participated in the preparation of 1,161 draft projects applied for. Of that number, 154 projects were granted funding, making a success rate of 13.2%. After FP7 finished in 2014, the European Commission provided the data that the overall record is 292 participants from Serbia who received € 52.2 million.
The data on the amount allocated in the fund for Serbian scientist participation in FP7 Programme are not available. It is estimated that Serbian balance considering this matter is positive, meaning that at the national level, the amount withdrawn from FP7 is slightly higher than the participating one. Anyway, Serbian participation in these projects budget is low, only 0.001% of the total FP7 budget.
However, the benefits of international cooperation are far more significant.
Participation in FP7-ICT Theme
The brief estimation at the level of financial EU FP7 support for Serbian ICT R&D is under assumption that all Serbian participants in all FP7 projects get the same part of contracted money. Based on this assumption, the ICT R&D in Serbia will get 1/7 of the total sum, or € 5.0 million for five years. If other multidisciplinary cooperation (Joint Call) strongly connected to ICT is taken into consideration, the FP7 contribution to the Serbian ICT R&D sector will be around € 2 million per year.
In the FP7-ICT Theme (Call 4 inclusive), the EU countries achieved the success rate of 15.0% (with 5586 submitted proposals and 840 approved). At the same time, Serbia accomplished higher passing rate of 15.6% (with 77 submitted and 12 approved proposals). There is a visible contradiction between successes of Serbian applicants (among 38 most influential countries, Serbia is ranked 8th) and a small share in number of projects (among the 38 most influential countries, Serbia is 28th). This indicates either lack of critical mass of researchers or their modest interest in FP7-ICT participation. Serbia is still among the countries with the lowest number of participants.

61
ICT in Serbia - At a Glance // 2015
Table 17: Serbian Scientist Participation in FP7 Programme
Source: CORDIS, 2014
FP7 - ACTIVITY FP7-PROJECTS Number of participation
Energy FP7-ENERGY 10
Environment (including Climate Change) FP7-ENVIRONMENT 20
Food, Agriculture and Fisheries, Biotechnology FP7-KBBE 23
Health FP7-HEALTH 7
Information and Communication Technologies FP7-ICT 48
Nanosciences, Nanotechnologies, Materials & New Production Technologies FP7-NMP 6
Security FP7-SECURITY 5
Socio-economic Sciences and the Humanities FP7-SSH 5
Space FP7-SPACE 1
Transport (including Aeronautics) FP7-TRANSPORT 11
ICT in Serbia - At a Glance // 2015
62
Horizon 2020 (H2020)
After finishing the FP7, the new program - Horizon 2020 started. It is the biggest EU Research and Innovation programme ever, with nearly € 80 billion of funding available over 7 years (2014 to 2020) – in addition to the private investment that this money would attract. It promises more breakthroughs, discoveries, and world-firsts by taking great ideas from the lab to the market.
Serbia sees its chance in equal participation in H2020. However, there is a potential for a big financial risk. In previous FP7 Programme, Serbian participation in total budget fund was around 0.001%. Realistic assumption is to presuppose that Serbian participation in HORIZON 2020 could reach 0.002% of its total budget, which would make round € 160 million for the period 2014-2020. On the other hand, it is hard to expect that the participation of Serbian organizations is going to double in comparison to FP7. This would virtually mean that poor Serbian economy becomes a financer for rich EU science. In order to avoid this threat, it is necessary to include monitoring system for tracking balance between national budget participation in H2020 and inflows of the research organizations through obtained projects.
Serbia is oriented to the EU cooperation programmes, which is illustrated with a number of common scientific papers in 2012. The most fruitful R&D cooperation is with the USA, mainly thanks to Serbian science diaspora. Cooperation with Germany and Italy follows. CERN cooperation is positioned for itself and on the fourth
place, right before cooperation with England. It is understandable that EU scientific area plays an important role for Serbia and its R&D.
Participation in H2020-ICT Theme
The first ICT-Leadership in Enabling and Industrial Technologies (LEIT) Work Programme under H2020 provides a balanced response to the main challenges faced by Europe in the field: firstly, the need to maintain a strong expertise in key technology value chains; secondly, the necessity to move faster from research excellence to the market.
Serbian R&D organizations should get information on H2020 themes and objectives and map their expertise, accordingly. In addition, it is of great importance for Serbian research teams to take part in ICT-LEIT activities thus expressing their higher interest in international cooperation as well as strengthening their skills and expertise.
Six main activity lines have been identified as compatible with Serbian R&D in the ICT-LEIT part of the Work Programme:
� A new generation of components and systems � Advanced Computing � Future Internet � Content technologies and information management � Robotics � Micro- and nano-electronic technologies, Photonics

63
ICT in Serbia - At a Glance // 2015
SOFTWARE SECTOR –OPPORTUNITIES ON INTERNATIONAL MARKET
This chapter deals mainly with Serbian software sector that is composed of companies whose specific focus is on the international market and providing: software product, software licences, and IT services development. The chapter covers the following information on the export oriented software sector as an important part of the IT industry:
� Export oriented software sector - Current situation � IT added value � Trend and potential � Combined Profile of Top 15 export oriented software
companies � SWOT – Opportunities and Barriers
3.1. SOFTWARE EXPORT SECTOR - CURRENT SITUATION
Identification and evaluation of Serbian Software sector has to rely on description of the current situation in Serbia, local and global IT trends identification and analysis, and on the potentials for Serbian companies that are arising from identified trends. [Source: SITO, 2014]
Total of 180 active enterprises, whose predominant activity (revenue) is software and IT service export, create the Serbian software export sector in 2013. Total number of employees is 5,273 and represents 29.8% of the total IT workforce in Serbia. The average number of employees is 29 and average revenue and added value - per employee, were € 45,000 and € 39,000, respectively.

ICT in Serbia - At a Glance // 2015
64
Total revenue of the outsourcing sector is € 239 million, while Serbian computer and information services export is by 27% higher (€ 304 million). The difference between these two amounts partly comes from the large system integrator and software companies export, while their predominant revenues are from their activities on the local market.
Apart from that, the big IT international players present on the Serbian market through their local branches, such as MICROSOFT; IBM, HP, CISCO, ORACLE, and SAP, are largely on their corporate budgets, which makes their currency inflow obvious.
3.1.1. Who Are the Software exporters in Serbia?
A magic quadrant is used to illustrate the present Serbian Software export scene and those who have recognized the chance and got involved in exporting. The diagram below shows the two dimensions of the Software exporter: ownership and organizational form. The quadrant is divided into four regions: the vertical axis represents the ownership: local/foreign, and the horizontal axis the organizational form: business company (LLC)/others.
Table 18: Basic Business Indicators of Software export sector vs.Top 15 in 2013.
Source: Mineco, 2014
Software export sector 2013 Top 15 Index -Top 15 (%)
Number of Companies 180 15 8.3%
Workforce. Number of Employees 5,273 2,192 41.6%
Average Number of Employees 29 146 503.9%
Revenue (€) 239 million 148 million 61.9%
Revenue per capita (€) 45,000 67,000 148.9%
Added Value (€) 208 million 130 million 62.8%
Added Value per capita (€) 39,000 60,000 153.8%
Net Assets (€) 108 million 73 million 67.7%
Net Assets per head (€) 21,000 33,000 157.1%
Table 19: The ownership and organizational form of leading Software exporter 2013
Source: Mineco, 2014
Other Business company (LLC)
Fore
ign
Ow
ners
hip Branch-office
Employment agencies
(4)
SCHNEIDER ELECTRIC DMSGTECHLEVI 9 GLOBAL SOURCINGELSYSYOUNGCULTURE (1)
Loca
lO
wne
rshi
p Free-lance(IndividualsStart-upsEntrepreneurSmall agencies) (3)
RT-RKNORDEUSPSTECHEXECOMCOMTRADE S.E. (2)
65
ICT in Serbia - At a Glance // 2015
Key observations from the magic quadrant are:
� In the first quadrant (1), top five Software exporters with foreign ownership are listed representing the major outsourcing resource in Serbia: in revenue, number of employees, and in investments. Big investments in this sector started with SCHNEIDER ELECTRIC DMS NS since October 2012, while GTECH (USA) has been characterized with smaller, but continuing investments for more than a decade. These two leaders are focused on their own products development, for their needs on the global market. Mostly, others from the first quadrant are Outsourcers who provide programming (writing codes), testing software, designing websites, and developing solutions in embedded industry.
� The second quadrant (2) includes very important Software export business companies owned locally. Five companies listed in this quadrant are the leading ones among numerous domestic software export companies.
� In the third quadrant (3), there are entities with local ownership, categorized as “Others”- which denotes freelancers. The specific significance of the free-lance market has to be further explored as, on the one hand, this group involves an unknown number of readily available skills and expertise and, on the other hand, a large group of individuals without the economic basis or chance for
permanent employment, with all the difficulties coming with this status. In this quadrant, one of the common forms of software business organisation is a small entrepreneur’s agency. Finally, this quadrant may also include start-ups at incubators, innovation centres and clusters. Start-ups should be supported and stimulated as one of the transitional forms from freelance to company status. Educational and motivational programs could help relocating significant Outsourcing corpus from quadrant (3) – freelance to quadrant (2) – business companies.
� The fourth quadrant (4), which contains branch-office and employment agencies, represents the informal set of business activities, which foreigners use before the formal beginning of the outsourcing. For now, greenfield investments are more often present in Serbian outsourcing, while acquisitions, although less frequent, are reserved for the biggest deals (for example SCHNEIDER ELECTRIC DMS and GTECH). More acquisitions are expected in the future, as practice shows that companies with revenue exceeding € 5 million become interesting to foreign investors.
Local branches of big international players: MICROSOFT; IBM, HP, CISCO, ORACLE, and SAP are also classified in the fourth quadrant (4). Although software export is not on their business line, their main business activities are significant part of IT service export from Serbia.

ICT in Serbia - At a Glance // 2015
66
3.1.2. Added Value in the Serbian IT IndustryAdded Value can be defined as the difference between a final selling price of a particular product and the direct and indirect input used in making that particular product (see Terminology). The importance of Added Value as parameter comes from the spotted rule: high Added Value provides high profitability.
Serbian IT companies have accomplished Added Value amounting to 664 million, which is 44% of the IT industry revenue in 2013. This amount makes 2% Serbian GDP - an obvious increase in comparison to 1.2% three years before.
Key comments for the figure 24:
� Software sub-sector with 41% share achieved the highest added value (€ 275 million), IT services sub-sector follow (€ 155 million, 23%), IT Channels sub-sector is ranked the third (€ 119 million, 18%), while the shares of other sub-sectors were significantly lower.
� The SME segment accomplished € 449 million in 2013 and 67% share in total added value of the IT industry
� Software export sub-sector of the Software sector amounted to € 209 million (76%). It is the largest part and illustrates its significance and potential.
Figure 24: Structure of IT Industry Sub-sector (%) in Added Value
Source: Register of Financial Statement and Solvency, SBRA, prepared upon Mineco’s demand
41%
18%
10%
23%
2%6%
Figure 25: Structure of Software Sub-sector (%) in Added Value
Source: Register of Financial Statement and Solvency, SBRA, prepared upon Mineco’s demand
OutsourcingERP Specialist
Other Software
76%15%
9%
IT ChannelsIT services
SoftwarePC Hardware
Other - unclassifiedConverged industry

67
ICT in Serbia - At a Glance // 2015
The software and IT services become the most challenging markets. System integrators and software companies which recognized the fast growing service market and attached to it, achieved success. Additionally, companies that partnered with global IT vendors progressed rapidly thanks to the adoption of global experience and expertise.
3.2. SOFTWARE EXPORT SECTOR - TREND AND POTENTIAL
3.2.1. Workforce Trend and PotentialAs an illustration of the Software export sector dynamic growth, we used the workforce growth rate of 6 leading companies in the period 2009-2013.
Key observations for the table 20:
In 2013, total workforce of 6 leading companies in Software export sector was 1,710 employees, which is 3.5 times higher in comparison to 2009! This is a good sign, especially in the situation of growing general unemployment where every position is important. In the same period (2009-2013), the economic crisis left the total IT workforce unchanged, proving the momentum and vitality of the Software sector. In addition, this vitality is opposite to the overall economy trend, where, due to the recession and economic crisis, total workforce shrunk by more than 100,000 workplaces.
Total employment of the software sector, which is software export for the most part, has the increasing trend of more than 1,000 new employees per year, so most of IT graduates in Serbia find work soon after graduating. However, the lack of high quality IT experts for development, programming, designing, and web design is already noticeable. It is estimated that the software sector will attract the most and the highest quality IT experts for a longer period, thus increasing its competitiveness and significance in entire Serbian IT industry. Very soon now, an insufficient number of experienced programmers could lead to disturbance on the labor market and cause a great fluctuation, as the great number of employees will seek for better job options through changing companies or the positions inside the companies. The new phase is coming in the area of certificates, too, as the number
Table 20: Workforce of Top Software exporters 2009-2013
Source: Mineco, 2014
Company DomesticOwnership 2009 2013 CAGR
(2013/2009)
1 SCHNEIDER ELECTRIC DMS NS N 142 686 48%
2 RT-RK Y 51 342 61%
3 PSTECH Y 70 239 36%
4 GTECH N 129 183 9%
5 LEVI 9 N 102 172 14%
6 NORDEUS Y - 88 n.a.
TOTAL 494 1,710 38%

ICT in Serbia - At a Glance // 2015
68
of certificates and the number of IT certified experts is going to rise significantly, because of the need to ensure the increasing competitiveness and quality for international clients.
3.2.2. Market Trend and PotentialUntil a couple of years ago, one could still say that the Serbian ICT export is lower than expected. If Serbia is to become a respectable off-shore destination for software development, the ratio of services export to GDP in the ICT sector has to be much higher. The analysis of the ICT export shows that the export base in 2008 was low, which allowed high growth rates at the beginning. However, continuing development of the sector up to 2013, created significant cumulative effects and this picture has significantly improved today.
In this chapter a wider meaning of the term software export market is used, so that, in this case, it includes the total Serbian revenue from computer and information services export excluding hardware. Total revenue of the software export sector is € 239 million, whereas the export of the Serbian computer and information services is higher by 27% (€ 304 million). The difference between used terms revenue and export is explained at the beginning of this chapter (pg. 47). Local branch-offices, such as MICROSOFT, IBM, HP, CISCO, ORACLE, and SAP, generated about € 50 million from export, while the rest of € 20 million came from Serbian large system integrator.
The software export share in GDP has been rising year after year (from 0.3% in 2008 to 1% in 2013). The main reason is significantly faster growth rate of the Software export sector in comparison to the rate of the remaining part of the Serbian economy.
On the global market, IT companies from Serbia (SME and big ones alike) are involved in different outsourcing roles: writing codes (programming), testing software and designing websites, but also providing solutions in the embedded industry. The main markets for outsourced industry are EU followed by the USA. Among the outsourcing companies, a trend of making their own products with a high export value on the foreign markets has been observed. So far, a few companies have been successful, but these few companies made a worldwide success.
Figure 26: Export of Computer and Information Services,2008-2013 [€ million]
Source: NBS

69
ICT in Serbia - At a Glance // 2015
One of the most difficult issues of assessing the Serbian IT industry is the question of how much available sector/industry specific knowledge can be translated and “packed” into different software (applications). Success stories of the already mentioned companies (DMS, EXECOM, NORDEUS, etc.) illustrate taking advantage of such knowledge. These companies have developed business models based on their core competence, unique expertise and experience in a certain (technical) field, using their software only as a “wrap-up” and a way of how to deliver and market this knowledge. Programmers have been important, but not essential for developing such a business model. The knowledge, once developed and brought to a specific use, is not hard to “translate” into software product.
Considering global and German market trends, the (offshore outsourcing) potentials for Serbian companies have become clearly visible. Exploitation of these potentials by Serbia can be built on several factors: the preference of European companies for near-shoring to Eastern and South Eastern Europe due to the distance and cultural issues, positive cost-benefit-ratio of relatively cheap but skilled labor (combined with lack of experts in some markets like Germany), solid language skills, and rising wages in some markets (like India). The trend towards smaller and shorter projects additionally helps Serbian SMEs. A strong position and the growth predictions can be seen in the following chart where Serbia is listed as a mature market with respectful market volumes.
Figure 27: Intro-European Offshoring Market Growth Pattern
Source: GOPA ConsultantsMarket Maturity
Off
shor
ing
Volu
me
Tier 3:France
Tier 2:D, AT, CH
Tier 1;UK
Tier 4:SouthernEurope
• Croatia• ?• ?
• India• Pakistan• Sri Lanka
• Tunisia• Morocco• Algeria• Lebanon
• Hungary• Czech Republic• Bulgaria• Romania• Serbia

ICT in Serbia - At a Glance // 2015
70
Regional market of Southeast Europe (that includes West Balkan countries) in the picture above, is not visible as it is of small volume and immature. This market is expected to grow and become visible in the foreseeable future. Serbian IT companies expect to benefit from the following dimensions of proximity: geographic, same time zone, cultural, linguistic, economic, political, and historical linkages. On the regional IT market, Serbia has absolute and comparative advantage in comparison to its neighbors. So, it is possible for Serbian companies to appear in two roles: vendor for regional costumers and nearshoring market for regional IT companies.
3.2.3. Outsourcing Sector - Trend and Potential
Outsourcing sector is the part of Serbian IT industry with the highest performance. All Outsourcing structural characteristics are better than those of the remaining industries. One of the best illustrations, confirming this sectors quality, and important indicator is Added Value analyzed in the previous chapter. Further, if the average salary is used for the evaluation – it is 10-50% times higher in Outsourcing than in other IT sectors.
Serbian Outsourcing sector is on the path of big development as it has just stepped on the global IT scene, which is incomparably bigger than the whole present and future capacity of this sector. Specialization and distance from the mass competition is the way for successful appearance of Serbian companies on the global market.
Outsourcing sector development has to be tracked and supported by the future sector analysis that includes more precise classification of the outsourcing entities due to all of their specificities.
International IT companies advance into the Serbian IT market attracted by its potential. Local companies are exposed to a strong globalization effect, but, at the same time, the global IT companies are exposed to the need of localization: to establish their own companies and local offices and employ local workforce. The international IT vendors have strengthened their local presence significantly in the past years by establishing their own companies for global services. Microsoft, Intel, Cisco, Endeva and Red Hat each have their few global developing centres in Serbia.
For most Serbian IT companies (almost exclusively for micro and SME) outsourcing contracts are simple and often the sole “survival” strategy, as it is the way to escape from financially insolvent local IT market. Some of the reasons are explained in more detail in the chapters and sections above, including the company size, access to the capital for development of their own products in the short and medium term, low demand of local companies in other sectors, degree of specialisation, etc.
It can be assumed that, within the timeframe of the following ten years, taking an improved access to the capital and IT professionals into account, outsourcing will remain one of the core pillars of services sold to local and foreign clients. Depending on how fast the ICT sector matures in Serbia and the region, the market will create an ever growing

71
ICT in Serbia - At a Glance // 2015
divide between companies which do outsourcing as a core (especially software development) or sole competence (specialised outsourcers) and those that work on outsourcing contracts occasionally.
There is no single pattern explaining Serbian companies’ entry into the foreign markets. Although it is not possible to provide an accurate assessment which of the present models provide the most successful results, few common approaches are worth further elaborating. The models are as follows:
� Getting the job through contacts created at international fairs. Usually companies manage to get small contracts at first; thereafter they develop trust and more serious contracts.
� Getting the job through Serbian diaspora - IT experts working abroad.
� Getting the job through B2B events organised by the government, clusters and associations, or international development agencies. All of them recognize Serbian ICT as a sector with high export potential.
� In a number of cases, Serbian companies have obtained international contracts based on their personal acquaintances overseas.
It is very important to emphasize that Serbian ICT companies lack the market intelligence about international markets: insufficient specific knowledge as to what the potential markets for their goods and services could be and how to access these markets.
3.2.4. Potentials - Standardisation of Serbian IT companies
From the perspective of the year 2010, so far there has not been significant interest for certification or standardisation as stated by many actors in the stakeholder interviews. The Serbian software industry has, therefore been engaged in obtaining CMMI certifications yet only on a very limited scale. Over the last few years, GIZ has been engaged in providing support to Serbian companies in introducing the necessary standards. More recently, EBRD’s Business Advisory Services (BAS) Programme in Serbia and SIEPA have been active in providing financial support to Serbian SMEs introducing the necessary standards.
Looking at the standardization issue from an outsourcing perspective quality management and standards/methodologies like SCRUM, CMMI, ISO 9001, ISO 27001, Six Sigma, ITIL, etc. can be assumed growing significantly in importance as foreign partners and clients´ demand is likely to increase as elaborated earlier (keywords: progressing “industrialization” of IT services and “standardization of technologies and processes”). The Serbian ICT clusters have recognized this need by including trainings on quality and standardization matters in their activity portfolio for the coming years.
There is an increase in interest for standardization in software testing, as it appears to be ever more important to foreign clients and

ICT in Serbia - At a Glance // 2015
72
partners of Serbian IT companies. Following this trend, Vojvodina ICT Cluster has become an exclusive partner of SEETB for ISTQB training and testing in Serbia. In partnership with other IT clusters, the ISTQB courses and testing are now offered throughout Serbia.
The issue of establishing an independent organisation (agency, laboratory, etc.) for the certification of the Serbian origin of an IT product has, therefore, been suggested as a possible topic in this context. This could be accomplished through a sector specific agency with a web-based platform where companies can register, login, and upload source-code in order to receive ‘Serbian SW’ certification.
Summing up the anticipated increased demand coming from outsourcing clients and the cited example for an organisation evaluating software just highlight the assumed growing demand for quality infrastructure institutions, mechanisms, and processes in the coming years.
In the IT sector, service industry and software developers benefit from their specialization, due to their in-depth knowledge of the processes and dynamics that are each industry specific. The more specialized service-providing companies and the more specialized products are, both horizontally and vertically, the more visible success is enabled.
A few representative examples illustrating the success stories (the best practice in Serbia): DMS, GTECH, RT-RK, and NORDEUS are listed below.
SCHNEIDER ELECTRIC DMS NS
The company is a part of the global corporation SCHNEIDER ELECTRIC from 2012. In its branch office in Novi Sad, Vojvodina, 700 engineers further develop and maintain company’s main product, the DMS Software, encompass a variety of analytical functions for calculation and optimization in the electrical industry, and provide the tools necessary for efficient monitoring, managing, design, and optimization of distribution systems.
In 2012 Gartner report* examining nine global smart grid providers, Telvent (now Schneider Electric DMS) received a “strong positive”, the highest possible rating, after evaluation of its Advanced DMS (ADMS) solution. According to Gartner (2012): “Telvent’s product suite creates an industry benchmark from a functional viewpoint. In addition, it is one of the only vendors with a majority of ADMS functions running in production including, at its largest implementation site, Enel (Italy), which has 32 million customers. After gaining significant market traction in 2010 (by signing 12 new contracts — the largest number of contracts among evaluated ADMSs), Telvent continued that momentum by signing 16 new clients representing 15 million meters in the past 12 months.”
GTECH
GTECH branch office Beograd is Serbian software development house, established in 1998, under the name of BEG FINSOFT. Having more than 200 people, they are strong technology company

73
ICT in Serbia - At a Glance // 2015
with all areas of development (Oracle, Microsoft, Java, etc.). In 2007, Belgrade company acquired by GTECH.
GTECH is the largest global company in the regulated gaming space with € 3 billion in revenues and 8,600 employees globally. GTECH has earned a global reputation for delivering value added services and technology solutions for its customers. The Company is a pioneering leader in transaction processing and enterprise-wide systems integration.
Core capabilities are applied to Lottery. As a global leader in the world’s online lottery business, the name GTECH is synonymous with the industry it pioneered and helped to build. GTECH is a full service technology partner catering to all of the systems and support needs of online lottery operators worldwide. This comes from the Company’s ability to analyze the specific needs of each customer and to design solutions that meet the widest array of operating requirements.
RT-RK
Based in Novi Sad, Vojvodina, RT-RK offers high quality software development services (off-shore as well as in customer’s premises) in the area of embedded software development. With its Solution Engineering, RT-RK is focused on Telecom & High-tech sector.
RT-RK was established in 2005 and is now the second largest software company in Serbia according to the number of employees. With the engineering staff of more than 350, the
company is capable of handling projects of different complexity and magnitude. The Company is in the Government list of R&D organizations supported with national projects. Close cooperation with the University of Novi Sad ensures further availability of IT expertise in the company.
For the past few years, RT-RK has focused on establishing hardware design and production facilities which offer their customers complete designing services, production services, and services of testing and verifying electronic equipment.
NORDEUS
Belgrade-based NORDEUS was established in 2010 and is now one of the largest software and Internet business companies in Serbia with 100 employees and reported turnover of € 70 million in 2013 (an impressive increase of approximately 180% more than in 2012). In a short time, Nordeus passed the way from a leading and award-winning European game developer and officially the best European gaming start-up of 2011, to the one of the most important Facebook partner. Besides Belgrade, Nordeus has offices in San Francisco, Dublin, London, and Skopje.
The company’s game “Top Eleven” is the most played online sports game in the World, with more than 100 million registered users around the world and 10 million monthly users on Web, Android, and iOS devices.

ICT in Serbia - At a Glance // 2015
74
At Nordeus, the goal is to provide a seamless gaming experience to millions of people, regardless of the devices they are using. That is why they make social games that are free and accessible to a wide range of people. Their team in Belgrade puts all of their talent into making 5-star games, and every day, millions of people enjoy what they have created.
Summary
Understanding these software exporting Serbian success stories, visible even at the international level, can be a starting point for finding potentials in different directions and dimensions (local, regional and international):
� As the basis for the product development. The core competence of having excellent knowledge and understanding of an industry, its technology and processes is illustrated with the above-mentioned success stories of e.g. DMS, Nordeus.
� As the basis for industry or other sector service providing. On the IT companies´ side, a clear picture of specific needs and demands of other sectors, referring to ICT products and services is often missing or incomplete. However, some of the IT companies recognized that opportunity and developed high expertise in the sector of Telecom & High-tech, Banking & Insurance, Public & Health, and Energy & Utility.
The main impression is that every success story is the story by itself. However, it is obvious that some of the key components
are common and, could probably be used as the Best Practice guidelines. They are the following:
� Investment – the big amounts or smaller once, but continual over a larger period (several years)
� Excellent knowledge and understanding of industry, technology, and market
� Recognition of industry or other sector needs � Workforce with high expertise � Vertical or horizontal specialization � Use the strategy of distancing or the strategy of focusing � Focus on the more significant project roles � Focus on developing own solutions/products
Combined Profile of Top 15 Software Exporters
Business concentration on Serbian Top 15 software exporters has increased year after year, illustrating their faster growth rate than the sector average. Fifteen biggest software exporters according to the revenue in 2013, employed 42% workforce of the software export sector, generated 62% of the sector revenue and 62% of the sector price difference. Net assets of top 15 are 67% of the total sector asset.
The main intention of the combined profile is pointing out the directions and dimensions on which the software exporters are focused and enabling a better understanding for potential investors. This profile is observed through 5 “focus dimensions” (from Q1
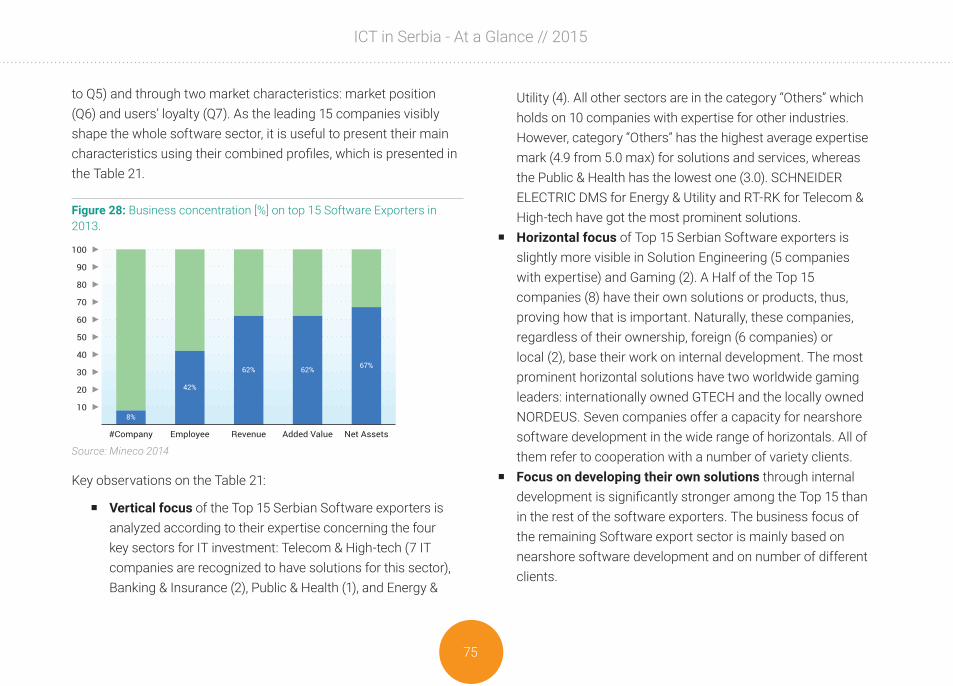
75
ICT in Serbia - At a Glance // 2015
to Q5) and through two market characteristics: market position (Q6) and users’ loyalty (Q7). As the leading 15 companies visibly shape the whole software sector, it is useful to present their main characteristics using their combined profiles, which is presented in the Table 21.
Key observations on the Table 21:
� Vertical focus of the Top 15 Serbian Software exporters is analyzed according to their expertise concerning the four key sectors for IT investment: Telecom & High-tech (7 IT companies are recognized to have solutions for this sector), Banking & Insurance (2), Public & Health (1), and Energy &
Utility (4). All other sectors are in the category “Others” which holds on 10 companies with expertise for other industries. However, category “Others” has the highest average expertise mark (4.9 from 5.0 max) for solutions and services, whereas the Public & Health has the lowest one (3.0). SCHNEIDER ELECTRIC DMS for Energy & Utility and RT-RK for Telecom & High-tech have got the most prominent solutions.
� Horizontal focus of Top 15 Serbian Software exporters is slightly more visible in Solution Engineering (5 companies with expertise) and Gaming (2). A Half of the Top 15 companies (8) have their own solutions or products, thus, proving how that is important. Naturally, these companies, regardless of their ownership, foreign (6 companies) or local (2), base their work on internal development. The most prominent horizontal solutions have two worldwide gaming leaders: internationally owned GTECH and the locally owned NORDEUS. Seven companies offer a capacity for nearshore software development in the wide range of horizontals. All of them refer to cooperation with a number of variety clients.
� Focus on developing their own solutions through internal development is significantly stronger among the Top 15 than in the rest of the software exporters. The business focus of the remaining Software export sector is mainly based on nearshore software development and on number of different clients.
Figure 28: Business concentration [%] on top 15 Software Exporters in 2013.
Source: Mineco 2014
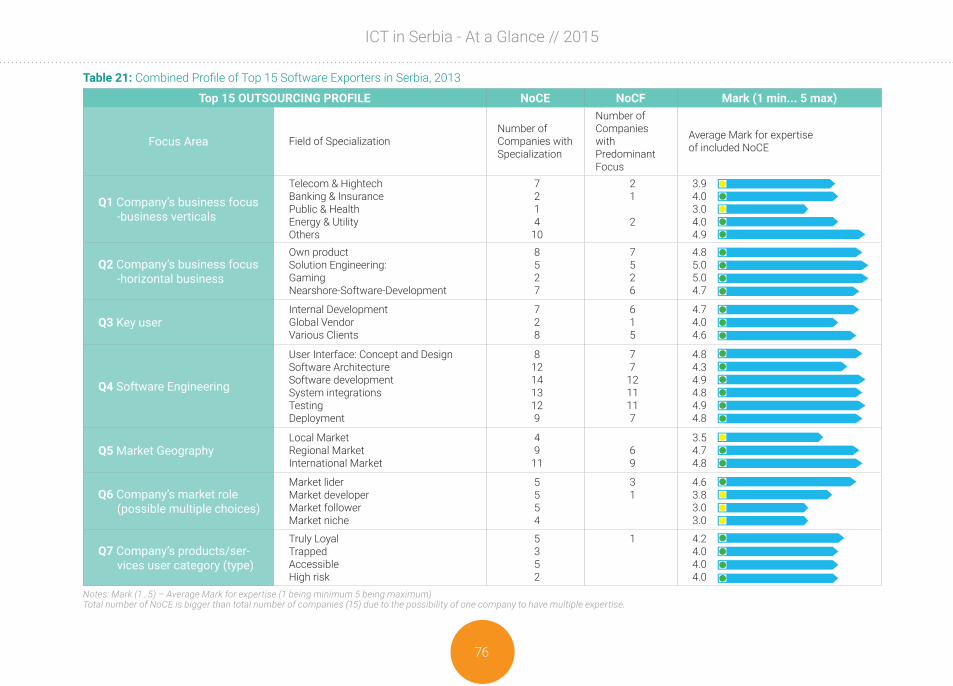
ICT in Serbia - At a Glance // 2015
76
Table 21: Combined Profile of Top 15 Software Exporters in Serbia, 2013
Top 15 OUTSOURCING PROFILE NoCE NoCF Mark (1 min... 5 max)
Focus Area Field of SpecializationNumber ofCompanies withSpecialization
Number ofCompanies withPredominant Focus
Average Mark for expertiseof included NoCE
Q1 Company’s business focus -business verticals
Telecom & HightechBanking & InsurancePublic & HealthEnergy & UtilityOthers
7214
10
21
2
3.94.03.04.04.9
Q2 Company’s business focus -horizontal business
Own productSolution Engineering:GamingNearshore-Software-Development
8527
7526
4.85.05.04.7
Q3 Key userInternal DevelopmentGlobal VendorVarious Clients
728
615
4.74.04.6
Q4 Software Engineering
User Interface: Concept and DesignSoftware ArchitectureSoftware developmentSystem integrationsTestingDeployment
8121413129
77
1211117
4.84.34.94.84.94.8
Q5 Market GeographyLocal MarketRegional MarketInternational Market
49
1169
3.54.74.8
Q6 Company’s market role (possible multiple choices)
Market liderMarket developerMarket followerMarket niche
5554
31
4.63.83.03.0
Q7 Company’s products/ser-vices user category (type)
Truly LoyalTrappedAccessibleHigh risk
5352
1 4.24.04.04.0
Notes: Mark (1…5) – Average Mark for expertise (1 being minimum 5 being maximum)Total number of NoCE is bigger than total number of companies (15) due to the possibility of one company to have multiple expertise.

77
ICT in Serbia - At a Glance // 2015
� Focus on project roles is moving towards more significant ones. Eight companies work on Concept and Design, 12 on Software Architecture, 14 on Software development, 13 on System integrations, 12 on Testing, whereas 9 work on Deployment. Considering the experience and high expertise of Top 15 software exporters, it is easy to interpret the good result in different roles in the software projects.
� The target market raises the question of the Serbian companies’ inferiority to the global competition. According to the target market, the Top 15 Serbian software exporters are mainly focused on the global market as 11 companies (from the Top 15) work on that same global market. On the regional European market, there are 9 companies, which shows wide nearshore software development. Only 4 companies have clients on the local market. Additionally, several companies from the Top 15 made extraordinary results on highly competitive global market (SCHNEIDER ELECTRIC DMS, GTECH, and NORDEUS). These companies can be freely stated as the global market leaders. It is not rare for a particular Serbian organization or individual to achieve superb results in various areas, but it is always related to the individual efforts and enthusiasm.
� All Top 15 software exporters work in the highly competitive environment at all levels: extremely high competitiveness of IT global vendors, strong competitiveness of the regional ones, and the modest competitiveness of a number of small
companies worldwide. In addition, one can rarely count on “truly loyal” buyers, as a wide base of “accessible“ clients accustomed to having choices and ready to change both IT solutions and providers is often present.
� The Top 15 software exporters mostly use the strategy of distancing to get the competitive advantage. The aim of this strategy is to enable products and services which differ from others in the branch, but cover as more market segments as possible. The biggest ones like SCHNEIDER ELECTRIC DMS, GTECH, and NORDEUS stick to the strategy of focusing which is suited to satisfy the needs of only particular groups of clients. It is positive that none of the Top 15 companies has the strategy of cost leadership, which is based on low-cost approaches. On the other hand, it does not mean that this strategy is not widely present among the rest of software exporters in Serbia.
3.3. OUTSOURCING – OPPORTUNITIES AND BARRIERS FOR SERBIAN IT COMPANIES
For the accomplishment of the SWOT analysis “Outsourcing – Opportunities and Barriers for Serbian IT Companies on International Markets” the following five major aspects in the identification and analysis of the opportunities and barriers have been considered:
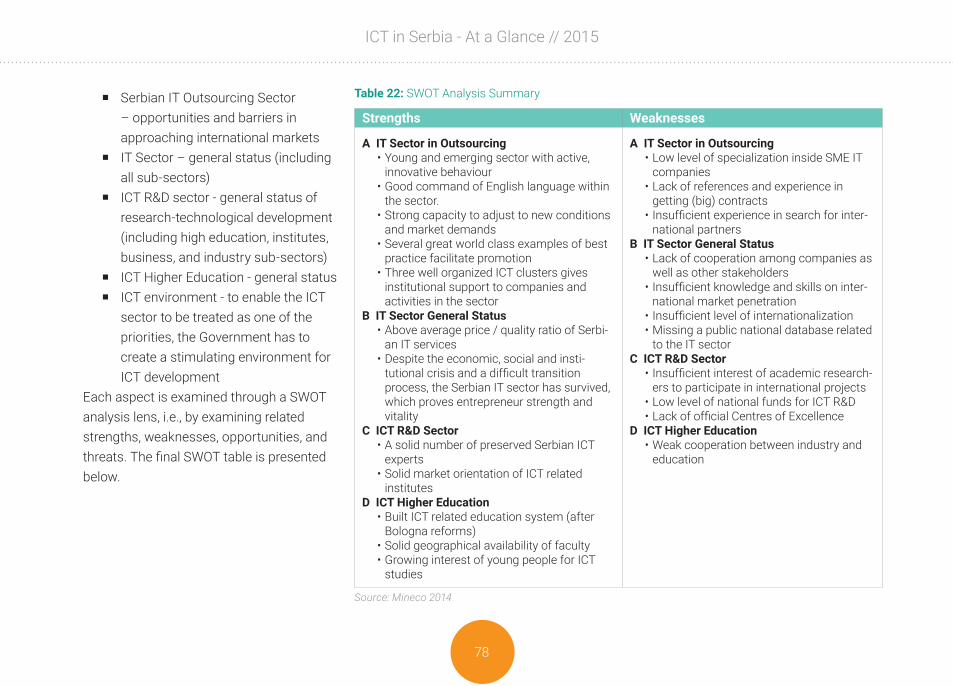
ICT in Serbia - At a Glance // 2015
78
� Serbian IT Outsourcing Sector – opportunities and barriers in approaching international markets
� IT Sector – general status (including all sub-sectors)
� ICT R&D sector - general status of research-technological development (including high education, institutes, business, and industry sub-sectors)
� ICT Higher Education - general status � ICT environment - to enable the ICT
sector to be treated as one of the priorities, the Government has to create a stimulating environment for ICT development
Each aspect is examined through a SWOT analysis lens, i.e., by examining related strengths, weaknesses, opportunities, and threats. The final SWOT table is presented below.
Table 22: SWOT Analysis Summary
Source: Mineco 2014
Strengths Weaknesses
A IT Sector in Outsourcing• Young and emerging sector with active,
innovative behaviour• Good command of English language within
the sector. • Strong capacity to adjust to new conditions
and market demands• Several great world class examples of best
practice facilitate promotion• Three well organized ICT clusters gives
institutional support to companies and activities in the sector
B IT Sector General Status• Above average price / quality ratio of Serbi-
an IT services • Despite the economic, social and insti-
tutional crisis and a difficult transition process, the Serbian IT sector has survived, which proves entrepreneur strength and vitality
C ICT R&D Sector • A solid number of preserved Serbian ICT
experts • Solid market orientation of ICT related
institutes D ICT Higher Education
• Built ICT related education system (after Bologna reforms)
• Solid geographical availability of faculty • Growing interest of young people for ICT
studies
A IT Sector in Outsourcing• Low level of specialization inside SME IT
companies • Lack of references and experience in
getting (big) contracts• Insufficient experience in search for inter-
national partnersB IT Sector General Status
• Lack of cooperation among companies as well as other stakeholders
• Insufficient knowledge and skills on inter-national market penetration
• Insufficient level of internationalization • Missing a public national database related
to the IT sectorC ICT R&D Sector
• Insufficient interest of academic research-ers to participate in international projects
• Low level of national funds for ICT R&D• Lack of official Centres of Excellence
D ICT Higher Education• Weak cooperation between industry and
education
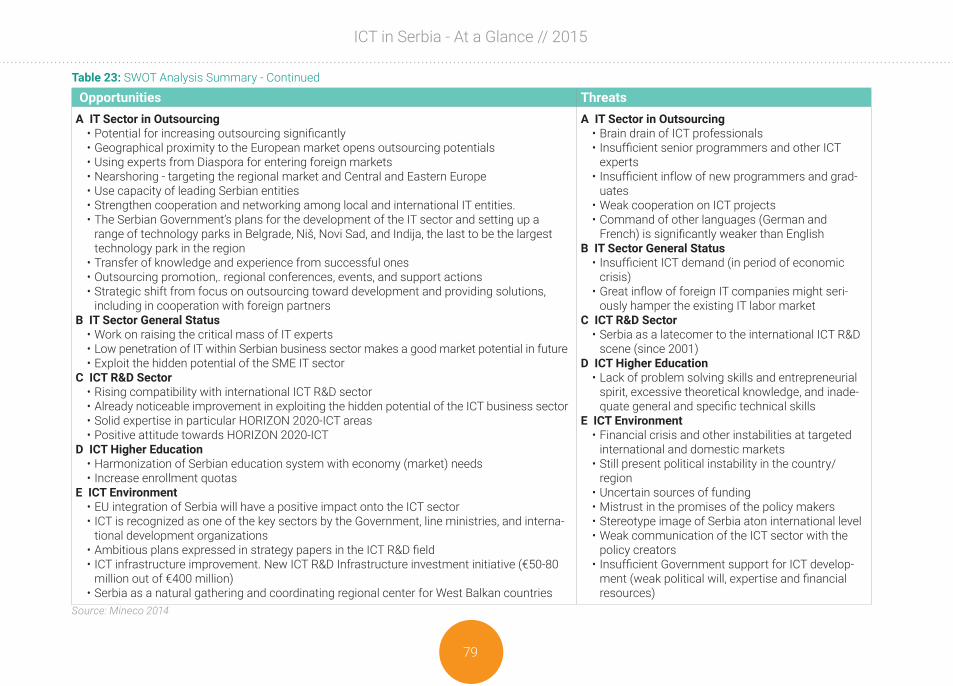
79
ICT in Serbia - At a Glance // 2015
Table 23: SWOT Analysis Summary - Continued
Source: Mineco 2014
Opportunities ThreatsA IT Sector in Outsourcing
• Potential for increasing outsourcing significantly• Geographical proximity to the European market opens outsourcing potentials• Using experts from Diaspora for entering foreign markets• Nearshoring - targeting the regional market and Central and Eastern Europe• Use capacity of leading Serbian entities• Strengthen cooperation and networking among local and international IT entities. • The Serbian Government’s plans for the development of the IT sector and setting up a
range of technology parks in Belgrade, Niš, Novi Sad, and Indija, the last to be the largest technology park in the region
• Transfer of knowledge and experience from successful ones • Outsourcing promotion,. regional conferences, events, and support actions• Strategic shift from focus on outsourcing toward development and providing solutions,
including in cooperation with foreign partnersB IT Sector General Status
• Work on raising the critical mass of IT experts• Low penetration of IT within Serbian business sector makes a good market potential in future• Exploit the hidden potential of the SME IT sector
C ICT R&D Sector • Rising compatibility with international ICT R&D sector • Already noticeable improvement in exploiting the hidden potential of the ICT business sector• Solid expertise in particular HORIZON 2020-ICT areas• Positive attitude towards HORIZON 2020-ICT
D ICT Higher Education• Harmonization of Serbian education system with economy (market) needs• Increase enrollment quotas
E ICT Environment• EU integration of Serbia will have a positive impact onto the ICT sector• ICT is recognized as one of the key sectors by the Government, line ministries, and interna-
tional development organizations• Ambitious plans expressed in strategy papers in the ICT R&D field• ICT infrastructure improvement. New ICT R&D Infrastructure investment initiative (€50-80
million out of €400 million)• Serbia as a natural gathering and coordinating regional center for West Balkan countries
A IT Sector in Outsourcing• Brain drain of ICT professionals• Insufficient senior programmers and other ICT
experts• Insufficient inflow of new programmers and grad-
uates• Weak cooperation on ICT projects• Command of other languages (German and
French) is significantly weaker than EnglishB IT Sector General Status
• Insufficient ICT demand (in period of economic crisis)
• Great inflow of foreign IT companies might seri-ously hamper the existing IT labor market
C ICT R&D Sector • Serbia as a latecomer to the international ICT R&D
scene (since 2001)D ICT Higher Education
• Lack of problem solving skills and entrepreneurial spirit, excessive theoretical knowledge, and inade-quate general and specific technical skills
E ICT Environment• Financial crisis and other instabilities at targeted
international and domestic markets • Still present political instability in the country/
region• Uncertain sources of funding• Mistrust in the promises of the policy makers• Stereotype image of Serbia aton international level• Weak communication of the ICT sector with the
policy creators• Insufficient Government support for ICT develop-
ment (weak political will, expertise and financial resources)
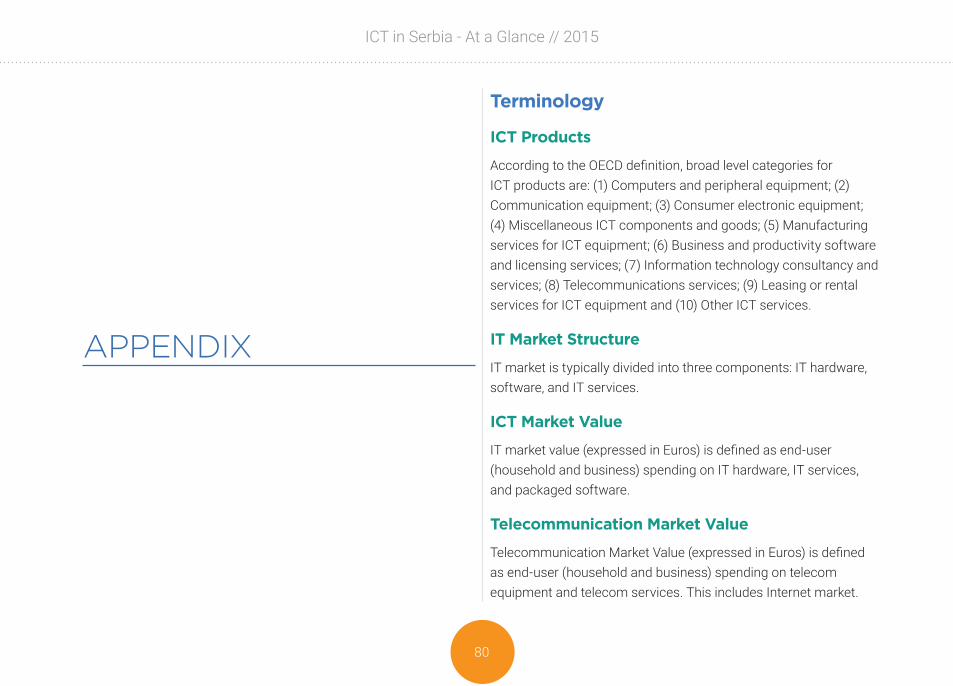
ICT in Serbia - At a Glance // 2015
80
APPENDIX
Terminology
ICT Products
According to the OECD definition, broad level categories for ICT products are: (1) Computers and peripheral equipment; (2) Communication equipment; (3) Consumer electronic equipment; (4) Miscellaneous ICT components and goods; (5) Manufacturing services for ICT equipment; (6) Business and productivity software and licensing services; (7) Information technology consultancy and services; (8) Telecommunications services; (9) Leasing or rental services for ICT equipment and (10) Other ICT services.
IT Market Structure
IT market is typically divided into three components: IT hardware, software, and IT services.
ICT Market Value
IT market value (expressed in Euros) is defined as end-user (household and business) spending on IT hardware, IT services, and packaged software.
Telecommunication Market Value
Telecommunication Market Value (expressed in Euros) is defined as end-user (household and business) spending on telecom equipment and telecom services. This includes Internet market.

81
ICT in Serbia - At a Glance // 2015
ICT Investment
ICT investment is only a subset of ICT products (since it reflects only expenditure on ICT products that satisfy the rules on investment of the basic system of national accounts or SNA). Expenditure on rental of office machinery (which is part of the ICT sector) will normally not be recorded as investment. In practice, ICT investment is typically divided into three components: IT equipment, communications equipment, and software. These components represent the subset of ICT products that can usually be capitalised.
Revenue
In business, revenue is income that a company receives from its normal business activities, usually from the sale of goods and services to customers. In many countries, such as the United Kingdom, revenue is referred to as turnover.
Added Value = Price that the product/service is sold at - cost of producing the product
Added Value can also be defined as the difference between a particular product’s final selling price and the direct and indirect input used in making that particular product.
Net Assets
Net assets, sometimes referred to as net worth, is the shareholders’ equity = assets minus liabilities.
For a company, total assets minus total liabilities. Net worth is an important determinant of the value of a company, considering it is primarily composed of all the money that has been invested since its inception, as well as the retained earnings for the duration of its operation. Net worth can be used to determine creditworthiness because it gives a snapshot of the company’s investment history. Also called owner’s equity, shareholders’ equity, or net assets.
Assets
Any item of economic value owned by corporation (or an individual), especially that which could be converted to cash. Examples are cash, securities, accounts receivable, inventory, office equipment, real estate, a car, and other property.
ICT Sector
The ICT sector is defined according to the OECD (WPIIS) definition, first released in 1998 and revised slightly in 2002. It was revised again in 2007 (ISIC Rev. 4).

ICT in Serbia - At a Glance // 2015
82
IT Industry
The four constituent sub-sectors i.e. set of companies focused on: PC hardware, Software, IT Services, and IT Channels/Distribution. The starting point for the structural analysis is the official NACE registration of ICT companies, given in the table above.
IT Company Size
The enterprise size categorization due to the number of their employees, size-class according to EUROSTAT Standard is following: (a) Micro company – up to 9 employees; (b) Small company – 10-49 employees; (c) Medium company – 50-249 and (d) Big company - 250 and more employees.
Outsourcing
The term outsourcing is used inconsistently but usually involves the contracting out of a business function - commonly one previously performed in-house - to an external provider. In this sense, two
Table 24: OECD ICT sector definition
ICT manufacturing industries IT IT industry Sector
2610 Manufacture of electronic components and boards C
2620 Manufacture of computers and peripheral equipment Y PC Hardware
2630 Manufacture of communication equipment C
2640 Manufacture of consumer electronics C
2680 Manufacture of magnetic and optical media C
ICT manufacturing industries
4651 Wholesale of computers, computer peripheral equipment and software Y IT Channels -
Wholesale and retail
4652 Wholesale of electronic and telecommunications equipment and parts C
5820 Software publishing Y Software
61 Telecommunications C
62 Computer programming, consultancy and related activities Y IT services & Software
631 Data processing, hosting and related activities; Web portals C
951 Repair of computers and communication equipment Y IT services

83
ICT in Serbia - At a Glance // 2015
organizations may enter into a contractual agreement involving an exchange of services and payments.
Outsourcing - Offshoring
Offshoring involves shifting work to a foreign, distant organization in order to reduce production costs.
Outsourcing - Nearshoring
Nearshoring is a derivative of the business term offshoring. Nearshoring is “the transfer of business or IT processes to companies in a nearby country, often sharing a border with your own country”, where both parties expect to benefit from one or more of the following dimensions of proximity: geographic, temporal (time zone), cultural, linguistic, economic, political, or historical linkages. The service work that is being sourced may be a business process or software development.
Business Sector
A business (also known as enterprise or firm) is an organization engaged in the trade of goods, services, or both to consumers. Businesses are predominant in capitalist economies, where most of them are privately owned and administered to earn profit to increase the wealth of their owners
Non-financial industry
Industry which does not deal with financial or investment-related goods or services.
ICT education
OAS: Tertiary-type A education. Programs (ISCED 5A) are largely theory-based and are designed to provide sufficient qualifications for entry to advanced research programs and professions with high skill requirements, such as medicine, dentistry, or architecture. Tertiary-type A programs have a minimum cumulative theoretical duration (at tertiary level) of three years’ full-time equivalent although they typically last four or more years. These programs are not exclusively offered at universities. Conversely, not all university programs fulfil the criteria to be classified as tertiary-type A. Tertiary-type A programs include second degree programs like the American Master.
OSS: Tertiary-type B education. Programs (ISCED 5B) are typically shorter than those of tertiary-type A and focus on practical, technical, or occupational skills for direct entry into the labor market, although some theoretical foundations may be covered in the respective programs. They have a minimum duration of two years full-time equivalent at the tertiary level.
Advanced Research Qualifications. Tertiary programs that lead directly to the award of an advanced research qualification, e.g., Ph.D. The theoretical duration of these programs is three years

ICT in Serbia - At a Glance // 2015
84
full-time in most countries (for a cumulative total of at least seven years full-time at the tertiary level), although the actual enrolment time is typically longer. The programs are devoted to advanced study and original research.
ABBREVIATIONSACCESS Assistance to Competitiveness and Compatibility with
the EU of Serbian SME AC Associated Countries, i.e. Serbia, Switzerland, Israel,
Norway, Iceland, Croatia, Macedonia, Montenegro, Liechtenstein, Albania, Turkey
BkVF Balkan Venture ForumCAGR Compound annual growth rate CMMI Capability Maturity Model Integration CoE Centres of ExcellenceCORDIS Community Research and Development Information
ServiceCRM Customer Relationship Management DAS Diplomske akademske studije (Graduate Academic
studies - Masters)DED Deutscher Entwicklungsdienst (DED) gGmbH DS Doktorske studije (PhD studies)EIB European Investment BankERP Enterprise Resource Planning ETF Elektrotehnicki Fakultet (School of Electrical
Engineering) EU 27 member states of European Union (EU27)EU10 10 new members states which joined the EU in 2004EU15 15 members states which joined the EU before 2004FDI Foreign Direct Investments FP6, FP7 Framework Programme 6, Framework Programme 7 FTE Full Time Employed ResearchersGCI Global Competitiveness IndexGDP Gross Domestic Product GIZ Deutsche Gesellschaft für Internationale
Zusammenarbeit (GIZ) GmbH GTZ Deutsche Gesellschaft für Technische Zusammenarbeit
(GTZ) GmbH H2020 Horizon 2020ICT Information and Communication Technologies ICT-R&D Information and Communications Technology Research
and Technology DevelopmentIDI ICT Development IndexIMP Institute Mihajlo Pupin IPA Instrument for Pre-Accession ISIC International Standard Industrial ClassificationISTQB International Software Testing Qualification BoardIT Information Technologies LEIT Leadership in Enabling and Industrial TechnologiesMoSTD Ministry of Science and Technology Development of the
Republic of Serbia

85
ICT in Serbia - At a Glance // 2015
MoTIS Ministry of Telecommunications and Information Society of the Republic of Serbia
NACE Statistical classification of economic activities in the European Community
NBS National Bank of SerbiaNITIA National Information Technology and Internet Agency NoCE Number of Companies with expertiseNoCF Number of Companies with maximum focus and
expertiseNRI Network Readiness IndexOECD Organisation of Economic Co-operation and
Development ОSS Osnovne strukovne studije (Basic Vocational studies)ОАS Osnovne akademske studije (Bachelor Academic studies)RTD Research and Technology DevelopmentRATEL Republic Agency for Electronic Communication SAS Specijalističke akademske studije (Specialist Academic
studies)SBRA (or APR) Serbian Business Registers AgencySCoC Serbian Chamber of Commerce SCRUM Agile software development methodologySPEA Serbian Private Equity AssociationSEE South East Europe SEETB South East Europe Testing BoardSIEPA Serbia Investment and Employment Promotion AgencySITO Serbian IT Observer
SME Small and Medium-sized Enterprises SORS (or RZS) Statistical Office of the Republic of Serbia SSS Specijalističke strukovne studije (Specialist Vocational
studies)SWOT S-Strengths, W-Weaknesses, O-Opportunities, T-Threats VOICT Vojvodina ICT ClusterVoIP Voice over Internet Protocol

ICT in Serbia - At a Glance // 2015
86
REFERENCES AND KEY ICT PUBLICATIONS [1] Commission for Accreditation and Quality Assurance, Guide
for students, Belgrade, 2013[2] CORDIS (2014), Community Research and Development
Information Service, Projects and Results[3] EUROSTAT (2014), http://ec.europa.eu/eurostat/data/
database[4] European Commission - Information Society and Media,
Serbia - ICT RTD Technological Audit, Bruxelles, 2010[5] FREN (2007), Understanding Belgrade Services Sector,
Foundations for the Advancement of Economics, Beograd[6] GTZ/WBF (2009), ICT Directory of Serbia 2009, GTZ WBF,
Beograd[7] JRC (2010) ICT and Regional Economic Dynamic: A Literature
Review, JRC Scientific and Technical Reports, Spain[8] NBS (2014), Odeljenje statistike platnog bilansa, “Bilans
usluga, januar - decembar 2012-2013/1”, Beograd, 2014[9] OECD (2009), Guide to Measure the Information Society,
Organisation of Economic Co-operation and Development, Paris[10] OECD (2009), Sector Specific Sources of Competitiveness in
the Western Balkans, Organisation of Economic Co-operation and Development, Paris
[11] OECD (2009), Working Party on Indicators for the Information Society, Bruxelles, 2009
[12] RATEL (2014), An Overview of Telecom Market in the Republic
of Serbia in 2013, Republicka Agencija za Telekomunikacije (RATEL), Beograd
[13] RSZ (2013), Republički zavod za statistiku, AC10 - Saopštenje broj 358 “Novoupisani studenti u 2013/2014”, Beograd, 28.12.2013
[14] RSZ (2014), Republički zavod za statistiku, Bilten 544, “Naučnoistraživačke i istraživačko-razvojne organizacije, 2013”, Beograd, 2014
[15] RSZ (2014), Upotreba informaciono-komunikacionih tehnologija u Republici Srbiji, 2013, Beograd: Republicki zavod za statistiku Srbije
[16] SANU (2013), Presek stanja u implementaciji Strategije naučnog i tehnološkog razvoja u RS od 2010 do 2015. g: Treća godina implementacije Strategije
[17] SCORE (2007), ICT Country Report Serbia, score-project.eu, Beograd
[18] SECEP (2010), Quantitative Clustering: Mapping of Statistical Clusters, Support to Enterprise Competitiveness and Export Promotion in the Republic of Serbia, Beograd
[19] SITO (2014), Quarterly Tracker: IT Equipment Delivery through Distribution Channel, Belgrade, 2013
[20] SITO (2014), Serbian Companies as IT Users 2012-2013, Belgrade, 2013
[21] SITO (2014), Serbian IT Industry 2013 and 2014 Forecast, Belgrade, 2014
[22] SITO (2014), The scope and structure of Serbian IT market,

87
ICT in Serbia - At a Glance // 2015
Belgrade, 2014[23] UNDP (2010), eGovernance and ICT Usage Report for South
East Europe, United Nations Development Programme, Sarajevo[24] USAID (2007), Status of Information & Communications
Technology in Serbia, US Agency for International Development, Belgrade
[25] USAID (2008), Skills Gap Analysis in the IT, Film Production, Apparel and Education Sectors of the Serbian Economy, US Agency for International Development, Belgrade
[26] WBC (2010), WBC Regional Model of University-Enterprise Cooperation, University of Kragujevac, Kragujevac
[27] World Bank (2009), SERBIA: Doing more with less, The World Bank, Belgrade
[28] WEF (2014) World Economic Forum, The Global Competitiveness Report 2013-2014, Geneva, Switzerland 2014
[29] WEF (2014), World Economic Forum, The Global Information Technology Report 2014, Geneva, Switzerland 2014
Strategy Documents:[30] Strategija razvoja informacionog drustva u Republici Srbiji do
2020.g.[31] Strategija naucno tehnoloskog razvoja Srbije 2010-2015[32] Strategija razvoja konkurentnih i inovativnih malih i srednjih
preduzeca za period od 2008 do 2013[33] Strategija za razvoj telekomunikacija u Republici Srbiji do
2010. g.
List of Tables & FiguresTable 1: ICT Sector Definition .................................................................13
Table 2: Network Readiness Index 2014. Serbia Profiles .................16
Table 3: Discrepancies between Qualitative and Quantitative NRI Indicators Selection 2013-2014 ...............................18
Figure 1: Tier levels – classification of European IT spending per capita. .................................................................................19
Table 4: Key Parameters for the Serbian IT Market Forecast, in Q1-2015 .................................................................. 20
Figure 2: Trends and Potentials – New IT Goal for the Period 2015-2020 ..................................................................................... 25
Figure 3: Serbian IT Market and Growth Rates for 2010-2014. (%) .................................................................................... 28
Figure 4: Serbian IT Market Structure vs. Profit in IT Sector in 2013 .................................................................................. 28
Figure 5: Structure of IT Service in Serbia in 2013 and CAGRE (5 year period) .................................................................... 29
Figure 6: Software Market in Serbia 2011-2014 ................................ 30
Figure 7: Structure of Software Market in Serbia .............................. 30
Figure 8: IT Spending and Investments in Serbia ............................. 31

ICT in Serbia - At a Glance // 2015
88
Figure 9: Digital Divide. Households with Internet Connection, by Monthly Income Level ................................................. 32
Figure 10: Revenue and Investments by Telecommunication Services, in 2013 ................................................. 33
Table 5: Total Number of Internet Operators in Serbia ..................... 33
Figure 11: ICT Development Index, IDI Structure .............................. 34
Table 6: OECD ICT Sector Definition .................................................... 35
Table 7: IT Industry vs. Telco Industry in Serbia, 2013. Key indicators. ........................................................................................... 36
Table 8: Number of IT companies in Serbia, 2013, according to the IT Sub-sector and Company size .......................................................... 37
Figure 12: Distribution of IT Industry, according Sub-sector .......... 38
Table 9: Number of Software sub-sector according to the segment and Company size ....................................................... 38
Figure 13: Distribution of Software sub-sector according segment .................................................................................. 39
Table 10: Workforce in the Software sub-sector according to the segments and Company Size ................................. 39
Figure 14: Software segments Share (%) in Total Number of Employees in Software sub-sector .................................. 40
Table 11: Revenue in Software sub-sector [€ million], according to the segment and Company Size ............................................................41
Figure 15: Revenue Structure of Software Sub-Sector (%) ..............41
Table 12: Net Assets of Software sub-sector [€ million], 2013. ...... 42
Figure 16: Structure of Software Sub-sector (%) in Net Assets ..... 42
Figure 17: Number of Students (vocational and academic) with ICT Titles, in 2012 ................................................ 47
Table 13: Tertiary-type A and type B Education Programmes in Serbia ......................................................... 49
Figure 18: Number of ICT Student according to Studying Programs in Serbia 2011-2014 ............................................. 49
Figure 19: Capacity of New Enrolees according to ICT Studding Programs, in 2013/2014 ......................... 49
Figure 20: Number of New ICT Enrolees according to Cities, in 2013/2014 .......................................................... 50
Figure 21: Number of New ICT Enrolees according to Faculties’ Founders, in 2013/2014 ................................ 51
Table 14: Number and Dynamics of Researchers in Serbia, 2008-2013. ............................................................................... 54
Figure 22: Number of Researchers in Serbia by Sector, 2008-2013. .............................................................................. 54
89
ICT in Serbia - At a Glance // 2015
Figure 23: R&D in OECD and non-OECD Countries, 2013 ................ 55
Table 15: Centres of Potential for FP7-ICTin Serbia ......................... 58
Table 16: Competence/Share Matrix of Declared Expertise per Objectives ......................................................................... 59
Table 17: Serbian Scientist Participation in FP7 Programme ..........61
Table 18: Basic Business Indicators of Software export sector vs. Top 15 in 2013. .......................................................... 64
Table 19: The ownership and organizational form of leading Software exporter 2013 ....................................................... 64
Figure 24: Structure of IT Industry Sub-sector (%) in Added Value .......................................................................................... 66
Figure 25: Structure of Software Sub-sector (%) in Added Value .......................................................................................... 66
Table 20: Workforce of Top Software exporters 2009-2013 .......... 67
Figure 26: Export of Computer and Information Services, 2008-2013 [€ million] .............................................................. 68
Figure 27: Intro-European Offshoring Market Growth Pattern ....... 69
Figure 28: Business concentration [%] on top 15 Software Exporters in 2013. .................................................................................... 75
Table 21: Combined Profile of Top 15 Software Exporters in Serbia, 2013 ....................................................................... 76
Table 22: SWOT Analysis Summary .................................................... 78
Table 23: SWOT Analysis Summary - Continued .............................. 79
Table 24: OECD ICT sector definition ................................................. 82


www.vojvodinaICTcluster.org