identifying social determinants of urban low carbon ... basque centre for climate change (bc3) is a...
TRANSCRIPT
Identifying social determinants of urban low carbon
transitions: the case of energy transition in Bilbao,
Basque Country
Marta Olazabal and Unai Pascual
May 2013
BC3 WORKING PAPER SERIES
2013-11

The Basque Centre for Climate Change (BC3) is a Research Centre based in the Basque Country,
which aims at contributing to long-term research on the causes and consequences of Climate Change
in order to foster the creation of knowledge in this multidisciplinary science.
The BC3 promotes a highly-qualified team of researchers with the primary objective of achieving
excellence in research, training and dissemination. The Scientific Plan of BC3 is led by the Scientific
Director, Prof. Anil Markandya.
The core research avenues are:
Adaptation to and the impacts of climate change
Measures to mitigate the amount of climate change experienced
International Dimensions of Climate Policy
Developing and supporting research that informs climate policy in the Basque Country
This Working paper has been produced under the Low Carbon Programme initiative:
http://www.lowcarbonprogramme.org/
The BC3 Working Paper Series is available on the internet at
http://www.bc3research.org/lits_publications.html
Enquiries (Regarding the BC3 Working Paper Series):
Prof. Sérgio H. Faria
Email: [email protected]
www.bc3research.org
The opinions expressed in this working paper do not necessarily reflect the position of Basque Centre
for Climate Change (BC3) as a whole.
Note: If printed, please remember to print on both sides. Also, perhaps try two pages on one side.
Identifying social determinants of urban low carbon transitions:
the case of energy transition in Bilbao, Basque Country
Marta Olazabal*a,b
, Unai Pascuala,b,c
Cities are widely defined as complex systems formed by coupled social, ecological and economical
systems. The complexity of urban dynamics goes far beyond its boundaries due to the strong influence
of larger scales and the deep dependence of cities on outside resources. Such crucial cross-scale effects
can fuel maladaptive behaviour, conducting cities to rigid and unsustainable traps. Urban energy
systems have all the ingredients of complexity, dependence and vulnerability to global environmental
change. Presumably, transformability, like adaptability, depends on perceptions, values and culture of
each society. Here it is hypothesized that often social behaviours related to the scepticism, close-
minded attitudes, traditional economic models, lack of trust in institutions and in self-capacities are
those which limit the potential of transformation in cities (favouring lock-in status). The type of energy
and the way it is supplied depends largely on utilities, urban planning and design, economic incentives,
regulations, investment opportunities etc. These determinants, together with household factors
depending on lifestyle, rent, etc. affect the level of consumption and choices. Altogether, these
determinants play a decisive role in decision making processes at individual and institutional level and
therefore can limit the transformation potential. We use a case study in Bilbao (Basque Country) to
illustrate barriers and hidden opportunities of a local energy transition through an analysis of its
cognitive dimension. This is done by applying a semi-quantitative methodology (Q method) which aids
to investigate the stakeholders’ perceived capacity of change. This results in four distinct discourses
with direct implications in the potential of transformation of the city of Bilbao.
Keywords: urban sustainability; transitions; low carbon; Q method; Bilbao
Cite as: Olazabal, M. and U. Pascual (2013) Identifying social determinants of urban low
carbon transitions: the case of energy transition in Bilbao, Basque Country. BC3 Working
Paper Series 2013-11. Basque Centre for Climate Change (BC3). Bilbao, Spain.
___________________________________________________________________________
* Corresponding Author. Email: [email protected]
a Basque Centre for Climate Change (BC3), Bilbao, Spain.
b University of Cambridge, Department of Land Economy, Cambridge, UK.
c IKERBASQUE, Basque Foundation for Science, Bilbao, Spain.
4
1. Introduction
The literature shows an actual discussion on the role of cities in transitions to sustainability
(Hodson and Marvin 2010; Smith 2010; Truffer and Coenen 2011; Westley et al. 2011; Hodson and
Marvin 2012) arguing that the lack of competencies on the politics of many sectors such as energy
policy or transport infrastructures planning might leave cities aside. Either way, cities are great emitters
and consumers of energy accounting for 70% of the global CO2 emissions demand 70% of the primary
energy (IEA 2008). Even though industrial and transport-related activities explain a big part in these
figures, the share of residential resource use in urban areas is relatively important (26.5% according to
Eurostat statistics1).
Given this, it is difficult to contradict the big responsibility that cities have on the quest for
sustainability transition management. Urban energy systems have all the ingredients of complexity,
dependence and vulnerability to global environmental change. The type of energy and the way it is
supplied depends largely on utilities, urban planning and design, economic incentives, regulations,
investment opportunities etc. These determinants, together with household factors affect the level of
consumption and choices. As argued by Madlener and Sunak (2011) over the next decades urban
structures and management will be influential for global energy demand. In this context, where most of
the competencies rely on the local and regional authorities and where lifestyles are influencing factors
on the final use of energy, the primary hypothesis of this paper is that the role of cities in sustainable
transitions is not as limited as transpired by the rigid institutional architectures and the often claimed
lack of urban competencies.
This paper focuses specifically on the implications that the values and culture of the urban
society (including ethics, knowledge, attitudes to risk and culture) affect the opportunities that cities
might have in the process of change. We argue that transformation depends on them and on the
flexibility of the urban social structure, analogously following propositions of Adger et al. (2009) for
the social limits of adaptation.
The number of people living in cities in the next decades is increasingly used as an argument to
call for action at local level. Eighty per cent of the world population is expected to be urbanite by 2050
(UN 2011) and undeniably, satisfying the demand of resources in cities will be a global challenge.
Given that it is a long way until technology is finally developed enough to feed 100% of the society’s
demands (Bermejo 2008) and this scenario calls for action at local level where institutions, stakeholders
and society engage in the process of transition of reducing resource needs. We argue that for this to
happen, the acceptance of the need of change (in order to gain capacities to face climate change and
resource scarcity) and of the current unsustainable patterns is crucial. Both depend on the perspectives
and values of the urban society.
In this paper we analyse different stakeholders’ perspectives in relation to the urban energy
model in Bilbao, Basque Country, by applying the Q method. This method, developed in the 1930s, is a
semi quantitative methodology that aids to generate significant discourses around a specific topic (see
Dziopa and Ahern 2011 for a review on applications of the technique). In this study, the discourses are
built around the stakeholders’ perception about the capacity of transformation of the city, or in other
1 http://epp.eurostat.ec.europa.eu/statistics_explained/index.php?title=File:Final_energy_consumption,_EU-
27,_2009_%281%29_%28%25_of_total,_based_on_tonnes_of_oil_equivalent%29.png&filetimestamp=20120112
112000

5
words, around the city’s transformability. We extrapolate these results to generate significant
conclusions around the governance of Urban Sustainability Transitions (UST).
The paper is structured as follows. The nextbriefly introduces the concept and framework of
UST, as used in this paper. Sect. 3 describes the methodology and the case study. Sect. 4 details the
particularities of the Q method and its application to the case study. Sect. 5 builds the main
transformability discourses that emerge from the analysis and discusses the implications for the
governance of UST in Bilbao. Finally, the last section concludes and points out potential areas of
further research.
2. Governance of urban sustainability transitions
Cities are widely defined as complex systems formed by coupled social, ecological and
economical systems. In many terms, they are understood as social–ecological systems (Ernstson et al.
2010; Schandl and Capon 2012) which can also encompass the many dimensions of cities and its
multiple dynamics including technology and economy. The unsustainable nature of cities (Olazabal and
Pascual 2013) adds to this complexity, generating pernicious cross-scaled dynamics that can fuel
maladaptive behaviour. This potentially pushes cities to rigid and unsustainable traps, which in other
words, determines cities’ degree of unsustainable resilience.
Notwithstanding, the currently emerging literature on resilience, transformability and
sustainability of cities agrees on that there is an unique opportunity relying on cities and it is using them
as laboratories of innovation and experimental action given that their exceptional capacity to start
actions “on the ground” (see for instance Ernstson et al. 2010; Evans 2011; McCormick et al. 2013)
linking scientific knowledge, community participation and stimulating private investors. The first step
in an UST process is breaking unsustainable traps by providing elements to bring enough flexibility and
adaptability to the system so it can easily embrace the process of transformation.
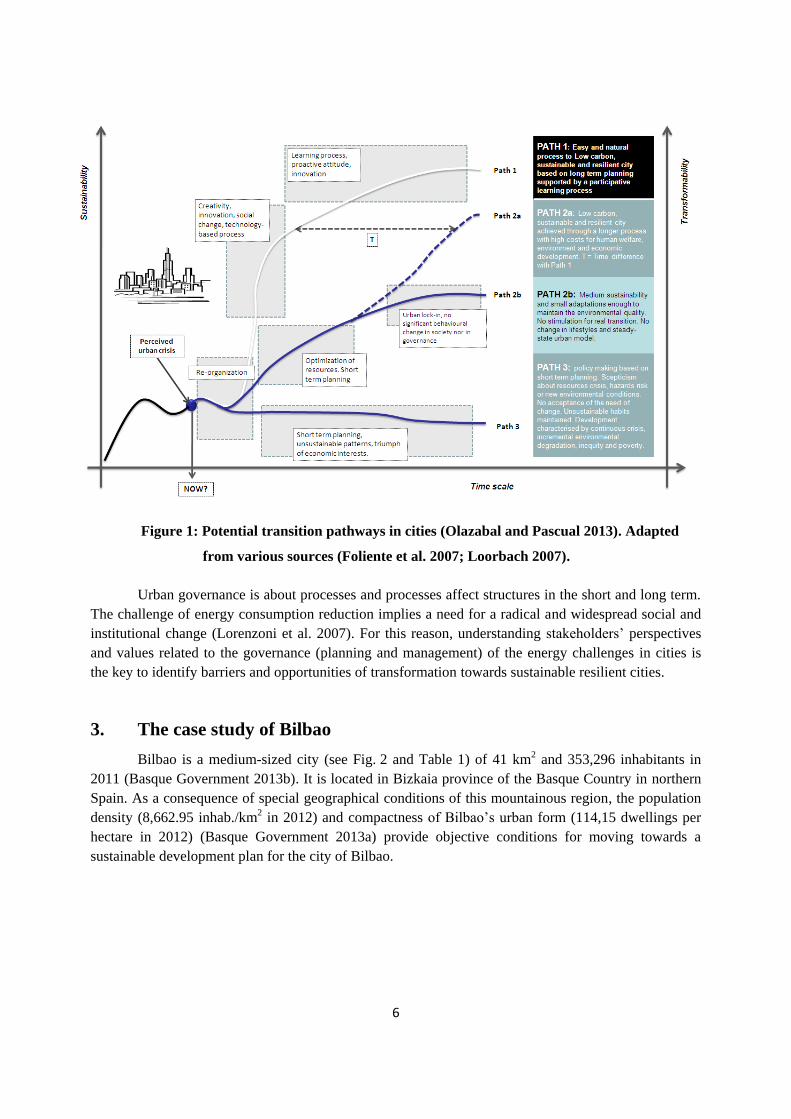
Olazabal and Pascual (2013) (see Fig. 1) introduce the conceptual framework of potential
pathways to urban sustainability transitions (UST) which identifies three potential pathways of urban
transformation depending on the type of governance used when facing (or perceiving) a crisis (or the
need to change). Path 1 offers the most sustainable outcome, is strongly driven by socio-technical
transformation, innovation and creativity where collective efforts stimulate change. Path 2 is associated
with crisis and is embraced within policies on optimization of resources and efficiency although short
term planning is still present in urban management and planning. This can lead to two potential
resulting paths: Path 2a where a slow process of social behavioural change improves sustainability but
at higher costs in comparison with Path 1, and Path2b where urban planning lock-in hinders sustainable
development. Eventually, in Path 3, crisis is ignored and unsustainable patterns are maintained.
We hypothesize that in governance processes, often social behaviours related to the scepticism,
close-minded attitudes, traditional economic models, lack of trust in institutions, communities or in self-
capacities are those which limit the potential of transformation in cities. Analogous to the historical way
of understanding the city and its metabolism (Wolman 1965), McCormick et al. (2013) discern two
dimensions in USTs (or as McCormick et al. call it, “sustainable urban transformation”): processes and
structures. This network perspective is useful to understand the interactions between the components of
social-ecological systems, and the ways in which this affects the performance of the system (Allenby
and Fink 2005; Janssen et al. 2006; Bodin and Crona 2009; Zhang et al. 2009).
6
Urban governance is about processes and processes affect structures in the short and long term.
The challenge of energy consumption reduction implies a need for a radical and widespread social and
institutional change (Lorenzoni et al. 2007). For this reason, understanding stakeholders’ perspectives
and values related to the governance (planning and management) of the energy challenges in cities is
the key to identify barriers and opportunities of transformation towards sustainable resilient cities.
3. The case study of Bilbao
Bilbao is a medium-sized city (see Fig. 2 and Table 1) of 41 km2 and 353,296 inhabitants in
2011 (Basque Government 2013b). It is located in Bizkaia province of the Basque Country in northern
Spain. As a consequence of special geographical conditions of this mountainous region, the population
density (8,662.95 inhab./km2 in 2012) and compactness of Bilbao’s urban form (114,15 dwellings per
hectare in 2012) (Basque Government 2013a) provide objective conditions for moving towards a
sustainable development plan for the city of Bilbao.
Figure 1: Potential transition pathways in cities (Olazabal and Pascual 2013). Adapted
from various sources (Foliente et al. 2007; Loorbach 2007).

7
Table 1: Socio-economic data of Bilbao. Source: Eustat (Basque Government 2013b) and
Udalmap (Basque Government 2013a).
BILBAO 2001 2006 2011
Total population 349972 351179 351965
Population density (inhab./km2) 8474 8501 8486
Number of dwellings 146295 156446 .
Hot water (%) 100 100 .
Bathroom (%) 99 100 .
heating (%) 64 66 .
Landline (%) 100 100 .
Gas (%) 70 71 .
Comfort Index (%) 70 72 .
Number of private cars 135152 135938 138173
Unemployment (%) - 5.95 12.03
Figure 2: Administrative limits and general land uses of Bilbao municipality.
8
The economy of Bilbao was traditionally based on the steel and shipyard industry until the
major industrial crisis of the 1980s, after which Bilbao transformed itself into a service-led city. Today
Bilbao has emerged as the economic motor of the Basque Country. The municipal GDP per capita of
Bilbao was 30,572 Euros (2008), being the total average income 20,081 Euros (2009) (Basque
Government 2013a).
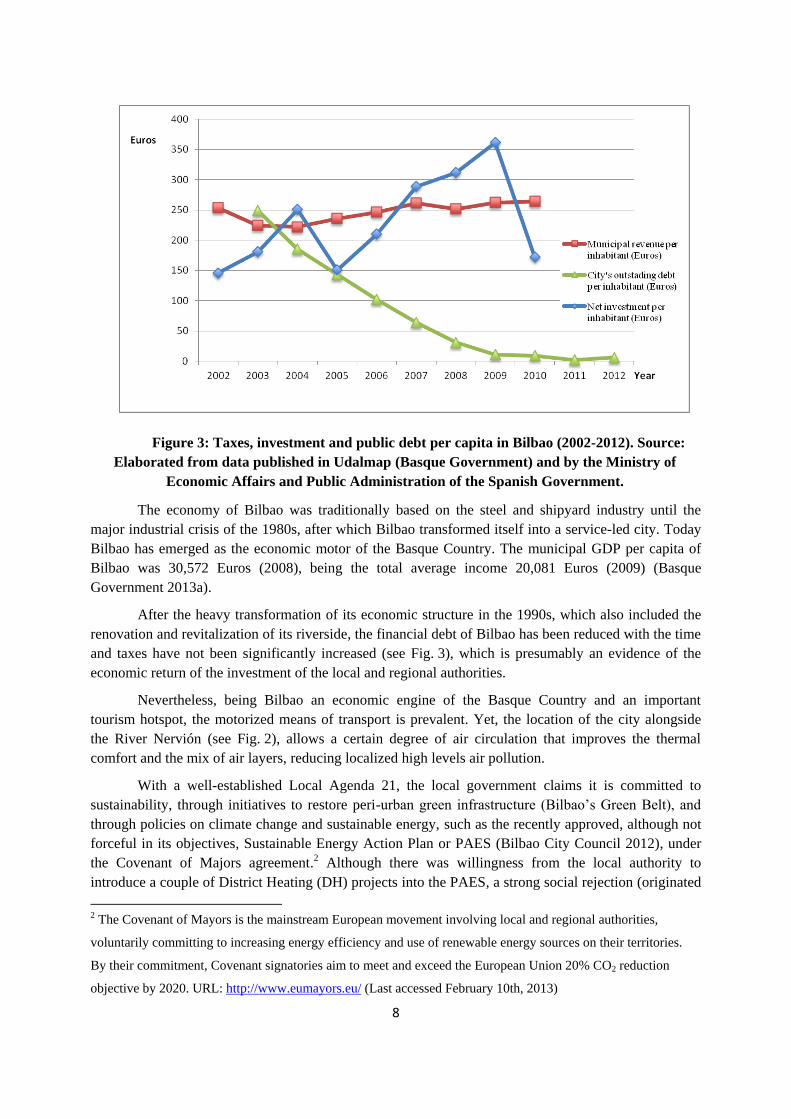
After the heavy transformation of its economic structure in the 1990s, which also included the
renovation and revitalization of its riverside, the financial debt of Bilbao has been reduced with the time
and taxes have not been significantly increased (see Fig. 3), which is presumably an evidence of the
economic return of the investment of the local and regional authorities.
Nevertheless, being Bilbao an economic engine of the Basque Country and an important
tourism hotspot, the motorized means of transport is prevalent. Yet, the location of the city alongside
the River Nervión (see Fig. 2), allows a certain degree of air circulation that improves the thermal
comfort and the mix of air layers, reducing localized high levels air pollution.
With a well-established Local Agenda 21, the local government claims it is committed to
sustainability, through initiatives to restore peri-urban green infrastructure (Bilbao’s Green Belt), and
through policies on climate change and sustainable energy, such as the recently approved, although not
forceful in its objectives, Sustainable Energy Action Plan or PAES (Bilbao City Council 2012), under
the Covenant of Majors agreement.2 Although there was willingness from the local authority to
introduce a couple of District Heating (DH) projects into the PAES, a strong social rejection (originated
2 The Covenant of Mayors is the mainstream European movement involving local and regional authorities,
voluntarily committing to increasing energy efficiency and use of renewable energy sources on their territories.
By their commitment, Covenant signatories aim to meet and exceed the European Union 20% CO2 reduction
objective by 2020. URL: http://www.eumayors.eu/ (Last accessed February 10th, 2013)
Figure 3: Taxes, investment and public debt per capita in Bilbao (2002-2012). Source:
Elaborated from data published in Udalmap (Basque Government) and by the Ministry of
Economic Affairs and Public Administration of the Spanish Government.
9
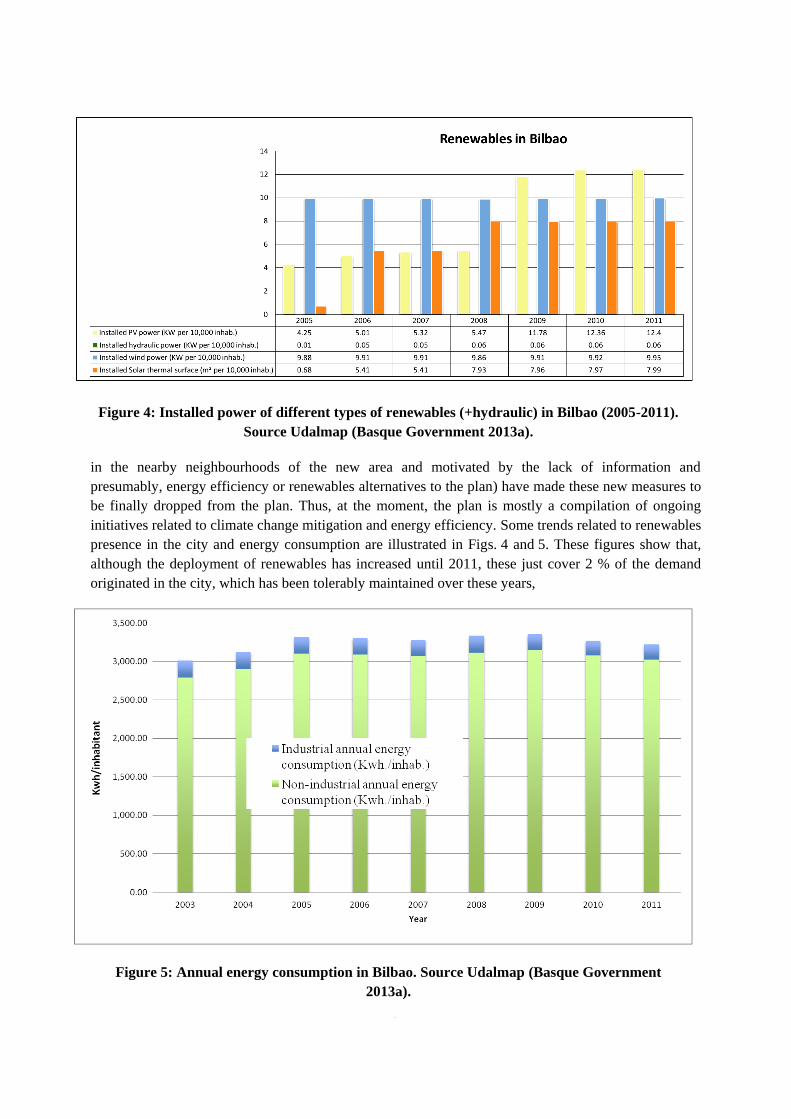
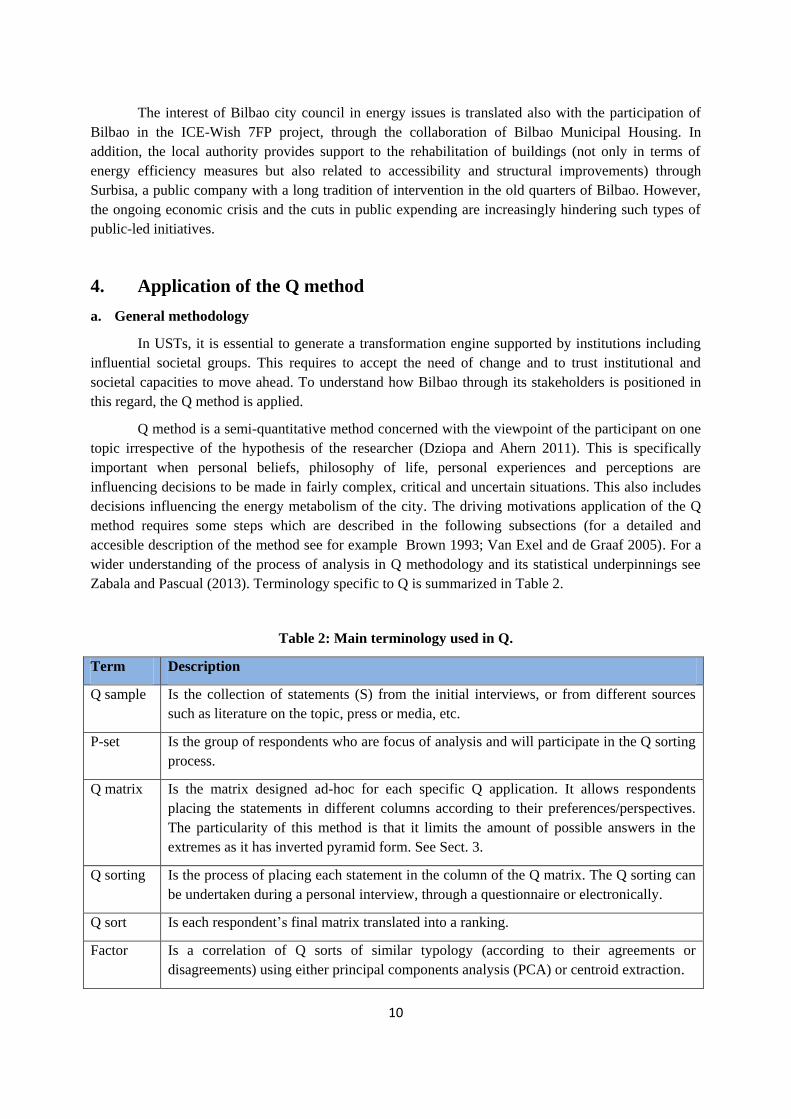
in the nearby neighbourhoods of the new area and motivated by the lack of information and
presumably, energy efficiency or renewables alternatives to the plan) have made these new measures to
be finally dropped from the plan. Thus, at the moment, the plan is mostly a compilation of ongoing
initiatives related to climate change mitigation and energy efficiency. Some trends related to renewables
presence in the city and energy consumption are illustrated in Figs. 4 and 5. These figures show that,
although the deployment of renewables has increased until 2011, these just cover 2 % of the demand
originated in the city, which has been tolerably maintained over these years,
Figure 4: Installed power of different types of renewables (+hydraulic) in Bilbao (2005-2011).
Source Udalmap (Basque Government 2013a).
Figure 5: Annual energy consumption in Bilbao. Source Udalmap (Basque Government
2013a).
10
The interest of Bilbao city council in energy issues is translated also with the participation of
Bilbao in the ICE-Wish 7FP project, through the collaboration of Bilbao Municipal Housing. In
addition, the local authority provides support to the rehabilitation of buildings (not only in terms of
energy efficiency measures but also related to accessibility and structural improvements) through
Surbisa, a public company with a long tradition of intervention in the old quarters of Bilbao. However,
the ongoing economic crisis and the cuts in public expending are increasingly hindering such types of
public-led initiatives.
4. Application of the Q method
a. General methodology
In USTs, it is essential to generate a transformation engine supported by institutions including
influential societal groups. This requires to accept the need of change and to trust institutional and
societal capacities to move ahead. To understand how Bilbao through its stakeholders is positioned in
this regard, the Q method is applied.
Q method is a semi-quantitative method concerned with the viewpoint of the participant on one
topic irrespective of the hypothesis of the researcher (Dziopa and Ahern 2011). This is specifically
important when personal beliefs, philosophy of life, personal experiences and perceptions are
influencing decisions to be made in fairly complex, critical and uncertain situations. This also includes
decisions influencing the energy metabolism of the city. The driving motivations application of the Q
method requires some steps which are described in the following subsections (for a detailed and
accesible description of the method see for example Brown 1993; Van Exel and de Graaf 2005). For a
wider understanding of the process of analysis in Q methodology and its statistical underpinnings see
Zabala and Pascual (2013). Terminology specific to Q is summarized in Table 2.
Table 2: Main terminology used in Q.
Term Description
Q sample Is the collection of statements (S) from the initial interviews, or from different sources
such as literature on the topic, press or media, etc.
P-set Is the group of respondents who are focus of analysis and will participate in the Q sorting
process.
Q matrix Is the matrix designed ad-hoc for each specific Q application. It allows respondents
placing the statements in different columns according to their preferences/perspectives.
The particularity of this method is that it limits the amount of possible answers in the
extremes as it has inverted pyramid form. See Sect. 3.
Q sorting Is the process of placing each statement in the column of the Q matrix. The Q sorting can
be undertaken during a personal interview, through a questionnaire or electronically.
Q sort Is each respondent’s final matrix translated into a ranking.
Factor Is a correlation of Q sorts of similar typology (according to their agreements or
disagreements) using either principal components analysis (PCA) or centroid extraction.
11
Factor
loading
Is the extent to which each Q sort is associated with each factor (Van Exel and de Graaf
2005).
z-score Is the weighted average of the score of the respondents that define that factor (or
perspective) (Van Exel and de Graaf 2005)
q-score
(or factor
score)
Is the normalised Z-score of respondents that define that factor (Van Exel and de Graaf
2005) so it can be understood as the value that an ideal respondent 100% loading on that
factor would give to that statement.
Flagging Process of identifying significant Q sorts within a factor through rotation of factors
(through manual rotation or for example varimax rotation).
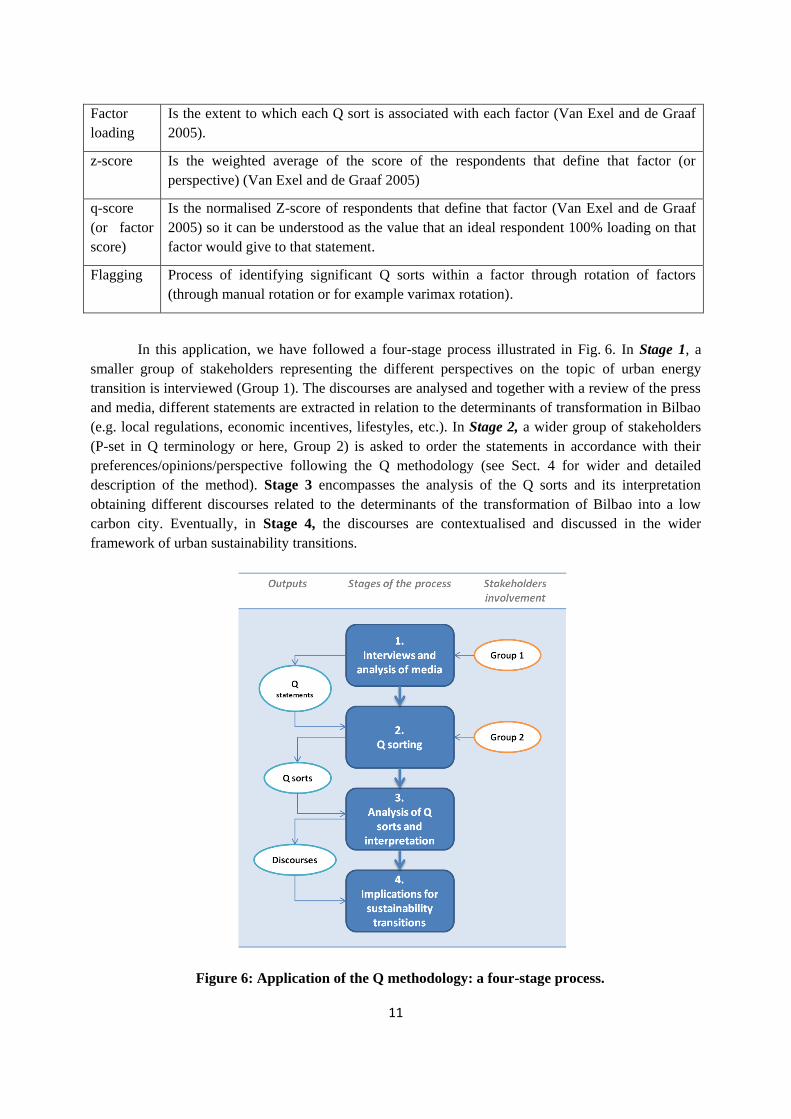
In this application, we have followed a four-stage process illustrated in Fig. 6. In Stage 1, a
smaller group of stakeholders representing the different perspectives on the topic of urban energy
transition is interviewed (Group 1). The discourses are analysed and together with a review of the press
and media, different statements are extracted in relation to the determinants of transformation in Bilbao
(e.g. local regulations, economic incentives, lifestyles, etc.). In Stage 2, a wider group of stakeholders
(P-set in Q terminology or here, Group 2) is asked to order the statements in accordance with their
preferences/opinions/perspective following the Q methodology (see Sect. 4 for wider and detailed
description of the method). Stage 3 encompasses the analysis of the Q sorts and its interpretation
obtaining different discourses related to the determinants of the transformation of Bilbao into a low
carbon city. Eventually, in Stage 4, the discourses are contextualised and discussed in the wider
framework of urban sustainability transitions.
Figure 6: Application of the Q methodology: a four-stage process.
12
The following subsections explain the critical choices made for the application of the Q
methodology in the case study of Bilbao.
b. Matrix selection
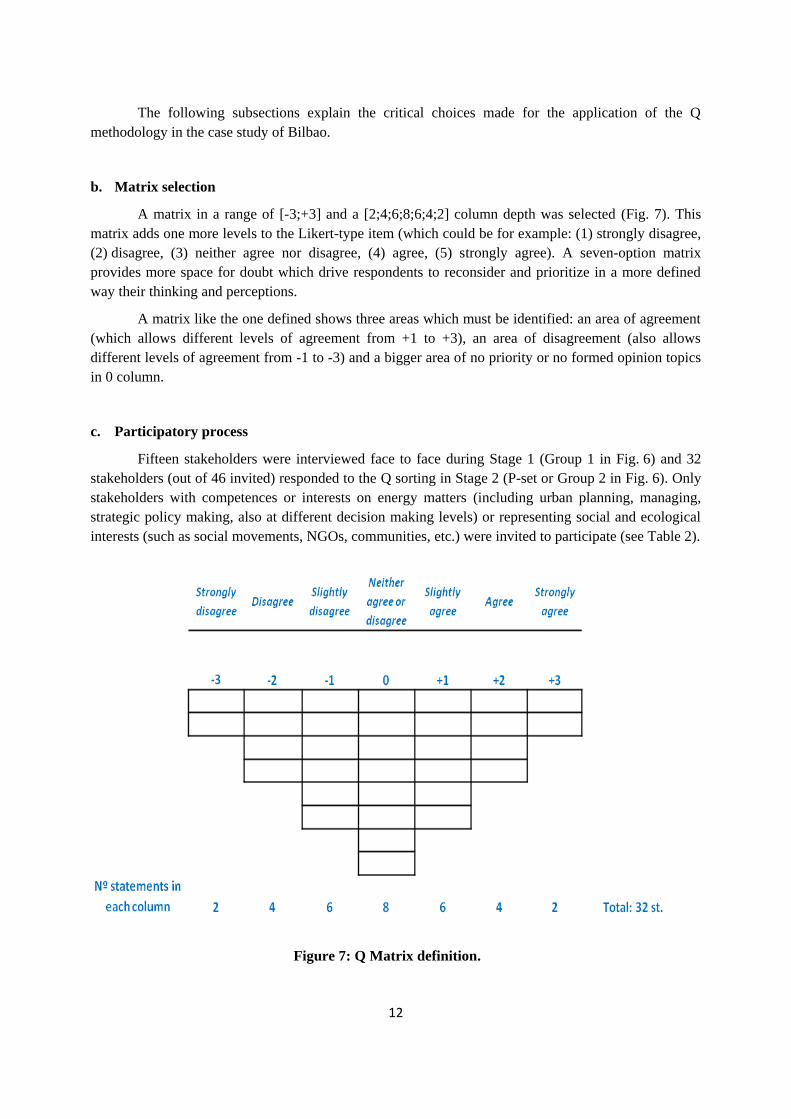
A matrix in a range of [-3;+3] and a [2;4;6;8;6;4;2] column depth was selected (Fig. 7). This
matrix adds one more levels to the Likert-type item (which could be for example: (1) strongly disagree,
(2) disagree, (3) neither agree nor disagree, (4) agree, (5) strongly agree). A seven-option matrix
provides more space for doubt which drive respondents to reconsider and prioritize in a more defined
way their thinking and perceptions.
A matrix like the one defined shows three areas which must be identified: an area of agreement
(which allows different levels of agreement from +1 to +3), an area of disagreement (also allows
different levels of agreement from -1 to -3) and a bigger area of no priority or no formed opinion topics
in 0 column.
c. Participatory process
Fifteen stakeholders were interviewed face to face during Stage 1 (Group 1 in Fig. 6) and 32
stakeholders (out of 46 invited) responded to the Q sorting in Stage 2 (P-set or Group 2 in Fig. 6). Only
stakeholders with competences or interests on energy matters (including urban planning, managing,
strategic policy making, also at different decision making levels) or representing social and ecological
interests (such as social movements, NGOs, communities, etc.) were invited to participate (see Table 2).
Figure 7: Q Matrix definition.
13
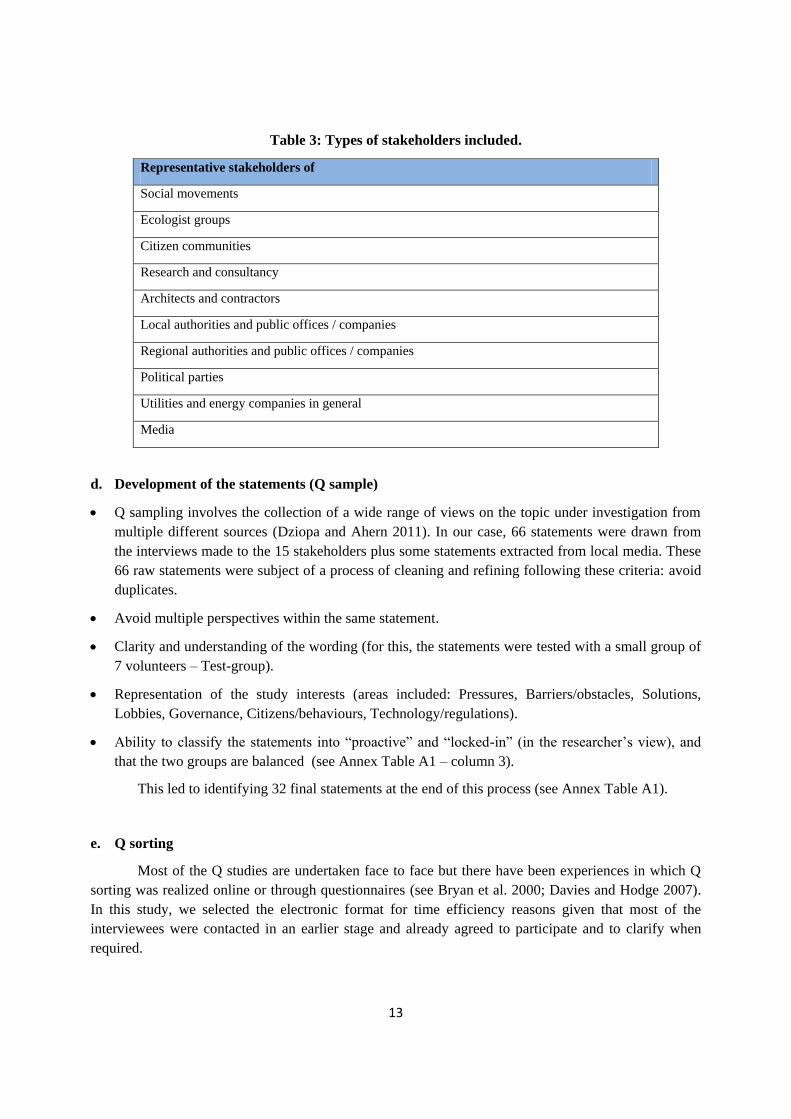
Table 3: Types of stakeholders included.
Representative stakeholders of
Social movements
Ecologist groups
Citizen communities
Research and consultancy
Architects and contractors
Local authorities and public offices / companies
Regional authorities and public offices / companies
Political parties
Utilities and energy companies in general
Media
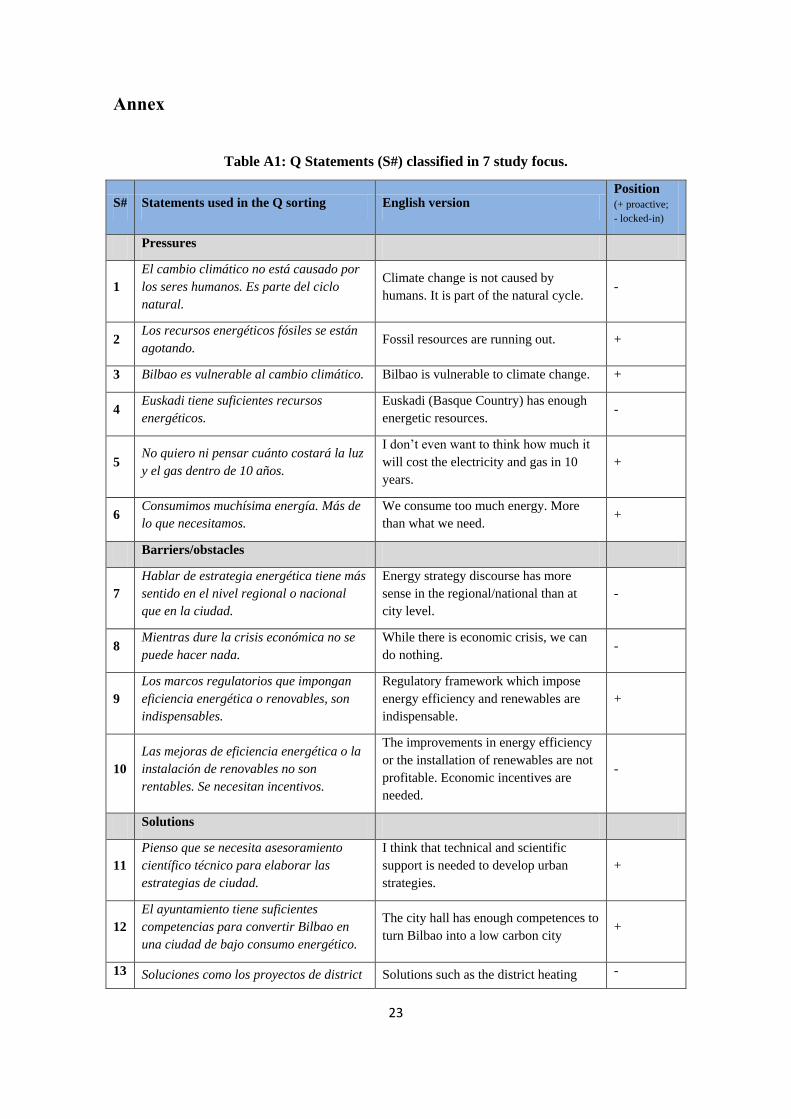
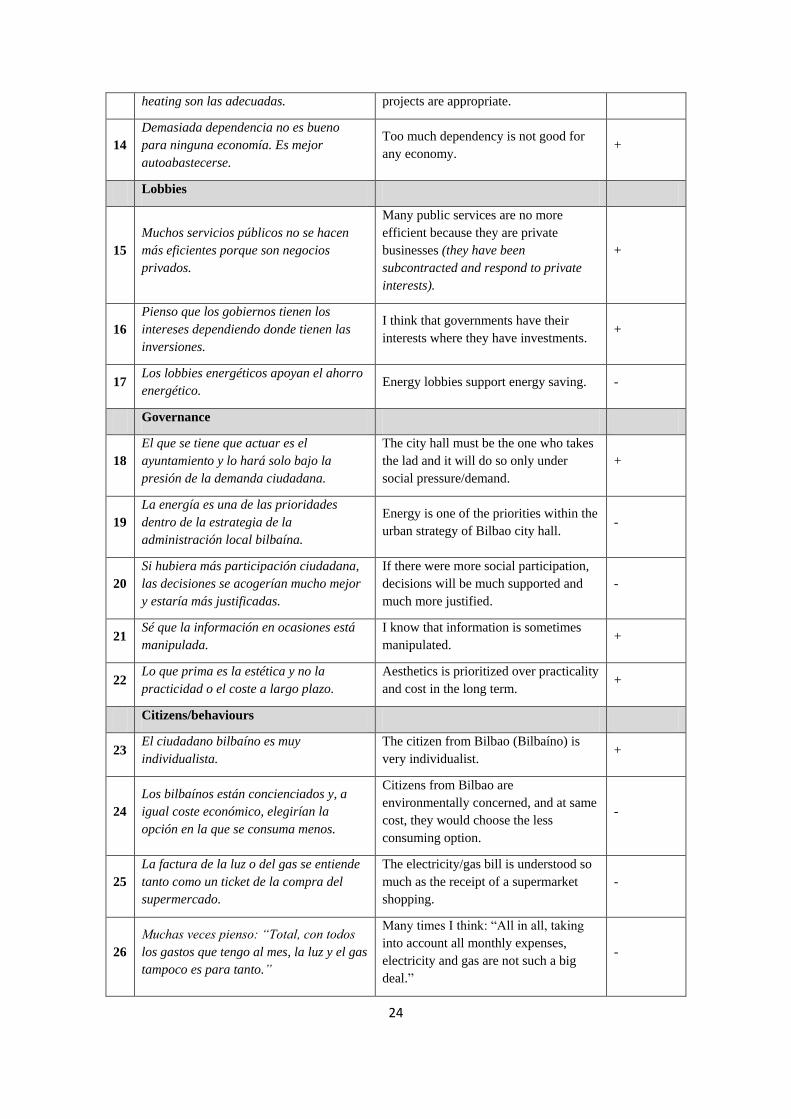
d. Development of the statements (Q sample)
Q sampling involves the collection of a wide range of views on the topic under investigation from
multiple different sources (Dziopa and Ahern 2011). In our case, 66 statements were drawn from
the interviews made to the 15 stakeholders plus some statements extracted from local media. These
66 raw statements were subject of a process of cleaning and refining following these criteria: avoid
duplicates.
Avoid multiple perspectives within the same statement.
Clarity and understanding of the wording (for this, the statements were tested with a small group of
7 volunteers – Test-group).
Representation of the study interests (areas included: Pressures, Barriers/obstacles, Solutions,
Lobbies, Governance, Citizens/behaviours, Technology/regulations).
Ability to classify the statements into “proactive” and “locked-in” (in the researcher’s view), and
that the two groups are balanced (see Annex Table A1 – column 3).
This led to identifying 32 final statements at the end of this process (see Annex Table A1).
e. Q sorting
Most of the Q studies are undertaken face to face but there have been experiences in which Q
sorting was realized online or through questionnaires (see Bryan et al. 2000; Davies and Hodge 2007).
In this study, we selected the electronic format for time efficiency reasons given that most of the
interviewees were contacted in an earlier stage and already agreed to participate and to clarify when
required.
14
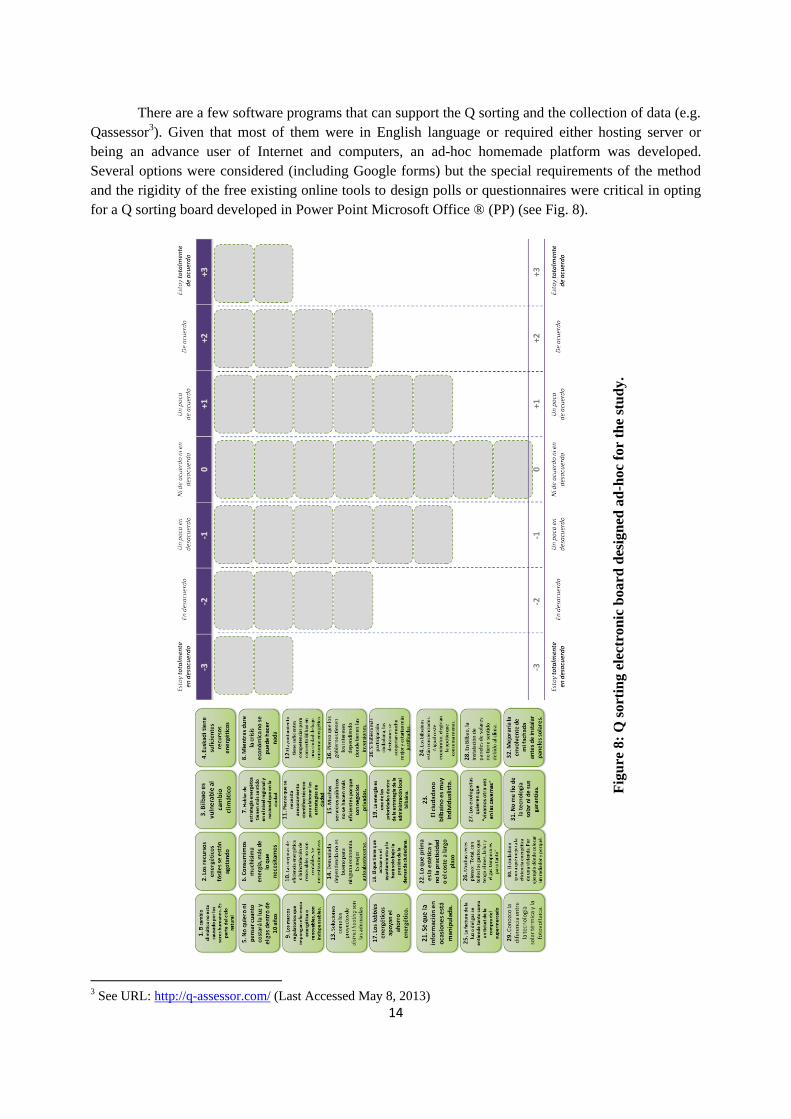
There are a few software programs that can support the Q sorting and the collection of data (e.g.
Qassessor3). Given that most of them were in English language or required either hosting server or
being an advance user of Internet and computers, an ad-hoc homemade platform was developed.
Several options were considered (including Google forms) but the special requirements of the method
and the rigidity of the free existing online tools to design polls or questionnaires were critical in opting
for a Q sorting board developed in Power Point Microsoft Office ® (PP) (see Fig. 8).
3 See URL: http://q-assessor.com/ (Last Accessed May 8, 2013)
Fig
ure
8:
Q s
ort
ing
ele
ctro
nic
boa
rd d
esig
ned
ad
-ho
c fo
r th
e st
ud
y.
15
This template including the instructions on how to position the statements in the columns was
sent to seven people (Test-group) (including advanced and beginner PC and electronic email users) in
order to test the understanding and to correct the design and the wording. Other designs in Google
forms were sent to these people and all agreed in that PP is an easier tool and friendly enough and had
no problems in interpreting the instructions and “moving” the statements boxes (see green boxes in the
left of Fig. 8) into the matrix columns, following their preferences/priorities.
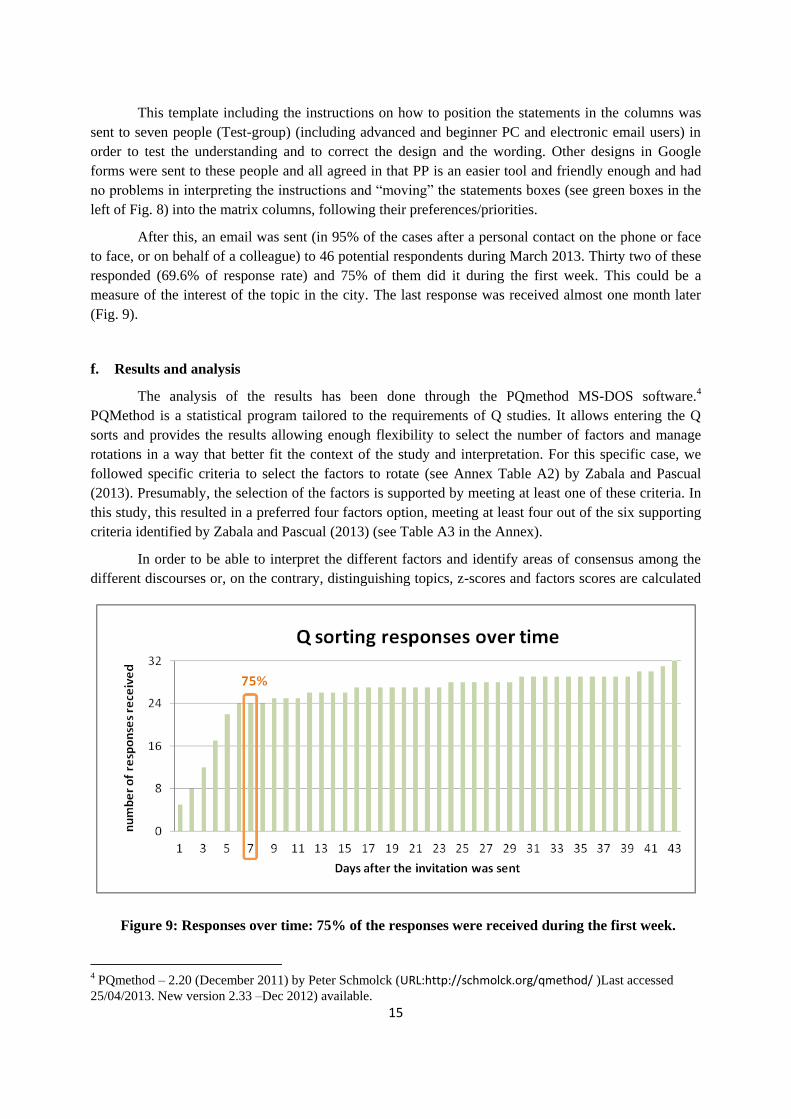
After this, an email was sent (in 95% of the cases after a personal contact on the phone or face
to face, or on behalf of a colleague) to 46 potential respondents during March 2013. Thirty two of these
responded (69.6% of response rate) and 75% of them did it during the first week. This could be a
measure of the interest of the topic in the city. The last response was received almost one month later
(Fig. 9).
f. Results and analysis
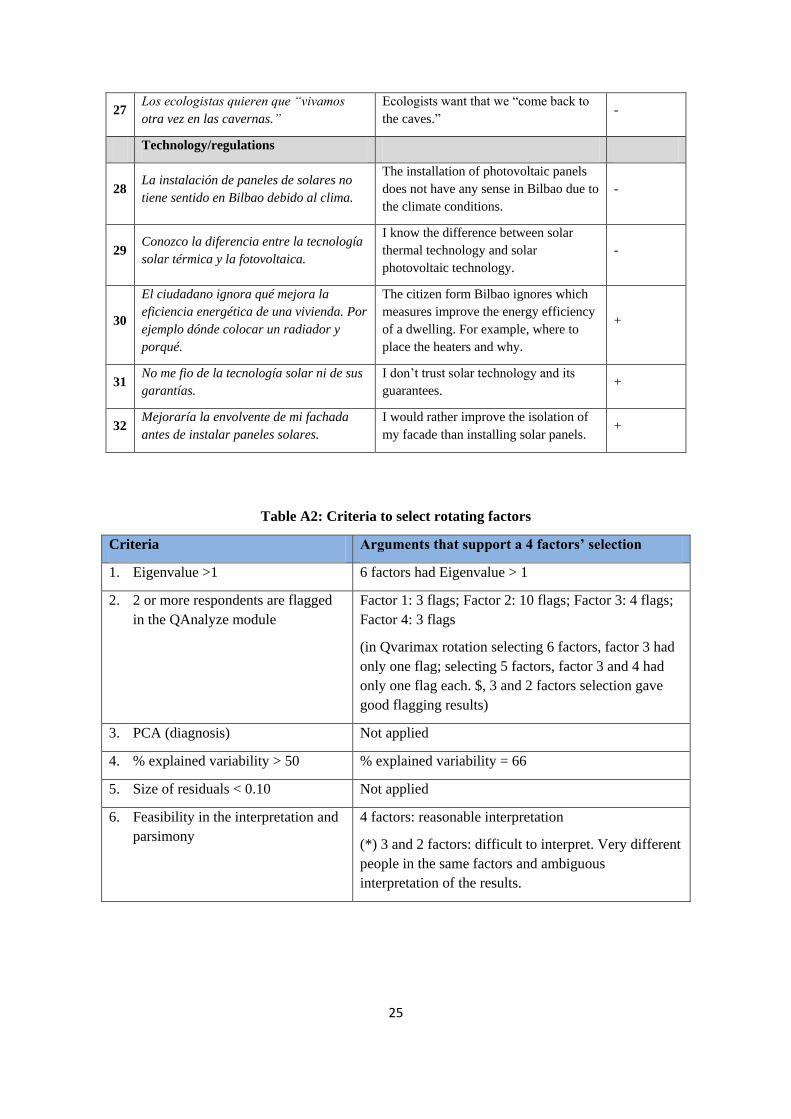
The analysis of the results has been done through the PQmethod MS-DOS software.4
PQMethod is a statistical program tailored to the requirements of Q studies. It allows entering the Q
sorts and provides the results allowing enough flexibility to select the number of factors and manage
rotations in a way that better fit the context of the study and interpretation. For this specific case, we
followed specific criteria to select the factors to rotate (see Annex Table A2) by Zabala and Pascual
(2013). Presumably, the selection of the factors is supported by meeting at least one of these criteria. In
this study, this resulted in a preferred four factors option, meeting at least four out of the six supporting
criteria identified by Zabala and Pascual (2013) (see Table A3 in the Annex).
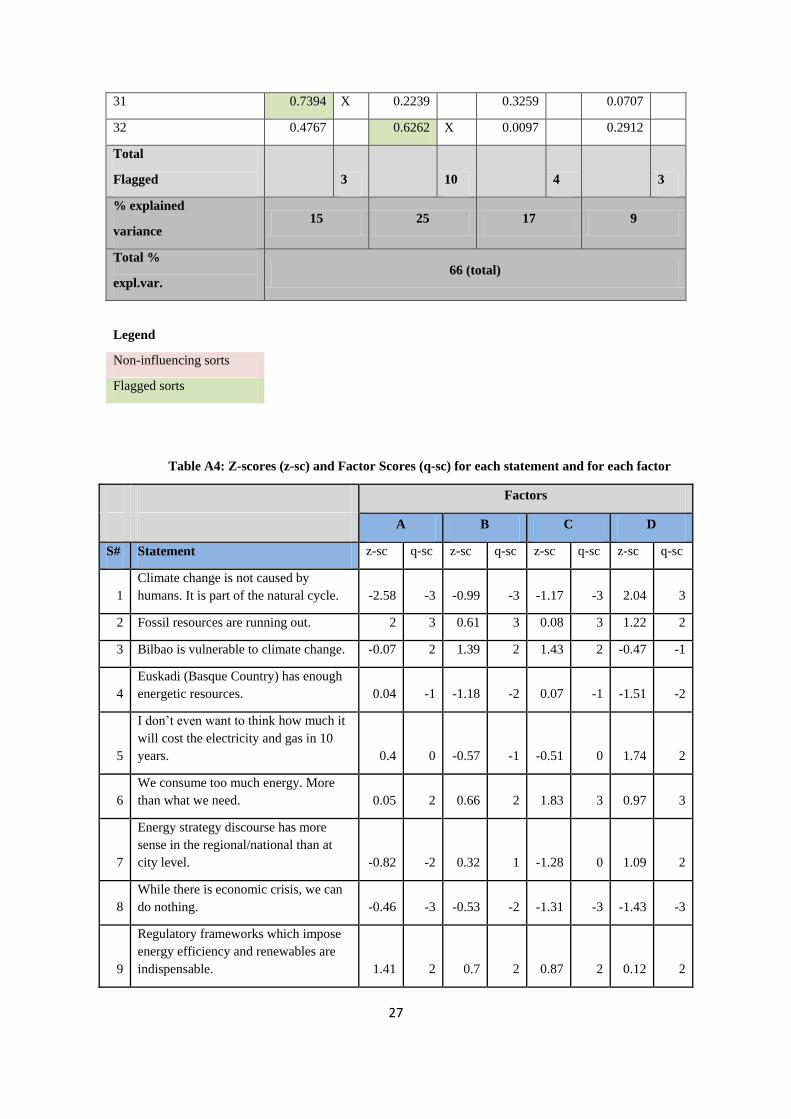
In order to be able to interpret the different factors and identify areas of consensus among the
different discourses or, on the contrary, distinguishing topics, z-scores and factors scores are calculated
4 PQmethod – 2.20 (December 2011) by Peter Schmolck (URL:http://schmolck.org/qmethod/ )Last accessed
25/04/2013. New version 2.33 –Dec 2012) available.
Figure 9: Responses over time: 75% of the responses were received during the first week.
16
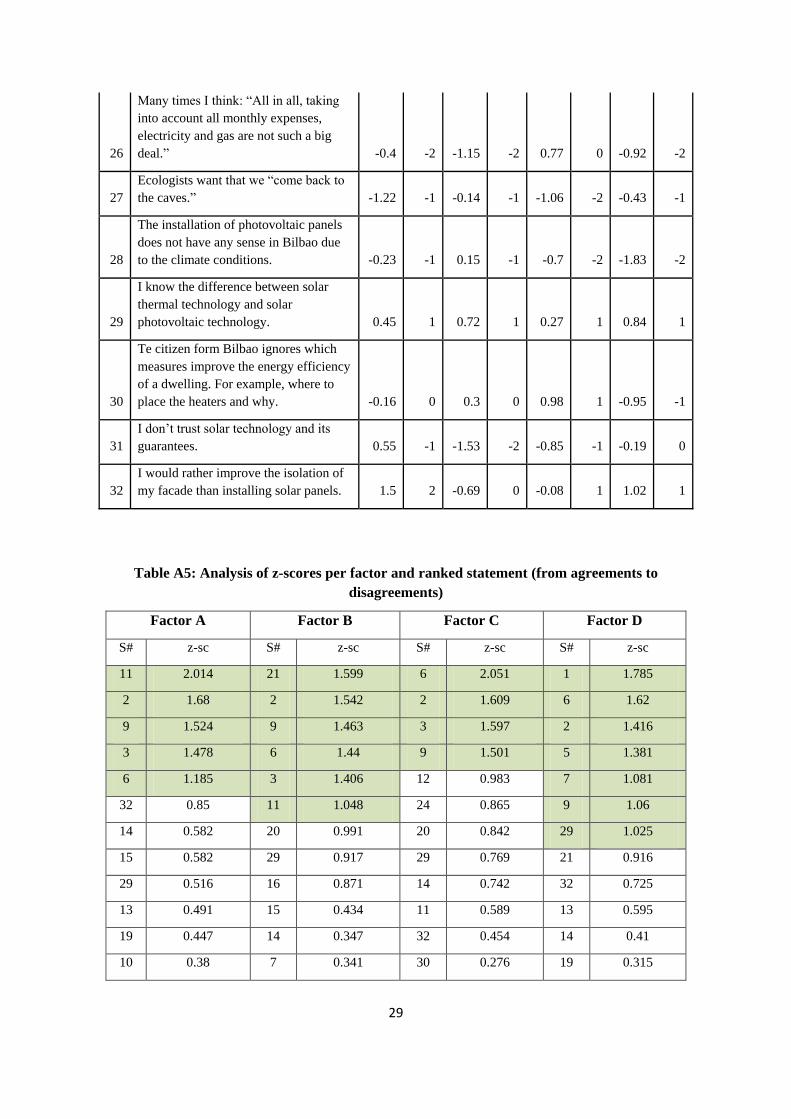
(see in the Annex, Table A4 for z-scores and factor scores of each statement and Table A5 for the
ranked z-scores of each Q sort for each one of the factors).
Looking at these results one can identify distinguishing statements (statistically significant at
p<0,05) and consensus statements (those non-significant at p>0.01, which are not distinguishing
statement between any pair of factors) (Van Exel and de Graaf 2005). Both are defining variables that
can be used to interpret the four different factors (discourses/perspectives on the topic under study, see
Sect. 5). The list of consensus and distinguishing statements can be found in Table A6 and Table A7 in
the Annex).
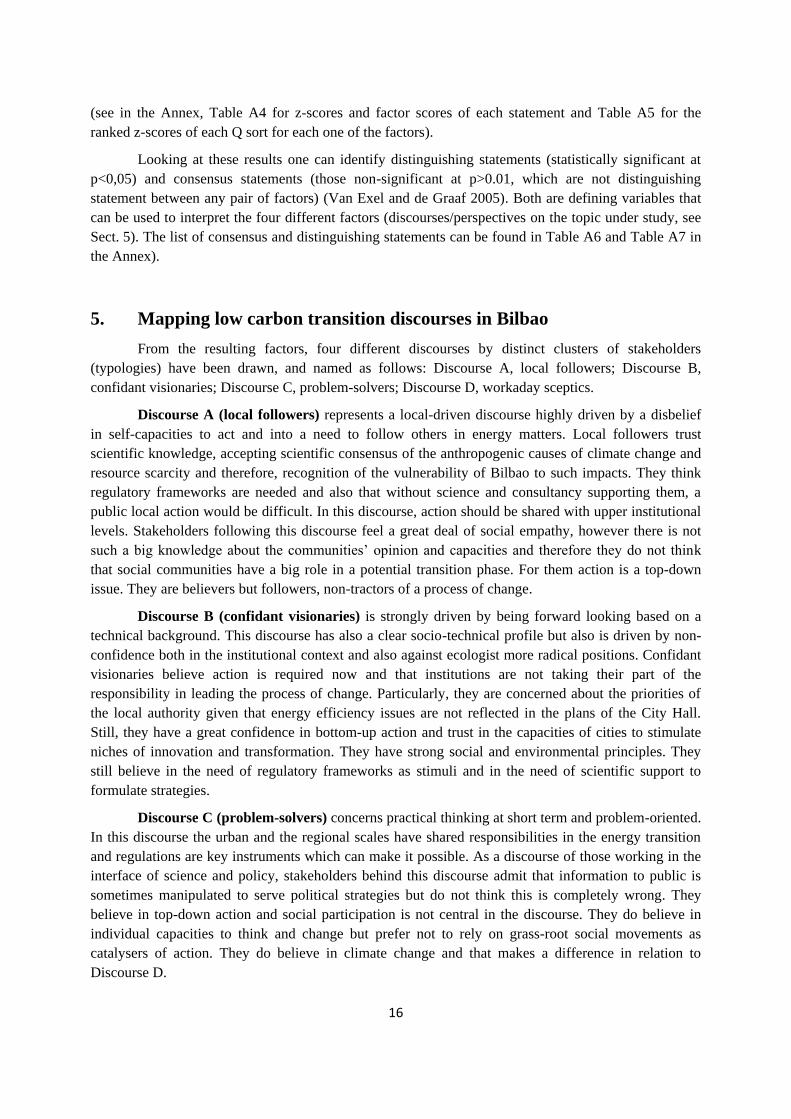
5. Mapping low carbon transition discourses in Bilbao
From the resulting factors, four different discourses by distinct clusters of stakeholders
(typologies) have been drawn, and named as follows: Discourse A, local followers; Discourse B,
confidant visionaries; Discourse C, problem-solvers; Discourse D, workaday sceptics.
Discourse A (local followers) represents a local-driven discourse highly driven by a disbelief
in self-capacities to act and into a need to follow others in energy matters. Local followers trust
scientific knowledge, accepting scientific consensus of the anthropogenic causes of climate change and
resource scarcity and therefore, recognition of the vulnerability of Bilbao to such impacts. They think
regulatory frameworks are needed and also that without science and consultancy supporting them, a
public local action would be difficult. In this discourse, action should be shared with upper institutional
levels. Stakeholders following this discourse feel a great deal of social empathy, however there is not
such a big knowledge about the communities’ opinion and capacities and therefore they do not think
that social communities have a big role in a potential transition phase. For them action is a top-down
issue. They are believers but followers, non-tractors of a process of change.
Discourse B (confidant visionaries) is strongly driven by being forward looking based on a
technical background. This discourse has also a clear socio-technical profile but also is driven by non-
confidence both in the institutional context and also against ecologist more radical positions. Confidant
visionaries believe action is required now and that institutions are not taking their part of the
responsibility in leading the process of change. Particularly, they are concerned about the priorities of
the local authority given that energy efficiency issues are not reflected in the plans of the City Hall.
Still, they have a great confidence in bottom-up action and trust in the capacities of cities to stimulate
niches of innovation and transformation. They have strong social and environmental principles. They
still believe in the need of regulatory frameworks as stimuli and in the need of scientific support to
formulate strategies.
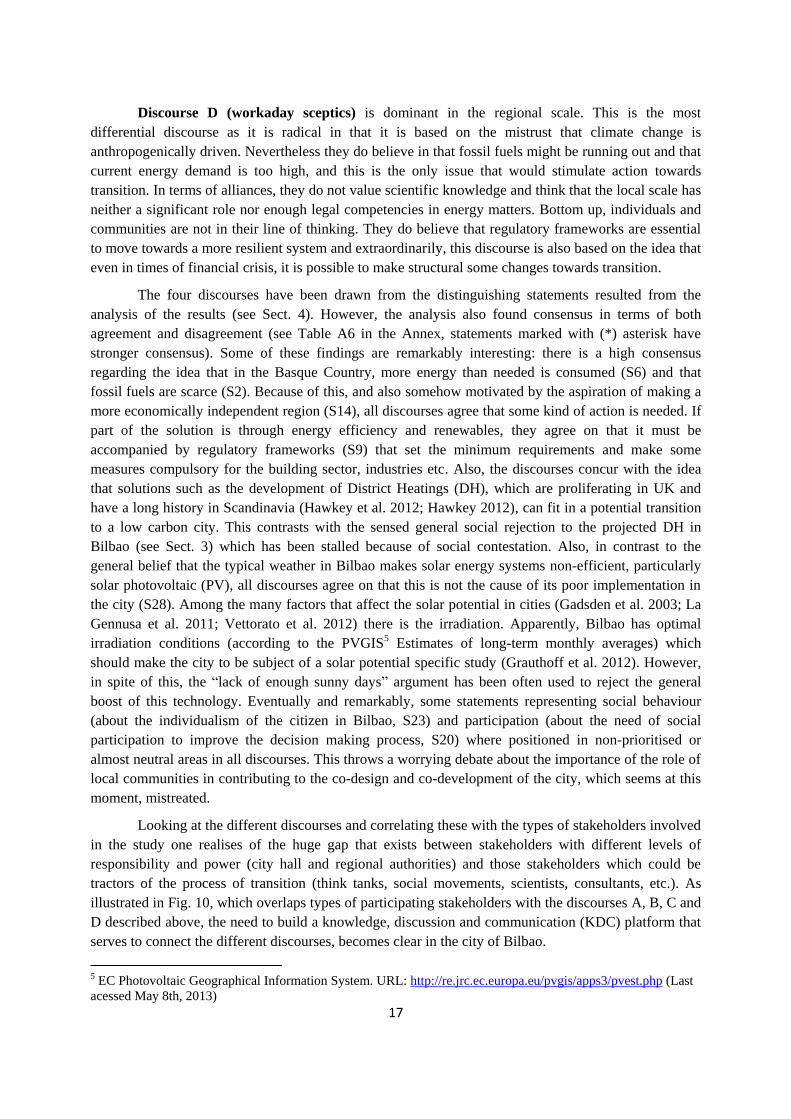
Discourse C (problem-solvers) concerns practical thinking at short term and problem-oriented.
In this discourse the urban and the regional scales have shared responsibilities in the energy transition
and regulations are key instruments which can make it possible. As a discourse of those working in the
interface of science and policy, stakeholders behind this discourse admit that information to public is
sometimes manipulated to serve political strategies but do not think this is completely wrong. They
believe in top-down action and social participation is not central in the discourse. They do believe in
individual capacities to think and change but prefer not to rely on grass-root social movements as
catalysers of action. They do believe in climate change and that makes a difference in relation to
Discourse D.
17
Discourse D (workaday sceptics) is dominant in the regional scale. This is the most
differential discourse as it is radical in that it is based on the mistrust that climate change is
anthropogenically driven. Nevertheless they do believe in that fossil fuels might be running out and that
current energy demand is too high, and this is the only issue that would stimulate action towards
transition. In terms of alliances, they do not value scientific knowledge and think that the local scale has
neither a significant role nor enough legal competencies in energy matters. Bottom up, individuals and
communities are not in their line of thinking. They do believe that regulatory frameworks are essential
to move towards a more resilient system and extraordinarily, this discourse is also based on the idea that
even in times of financial crisis, it is possible to make structural some changes towards transition.
The four discourses have been drawn from the distinguishing statements resulted from the
analysis of the results (see Sect. 4). However, the analysis also found consensus in terms of both
agreement and disagreement (see Table A6 in the Annex, statements marked with (*) asterisk have
stronger consensus). Some of these findings are remarkably interesting: there is a high consensus
regarding the idea that in the Basque Country, more energy than needed is consumed (S6) and that
fossil fuels are scarce (S2). Because of this, and also somehow motivated by the aspiration of making a
more economically independent region (S14), all discourses agree that some kind of action is needed. If
part of the solution is through energy efficiency and renewables, they agree on that it must be
accompanied by regulatory frameworks (S9) that set the minimum requirements and make some
measures compulsory for the building sector, industries etc. Also, the discourses concur with the idea
that solutions such as the development of District Heatings (DH), which are proliferating in UK and
have a long history in Scandinavia (Hawkey et al. 2012; Hawkey 2012), can fit in a potential transition
to a low carbon city. This contrasts with the sensed general social rejection to the projected DH in
Bilbao (see Sect. 3) which has been stalled because of social contestation. Also, in contrast to the
general belief that the typical weather in Bilbao makes solar energy systems non-efficient, particularly
solar photovoltaic (PV), all discourses agree on that this is not the cause of its poor implementation in
the city (S28). Among the many factors that affect the solar potential in cities (Gadsden et al. 2003; La
Gennusa et al. 2011; Vettorato et al. 2012) there is the irradiation. Apparently, Bilbao has optimal
irradiation conditions (according to the PVGIS5 Estimates of long-term monthly averages) which
should make the city to be subject of a solar potential specific study (Grauthoff et al. 2012). However,
in spite of this, the “lack of enough sunny days” argument has been often used to reject the general
boost of this technology. Eventually and remarkably, some statements representing social behaviour
(about the individualism of the citizen in Bilbao, S23) and participation (about the need of social
participation to improve the decision making process, S20) where positioned in non-prioritised or
almost neutral areas in all discourses. This throws a worrying debate about the importance of the role of
local communities in contributing to the co-design and co-development of the city, which seems at this
moment, mistreated.
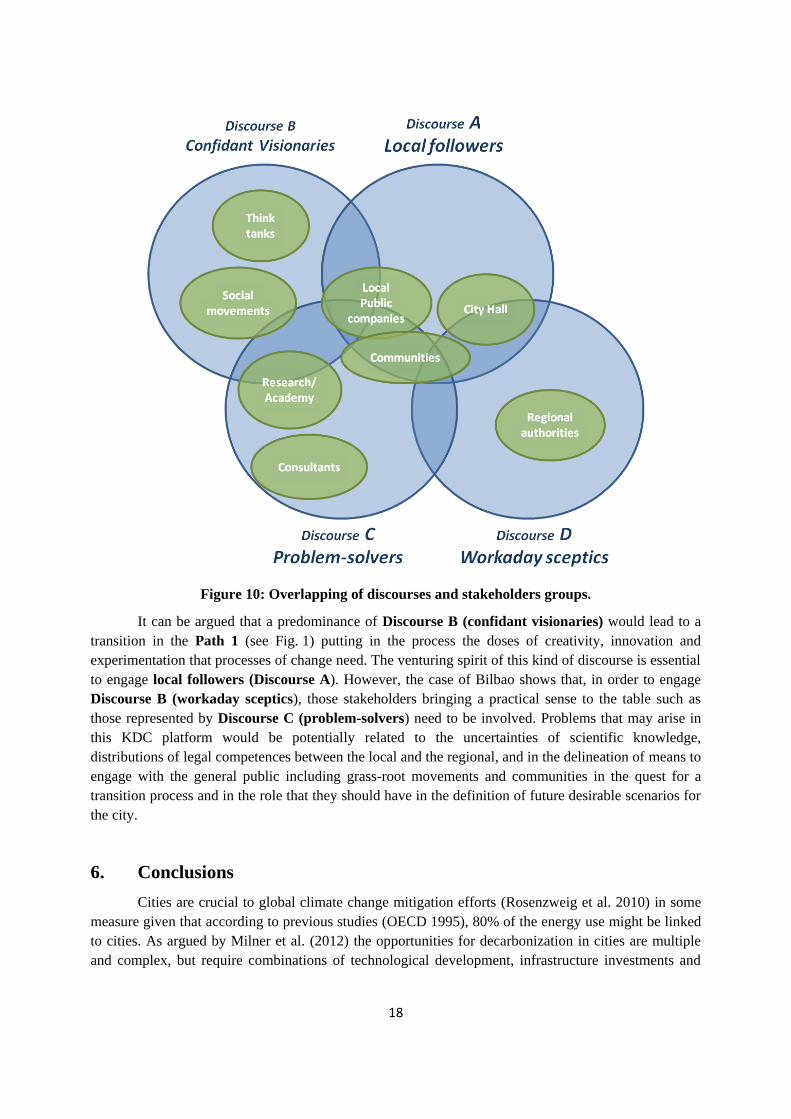
Looking at the different discourses and correlating these with the types of stakeholders involved
in the study one realises of the huge gap that exists between stakeholders with different levels of
responsibility and power (city hall and regional authorities) and those stakeholders which could be
tractors of the process of transition (think tanks, social movements, scientists, consultants, etc.). As
illustrated in Fig. 10, which overlaps types of participating stakeholders with the discourses A, B, C and
D described above, the need to build a knowledge, discussion and communication (KDC) platform that
serves to connect the different discourses, becomes clear in the city of Bilbao.
5 EC Photovoltaic Geographical Information System. URL: http://re.jrc.ec.europa.eu/pvgis/apps3/pvest.php (Last
acessed May 8th, 2013)
18
Figure 10: Overlapping of discourses and stakeholders groups.
It can be argued that a predominance of Discourse B (confidant visionaries) would lead to a
transition in the Path 1 (see Fig. 1) putting in the process the doses of creativity, innovation and
experimentation that processes of change need. The venturing spirit of this kind of discourse is essential
to engage local followers (Discourse A). However, the case of Bilbao shows that, in order to engage
Discourse B (workaday sceptics), those stakeholders bringing a practical sense to the table such as
those represented by Discourse C (problem-solvers) need to be involved. Problems that may arise in
this KDC platform would be potentially related to the uncertainties of scientific knowledge,
distributions of legal competences between the local and the regional, and in the delineation of means to
engage with the general public including grass-root movements and communities in the quest for a
transition process and in the role that they should have in the definition of future desirable scenarios for
the city.
6. Conclusions
Cities are crucial to global climate change mitigation efforts (Rosenzweig et al. 2010) in some
measure given that according to previous studies (OECD 1995), 80% of the energy use might be linked
to cities. As argued by Milner et al. (2012) the opportunities for decarbonization in cities are multiple
and complex, but require combinations of technological development, infrastructure investments and
19
behavioural change. This paper argues that the transition to low carbon cities is undeniably, a challenge
of the next 20 years and is a crucial stage of the global sustainability transition process.
Moreover, using a case study of the city of Bilbao, here we argue that cities need to be engaged
in the process of transition to sustainability, but not only as mere actors but, as transition tractors,
provided the legal competences of cities in urban planning and management and observing the growing
share that residential use has in resources consumption. The opportunity lies on that cities are places
where stakeholders, authorities, public companies, communities and individuals have the best potential
for generating the most fruitful and participative context for Urban Sustainability Transitions (UST).
For this we argue that actors need to be motivated and understand the need to change and also, build
self reliability and capacity to act as tractors of the process of change.
In order to analyse the perceptions and willing of the different stakeholders and its implications
for UST in a specific context, we have used the case study of Bilbao. The Q methodology has been
applied to engage stakeholders in a process of articulating their perspectives and perceptions into
different discourses, which have been interpreted to analyse the implications in a potential process of
change towards a low carbon city.
Through the case study of Bilbao this paper provides some new evidence that, in order to turn
cities into transition tractors, social networking to link pragmatists and visionaries with decision-makers
is essential. The analysis throws insights related to governance strategies of urban sustainability
transitions including potential divergences in the definition of the relevance of science and knowledge
in paths definition and the role and relevance of social participation together with disagreements on the
competences and responsibilities in the development and implementations of actions resulted from the
transition plans. These social-cognitive limitations, we argue, should be part of the parameters to be
included in studies related to urban transitions modelling, as they can be determinants of transitions
success.
Cities are complex systems and, adding to their dependence on external resources, many factors
can influence their dynamics, including maintaining competitiveness or world-wide attractiveness
(McCormick et al. 2013). We are in the century of the city (Nature News 2010) and all this attention to
cities creates external costs not only at local but also at global level (Olazabal et al. 2012). Even in the
path for sustainability, this may affect the resilience of cities and networks of cities, future well-being
and survival. It is this challenge that should motivate cities to be engaged in the process of change, not
only as actors (followers) but also as tractors learning along the way, the nuts and bolts of the
governance of these transitions. The immediate role of cities, as social–ecological and technical
networks, is to explore their transformability capacities by strengthening its social capital and foster
opportunities in the process of change.
Acknowledgments
Marta Olazabal would like to thank the help of Aiora Zabala during the Q technique learning process.
The Q mailing list ([email protected]) has also been helpful for our understanding of the
current and future challenges of this methodology.
20
References
Adger, W., Dessai, S., Goulden, M., Hulme, M., Lorenzoni, I., Nelson, D., Naess, L., Wolf, J., and
Wreford, A. 2009. Are there social limits to adaptation to climate change? Climatic Change 93(3): 335-
354.
Allenby, B. and Fink, J. 2005. Toward inherently secure and resilient societies. Science 309(5737):
1034-1036.
Basque Government. 2013a. Udalmap - Urban Information System of the Basque Country.
http://www.ogasun.ejgv.euskadi.net/r51-
udalmap/es/contenidos/informacion/udalmap/es_udalmap/udalmap.html. Last accessed April 30, 2013.
Basque Government. 2013b. Statistics of the Basque Country, Eustat. http://www.eustat.es/. Last
accessed April 30, 2013.
Bermejo, R. 2008. Un futuro sin petróleo. Colapsos y transformaciones socioeconómicas:
Catarata/Centro Investigación para la Paz.
Bilbao City Council. 2012. Plan de Acción de Energía Sostenible / Sustainable Energy Action PLan.
Bilbao, Spain: Bilbao City Countil.
Bodin, O. and Crona, B. I. 2009. The role of social networks in natural resource governance: What
relational patterns make a difference? Global Environmental Change-Human and Policy Dimensions
19(3): 366-374.
Brown, S. R. 1993. A Primer on Q Methodology. 16(3/4): 91-138.
Bryan, H. R., Stanley, E. K., and Fritz, C. 2000. Assessing Q-Assessor: A Validation Study of
Computer-Based Q Sorts versus Paper Sorts. Operant Subjectivity 23(4): 192-209.
Davies, B. B. and Hodge, I. D. 2007. Exploring environmental perspectives in lowland agriculture: A Q
methodology study in East Anglia, UK. Ecological Economics 61(2-3): 323-333.
Dziopa, F. and Ahern, K. 2011. A systematic literature review of the applications of Q-technique and its
methodology. Methodology: European Journal of Research Methods for the Behavioral and Social
Sciences 7(2): 39-55.
Ernstson, H., van der Leeuw, S. E., Redman, C. L., Meffert, D. J., Davis, G., Alfsen, C., and Elmqvist,
T. 2010. Urban transitions: on urban resilience and human-dominated ecosystems. AMBIO: A Journal
of the Human Environment 39(8): 531-545.
Evans, J. P. 2011. Resilience, ecology and adaptation in the experimental city. Transactions of the
Institute of British Geographers 36(2): 223-237.
Foliente, G., Rodgers, A., Blutstein, H., and Wang, X. 2007. Urban Sustainability Transition - A
‘Tipping Point’ Approach. Paper presented at SOAC 2007 - State of Australian Cities, Adelaide,
Australia.
Gadsden, S., Rylatt, M., and Lomas, K. 2003. Putting solar energy on the urban map: a new GIS-based
approach for dwellings. Solar Energy 74(5): 397-407.
Grauthoff, M., Janssen, U., and Fernandes, J. 2012. Identification and mobilisation of solar potentials
via local strategies. POLIS project; co-funded by Intelligent Energy Europe IEE/08/603/SI2.529237.
21
Hawkey, D., Webb, J., and Winskel, M. 2013. Organisation and governance of urban energy systems:
district heating and cooling in the UK. Journal of Cleaner Production. In press.
Hawkey, D. J. C. 2012. District heating in the UK: A Technological Innovation Systems analysis.
Environmental Innovation and Societal Transitions 5(0): 19-32.
Hodson, M. and Marvin, S. 2010. Can cities shape socio-technical transitions and how would we know
if they were? Research Policy 39(4): 477-485.
Hodson, M. and Marvin, S. 2012. Mediating Low-Carbon Urban Transitions? Forms of Organization,
Knowledge and Action. European Planning Studies 20(3): 421-439.
IEA. 2008. World Energy Outlook 2008. Paris: International Energy Agency.
Janssen, M. A., Bodin, O., Anderies, J. M., Elmqvist, T., Ernstson, H., McAllister, R. R. J., Olsson, P.,
and Ryan, P. 2006. Toward a network perspective of the study of resilience in social-ecological
systems. Ecology and Society 11(1): 1-15.
La Gennusa, M., Lascari, G., Rizzo, G., Scaccianoce, G., and Sorrentino, G. 2011. A model for
predicting the potential diffusion of solar energy systems in complex urban environments. Energy
Policy 39(9): 5335-5343.
Loorbach, D. 2007. Transition Management: New mode of governance for sustainable development.
Doctoral Thesis, Dutch Research Institute for Transitions (DRIFT) Erasmus University of Rotterdam,
Rotterdam.
Lorenzoni, I., Nicholson-Coleb, S., and Whitmarsh, L. 2007. Barriers perceived to engaging with
climate change among the UK public and their policy implications. Global Environmental Change 17:
445-459.
Madlener, R. and Sunak, Y. 2011. Impacts of urbanization on urban structures and energy demand:
What can we learn for urban energy planning and urbanization management? Sustainable Cities and
Society 1(1): 45-53.
McCormick, K., Anderberg, S., Coenen, L., and Neij, L. 2013. Advancing Sustainable Urban
Transformation. Journal of Cleaner Production. In press.
Milner, J., Davies, M., and Wilkinson, P. 2012. Urban energy, carbon management (low carbon cities)
and co-benefits for human health. Current Opinion in Environmental Sustainability 4(4): 398-404.
Nature News. 2010. Cities: The century of the city. Nature News 467(7318): 900-901.
OECD. 1995. Urban energy handbook: good local practice. pp. 244: OECD Group on Urban Affairs.
Organisation for Economic Co-operation and Development.
http://books.google.es/books?id=AMiZAAAAIAAJ.
Olazabal, M. and Pascual, U. 2013. Fostering resilience, adaptability and transformability of cities
(Mimeo).
Olazabal, M., Chelleri, L., and Waters, J. J. 2012. Why urban resilience? In Multidisciplinary
perspectives on Urban Resilience: A workshop report, edited by L. Chelleri and M. Olazabal. Bilbao,
Spain: Basque Centre for Climate Change (BC3).
Rosenzweig, C., Solecki, W., Hammer, S. A., and Mehrotra, S. 2010. Cities lead the way in climate-
change action. Nature 467(7318): 909-911.
22
Schandl, H. and Capon, A. 2012. Cities as social-ecological systems: linking metabolism, wellbeing and
human health. Current Opinion in Environmental Sustainability 4(4): 375-377.
Smith, A. 2010. Community-led urban transitions and resilience: Performing Transition Towns in a
city. In Cities and Low Carbon Transitions, edited by H. Bulkeley, V. C. Broto, M. Hodson and S.
Marvin. London: Routledge.
Truffer, B. and Coenen, L. 2011. Environmental Innovation and Sustainability Transitions in Regional
Studies. In Regional Studies Associations Conference. Regional Studies Annual Lecture. Newcastle /
Tyne.
UN. 2011. The 2011 Revision of World Urbanization Prospects. Population Division of the Department
of Economic and Social Affairs of the United Nations Secretariat.
Van Exel, J. and de Graaf, G. 2005. Q methodology: A sneak preview. Online document. http://www.
qmethodology. net/PDF/Q-methodology.
Vettorato, D., Geneletti, D., and Zambelli, P. 2012. Spatial comparison of renewable energy supply and
energy demand for low-carbon settlements. Cities 28(6): 557-566.
Westley, F., Olsson, P., Folke, C., Homer-Dixon, T., Vredenburg, H., Loorbach, D., Thompson, J.,
Nilsson, M., Lambin, E., Sendzimir, J., Banerjee, B., Galaz, V., and van der Leeuw, S. 2011. Tipping
Toward Sustainability: Emerging Pathways of Transformation. AMBIO: A Journal of the Human
Environment 40(7): 762-780.
Wolman, A. 1965. Metabolism of Cities. Scientific American 213(3): 178-193.
Zabala, A. and Pascual, U. 2013. Enhancing the validity and the accuracy of interpretation in Q
methodology (Mimeo).
Zhang, Y., Yang, Z. F., and Yu, X. Y. 2009. Ecological network and emergy analysis of urban
metabolic systems: Model development, and a case study of four Chinese cities. Ecological Modelling
220(11): 1431-1442.
23
Annex
Table A1: Q Statements (S#) classified in 7 study focus.
S# Statements used in the Q sorting English version Position (+ proactive;
- locked-in)
Pressures
1
El cambio climático no está causado por
los seres humanos. Es parte del ciclo
natural.
Climate change is not caused by
humans. It is part of the natural cycle. -
2 Los recursos energéticos fósiles se están
agotando. Fossil resources are running out. +
3 Bilbao es vulnerable al cambio climático. Bilbao is vulnerable to climate change. +
4 Euskadi tiene suficientes recursos
energéticos.
Euskadi (Basque Country) has enough
energetic resources. -
5 No quiero ni pensar cuánto costará la luz
y el gas dentro de 10 años.
I don’t even want to think how much it
will cost the electricity and gas in 10
years.
+
6 Consumimos muchísima energía. Más de
lo que necesitamos.
We consume too much energy. More
than what we need. +
Barriers/obstacles
7
Hablar de estrategia energética tiene más
sentido en el nivel regional o nacional
que en la ciudad.
Energy strategy discourse has more
sense in the regional/national than at
city level.
-
8 Mientras dure la crisis económica no se
puede hacer nada.
While there is economic crisis, we can
do nothing. -
9
Los marcos regulatorios que impongan
eficiencia energética o renovables, son
indispensables.
Regulatory framework which impose
energy efficiency and renewables are
indispensable.
+
10
Las mejoras de eficiencia energética o la
instalación de renovables no son
rentables. Se necesitan incentivos.
The improvements in energy efficiency
or the installation of renewables are not
profitable. Economic incentives are
needed.
-
Solutions
11
Pienso que se necesita asesoramiento
científico técnico para elaborar las
estrategias de ciudad.
I think that technical and scientific
support is needed to develop urban
strategies.
+
12
El ayuntamiento tiene suficientes
competencias para convertir Bilbao en
una ciudad de bajo consumo energético.
The city hall has enough competences to
turn Bilbao into a low carbon city +
13 Soluciones como los proyectos de district Solutions such as the district heating -
24
heating son las adecuadas. projects are appropriate.
14
Demasiada dependencia no es bueno
para ninguna economía. Es mejor
autoabastecerse.
Too much dependency is not good for
any economy. +
Lobbies
15
Muchos servicios públicos no se hacen
más eficientes porque son negocios
privados.
Many public services are no more
efficient because they are private
businesses (they have been
subcontracted and respond to private
interests).
+
16
Pienso que los gobiernos tienen los
intereses dependiendo donde tienen las
inversiones.
I think that governments have their
interests where they have investments. +
17 Los lobbies energéticos apoyan el ahorro
energético. Energy lobbies support energy saving. -
Governance
18
El que se tiene que actuar es el
ayuntamiento y lo hará solo bajo la
presión de la demanda ciudadana.
The city hall must be the one who takes
the lad and it will do so only under
social pressure/demand.
+
19
La energía es una de las prioridades
dentro de la estrategia de la
administración local bilbaína.
Energy is one of the priorities within the
urban strategy of Bilbao city hall. -
20
Si hubiera más participación ciudadana,
las decisiones se acogerían mucho mejor
y estaría más justificadas.
If there were more social participation,
decisions will be much supported and
much more justified.
-
21 Sé que la información en ocasiones está
manipulada.
I know that information is sometimes
manipulated. +
22 Lo que prima es la estética y no la
practicidad o el coste a largo plazo.
Aesthetics is prioritized over practicality
and cost in the long term. +
Citizens/behaviours
23 El ciudadano bilbaíno es muy
individualista.
The citizen from Bilbao (Bilbaíno) is
very individualist. +
24
Los bilbaínos están concienciados y, a
igual coste económico, elegirían la
opción en la que se consuma menos.
Citizens from Bilbao are
environmentally concerned, and at same
cost, they would choose the less
consuming option.
-
25
La factura de la luz o del gas se entiende
tanto como un ticket de la compra del
supermercado.
The electricity/gas bill is understood so
much as the receipt of a supermarket
shopping.
-
26
Muchas veces pienso: “Total, con todos
los gastos que tengo al mes, la luz y el gas
tampoco es para tanto.”
Many times I think: “All in all, taking
into account all monthly expenses,
electricity and gas are not such a big
deal.”
-
25
27 Los ecologistas quieren que “vivamos
otra vez en las cavernas.”
Ecologists want that we “come back to
the caves.” -
Technology/regulations
28 La instalación de paneles de solares no
tiene sentido en Bilbao debido al clima.
The installation of photovoltaic panels
does not have any sense in Bilbao due to
the climate conditions.
-
29 Conozco la diferencia entre la tecnología
solar térmica y la fotovoltaica.
I know the difference between solar
thermal technology and solar
photovoltaic technology.
-
30
El ciudadano ignora qué mejora la
eficiencia energética de una vivienda. Por
ejemplo dónde colocar un radiador y
porqué.
The citizen form Bilbao ignores which
measures improve the energy efficiency
of a dwelling. For example, where to
place the heaters and why.
+
31 No me fio de la tecnología solar ni de sus
garantías.
I don’t trust solar technology and its
guarantees. +
32 Mejoraría la envolvente de mi fachada
antes de instalar paneles solares.
I would rather improve the isolation of
my facade than installing solar panels. +
Table A2: Criteria to select rotating factors
Criteria Arguments that support a 4 factors’ selection
1. Eigenvalue >1 6 factors had Eigenvalue > 1
2. 2 or more respondents are flagged
in the QAnalyze module
Factor 1: 3 flags; Factor 2: 10 flags; Factor 3: 4 flags;
Factor 4: 3 flags
(in Qvarimax rotation selecting 6 factors, factor 3 had
only one flag; selecting 5 factors, factor 3 and 4 had
only one flag each. $, 3 and 2 factors selection gave
good flagging results)
3. PCA (diagnosis) Not applied
4. % explained variability > 50 % explained variability = 66
5. Size of residuals < 0.10 Not applied
6. Feasibility in the interpretation and
parsimony
4 factors: reasonable interpretation
(*) 3 and 2 factors: difficult to interpret. Very different
people in the same factors and ambiguous
interpretation of the results.

26
Table A3: Four factors with an X indicating the defining sort (flagged sort) in each factor.
Q varimax has been applied and two manual rotations were implemented after that.
FACTORS
Q-sorts Factor A
Factor B
Factor C
Factor D
1 0.3266 0.5168 0.4176 -0.1233
2 0.4172
0.6581 X 0.294
0.1871
3 0.477 0.5502 0.4497 0.0282
4 0.2454
0.7681 X 0.1813
0.3239
5 0.0405
0.52 X 0.5139
-0.004
6 0.4132
0.6611 X 0.1092
0.2243
7 -0.1513 0.4153 0.386 0.4259
8 0.0268
0.6891 X 0.3827
0.1253
9 0.475 0.5634 0.3664 0.3091
10 0.3647
0.3114
0.6715 X 0.219
11 0.5964
0.402
0.2562
0.3987
12 -0.079
0.6556 X 0.0572
0.0764
13 0.166
0.1397
0.7817 X 0.0903
14 0.3377 0.5342 0.5694 0.1616
15 0.1187 0.4162 0.5242 0.4517
16 0.488
0.1551
0.6289 X 0.3495
17 0.4878
0.2655
0.6333 X 0.1925
18 0.1937 0.4849 0.5178 0.2503
19 0.4721
0.6511 X 0.2932
0.2079
20 0.5785 X 0.3573
0.3135
0.2679
21 0.158
0.0648
-0.0406
0.8472 X
22 -0.1529
0.1772
0.501
0.5676 X
23 0.4629 0.5007 0.5426 0.2622
24 0.3736
0.4906 X 0.1914
0.1519
25 0.4784 0.4905 0.4865 0.1749
26 0.509 0.5497 0.119 0.2436
27 0.5026 X 0.4689
0.0861
0.0471
28 -0.0971
0.72 X 0.0566
0.1007
29 0.4287 0.5194 0.5027 0.1298
30 0.2729
0.4373
-0.1606
0.6092 X
27
31 0.7394 X 0.2239
0.3259
0.0707
32 0.4767
0.6262 X 0.0097
0.2912
Total
Flagged
3
10
4
3
% explained
variance 15 25 17 9
Total %
expl.var. 66 (total)
Legend
Non-influencing sorts
Flagged sorts
Table A4: Z-scores (z-sc) and Factor Scores (q-sc) for each statement and for each factor
Factors
A B C D
S# Statement z-sc q-sc z-sc q-sc z-sc q-sc z-sc q-sc
1
Climate change is not caused by
humans. It is part of the natural cycle. -2.58 -3 -0.99 -3 -1.17 -3 2.04 3
2 Fossil resources are running out. 2 3 0.61 3 0.08 3 1.22 2
3 Bilbao is vulnerable to climate change. -0.07 2 1.39 2 1.43 2 -0.47 -1
4
Euskadi (Basque Country) has enough
energetic resources. 0.04 -1 -1.18 -2 0.07 -1 -1.51 -2
5
I don’t even want to think how much it
will cost the electricity and gas in 10
years. 0.4 0 -0.57 -1 -0.51 0 1.74 2
6
We consume too much energy. More
than what we need. 0.05 2 0.66 2 1.83 3 0.97 3
7
Energy strategy discourse has more
sense in the regional/national than at
city level. -0.82 -2 0.32 1 -1.28 0 1.09 2
8
While there is economic crisis, we can
do nothing. -0.46 -3 -0.53 -2 -1.31 -3 -1.43 -3
9
Regulatory frameworks which impose
energy efficiency and renewables are
indispensable. 1.41 2 0.7 2 0.87 2 0.12 2

28
10
The improvements in energy efficiency
or the installation of renewables are not
profitable. Economic incentives are
needed. 0.21 0 -0.61 -1 -0.34 0 -0.37 -1
11
I think that technical and scientific
support is needed to develop urban
strategies. 1.38 3 1.12 2 0.15 1 -1.12 0
12
The city hall has enough competences
to turn Bilbao into a low carbon city. -1.42 -2 -0.18 0 2 2 -0.92 -2
13
Solutions such as the district heating
projects are appropriate. 0.87 1 -0.07 0 -0.25 0 0.3 1
14
Too much dependency is not good for
any economy. 0.35 1 -0.3 1 1.12 1 0.57 1
15
Many public services are no more
efficient because they are private
businesses (they have been
subcontracted and respond to private
interests). 0.44 1 0.74 1 -1.44 -2 0.51 0
16
I think that governments have their
interests where they have investments. -0.1 0 1.13 1 -0.37 0 0.48 0
17 Energy lobbies support energy saving. 1.09 0 -2.47 -3 0.1 0 0.05 0
18
The city hall must be the one who takes
the lad and it will do so only under
social pressure/demand. -1.03 -2 0.37 0 0.05 -1 0.17 0
19
Energy is one of the priorities within
the urban strategy of Bilbao city hall. 0.52 1 -1.82 -1 0.48 0 0.71 1
20
If there were more social participation,
decisions will be much supported and
much more justified. -0.64 0 0.95 1 0.96 1 0.66 0
21
I know that information is sometimes
manipulated. -0.09 0 2.34 3 -1.8 -2 0.22 1
22
Aesthetics is prioritized over
practicality and cost in the long term. 0.17 0 0.54 0 -0.28 -1 -1.56 -3
23
The citizen from Bilbao (Bilbaíno) is
very individualist. 0.64 0 -0.07 -1 -0.85 -1 -0.82 -1
24
Citizens from Bilbao are
environmentally concerned, and at
same cost, they would choose the less
consuming option. -1.85 -1 -0.02 0 1.66 2 0.71 0
25
The electricity/gas bill is understood so
much as the receipt of a supermarket
shopping. -1 -2 0.3 0 -0.54 -1 -0.89 -1
29
26
Many times I think: “All in all, taking
into account all monthly expenses,
electricity and gas are not such a big
deal.” -0.4 -2 -1.15 -2 0.77 0 -0.92 -2
27
Ecologists want that we “come back to
the caves.” -1.22 -1 -0.14 -1 -1.06 -2 -0.43 -1
28
The installation of photovoltaic panels
does not have any sense in Bilbao due
to the climate conditions. -0.23 -1 0.15 -1 -0.7 -2 -1.83 -2
29
I know the difference between solar
thermal technology and solar
photovoltaic technology. 0.45 1 0.72 1 0.27 1 0.84 1
30
Te citizen form Bilbao ignores which
measures improve the energy efficiency
of a dwelling. For example, where to
place the heaters and why. -0.16 0 0.3 0 0.98 1 -0.95 -1
31
I don’t trust solar technology and its
guarantees. 0.55 -1 -1.53 -2 -0.85 -1 -0.19 0
32
I would rather improve the isolation of
my facade than installing solar panels. 1.5 2 -0.69 0 -0.08 1 1.02 1
Table A5: Analysis of z-scores per factor and ranked statement (from agreements to
disagreements)
Factor A Factor B Factor C Factor D
S# z-sc S# z-sc S# z-sc S# z-sc
11 2.014 21 1.599 6 2.051 1 1.785
2 1.68 2 1.542 2 1.609 6 1.62
9 1.524 9 1.463 3 1.597 2 1.416
3 1.478 6 1.44 9 1.501 5 1.381
6 1.185 3 1.406 12 0.983 7 1.081
32 0.85 11 1.048 24 0.865 9 1.06
14 0.582 20 0.991 20 0.842 29 1.025
15 0.582 29 0.917 29 0.769 21 0.916
29 0.516 16 0.871 14 0.742 32 0.725
13 0.491 15 0.434 11 0.589 13 0.595
19 0.447 14 0.347 32 0.454 14 0.41
10 0.38 7 0.341 30 0.276 19 0.315

30
30 0.38 13 0.288 19 0.203 16 0.3
20 0.182 30 0.192 26 0.156 24 0.295
21 0.157 24 0.037 16 0.143 20 0.28
5 0.092 18 -0.046 13 0.12 15 0.041
23 0 22 -0.087 5 0 11 0.02
16 -0.021 32 -0.096 17 -0.023 17 -0.15
22 -0.046 25 -0.189 7 -0.325 18 -0.28
17 -0.046 12 -0.199 10 -0.338 31 -0.41
31 -0.313 23 -0.258 4 -0.613 27 -0.465
28 -0.405 5 -0.347 18 -0.674 30 -0.636
27 -0.582 28 -0.52 23 -0.695 3 -0.671
24 -0.714 10 -0.695 25 -0.707 23 -0.725
4 -0.739 27 -0.736 22 -0.73 25 -0.745
12 -0.941 19 -1.059 31 -0.755 10 -0.91
18 -0.941 26 -1.197 15 -0.902 26 -1.06
25 -1.367 31 -1.247 28 -1.008 12 -1.101
26 -1.432 8 -1.281 21 -1.116 4 -1.155
7 -1.478 4 -1.48 27 -1.186 28 -1.175
8 -1.609 1 -1.553 8 -1.632 22 -1.546
1 -1.903 17 -1.929 1 -2.196 8 -2.236
Legend
S# Number of statement
Area of agreement (> +1.00)
Area of no priority / no formed opinion
(set between -0.04 and +0.04)
Area of disagreement (< -1.00)
31
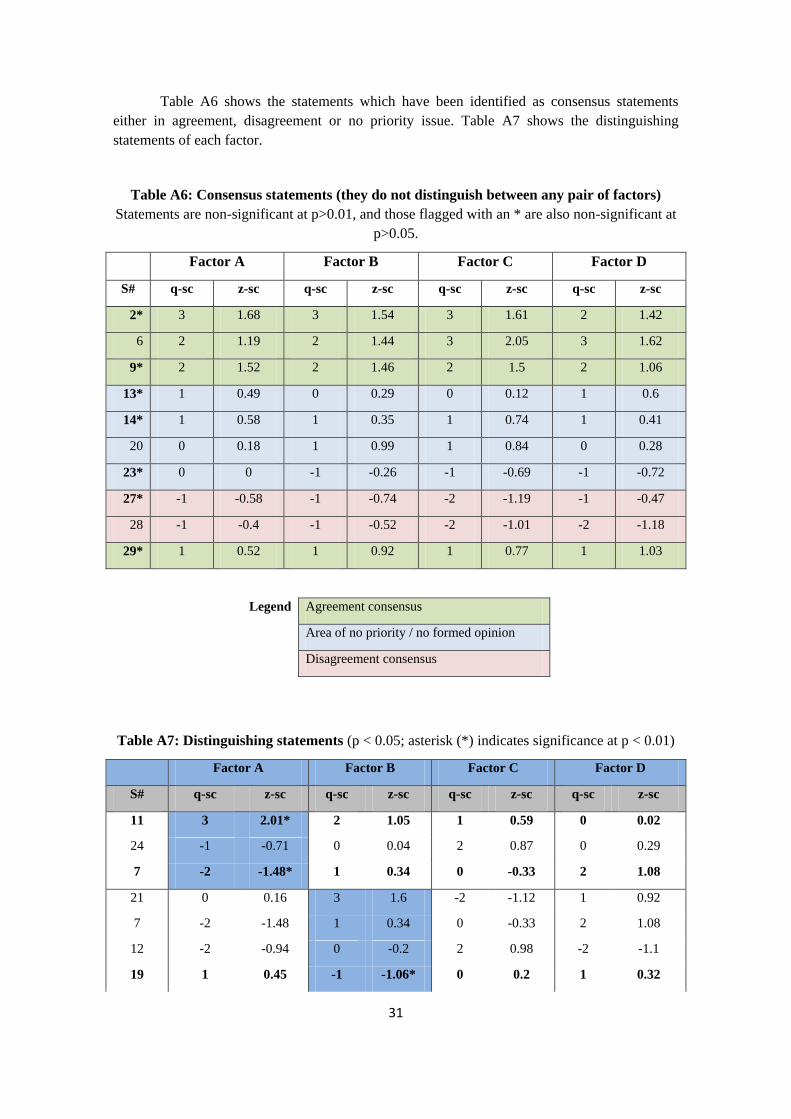
Table A6 shows the statements which have been identified as consensus statements
either in agreement, disagreement or no priority issue. Table A7 shows the distinguishing
statements of each factor.
Table A6: Consensus statements (they do not distinguish between any pair of factors)
Statements are non-significant at p>0.01, and those flagged with an * are also non-significant at
p>0.05.
Factor A Factor B Factor C Factor D
S# q-sc z-sc q-sc z-sc q-sc z-sc q-sc z-sc
2* 3 1.68 3 1.54 3 1.61 2 1.42
6 2 1.19 2 1.44 3 2.05 3 1.62
9* 2 1.52 2 1.46 2 1.5 2 1.06
13* 1 0.49 0 0.29 0 0.12 1 0.6
14* 1 0.58 1 0.35 1 0.74 1 0.41
20 0 0.18 1 0.99 1 0.84 0 0.28
23* 0 0 -1 -0.26 -1 -0.69 -1 -0.72
27* -1 -0.58 -1 -0.74 -2 -1.19 -1 -0.47
28 -1 -0.4 -1 -0.52 -2 -1.01 -2 -1.18
29* 1 0.52 1 0.92 1 0.77 1 1.03
Legend Agreement consensus
Area of no priority / no formed opinion
Disagreement consensus
Table A7: Distinguishing statements (p < 0.05; asterisk (*) indicates significance at p < 0.01)
Factor A Factor B Factor C Factor D
S# q-sc z-sc q-sc z-sc q-sc z-sc q-sc z-sc
11 3 2.01* 2 1.05 1 0.59 0 0.02
24 -1 -0.71 0 0.04 2 0.87 0 0.29
7 -2 -1.48* 1 0.34 0 -0.33 2 1.08
21 0 0.16 3 1.6 -2 -1.12 1 0.92
7 -2 -1.48 1 0.34 0 -0.33 2 1.08
12 -2 -0.94 0 -0.2 2 0.98 -2 -1.1
19 1 0.45 -1 -1.06* 0 0.2 1 0.32

32
17 0 -0.05 -3 -1.93* 0 -0.02 0 -0.15
12 -2 -0.94 0 -0.2 2 0.98* -2 -1.1
26 -2 -1.43 -2 -1.2 0 0.16* -2 -1.06
7 -2 -1.48 1 0.34 0 -0.33 2 1.08
15 1 0.58 1 0.43 -2 -0.9 0 0.04
21 0 0.16 3 1.6 -2 -1.12* 1 0.92
1 -3 -1.9 -3 -1.55 -3 -2.2 3 1.79*
5 0 0.09 -1 -0.35 0 0 2 1.38*
7 -2 -1.48 1 0.34 0 -0.33 2 1.08
30 0 0.38 0 0.19 1 0.28 -1 -0.64
3 2 1.48 2 1.41 2 1.6 -1 -0.67*
22 0 -0.05 0 -0.09 -1 -0.73 -3 -1.55
BC3 WORKING PAPER SERIES
Basque Centre for Climate Change (BC3), Bilbao, Spain
The BC3 Working Paper Series is available on the internet at the following addresses:
http://www.bc3research.org/lits_publications.html
http://ideas.repec.org/s/bcc/wpaper.html
BC3 Working Papers available:
2012-11 Luis M. Abadie and José M. Chamorro: Valuation of Wind Energy Projects: A Real Options Approach
2012-12 Helen Ding and Paulo A.L.D. Nunes: Modeling the Links between Biodiversity, Ecosystem Services and
Human Wellbeing in the context of Climate Change: Results from an Econometric Analysis on the
European Forest Ecosystems
2012-13 Helen Ding, Anil Markandya and Paulo A.L.D. Nunes: The Economic Impacts of Biodiversity Policy for
Improving the Climate Regulating Services Provided by EU Natura 2000 Habitats
2012-14 Martin-Ortega, J. E. Ojea and C. Roux. Payments for Water Ecosystem Services in Latin America:
Evidence from Reported Experience.
2013-01 Samuel Bobbino, Héctor Galván and Mikel González-Eguino: Budget-Neutral Financing to Unlock
Energy Savings Potential: An Analysis of the ESCO Model in Barcelona
2013-02 Agustin del Prado, Karlos Mas, Guillermo Pardo and Patricia Gallejones: Development of a new
modelling framework to estimate the C footprint from Basque dairy farms
2013-03 Roger Fouquet: Long Run Demand for Energy Services: the Role of Economic and Technological
Development
2013-04 David Heres, Steffen Kallbekken and Ibon Galarraga: Understanding Public Support for Externality-
Correcting Taxes and Subsidies: A Lab Experiment
2013-05 Ibon Galarraga, Luis María Abadie and Alberto Ansuategi: Economic Efficiency, Environmental
Effectiveness and Political Feasibility of Energy Efficiency Rebates: the Case of the Spanish Energy
Efficiency “Renove” Plan.
2013-06 Alexander Golub, Oleg Lugovoy, Anil Markandya, Ramon Arigoni Ortiz and James Wang: Regional
IAM: Analysis of Risk-Adjusted Costs and Benefits of Climate Policies
2013-07 Luis M. Abadie, Ibon Galarraga and Dirk Rübbelke: Evaluation of Two Alternative Carbon Capture and
Storage Technologies: A Stochastic Model
2013-08 Ibon Galarraga and Josu Lucas: Economic Evaluation of Energy Efficiency Labelling in Domestic
Appliances: the Spanish Market
2013-09 Daniel Nachtigall and Dirk Rübbelke: The Green Paradox and Learning-by-doing in the Renewable
Energy Sector
2013-10 Elisa Sainz de Murieta and Aline Chiabai: Climate change impacts on the water services in Costa Rica:
a production function for the hydroenergy sector
2013-11 Marta Olazabal and Unai Pascual: Identifying social determinants of urban low carbon transitions: the
case of energy transition in Bilbao, Basque Country