idle youth in mexico - world...
TRANSCRIPT

Policy Research Working Paper 7558
Idle Youth in Mexico
Trapped between the War on Drugs and Economic Crisis
Rafael de HoyosCarlos Gutiérrez Fierros
J. Vicente Vargas M.
Education Global Practice GroupFebruary 2016
WPS7558P
ublic
Dis
clos
ure
Aut
horiz
edP
ublic
Dis
clos
ure
Aut
horiz
edP
ublic
Dis
clos
ure
Aut
horiz
edP
ublic
Dis
clos
ure
Aut
horiz
ed

Produced by the Research Support Team
Abstract
The Policy Research Working Paper Series disseminates the findings of work in progress to encourage the exchange of ideas about development issues. An objective of the series is to get the findings out quickly, even if the presentations are less than fully polished. The papers carry the names of the authors and should be cited accordingly. The findings, interpretations, and conclusions expressed in this paper are entirely those of the authors. They do not necessarily represent the views of the International Bank for Reconstruction and Development/World Bank and its affiliated organizations, or those of the Executive Directors of the World Bank or the governments they represent.
Policy Research Working Paper 7558
This paper is a product of the Education Global Practice Group. It is part of a larger effort by the World Bank to provide open access to its research and make a contribution to development policy discussions around the world. Policy Research Working Papers are also posted on the Web at http://econ.worldbank.org. The authors may be contacted at [email protected].
The present study combines data from Mexico’s employ-ment surveys (Encuesta Nacional de Empleo and Encuesta Nacional de Ocupación y Empleo) with the country’s official statistics on murder rates to create a state-level panel data set covering the period 1995 to 2013. Including most of the common controls identified by the literature, the results show that the rate of male youth ages 19 to 24 not studying and out of work (the so-called ninis), is not correlated with
homicide rates during the period 1995 to 2006. However, there is evidence that a positive correlation between male ninis and murder rates arises between 2007 and 2013, a period during which murder rates in Mexico increased threefold. The association between ninis and homicide rates is stronger in states located along the border with the United States, a region particularly affected by organized crime and the international financial crisis of 2008–09.

Idle Youth in Mexico: Trapped between the War on Drugs and Economic Crisis1
Rafael de Hoyos The World Bank Washington DC
Carlos Gutiérrez Fierros
Observatorio de Desarrollo Regional Mexico City
J. Vicente Vargas M.
Observatorio de Desarrollo Regional Mexico City
Keywords Ninis; Violence; Mexico; NAFTA JEL K42; F16; J24
1 The present study is a background paper for the regional study “Out of school and out of work: Risk and opportunities for Latin America’s ninis.” (De Hoyos, Rogers, and Székely 2016). The authors are especially indebted to Laura Chioda, Daniel Lederman, Luis Felipe López Calva, Julian Messina and Halsey Rogers for useful comments and suggestions.

2
1. INTRODUCTION
The year 2007 marked a turning point in the long term trend in crime and violence in Mexico.
After more than 20 years of sustained reduction, Mexico experienced a dramatic increase of
300 percent in homicide rates between 2007 and 2011. A growing literature concludes that
several compounding factors contributed to this sudden escalation of violence and crime: the
success of Plan Colombia, the expiration of the U.S. Federal Assault Weapons Ban, the
escalation of conflicts among Mexican cartels, and President Calderon’s decision to send
military troops to fight them. The wave of violence was further exacerbated by government
policies that eliminated the leaders of criminal organizations, leading to disputes among a
larger number of cartels struggling for control of a fragmented drug business.
The turning point of violence translated into a higher demand for inputs from Mexican
criminal organizations. According to Guerrero (2011), the Federal Government’s so-called
war on drugs (2007-2012) pushed cartels towards greater professionalization, including the
outsourcing of specialized criminal services to street gangs (drug transportation and sale,
kidnapping, extortion, and murder, for example). Cartels and gangs established a relationship
of mutual benefit (Guerrero 2010b). This alliance became long lasting in part due to the
gangs’ blunt and effective use of violence, with children and teenagers playing a key role.
“…[I]n some gangs, training in violence starts at 12 years old. When these children reach 18
years old, they are experts in the use of violence” (Guerrero 2010a).
The change of the organizational structure of criminal activities put young Mexicans at risk,
particular those with low education or early school drop outs. It is now a well-documented
fact that crime is far more common among men than women and it tends to rise during their
late teens, peak at around the early twenties and then decline rapidly (Hansen 2003, McCall
2013, and Chioda 2015, among others). There is also growing evidence that high school drop
outs have a higher probability of engaging in criminal activities (Anderson 2014 and Chioda,
de Melo, and Soares 2012). In Mexico, information from administrative records on all alleged
criminals in 2007 shows that 90 percent of those undergoing the judicial process were men,
3
and among them, a little more than half were between 16 and 30 years old and almost 80
percent had not completed upper secondary education.
For young Mexicans, especially those in the northern states, the increase in violence
coincided with a reduction in legal employment opportunities. The international financial
crisis of 2008-2009 contracted Mexico’s GDP by more than 6 percent. After the crisis started
in the United States, the transmission mechanism into the Mexican economy was driven, to
a large extent, by a reduction in demand for exports. Thus, the manufacturing industry, using
large volumes of relatively unskilled labor and concentrated in northern cities, was hit
disproportionally. According to Bussolo et al. (2015), youth held six out of every 10 jobs
destroyed in Mexico during the crisis. Thus for young men in Mexico, particularly those in
the border states, the years 2008 to 2010 became a period of significant reductions in job
opportunities in the legal market combined with an important increase in labor demand by
organized crime.
The dramatic increase in violence, the age-crime profile, the growing number of youth, and
the perceived inability to provide them with the necessary education and job opportunities
have fueled a debate over Mexico’s so-called ninis—the term, meaning youth who are neither
working nor in school, comes from the Spanish phrase “ni estudia ni trabaja.” Almost one
in five youth in Mexico—totaling more than 4.11 million people aged 15 to 24 in the second
trimester of 2015 according to ENOE survey—is classified as a nini. The population’s total
share of ninis, both male and female, has remained constant during the last 15 years, but the
male share has increased persistently: it grew from 660,000 in 2000 to 1.12 million in 2011.
Many ninis might take part in criminal activities that do enormous harm not only to
themselves but to society at large. Thus the objective of this study is to contribute to the
growing literature explaining the causes and contexts of the escalation of violence in Mexico,
with a focus on the potential linkages between ninis and homicide rates. The study’s
empirical analysis relies on annual state-level panel data covering the period 1995-2013. This
allows us to test whether the relationship between ninis and violence is different before and
after the start of the war on drugs (2007-2013), and whether it differs between the states

4
located along the U.S. border, where there is a larger presence of organized crime, and the
rest of Mexico.
Our results show that the rate of male ninis aged 19 to 24, in itself, is uncorrelated with
homicide rates over the period as a whole. However, between 2007 and 2013 the share of
ninis correlates significantly with murder rates. This positive correlation is particularly large
in states located along the border with the United States, a region exceptionally afflicted both
by organized crime and the economic crisis of 2008-2009. According to our results, a 1
percentage point increase in the share of ninis in a border state during a period characterized
by a significant increase in violence (2007-2013) is correlated with an increase of 2.59 points
in the homicide rate per 100,000 inhabitants, accounting for 15 percent of the total increase
observed during that period. These findings suggest that the link between ninis and violence
in Mexico stems from a combination of three factors: (1) the expansion of the illegal labor
market, which fueled demand for youth labor in criminal activities, (2) the international
financial crisis of 2008-2009, which destroyed legal job opportunities for youth, and (3) the
industrial structure of two export-oriented industries, a legal one (manufacturing) and an
illegal one (drug trafficking), both needing the same input, unskilled young men, and both
concentrated in the same geographical area, the north of Mexico.
The paper is organized as follows: Following Section 1, the introduction, Section 0 presents
the evolution of crime and violence and economic activity in Mexico during the period of
analysis. Section 3 deploys our empirical strategy and describes the database constructed for
the study. Section 0 shows the results of several specifications relating ninis and homicide
rates. Finally, Section 5 concludes with some policy recommendations.
2. A CONVOLUTED PERIOD IN MEXICO: ECONOMIC CRISIS AND THE WAR ON DRUGS
The combination of external factors related to the market for illegal drugs, the international
financial crisis, and decisions taken by the Mexican government resulted in a simultaneous
increase in the market for illegal labor and a reduction of the market for legal labor. Both

5
types of labor, coincidentally, demanded the same type of input, young and unskilled
workers, and were concentrated in the same geographical area, the north of Mexico. This
confluence of factors helped trigger the most violent years in Mexico’s recent history.
2.1 THE PROLIFERATION OF VIOLENCE IN MEXICO
From the late 1980s to 2007, Mexico experienced a sustained decline in rates of violence.
The year 2007 was the most peaceful in recorded history. A sudden reversal of this trend
occurred in 2007/2008, notably in homicide rates, as shown in Figure 1. In just 4 years, from
2007 to 2011, the number of homicides tripled (from 8,867 to 27,213) and passed from a rate
per 100,000 inhabitants of 8 to 24.2
2 The homicide rate peaked in 2011. Mexico experienced a drop of 17.2 percent in the following two years (5.7 percent in 2012, 12.2 percent in 2013).

6
Figure 1: Homicide rates in Mexico 1990-2013 (per 100,000 inhabitants)
Source: Authors’ calculations based on data from INEGI, www.inegi.org.mx.
According to the nascent literature on the subject,3 the patterns in violence shown in Figure
1 are explained by a combination of factors: (1) the increased control of the Caribbean
smuggling route by U.S. security and military agencies, (2) the expiration of the Assault
Weapons Ban (AWB) in the United States; and (3) the decision by President Calderón to
deploy Federal forces—military and police—to fight drug trafficking organizations (DTOs).
The efforts of Plan Colombia to dismantle the cartels of Medellin and Cali in the 1980’s and
early 1990’s led to the closure of their preferred route for transporting drugs from Colombia
to the US through the Caribbean. By the mid 1990’s the Mexican border to the US became
the last and most important entry point of drugs into the American market. During that same
period Mexican DTOs gained control over the trade routes lost by the Colombians (Chabat,
3 Hope 2011, Dell (2014), Chabat 2010, Robles et al. 2013, and Rios 2011
7
2010; Robles et al 2013). In 2008, according to Ribaldo (2010), “90% of all cocaine entering
the United States did it through Mexico or its territorial waters”.
In 2004 the U.S. Federal Assault Weapons Ban (AWB) expired and the U.S. government did
not renew it. This multiplied the supply of guns available to Mexican criminals, increasing
the groups’ lethal power. This was particularly true in municipalities located in border states
where the volume of drugs being smuggled was on the rise with a likely contribution in
homicides.4 For instance, from 2006 to 2010 the share of homicides by fire guns increased
from 54 percent to 71 percent. Dube et al. (2013) found that as of 2006, 90 percent of the
guns seized in Mexico were traced back to the United States, and out of these, 49 percent
could be traced back to either Texas or Arizona. Although it is difficult to quantify the total
number of weapons supplied to Mexican DTOs from the United States, between 60,000 and
85,000 firearms recovered by Mexican authorities have been traced back to the United
States.5 As early as 2005-2006, municipalities with entry ports into Texas, Arizona, and New
Mexico saw homicides rise by 60 percent as compared to municipalities 100 miles away from
the border, according to Dube et al. (2013). Furthermore, they estimate that 21 percent of all
homicides in bordering municipalities stemmed from the expiration of the AWB. Chicoine
(2011) found that the expiration of the AWB explains at least 16.4 percent of the increase in
the homicide rate nationally between 2004 and 2008.
These external factors were compounded by conflicts among Mexican DTOs and a more
confrontational approach by the Mexican Government. By 2006, DTOs had initiated what
amounted to open war against each other and authorities in Ciudad Juárez, Nuevo Laredo,
and Michoacán as they sought to control strategic areas for the traffic and production of drugs
for the U.S. market. In December 2006, President Calderón received a request from the
governor of Michoacán for intervention by federal forces to stop the bloodshed. Governors
of other states soon made similar requests. The President’s response to these calls for help
was to deploy thousands of army troops and marines to fight the cartels. The institutions
normally in charge of providing citizen security—the Prosecutor’s Office and the Federal
Police—were soon displaced to a minor role. The Mexican public came to view the
4 In California, a state-level ban on assault weapons remained in place. 5 Grimaldi, James and Sari Horwitz, (2010); Hiatt, Fred, (2011).
8
deployment of military forces as a declaration of war by the Mexican state on drugs and
organized crime, in particular the powerful DTOs.
In 2008, the federal forces’ offensive against DTOs was growing in intensity and scope.
Following the original intervention in Michoacán early in 2007, the government launched
seven more operations later that year and in 2008: Baja California, Guerrero, Nuevo León,
Tamaulipas, Chihuahua, Durango and Sinaloa (see Guerrero 2013). The offensive targeted
kingpins of criminal groups in particular. This strategy—attempting to “decapitate” cartel
organizations by capturing or killing their top leaders—provoked two pernicious dynamics
on violence. Government crackdowns were seen by rival cartels as opportunities to expand
the territory under their own control (Dell 2014), particularly when criminal structures were
shocked by the neutralization of kingpins. In addition, second- and third-level figures in
organizations that lost their top leaders fought each other to assert control over the criminal
structure and sometimes split off to form new organizations. These two effects drove up the
number of DTOs (Figure 2) and in an epidemic form, violence itself. According to Guerrero
(2011), the number of DTOs in Mexico grew from six to 16 between 2006 and 2011, with
new organizations being formed as a result of internal fractures and fights to gain control of
leaderless structures (see Figure 2).

9
Figure 2: Evolution of the number of drug trafficking organizations, 2006-2011
Source: using data from Guerrero (2011) 2.2 THE RISE AND FALL OF THE NORTHERN STATES
The period 1995-2007 in Mexico saw a rapid expansion of international trade fueled mainly
by the country’s comparative advantage in the production of manufactured goods. The North
American Free Trade Agreement (NAFTA) increased demand for Mexican exports to the
United States, particularly manufactured products. Exploiting their proximity to the United
States and favorable tax conditions, maquiladoras6 flourished, creating many jobs in the
northern Mexican states. The maquila boom brought about improvements in employment
opportunities and increased real wages of relatively unskilled workers, particularly in
municipalities bordering the United States (Hanson 2004 and Robertson 2006).
Improvements in labor market outcomes for unskilled youth in border cities attracted them
6 Maquila is a labor-intensive manufacturing operation where factories import raw material on a duty-free basis, perform an assembling process, and then export the final product, usually back to the raw materials' country of origin.
Year 2006 2007-2009 2010 2011
Cártel de Sinaloa Cártel de Sinaloa Cártel de Sinaloa
Pacífico Sur
La Mano con Ojos
La Nueva Administración
Cártel Independiente de Acapulco
Cártel Independiente de Acapulco
Cártel de Juárez Cártel de Juárez Cártel de Juárez Cártel de Juárez
Cártel de Tijuana
Francción del El Teo
Cártel del Golfo Cártel del Golfo
Los Zetas Los Zetas
Los Caballeros Templarios
Los Incorregibles
La Empresa
La Resistencia La ResistenciaCártel de Jalisco Nueva
GeneraciónCártel de Jalisco Nueva
GeneraciónLa Nueva Federación
Total 6 8 11 16
Drug-Trafficking Organization
Pacífico Sur
Cártel del Charro Cártel del Charrro
Cártel de SinaloaBeltrán Leyva
Cártel del Golfo Golfo-Los Zetas
Milenio Milenio
La Familia Michoacana La Familia Michoacana La Familia Michoacana
Cártel de Tijuana Cártel de TijuanaCártel de Tijuana
10
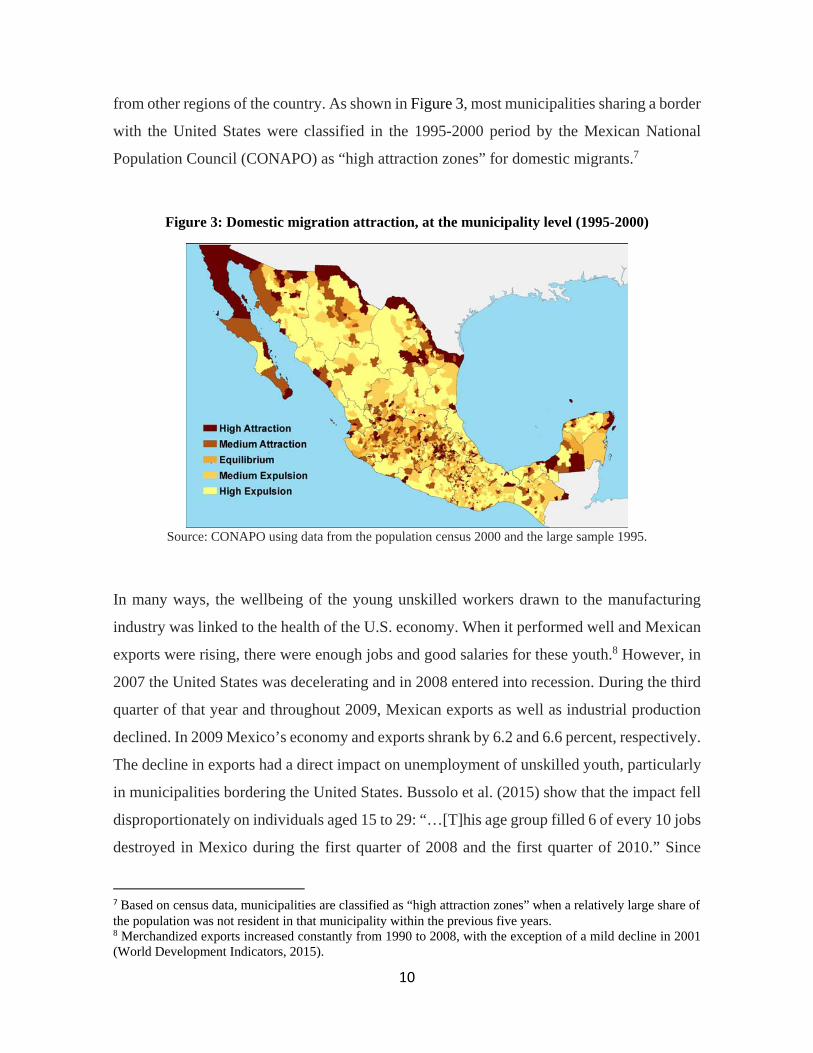
from other regions of the country. As shown in Figure 3, most municipalities sharing a border
with the United States were classified in the 1995-2000 period by the Mexican National
Population Council (CONAPO) as “high attraction zones” for domestic migrants.7
Figure 3: Domestic migration attraction, at the municipality level (1995-2000)
Source: CONAPO using data from the population census 2000 and the large sample 1995.
In many ways, the wellbeing of the young unskilled workers drawn to the manufacturing
industry was linked to the health of the U.S. economy. When it performed well and Mexican
exports were rising, there were enough jobs and good salaries for these youth.8 However, in
2007 the United States was decelerating and in 2008 entered into recession. During the third
quarter of that year and throughout 2009, Mexican exports as well as industrial production
declined. In 2009 Mexico’s economy and exports shrank by 6.2 and 6.6 percent, respectively.
The decline in exports had a direct impact on unemployment of unskilled youth, particularly
in municipalities bordering the United States. Bussolo et al. (2015) show that the impact fell
disproportionately on individuals aged 15 to 29: “…[T]his age group filled 6 of every 10 jobs
destroyed in Mexico during the first quarter of 2008 and the first quarter of 2010.” Since
7 Based on census data, municipalities are classified as “high attraction zones” when a relatively large share of the population was not resident in that municipality within the previous five years. 8 Merchandized exports increased constantly from 1990 to 2008, with the exception of a mild decline in 2001 (World Development Indicators, 2015).

11
youth who have left the education system, most of them to enter the labor market, rarely go
back to school (only 5 percent do, according to Baron, Popova, and Sánchez Díaz 2015), the
global financial crisis generated a significant number of ninis, particularly in border cities
(Error! Reference source not found.).
Figure 4: Evolution of the share of male youths who are ninis in border and non-border states
Source: Authors’ calculations based on data from ENOE
The new ninis found themselves in an already violent context, with few job opportunities in
the market for legal activities and much stronger restrictions against taking what used to be
the traditional exit: migrating to the United States to find a job. During 2008, 2009, and 2010,
the sluggish U.S. economy was not able to create enough jobs to absorb Mexican migrants.
Indeed, the Pew Hispanic Center (2012) found that flows from Mexico to the United States
declined from a peak of 770,000 illegal migrants in the year 2000 to 140,000 in 2010. U.S.
immigration authorities became increasingly more assertive along the border, crimping the
influx of illegal migrants. At the same time, they became more efficient in deporting illegal
Mexicans who already lived in the United States. The Pew Hispanic Center (2012) estimates
that 4.4 million Mexican citizens were deported to Mexico by the U.S. Department of
Homeland Security between 2005 and 2010. The great majority of those people were taken
to Mexican border cities. There they not only had to face a socio-economic environment
marked by high unemployment, but also a climate of insecurity characterized by the war on

12
drugs.
3. EMPIRICAL STRATEGY
Can the evolution of violence described in the previous section be partly explained by the
patterns of youth out of school and out of work in Mexico? Is this relationship significant
regardless of the period of analysis? Or is it only relevant during the escalation of violence
between 2007 and 2012 and, in particular, in the northern states which were hit
disproportionally both by the economic crisis and the violence related to DTOs? To answer
these questions, we construct panel data from the 31 Mexican states plus the Federal District
as the unit of observation during the period 1995 to 2013. In particular, we estimate the
following relationship:
(1)
where is a variable measuring the levels of violence in state “i” at time “t”; is
the proportion of youth aged 15 to 24 who are not studying and not working; and is a
matrix of state-level controls. The parameter of interest is β, which captures the conditional
correlation between the proportion of ninis and the incidence of violence. Equation (1)
controls for all state characteristics that are constant over time α , and time effects common
to all states μ . Finally, ε is an idiosyncratic term following a normal distribution with zero
mean and known variance. To try to answer the questions posed above, several variations of
equation (1), including different controls, interaction terms, and the use of different types of
ninis, are estimated and presented in the results section.
The controls include variables that have been identified by the literature as having a
significant effect on crime and violence.9 However, the controls included in the empirical
estimation of equation (1) capture only elements related to the expected relative benefit
9 For a recent comprehensive study on the determinants of crime and violence in Latin America, see Chioda (2015).

13
between legal and illegal activities, leaving aside factors capturing the relative costs such as
the efforts to prevent and fight criminal activity. Among the costs indicators, the most
common ones refer to expenditure in security, the number of police officers, the prison
sentences associated with commission of crime, and detention rates as percentage of
committed crimes (Dilis, Miron, and Summers 2010). These are important elements
determining the evolution of violence. But, in view of how limited is the systematically
collected information of this type, including them would significantly reduce the number of
observations in our analysis and introduce an information-availability bias.
The set of controls included in the empirical exercise below are the following: hourly labor
income (Gould, Weinberg, and Mustard 2002); income inequality (Bourguignon 1999 and
Enamorado et al. 2014); unemployment rate among the population aged 35 to 44 (Freeman
1999); high school dropout rates (Anderson 2014 and Chioda 2015). In addition, we control
for the number of youth aged 15 to 24 as a share of the total population, the proportion of
workers in the informal sector, and the proportion of total employment accounted for by
employees in the manufacturing industries.
3.1 DATA SOURCES
In Mexico, like in most developing countries, measuring violence and criminal activities is a
challenging task. The ideal measurement would capture all illegal activities occurring in a
country during a given period. However, this is impossible in practical terms. By their nature,
illegal activities are hidden and, in contexts of weak institutional capacity and a limited
application of the rule of law, the great majority of crimes go unreported by victims. For
instance, according to the most recent victimization survey, approximately 33 million crimes
were committed in Mexico in 2013 of which only 10 percent were reported.
However, there are two crimes that are measured with some degree of accuracy: homicide
and car theft. Unlike other offences, for which the opening of a ministerial investigation
requires a formal complaint by the victim, homicides are automatically investigated by the
judiciary. This generates a generally reliable count of homicides. Moreover, the record of
14
mortality statistics draws on a second solid source, reports of the numbers of death certificates
issued by the health system. The present study uses the homicide rate per 100,000 inhabitants
as the main measurement of crime and violence in Mexico. This indicator is collected
monthly by the Mexican Statistical Office (INEGI).
As a robustness test, the incidence of car theft is used as a complementary measure of crime.
According to the most recent victimization survey, about 83 percent of cars stolen are
reported, making it a generally reliable measurement of crime (ENVIPE 2014).10 However,
while this is a good proxy for crime in general, it is a limited one for violence because not all
car thefts involve violence. The information on car robbery is gathered by the National
Security System (SNSP) based on preliminary inquiries (averiguaciones previas) by the
judiciary system.
The estimates for the number of ninis come from the Encuesta Nacional de Empleo (ENE),
an annual employment survey conducted between 1995 and 2004, and from the Encuesta
Nacional de Ocupación y Empleo (ENOE), a quarterly survey conducted in Mexico since
2005. Both ENE and ENOE are statistically representative at the state level. Since ENE is
collected during the second quarter of each year, we include information from ENOE only
for the second quarter of each year; this has the double advantage of making both
employment series compatible while avoiding variations due to seasonality. We define as
ninis those individuals in the 15-24 age range who are neither enrolled in formal schooling
(whether public or private) nor working at the time of being surveyed. Working youth are
defined—following the conventional definition—as individuals who have worked at least
one hour in the past week.
All but one of the controls were constructed from the employment surveys (ENE and ENOE).
The income measure used is the log of the hourly labor remunerations; inequality is captured
by the Gini coefficient of the per capita labor remunerations; the identification of informal
10 Even though the rate of car stolen that are reported is relatively high, a biased explained by unreported events is still possible. However, since our empirical strategy relies on the correlation between changes in crime and changes in the rate of ninis and the rate of unreported stolen cars have changed little over time, the expected bias is small.

15
sector workers follows one of INEGI’s definitions, i.e. those occupied in economic units
without formal accounting registries. Finally, high school dropout rates are taken from the
official statistics of the Secretariat of Public Education (SEP).
SOME STYLIZED FACTS
As has been documented by previous studies of ninis,11 the latest figures indicate that the
number of ninis as a share of the youth population in Mexico is slightly below 20 percent,
with three out of every four ninis being women. There is a long-term downward trend in the
proportion of ninis, but all of it is due to the reduction in female ninis. An important stylized
fact is that the share and absolute number of male ninis in Mexico shows a rising trend since
the late 1990s, accelerating during the years of increased violence (2007-2011), and
particularly among those ninis aged 19 to 24—see Figure 5.
Figure 5: Evolution in the number of ninis, by gender and age group (in thousands)
Males Females
Source: Authors calculations, based on ENE (1995-2004) and ENOE (2005-2013), INEGI
Figure 6 shows scatter plots and a line with the best fit between male ninis aged 19 to 24 and
homicides rates per 100,000 inhabitants, distinguishing between two periods, 1995-2006 and
11 See, for example, Arceo and Campos (2012), Negrete and Leyva (2013), Cárdenas et al. (forthcoming), De Hoyos et al. (2015).
16
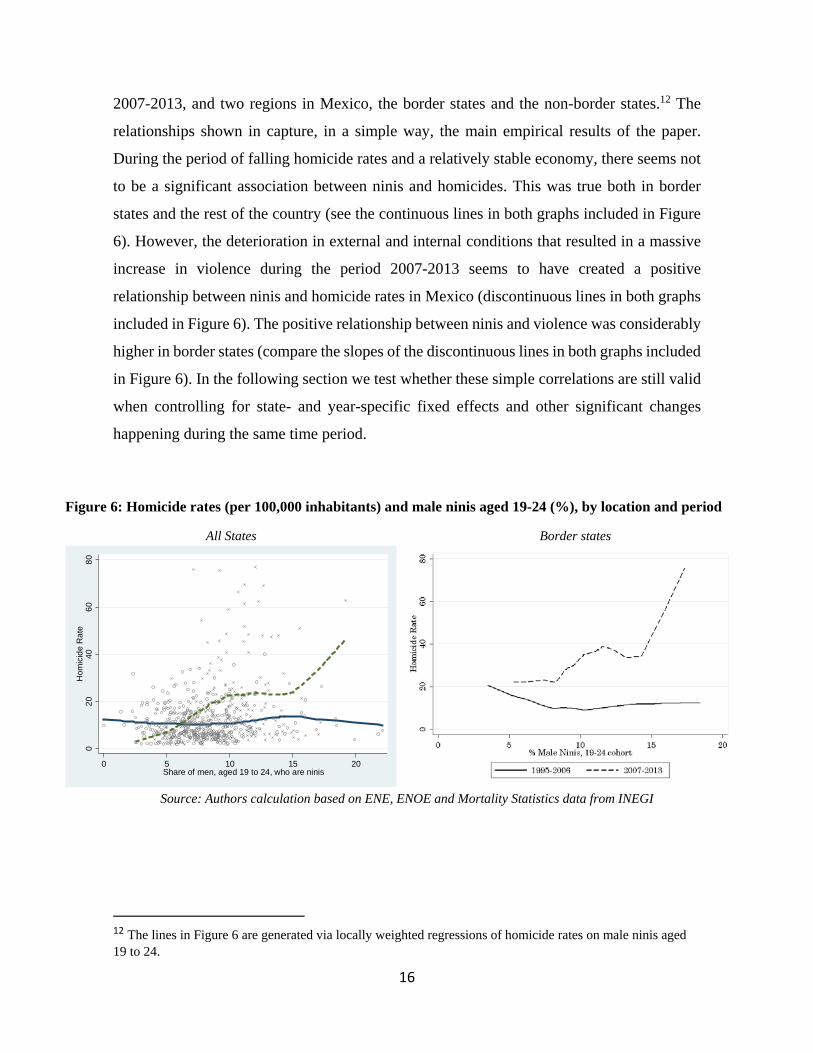
2007-2013, and two regions in Mexico, the border states and the non-border states.12 The
relationships shown in capture, in a simple way, the main empirical results of the paper.
During the period of falling homicide rates and a relatively stable economy, there seems not
to be a significant association between ninis and homicides. This was true both in border
states and the rest of the country (see the continuous lines in both graphs included in Figure
6). However, the deterioration in external and internal conditions that resulted in a massive
increase in violence during the period 2007-2013 seems to have created a positive
relationship between ninis and homicide rates in Mexico (discontinuous lines in both graphs
included in Figure 6). The positive relationship between ninis and violence was considerably
higher in border states (compare the slopes of the discontinuous lines in both graphs included
in Figure 6). In the following section we test whether these simple correlations are still valid
when controlling for state- and year-specific fixed effects and other significant changes
happening during the same time period.
Figure 6: Homicide rates (per 100,000 inhabitants) and male ninis aged 19-24 (%), by location and period
All States Border states
Source: Authors calculation based on ENE, ENOE and Mortality Statistics data from INEGI
12 The lines in Figure 6 are generated via locally weighted regressions of homicide rates on male ninis aged 19 to 24.
02
04
06
08
0H
omic
ide
Ra
te
0 5 10 15 20Share of men, aged 19 to 24, who are ninis
17
Finally, we must take into account the incidence of crime in particular age groups. As Chioda
(2015) has discussed, both the age profile of offenders and that of victims of crime in Mexico
follow the same pattern. The incidence of crime increases during adolescence reaching
incidence peak at 20 to 25 years of age, and beginning a smooth reduction afterwards. This
pattern remains if we analyze property crimes, violent crimes or homicides. As shown in
Figure 7, the same age-crime profile is followed by alleged offenders.
4. RESULTS
We start the analysis by running a regression of the homicide rate (per 100,000 inhabitants)
against the controls without including a measurement of ninis. The results of this first
specification are included in column (1) of Table 1. Most of the controls show the expected
sign, although with a limited significance. Higher unemployment, high school dropout rates
or income inequality are positively associated with homicide rates, but none of these effects
is statistically different from zero. A larger proportion of total employment in manufacturing
reduces the homicide rates. A correlate that stands out is hourly labor remunerations which
consistently appears as highly significant and economically large in all specifications. For
instance, in 2013, the state with the highest hourly remuneration had an average level of 16
pesos while the level in the poorest state was 5 pesos; according to the results in Table 1 this
difference accounts for 10 homicides per 100,000 inhabitants or one third of the observed
differences in murder rates between the two states. It should be remembered that these are
results that are already controlling for state-level and year-specific fixed effects. Therefore
our estimated coefficients capture the relationship between homicides and independent
variables over time.
Specifications (2), (3), and (4) of Table 1 build on specification (1) but include, in a
cumulative way, the proportion of ninis aged 15 to 24, the proportion of male ninis aged 15
to 24 and the proportion of male ninis aged 19 to 24, respectively. The results from these
three specifications consistently show that there is no significant correlation between the
share of overall ninis and homicide rates. When the share of male ninis is singled out,

18
specifications (3) and (4) show that changes in the share of male ninis are not correlated with
homicide rates in Mexico. As shown by specification (4), changes in the share of male ninis
aged 19 to 24 are marginally correlated with homicides rates (at the 93.3 percent level of
confidence). Although statistically weak, a positive relationship between violence and
homicide rates is not surprising given the profile of the crime perpetuators described above
(young male adults with relatively low education levels).
Table 1: Panel data estimations for the relationship between ninis and homicide rates
Independent variables Homicide rate INEGI (1995-2013)
(1) (2) (3) (4) Share of ninis
All ninis -0.0231 -0.0385 0.0503 (0.23) (0.27) (0.27)
Male ninis 0.0334 -0.663 (0.30) (0.48)
Males ninis aged 19 to 24 0.625 * (0.34) Controls Share of the population aged 15 to 24 -0.0038 -0.0059 -0.014 0.079 (0.56) (0.56) (0.57) (0.57) Log of hourly labor income -9.802*** -9.901*** -9.934*** -10.13*** (3.47) (3.61) (3.63) (3.62) Unemployment rate, aged 35 to 44 55.44 55.84 54.89 58.25 (39.35) (39.58) (40.52) (40.47) Gini (per capita labor income) 11.02 11.04 10.92 12.22 (15.96) (15.98) (16.04) (16.02) Share of informal workers -12.71 -12.57 -12.97 -13.42 (17.72) (17.79) (18.18) (18.14) Share of employment in manufacture -40.03 * -40.29 * -40.27 * -33.32 (22.38) (22.55) (22.57) (22.83) High school dropout rate 0.406 0.406 0.404 0.412 (0.27) (0.27) (0.271) (0.27) Constant 29.02 * 29.86 * 30.39 * 25.59
(15.36) (17.45) (18.10) (18.25)
Observations 607 607 607 607 R-squared 0.268 0.268 0.268 0.272
Notes: Standard errors in parentheses, *** p<0.01, ** p<0.05, * p<0.1; all estimations include state-level fixed effects and yearly dummies. Informal workers are defined as those who work for a firm that does not have accounting recordsand does not contribute to social security.

19
Table 2 shows the results of five alternative specifications where the share of male ninis aged
19 to 24 is interacted with two dummies, one for the period of the war against DTOs, (2007-
2013) and a second one for the states bordering with the United States.13 Specification (1) in
Table 2 is similar to specification (4) in Table 1, but this time a dummy for the period 2007-
2013 is included. Notice that including this dummy—which is positive and significant—
leaves the rest of the results practically unchanged. However, as shown by specification (2)
in Table 2, when the dummy capturing the period of the war against DTOs is interacted with
the share of male ninis aged 19 to 24, the correlation between homicides rates and ninis is
only significant during the period of high violence. Per capita labor remunerations are still a
significant predictor of homicide rates and upper secondary drop-out rates become
marginally significant (with a positive sign) at the 90 percent level of confidence.
The sign and size of the correlation between male ninis aged 19 to 24 and homicide rates are
unchanged when the specification includes a second interaction between ninis and states in
the U.S.-Mexico border (specification 3 in Table 2). The results of this last specification show
that in states along the border, precisely where the war against DTOs and the international
financial crisis hit hardest, the correlation between male ninis and homicide rates is stronger.
The fourth specification in Table 2 includes a triple interaction between male ninis aged 19
to 24 during the war against DTOs in Mexican border states.14 The results confirm the ones
in the previous specification but the positive association between male ninis aged 19 to 24
and homicide rates is explained and exacerbated by two conditions, namely the war against
DTOs and the economic crisis. However, when an interaction capturing the effects of border
states during the period 2007-2013 is included, the effects of ninis in the border cities during
a time of crime is reduced.15
13 Since the regressions include state fixed effects, it is impossible to include a dummy, without interactions, for states along the U.S.-Mexico border. 14 Border states include: Baja California , Sonora, Chihuahua, Coahuila, Nuevo León and Tamaulipas 15 To rule out a potential spurious correlation between ninis in border states and homicide rates, two alternative specifications were estimated. First, the dummy “border states” and its interaction with ninis was modified to include states immediately to the south of those in the border: Sinaloa, Durango, Zacatecas, San Luis Potosí and Veracruz (northern but not border states). Under this alternative specification, the interaction effects presented in specification 5 of Table 2 remain significant but with a smaller coefficient. Second, a “northern but not border states” dummy was included as a separate interactive effect. The interaction of ninis with “northern but not border states” was not significant but the interaction with “border states” remained significant and with a point estimate very close to the one presented in specification 5 of Table 2.

20
The results presented so far suggest that an increase in the share of ninis, or even those who
fit the profile of crime perpetuators (young male adults), is not correlated with the homicide
rate, unless the increase takes place within the context of an increasing market for illegal
activities. Taking specification (5) in Table 2 as our preferred measure, a one percentage
point increase in the share of male ninis aged 19 to 24 during the period 2007-2013 is
associated, roughly, with an increase of one in the homicide rate (per 100,000 inhabitants).
The same elasticity is higher (1.37) in northern Mexican states sharing a border with the
United States and is even higher (2.37 = 1+1.37) in those states during the period 2007-2013.
These elasticities are far from trivial. For instance, the share of male ninis aged 19 to 24 grew
from 7 percent in 2006 to 10.9 percent in 2011 and this change accounted for an increase in
3.8 in the per 100,000 inhabitants homicide rate during the same period, or almost a quarter
of the total increase of 16. The increase in the share of ninis during the same period was
larger in states along the border dividing the United States and Mexico, rising from 6.8
percent in 2006 to 11.8 percent in 2011 and accounting for a massive increase of 11.8
homicides per 100,000 inhabitants or a third of the total increase of 35 in border states during
those years.
An important result is the positive and significant effect of high school dropout rates on the
rates of violence, with a one percentage point increase in dropout rates correlated with a
growth of 0.6 in the homicide rate per 100,000 inhabitants. In four of the five specifications
included in Table 2, higher dropout rates are positively associated with our measure of
violence. This result is consistent with a vast literature, mainly from the United States,
showing that time spent in school is negatively associated with crime rates. For instance,
using county-level data for the United States during the period 1980-2008, Anderson (2014)
shows that the minimum dropout age is negatively related to juvenile crime. Employing a
regression discontinuity exploiting the exogenously determined cut day for enrolling, Cook
and Kang (2014) find that members of the delayed entry group are more likely to drop out
and to be convicted of a serious crime. High school dropout rates decreased 2.3 percentage
points during the period of violence reduction in Mexico (1995-2007), contributing a decline
21
of 1.4 in the homicide rate or almost 20 percent of the overall reduction observed during that
period.
As a robustness test of the correlation between crime and ninis captured by our empirical
approach, the homicide rate is substituted for the rate of car robberies per 1,000 inhabitants
as the dependent variable. As is shown in Table A1 in the annex, using the same specification
as the ones presented in Table 2, an increase in one percentage point in the share of male
ninis aged 19 to 24 is associated with an increase of 10 car robberies during the period 2007-
2013. The interaction of ninis with period and border states remain mostly significant in
accounting for the variation in car robbery. The regressions for car theft also confirm the
positive relationship between high school dropout rates and crime, with an increase of 1
percent in the dropout rate correlated with almost seven additional cars being stolen.

22
Table 2: Panel data estimations for the relationship between ninis and homicide rates, including interactions
Independent variables Homicide rate INEGI(1995-2013)
(1) (2) (3) (4) (5) Share of ninis
All ninis 0.050 0.128 0.110 0.0781 0.0999 (0.27) (0.27) (0.26) (0.25) (0.26)
Male ninis -0.66 -0.666 -0.765 -0.587 -0.632 (0.48) (0.48) (0.47) (0.45) (0.46)
Males ninis aged 19 to 24 0.63 * 0.271 -0.034 0.0869 0.0859 (0.34) (0.35) (0.35) (0.34) (0.337) % Male ninis aged 19 to 24, interacted with:
Dummy for period 2007-2013 1.209 *** 1.206 *** 0.918 *** 1.007 *** (0.34) (0.33) (0.32) (0.33)
Dummy for border state 2.296 *** 1.124 ** 1.366 *** (0.41) (0.45) (0.51)
(Period)*(Border) 1.328 *** 0.526 (0.23) (0.85) Controls Dummy for period 2007-2013 7.761 ** -4.317 -4.830 -4.880 -5.706 (3.80) (5.037) (4.91) (4.77) (4.84) (Period)*(Border) 8.396 (8.52) Share of the population aged 15 to 24 0.079 0.079 -0.173 0.075 0.0656 (0.57) (0.56) (0.55) (0.54) (0.54) Log of hourly labor income -10.13 *** -6.831 * -1.833 1.257 1.740 (3.62) (3.69) (3.71) (3.64) (3.68) Unemployment rate, aged 35 to 44 58.25 42.23 31.80 24.77 25.84 (40.47) (40.28) (39.27) (38.18) (38.19) Gini (per capita labor income) 12.22 11.47 -2.274 -12.22 -12.45 (16.02) (15.85) (15.63) (15.28) (15.28) Share of informal workers -13.42 -11.38 -19.04 -17.59 -17.72 (18.14) (17.95) (17.54) (17.04) (17.04) Share of employment in manufacture -33.32 -35.04 -12.76 -4.812 -1.974 (22.83) (22.59) (22.36) (21.77) (21.96) High school dropout rate 0.412 0.45 * 0.568 ** 0.639 ** 0.63 ** (0.270) (0.27) (0.261) (0.25) (0.25) Constant 25.59 20.57 19.00 10.67 9.046
(18.25) (18.11) (17.63) (17.19) (17.27)Notes: Standard errors in parentheses, *** p<0.01, ** p<0.05, * p<0.1; all estimations include State level fixed effects and yearly dummies. Informal workers are defined as those who work for a firm that does not have accounting records and does not contribute to social security.
23
4.1 METHODOLOGICAL SHORTCOMINGS
Despite being intuitively accurate and in line with the international evidence, the results presented
above have some weaknesses. The analysis omits important determinants of crime and violence, in
particular those capturing changes in the judicial system. These omitted variables include the number
of police officers per 100,000 inhabitants, the quality of the police force, and the budget spent on
security, among others. If one or more of these omitted variables are indeed relevant in explaining
violence patterns, then our results would be biased. But perhaps the most important methodological
limitation of our empirical approach is that in order to elucidate the relationship between ninis and
crime and violence, it is necessary to establish the causal effect of the former to the latter. In theory
and, most likely in practice, ninis can cause more crime and vice versa. Using micro data for Latin
America, Cárdenas, De Hoyos, and Székely (2015) show that per capita GDP and its growth rate are
important determinants of the share of ninis. Enamorado, López-Calva, and Rodríguez-Castelán (2014)
and Robles, Calderón, and Magaloni (2013) show that violence is negatively associated with economic
activity in Mexico. Putting these two results together implies that the rate of ninis is determined,
through its impact on growth, by crime and violence. In other words, our independent variable of
interest is, at least partly, determined by the dependent variable.
Until more information on the judicial system in Mexico becomes available, the problem of omitted
variables is virtually impossible to address. To tackle reverse causality, we could have tried to find an
instrument correlated with male ninis aged 19 to 24 and uncorrelated with homicide rates (e.g. non-
Mexican U.S. imports).16 Even if this was an informative and valid instrument for male ninis, that
would not solve, entirely, the endogeneity problem. There are other right-hand side variables besides
ninis that are endogenous to changes in crime and violence. For example, through its effect on
economic growth, violence partly determines labor incomes and employment rates. There is also
evidence showing that violence increases the likelihood of high school dropout (Grogger 1997). We
would therefore need as many valid instruments as the number of endogenous independent variables
included in our regression; failing to factor in other endogenous variables would result in a biased
estimated coefficient for ninis.
16 For an attempt to address the endogeneity problem in the relationship between ninis and crime, see Gómez Ayala and Merino (2012).
24
Instead of pursuing an instrumental variables approach, two complementary tests are undertaken in
hopes that they will add to the credibility of our estimates despite the methodological shortcomings.
First, the one-year lagged share of male ninis aged 19 to 24 was used as the relevant independent
variable instead of the contemporary share of ninis. The results of this alternative specification show a
positive association between male ninis and crime during the period of high violence rates, especially
in the north of Mexico. Third, as a falsification test for our main results, we ran the specifications
included in Table 2 but with the share of female ninis aged 19 to 24 as the independent variable. There
was no association either directly or in an interaction form (except when interacted both with the period
2007-2013 and the dummy for bordering state) between female ninis and homicide rates in Mexico.
4.2 WHY ARE BORDER STATES DIFFERENT?
One of the underlying assumptions linking male ninis with violence during the war on drugs,
particularly in border states, is that both legal and illegal export industries demand the same kind of
worker. This section presents evidence that this assumption is accurate. It does so by showing that the
typologies of maquila sector workers and of crime perpetrators are very similar, at least along three
dimensions—gender, age, and schooling. The similarities in the intensity with which the two industries
(legal and illegal) use the same input (relatively unskilled young men) and coincide in regional location
(border cities) help explain the results presented above.
Figure 7 compares the age and education profile of workers in the manufacturing sector with that of
alleged criminals. As mentioned before, the correlation of alleged criminals and workers in
manufacture increases significantly once we pass the age group 15-18 and falls from the age group 35-
44 onwards. According to Atkin (2012), during the late 1980s and early 1990s, the maquila sector made
intensive use of female workers, but by the year 2000, half of the employees in the sector were men.
The same author shows that in 2000 about two thirds of workers in manufacturing industries were less
than 30 years old and, among them, 80 percent had not finished upper secondary education, i.e. had
less than 12 years of formal schooling.
The jobs and wage improvements generated by NAFTA and the maquilas in the north of Mexico did
not come free of costs. As shown by Atkin (2012), the employment opportunities and better wages

25
caused by trade liberalization increased the relative cost of school participation, particularly for youth
aged 15 to 18 in the north of Mexico. The high cost of opportunity meant that many adolescents decided
to drop out of school in order to get jobs in the maquilas. Atkin (2012) shows that for every twenty
new jobs created in the manufacturing sector, one student dropped out after completing lower
secondary rather than going on through upper secondary (grades 10-12). Data from ENOE shows that
during the period 2008-2009, in the middle of the international financial crisis, men accounted for 70
percent of the job losses in Mexico, measured as those who had a job in the first trimester of 2008 but
were unemployed in the second trimester of 2009. The rate in states along the border was slightly
above, 72 percent during that same period.
Figure 7: Age and schooling distribution of workers in manufacturing industries and alleged offenders
Notes: The information for manufacturing workers comes from Atkin (2012) who uses the 2000 population census to compute the share of workers in manufacturing by age. The education distribution corresponds to workers aged 16- 28. The information for alleged offenders comes from the 2007 census of alleged criminals from prosecutors’ offices. The education distribution corresponds to alleged criminals aged 16-28.
As a result of the international financial crisis, with its subsequent reduction in demand for Mexican
exports to the United States, young and relatively unskilled workers in the north of Mexico faced a
reduction in labor demand. At the same time, the same type of worker in the same geographical location
found an increasing labor demand for illegal activities ( Figure 7). Information from administrative
records on all alleged criminals (presuntos criminales) shows that the profile of male ninis corresponds
to the profile of crime perpetuators. In 2007 a little more than half of the presuntos criminales
undergoing a judicial process were between 16 and 30 years old and close to 80 percent of the total
Years of Schooling,

26
presuntos had not completed high school.17 Even if, as Chioda (2015) has alerted from the study of
Mexican homicide data, the quality of employment—and not only the availability of jobs, plays an
important role in the dynamics of murder rates, the coincidence of a sudden labor market shock in the
maquila sector and the demand for criminal activities (originated by the government’s crackdown and
the war for territorial control among DTO’s) dramatically shaped the opportunity costs ninis faced in
relation to getting involved in legal or illegal activities.18 We believe that the similarities in
characteristics between workers in the manufacturing maquila sector and the alleged criminals help
explain the significant correlation between male ninis aged 19 to 24 and homicide rates during the
period 2007 - 2013, particularly in the north of Mexico.
5. CONCLUSIONS
The results presented here suggest that ninis, on their own, are not associated with crime and violence
in Mexico. However, during the period 2007-2013, the relationship is positive and significant. The
association between ninis and homicide rates is stronger in states located along the border with the
United States, a region particularly affected by organized crime and the international financial crisis of
2008-2009. During the period 2007-2011, which saw a massive rise in violence, the increase in the
number of male ninis in Mexico accounted for a quarter of the total escalation in the homicide rate
observed during that period. In border states, the share of male ninis almost doubled during the period
2007-2011, a change sufficient to explain a third of the total increase in homicide rates in that region.
17 The dataset excludes those below 16, the legal minimum age in Mexico to be processed by conventional penal courts. The administrative records of alleged criminals provide part of the legal statistics on crime. This information is captured during all three stages of the criminal justice procedures: preliminary investigation, pre-instruction, and sentencing. In particular, data from alleged offenders is captured after the prosecutor has substantiated the accusation on the existence of a crime and the presumed responsibility of the subject. At this time, the offender is brought before a judge, who will determine his legal status by evaluating the elements linking him to the commission of the offense. 18 In any case, if we take into account anecdotic evidence on DTO’s wages, opportunity costs between the legal and the illegal labour market involves significantly higher wages in the criminal spectrum. While an average monthly salary in the maquila sector is around $4,000 pesos, DTO’s starting salaries begin around at 8,800 pesos:
i. A 31 page Payroll found in documents confiscated from Los Caballeros Templarios established that those working in the administrative “area” of the organization earned between $12,000 and $16,000 pesos per month; those in the Communications office earned between $16,000 and $20,000 pesos per month; those in the area of Operations were divided in different groups: Sicarios earned between $12,000 and $16,000, falcons or vigilantes between $8,800 and $15,200 pesos per month, depending on weather they had vehicles or were established in a single place, and if they were following someone in particular or taking care of an area (Aristegui Noticias, Jan 21, 2014, http://goo.gl/z7KOgK, with information from La Razón).
ii. In an interview with Vice Magazine, a women working for Los Zetas (another DTO) explained how she recruited 50 falcons (the lowest position in DTO’s conformed by people in charge of alerting about activities of security forces or other gangs). and gave them $12,000 pesos plus 1,500 in expenses and a 500 credit for mobile phones (Méndez Lozano, Jorge Damián, Vice, August 24, 2015, http://goo.gl/itz4rL).

27
Although not the main focus of this study, an equally important result emerged from the statistical
analysis: the positive association between crime and high school dropout rates. An increase in the high
school dropout rate of one percentage point is associated with an increase of 0.6 homicides per 100,000
inhabitants and seven cars being stolen.
These results are explained by a combination of two factors that coincide in time and space: during the
period 2007-2013, Mexico experienced the negative impact of both the global financial crisis and a
dramatic spike in violence. The economic crisis caused a significant loss of jobs particularly among
young unskilled workers in the manufacture industry in the north of the country. The resulting new
ninis suddenly found themselves without opportunities in the market for legal activities, but with an
increasing demand for relatively well paid criminal activities in drug trafficking organizations. The
shrinking maquila sector and the buoyant market for illegal activities demand the same human capital
in the same geographical location: young and unskilled men in the north of Mexico. The levels of
violence caused by the war on drugs required a constant influx of workers. This was reinforced by a
more confrontational approach by the Mexican government against cartels. From an opportunity cost
perspective, the ninis found few alternatives apart from getting involved in the economic undertakings
offered by drug trafficking organizations. This confluence of factors helped trigger a terrible spiral of
violence in Mexico.
This analysis provides policy makers a compelling argument for the design and implementation of
policies to reduce the number of ninis. Governments should deter the involvement of young unskilled
workers in illegal activities by strengthening social protection policies such as unemployment
insurance and training schemes. This would help keep the young people out of inactivity, particularly
when facing economic contractions and spirals of violence such as the ones Mexico and Central
America have experienced in recent years. Governments should implement policies to keep young
people in school, particularly in high school, even when the market offers them relatively lucrative
jobs, as happened in the maquilas in northern Mexico during the boom brought about by NAFTA. A
policy option is requiring that all youths within mandatory schooling age (pre-primary to grade 12 in
Mexico) be enrolled in school to be employed. This type of regulatory policy to minimize the dropout
rate could work if there is a credible enforcement mechanism. These options might seem drastic and
likely to cause distortions in the market, but once the long-term effects of dropping out of school are
considered, it becomes clear that inaction can be far more costly.

28

29
References
Arceo-Gómez, E.O and R.M. Campos Vázquez (2012). "Who are the Idle Youth in México?" Centro de Investigación y Docencia Económica, El Colegio de México.
Atkin, David (2012). “Endogenous Skill Acquisitions and Export Manufacturing in Mexico.” (Working paper No.18266) Revised and resubmitted, American Economic Review.
Dube, Arindrajit Oeindrila and Omar García-Ponce (2013). “Cross-Border Spillover: U.S. Gun Laws and Violence in Mexico.” American Political Science Review, 107, pp. 397-417. doi:10.1017/S0003055413000178.
Banco de México (2015). Indicadores en Materia de Balanza Comercial de Mercancías de México.
Baron, Juan D., Anna Popova, and Angélica Sánchez-Diaz, (2015). “Time Use Decisions of Mexican Youth.” World Bank.
Bourguignon, F. (1999). “Crime as a Social Cost of Poverty and Inequality: A Review Focusing on Developing Countries.” Desarrollo y Sociedad, No.44.
Bussolo, Mauricio, Rafael de Hoyos, Peter Dixon, Maureen Rimmer, and George Verikios (2015). “Brazil and Mexico Facing the 2008–09 Financial Crisis: Still Fragile or Becoming Stronger?” In Margaret Grosh, Maurizio Bussolo, and Samuel Freije, Editors, Understanding the Poverty Impact of the Global Financial Crisis in Latin America and the Caribbean, World Bank.
Camacho, A. and D. Mejía (2013). “The Externalities of Conditional Cash Transfer Programs on Crime: The Case of Familias en Acción in Bogota.” Universidad de los Andes.
Cárdenas, Mauricio, Rafael de Hoyos, and Miguel Székely (forthcoming). “Idle Youth in Latin America: A Persistent Problem in a Decade of Prosperity.” Journal of LACEA Economia, LACEA.
Castillo, Juan Camilo, Daniel Mejia, and Pascual Restrepo (2014). "Scarcity without Leviathan: The Violent Effects of Cocaine Supply Shortages in the Mexican Drug War." CGD Working Paper 356. Washington, DC: Center for Global Development.
Chabat, Jorge (2010). “Combatting Drugs in Mexico under Calderón: The Inevitable War.” Documento de Trabajo 205. Ciudad de México: Centro de Investigación y Docencia Económicas.
Chioda, Laura (2013). “Crime and Violence Prevention over the Lifecycle in Latin America and the Caribbean.” LCRCE Regional Study,
Chioda, Laura and J.M. De Mello (2012). “Spillovers from Conditional Cash Transfer Programs: Bolsa Familia and Crime in Urban Brazil.” The Institute for the Study of Labor (IZA), No.6371.
Chioda, Laura (2015). “Crime Prevention in LAC: Never Too Early, Never Too Late, Never Too Comprehensive.” The World Bank, Washington, DC.
Chicoine, Luke (2011). “Exporting the Second Amendment: U.S. Assault Weapons and the Homicide Rate in Mexico.” Working paper (JEL Codes: F51, F52, K42).
De Hoyos, Rafael, A. Popova, and H. Rogers (2015). “Out of School and Out of Work: A Diagnostic of Ninis in Latin America.” Background Paper for the LAC Regional Study “Out of School and Out of Work: Challenges & Solutions around Idle Youth (Ninis) in Latin America.” mimeo, The World Bank, Education Unit, Washington DC, USA.
30
Dell, Melissa (2014) “Trafficking Networks and the Mexican Drug War,” Harvard University Working Paper.
Dills, A.K, J.A. Miron, and G. Summers (2010). “What Do Economists Know about Crime?” from “The Economics of Crime: Lessons for and from Latin America” by Di Tella, Edwards, and Schargrodsky, University of Chicago Press, pp 269-302.
Enamorado, T, L.-F.López-Calva, C.Rodríguez-Castelán, and H. Winkler (2014). "Income Inequality and Violent Crime: Evidence from Mexico's Drug War." The World Bank, Poverty Reduction and Economic Management Unit.
Gómez Ayala, V. H. and J. Merino (2012). “’NiNis’ y violencia en México: ¿Nada mejor que hacer o nada mejor que esperar?,” in José Antonio Aguilar (coord.); Las bases sociales del crimen organizado y la violencia en México; Centro de Investigación y Estudios en Seguridad, pp 133-185.
Gould, E.D, B.A. Weinberg, and D.B. Mustard (2002). “Crime Rates and Local Labor Market Opportunities in the United States: 1979-1997.” The Review of Economics and Statistics, Vol.84, No.1, pp 45-61, published by the MIT Press.
Guerrero, Eduardo (2010a). “Pandillas y carteles: La gran Alianza,” Nexos, June, pp. 36-37.
Guerrero, Eduardo (2010b). “Cómo reducir la violencia en México,” Nexos, November.
Guerrero, Eduardo (2011). “Security, Drugs, and Violence in Mexico: A Survey.” 7th North American Forum Washington, DC, 2011.
Guerrero, Eduardo (2012). “An Assessment of Illegal Protection Markets in Mexico,” in Ernesto Zedillo and Haynie Wheeler (editors), “Rethinking the ‘War on Drugs’ Through the US-Mexico Prism,” Yale Center for the Study of Globalization.
Guerrero, Eduardo (2013). “Security Policy and the Crisis of Violence in Mexico.” In Diana Villiers Negroponte (editor), “The End of Nostalgia,” Brookings Institution Press.
Grimaldi, James and Sari Horwitz, (2010), “As Mexico drug violence runs rampant, U.S. guns tied to crime south of border.” The Washington Post, December 15, 2010.
Hanson, Gordon H. (2004). “What has Happened to Wages in Mexico Since NAFTA?” Intoni Estevadeordal, Dani Rodrick, Alan Taylor, Andre Velasco, editors, “FTAA and Beyond: Prospects for Integration in the Americas,” Cambridge: Harvard University Press.
Hiatt, Fred (2011), “What Felipe Calderon wants from the U.S.,” The Washington Post, March 3, 2011.
Hope, Alejandro (2013). “Violencia 2007-2011. La tormenta perfecta,” Nexos, Noviembre, 2013.
INEGI Encuesta Nacional de Empleo (ENE), Microdata all trimesters drop 1995-2004. http://ww.inegi.org.mx/olap/proyectos/bd/consulta.asp.
INEGI Encuesta Nacional de Ocupación y Empleo (ENOE), Microdata all trimesters drop 2005-2012. http://www.inegi.org.mx/sistemas/microdatos/encuestas.aspx.
INEGI Encuesta Nacional de Victimización y Percepción sobre la Seguridad Pública (ENVIPE). Basic Tables 2013 and 2014. http://www.inegi.org.mx/sistemas/tabuladosbasicos/tabgeneral.aspx
Negrete Prieto, Rodrigo and Gerardo Leyva Parra (2013). “Los ninis en México: una aproximación crítica a su medición,” Revista Internacional de Estadística y Geografía.
31
Pew Hispanic Center (2012). “Net Migration from Mexico Falls to Zero—and Perhaps Less.” Pew Research Center, Monday, April 23, 2012.
Ribando, Clare (2010). "Latin America and the Caribbean: Illicit Drug Trafficking and U.S. Counterdrug Programs.” Congressional Research Service Report for Congress, April 30.
Rios, Viridiana (2011). “Why did Mexico Become So Violent? A Self-Reinforcing Violent Equilibrium Caused by Competition and Enforcement.” Trends in Organized Crime, June 2013, Volume 16, Issue 2, pp 138-155.
Robles, Gustavo, Gabriela Calderón, and Beatriz Magaloni (2013). “Las consecuencias económicas de la violencia del narcotráfico en México.” Inter-American Development Bank, Department of Research and Economist, No IDB-WP-426.
Robertson, Raymond (2006). “Labor Market Implications of Globalization in Mexico.” In Alberto Ortega Venzor, José Luis Paz Vega, and Rodrigo Núñez González, eds. Políticas Públicas para el Crecimiento y Desarrollo Memorias 2006 IBERGOP-México.
Secretaria de Educación Pública (SEP). Sistema Nacional de Información Estadística Educativa (Serie histórica de indicadores y pronósticos educativos) from 1995 to 2012. http://www.snie.sep.gob.mx/indicadores_pronosticos.html
Vilalta, C.J. and J.M. Martinez (2011). “The Making of Narco Bosses: Hard Drug Dealing Crimes among Mexican Students,” Trends in Organized Crime, Vol.15, pp. 47-63.

32
Annex Table A1. Panel data estimations for the relationship between ninis and car thefts, including interaction.
Independent Variables Car thefts SNSP (1997-2013)) (1) (2) (3) (4) (5)
Share of ninis
All ninis 0.565 1.782 1.662 1.991 2.325 (2.227) (2.210) (2.207) (2.173) (2.168)
Male ninis -5.821 -5.508 -5.503 -4.436 -5.260 (3.943) (3.879) (3.872) (3.817) (3.819)
Male ninis aged 19 to 24 4.026 -1.107 -1.844 -0.502 -0.739 (2.991) (3.194) (3.217) (3.181) (3.169)
% Male ninis aged 19 to 24, interacted with: Dummy for period 2007-2013 10.86 *** 10.72 *** 9.026 *** 10.7 ***
(2.624) (2.620) (2.609) (2.701) Dummy for border state 6.006 * -5.763 1.653
(3.541) (4.492) (5.550) (Period)*(Border) 8.615 *** -7.216
(2.076) (7.312) Controls Dummy for period 2007-2013 13.20 (18.27) (Period)*(Border) 155.3 ** (68.81) Share of population aged 15 to 24 -2.718 -2.754 -3.097 -1.601 -1.901 (4.607) (4.533) (4.529) (4.469) (4.452) Log of hourly labor income 67.99 ** 95.23 *** 108.4 *** 132 *** 142 *** (30.96) (31.16) (32.06) (32.04) (32.21) Unemployment rate, aged 34 to 44 -141.2 -317.0 -375.3 -305.6 -312.1 (390.4) (386.5) (387.2) (381.3) (379.7) Gini (per capita labor income) -29.16 -53.28 -92.02 -131.3 -131.2 (158.0) (155.6) (157.0) (154.7) (154.0) Share of informal workers 112.8 170.4 157.7 138.9 139.3 (149.9) (148.1) (148.0) (145.6) (145.0) Share of employment in manufacture -81.90 -110.5 -55.90 36.11 96.06 (190.8) (187.8) (190.2) (188.4) (189.5) High school dropout rate 6.053 *** 6.296 *** 6.575 *** 7.059 *** 6.849 *** (2.120) (2.087) (2.089) (2.058) (2.052) Constant -84.39 -122.4 -132.6 -217.2 -248.4 (153.3) (158.3) (158.1) (156.9) (156.8) Notes: Standard errors in parentheses, *** p<0.01, ** p<0.05, * p<0.1; all estimations include state level fixed effects and yearly dummies. Informal workers are defined as those who work for a firm that does not have accounting records and does not contribute to social security.