iea analysis for transport iea data and modelling for … analysis for sustainable transport iea...
TRANSCRIPT

IEA analysis for sustainable transport IEA Data and modelling for
Transport
Pierpaolo Cazzola
International Energy Agency
UN DESAConsultation with Experts on Methodologies for
Assessing Transport System Efficiency and Benefits for Development
New York,15 June 2009
IEA analysis for sustainable transport
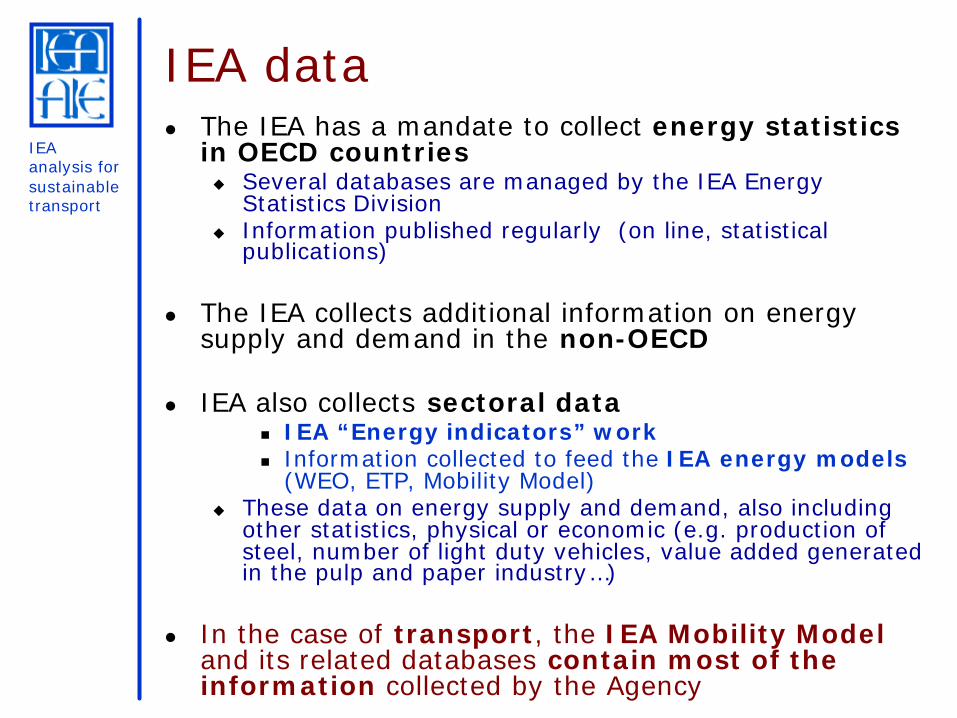
IEA datal The IEA has a mandate to collect energy statistics
in OECD countriesu Several databases are managed by the IEA Energy
Statistics Divisionu Information published regularly (on line, statistical
publications)
l The IEA collects additional information on energy supply and demand in the non-OECD
l IEA also collects sectoral datan IEA “Energy indicators” workn Information collected to feed the IEA energy models
(WEO, ETP, Mobility Model)u These data on energy supply and demand, also including
other statistics, physical or economic (e.g. production of steel, number of light duty vehicles, value added generated in the pulp and paper industry…)
l In the case of transport, the IEA Mobility Modeland its related databases contain most of the information collected by the Agency
IEA analysis for sustainable transport
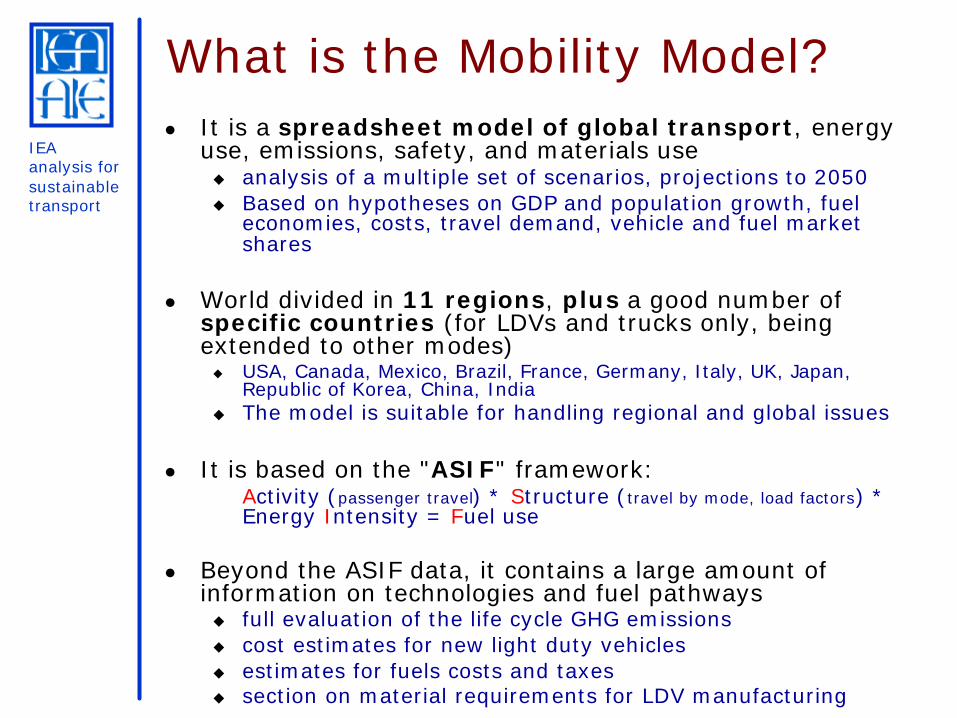
What is the Mobility Model?l It is a spreadsheet model of global transport, energy
use, emissions, safety, and materials useu analysis of a multiple set of scenarios, projections to 2050u Based on hypotheses on GDP and population growth, fuel
economies, costs, travel demand, vehicle and fuel market shares
l World divided in 11 regions, plus a good number of specific countries (for LDVs and trucks only, being extended to other modes)u USA, Canada, Mexico, Brazil, France, Germany, Italy, UK, Japan,
Republic of Korea, China, Indiau The model is suitable for handling regional and global issues
l It is based on the "ASIF" framework:Activity (passenger travel) * Structure (travel by mode, load factors) * Energy Intensity = Fuel use
l Beyond the ASIF data, it contains a large amount of information on technologies and fuel pathwaysu full evaluation of the life cycle GHG emissionsu cost estimates for new light duty vehiclesu estimates for fuels costs and taxesu section on material requirements for LDV manufacturing
IEA analysis for sustainable transport
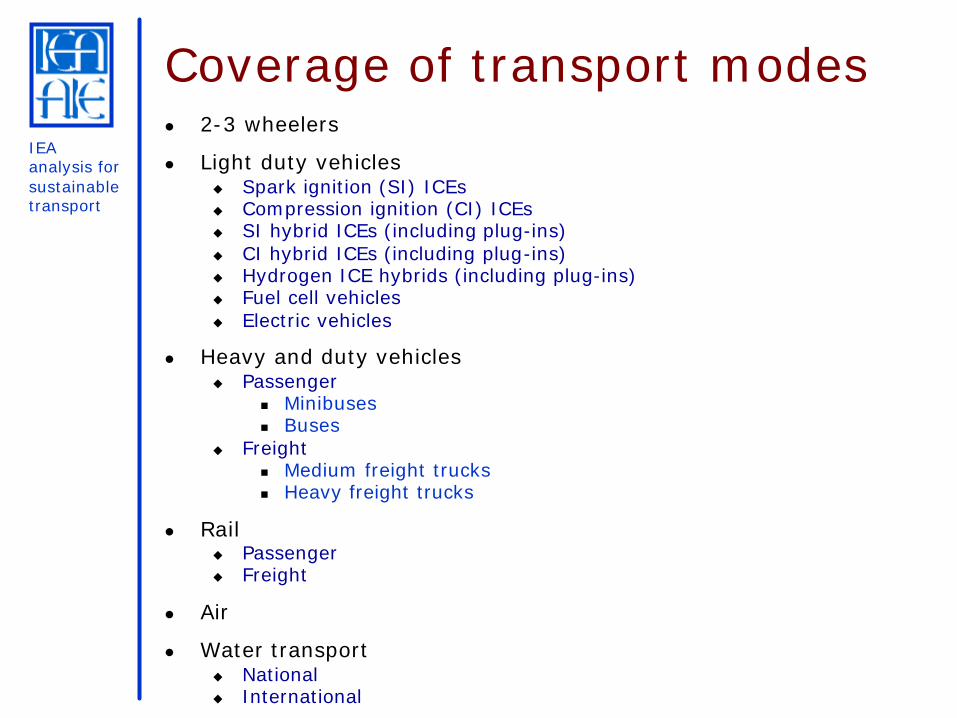
Coverage of transport modesl 2-3 wheelers
l Light duty vehicles u Spark ignition (SI) ICEsu Compression ignition (CI) ICEsu SI hybrid ICEs (including plug-ins)u CI hybrid ICEs (including plug-ins)u Hydrogen ICE hybrids (including plug-ins)u Fuel cell vehiclesu Electric vehicles
l Heavy and duty vehiclesu Passenger
n Minibusesn Buses
u Freightn Medium freight trucksn Heavy freight trucks
l Railu Passengeru Freight
l Air
l Water transportu Nationalu International

IEA analysis for sustainable transport
Coverage of fuel pathwaysl Liquid petroleum fuels
u Gasolineu Diesel (high- and low-sulphur)
l Biofuelsu Ethanol
n Grain, sugar cane, advanced technologies (lignocellulose)
u Biodieseln Conventional (fatty acid methyl esters, FAME or
biodiesel obtained from hydrogenation of vegetable oil in refineries), advanced processes (BTL, fast pyrolysis, hydrothermal upgrade)
l Synthetic fuelsn GTL and CTL
l CNG/LPGn CNG, LPG, biogas
l Hydrogenn from natural gas, with and without CO2 sequestrationn from electricity, point of use electrolysis, with and
without CO2 sequestration n from biomass gasificationn advanced low GHG hydrogen production
IEA analysis for sustainable transport
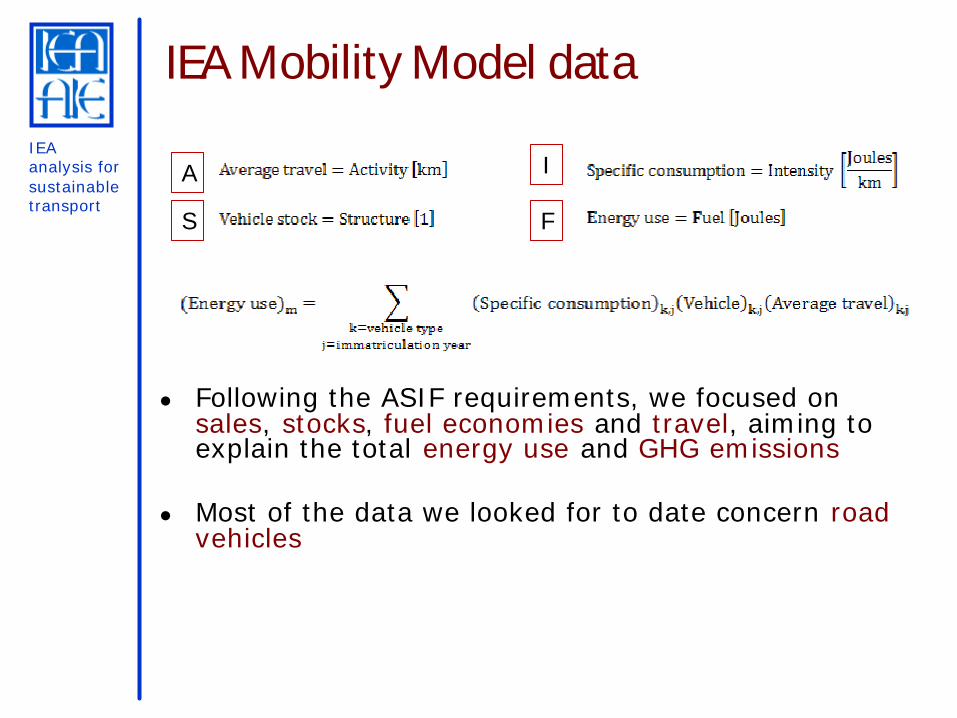
IEA Mobility Model data
l Following the ASIF requirements, we focused on sales, stocks, fuel economies and travel, aiming to explain the total energy use and GHG emissions
l Most of the data we looked for to date concern road vehicles
F
A
S
I
IEA analysis for sustainable transport
IEA: secondary data collectorl We put together information already collected
by others (primary or secondary data providers)u General economic and population data (OECD, World
Bank, other sources)u IEA data (energy use), collected through questionnaires
sent to national administrations (energy supply and demand, energy prices)
u More detailed data, found in publications, studies, statistical databases (some examples in next slide)
l We do not carry out surveys ourselvesl We do our best to try to assure consistency
u We collect information from more than one source, we assess it comparatively, we perform internal consistency checks (e.g. between vehicle stock and registrations, or stock, load factors and total activity) and we select our best estimate on this basis, also bridging across missing information with estimates
l Our final check is the need to be able to explain the total fuel consumption in a given country/region
IEA analysis for sustainable transport
Detailed transport data: examples of some of the sources we use:
u National and regional Statistical Offices (e.g. Bureau of Transportation Statistics in US, Eurostat in Europe, Australian Bureau of Statistics, Instituto Nacional de Estadísticas in Chile…)
u National Agencies (e.g. Ministry of Land transport New Zealand; ADEME in France, EPA in US…)
u Industrial institutions (e.g. ACEA in Europe; JAMA in Japan; ANFAVEA in Brazil; AMIA in Mexico; FCAI in Australia; ADEFA in Argentina…)
u Published studies from international institutions (e.g. UN ECLAC, National communications to the UNFCC, Inter American Development Bank, Asian Development bank, ECMT (now ITF), International Road Federation…)
u Universities, research institutes (e.g. Institute of Transportation Studies, University of California, Davis; the Scientific and Research Institute of Motor Transport for Russia; TsinghuaUniversity, Lawrence Berkeley National Laboratory for China…)
u Central banks (e.g. Banco Central de Chile)u Studies published by consultants (e.g. Ernst and Young for
Russia and Eastern Europe)u Information released by Companies (e.g. Scania and Volvo in
several regions, Bosch for Eastern Europe and India, SeverstalAuto for Russia…)
u GlobalInsight, Polk (aggregated in our databases)
IEA Mobility Model, data sources

IEA analysis for sustainable transport
Lessons from our experience (1)l Sales
The best providers are Industrial Associations, OEMs, component providers, consultants
Data more readily available for LDVs, but all road modes are relatively well coveredMore information exist for the OECD, but it is reasonable amount of data available in non-OECD countries
l StockWe assess comparatively the cumulative sales across 15-20 years and the data available from National and Regional Statistical Offices, National Agencies
The quality of the information varies. In many cases deregistrations are poorly reported (significant discrepancies between the sum of 15-20 years of sales and the stock). In countries where the import of second hand vehicle is allowed, a proper assessment is more difficult (poor data in used imports: no information on their age, likely lifetime…)
IEA analysis for sustainable transport
Lessons from our experience (2)l Fuel economies
LDVS: the best data providers (new LDVs) are Industrial Associations and some National Agenciesu Stock FE: data need to be processed on the basis of the
FE of new registrations (sales, used imports), and scrappage ages (limited information)
u Adjustments required to reflect on-road fuel economies and to bridge the test-issue (different tests in different regions)
u Very poor data for non-OECD countriesOther vehicles: poor (if not inexistent) informationu Some in research publications (e.g. focused on logistics), but
very scatteredWe estimate specific consumption of trucks and buses on the basis of other data (weights, load, technology)
l Vehicle travelLimited data, generally provided by National and Regional Statistical Offices and National Agencies(notably in the OECD)
Some information can be extrapolated from case studies (specific cities/regions)Quality rather poor, notably for heavier vehicles
IEA analysis for sustainable transport
What would we need, ideally (1)?
We would want to fill the ASIF equation, also going beyond it
lVehicle perspective:u Vehicle sales, stocks, used importsu Travel and load factors per vehicle by mode and by
travel categoryu Information on vehicle travel differentiated by mileage
over the vehicle lifetime (especially for LDVs)u Fuel economies and pollutant emissions per km for the
same vehicles – linked to existing regulationu Full characterisation of the vehicle stocks by vehicle
type, including scrappage curves (need to account correctly for de-registered vehicles) – scrappage age, at least – for new and imported used vehicles (by mode);
u Vehicle ownership by vehicle class (for LDVs) and demographic
u Fuel costs, including details on the share of taxes/subsidies
u Vehicle cost and share of tax in it (by mode, and possibly by vehicle class for LDVs), would help
IEA analysis for sustainable transport
What would we need, ideally (2)?l Travel perspective
u Distribution of load factors (passenger and freight) in all travel categories, for all modes (% of X, Y, Z passengers or tonnes on a given vehicle, including empty running for freight)
u Characterisation of passenger travel by distance classes and travel purpose (work, leisure…)
u Intermodality: characterisation of trips by mode (single mode vs. multiple mode)
u Information on the availability of travel optionsfor different types of trips (especially urban?)n Extension of public transport (urban and non-
urban; road, rail), combined with quality-related parameters (speed, frequency, stops) and usage (also across time); cost/km
n Frequency of intercity connections by distance and mode, average time required, cost/km by mode
u Identification of congestion levels (e.g. by illustrating travel with indicators like the share of travel at different average speed on a given mode)
IEA analysis for sustainable transport
What would we need, ideally (3)?l Infrastructure perspective
u Extension of the infrastructure (km of roads, railways, bus lanes, bike lanes, walkways) by capacity classes (e.g. km of motorways and roads by number of lanes, conventional railway lines and high speed)
u Utilization rates of infrastructure by capacity class (road, rail, airports)
u Share of roads subject to pricing in different travel areas (urban, non-urban)n Average cost/km
u Availability of parking areas (urban)u Share of parking for which it is necessary to pay
(urban), average cost of parkingu Average cost of construction the infrastructure
by type n Intercity: roads and railways, differentiating by
capacity class – e.g. amongst conventional roads, highways, conventional railways, high speed railway lines)
n Urban: bus systems, BRTs, light rail and metro
IEA analysis for sustainable transport
Standardisation
l Working on international data, we feel the need for a “standardisation” of vehicle classes across modesu Motorbikes and scooters, passenger and freight three
wheelers, passenger cars, passenger light trucks, freight light trucks (light commercial vehicles), multi-purpose light trucks, at least two classes of heavy trucks, at least two classes of buses (by size), at least two (maybe three) aircraft classes
l “Standardisation” needs go beyond the vehicle level…u Urban, sub-urban, intercity bus services and rail
services (different definitions for different sizes of urban areas?). High speed, high capacity for rail.
l “Standardised” data lead to comparable statistics, but require additional effortsu Need to build on work already done (e.g. ITF
glossary), enriching itu International organisations can play a key role in this
respect

IEA analysis for sustainable transport
What can we get?
l Better sales, stock, scrappage, travel data for LDVsu We can build on what exists (especially for sales),
combining it with complementary information taken from traffic observation surveys, especially for stock-related data (can collect vehicle location, type, name plate, age, odometer readings, driver-stated fuel efficiency) or travel diary approach
l Representative case studies for detailed travel informationu Traffic observation survey (odometer reading,
crossed with vehicle age), in combination with national household travel survey (annual travel by purpose/mode covering all types of travel; explanatory data on location, income, car ownership, travel choices available)
l Relatively aggregated information on infrastructureu Length of road network, length of rail network
l More coherent data across different global regions
IEA analysis for sustainable transport
How to approach this?l Come up with a plan that is affordable and can be
carried out by countries in a reasonable time frame, with reasonable intermittencyu Need to identify ways to fund projects that get integrated in
existing work programsl Common methodology that countries can use around
the worldu International organisations best suited for this, but there is
a need to leverage on what exists and to work with primary data providers
u Need for an initial proposalu Need for workshops, meetings to share experiences and
discuss methodology, gaining consensusu Need for credibility (do the “homework”), especially for the
project leaderl Consistency in timing and publication of data and
analysisl International coordination and systematic, long-term
funding support
Something to discuss!