ieej outlook 2018eneken.ieej.or.jp/en/press/annex_20171006.pdf · annex ieej outlook 2018 annex-3...
TRANSCRIPT

IEEJ Outlook 2018 Annex-1
Annex
IEEJ:October 2017 © IEEJ2017

IEEJ:October 2017 © IEEJ2017

Annex
IEEJ Outlook 2018 Annex-3
Table A1 | Regional groupings Asia People’s Republic of China
Hong Kong
India
Japan
Korea
Chinese Taipei
ASEAN Brunei Darussalam
Cambodia
Indonesia
Lao P.D.R.
Malaysia
Myanmar
Philippines
Singapore
Thailand
Viet Nam
Others Bangladesh, D. P. R. Korea, Mongolia, Nepal, Pakistan, Sri Lanka, and Other Asia excluding Lao P.D.R. in IEA statistics
North America United States
Canada
Latin America Brazil
Chile
Mexico
Others Argentina, Bolivia, Colombia, Costa Rica, Cuba, Curaçao, Dominican Republic, Ecuador, El Salvador, Guatemala, Haiti, Honduras, Jamaica, Nicaragua, Panama, Paraguay, Peru, Trinidad and Tobago, Uruguay, Venezuela, and Other Non–OECD Americas in IEA statistics
Europe OECD Europe France
Germany
Italy
United Kingdom
IEEJ:October 2017 © IEEJ2017
Annex
IEEJ Outlook 2018 Annex-4
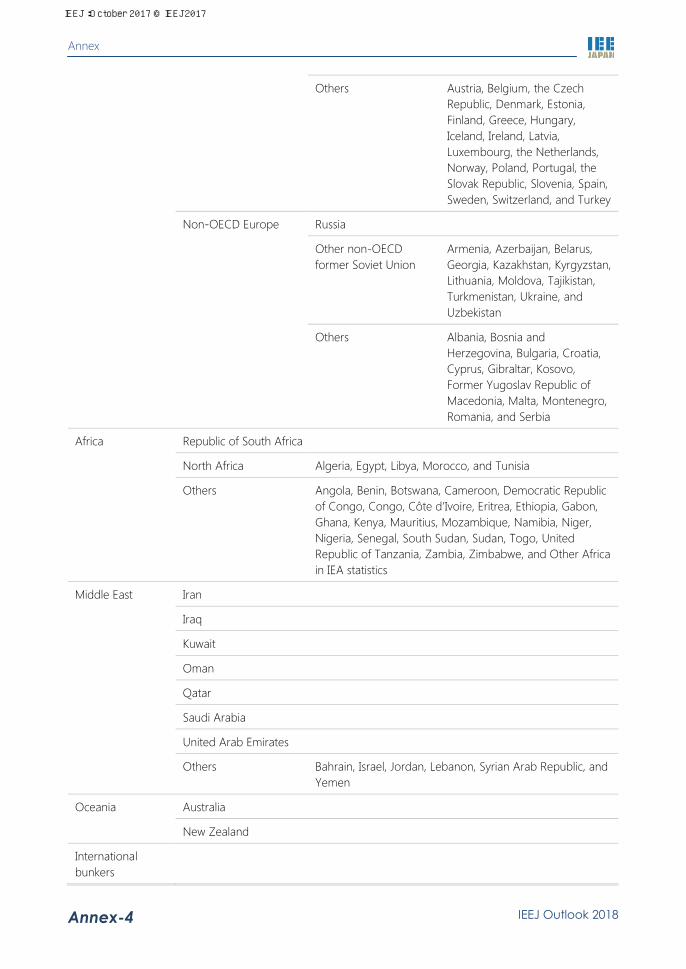
Others Austria, Belgium, the Czech Republic, Denmark, Estonia, Finland, Greece, Hungary, Iceland, Ireland, Latvia, Luxembourg, the Netherlands, Norway, Poland, Portugal, the Slovak Republic, Slovenia, Spain, Sweden, Switzerland, and Turkey
Non-OECD Europe Russia
Other non-OECD former Soviet Union
Armenia, Azerbaijan, Belarus, Georgia, Kazakhstan, Kyrgyzstan, Lithuania, Moldova, Tajikistan, Turkmenistan, Ukraine, and Uzbekistan
Others Albania, Bosnia and Herzegovina, Bulgaria, Croatia, Cyprus, Gibraltar, Kosovo, Former Yugoslav Republic of Macedonia, Malta, Montenegro, Romania, and Serbia
Africa Republic of South Africa
North Africa Algeria, Egypt, Libya, Morocco, and Tunisia
Others Angola, Benin, Botswana, Cameroon, Democratic Republic of Congo, Congo, Côte d’Ivoire, Eritrea, Ethiopia, Gabon, Ghana, Kenya, Mauritius, Mozambique, Namibia, Niger, Nigeria, Senegal, South Sudan, Sudan, Togo, United Republic of Tanzania, Zambia, Zimbabwe, and Other Africa in IEA statistics
Middle East Iran
Iraq
Kuwait
Oman
Qatar
Saudi Arabia
United Arab Emirates
Others Bahrain, Israel, Jordan, Lebanon, Syrian Arab Republic, and Yemen
Oceania Australia
New Zealand
International bunkers
IEEJ:October 2017 © IEEJ2017

Annex
IEEJ Outlook 2018 Annex-5
European Union Austria, Belgium, Bulgaria, Croatia, Cyprus, the Czech Republic, Denmark, Estonia, Finland, France, Germany, Greece, Hungary, Ireland, Italy, Latvia, Lithuania, Luxembourg, Malta, the Netherlands, Poland, Portugal, Romania, the Slovak Republic, Slovenia, Spain, Sweden, and the United Kingdom
OECD Australia, Austria, Belgium, Canada, Chile, the Czech Republic, Denmark, Estonia, Finland, France, Germany, Greece, Hungary, Iceland, Ireland, Italy, Japan, Korea, Luxembourg, Mexico, the Netherlands, New Zealand, Norway, Poland, Portugal, the Slovak Republic, Slovenia, Spain, Sweden, Switzerland, Turkey, United Kingdom, and United States
Notes: (1) Other non-OECD former Soviet Union includes energy data of Estonia and Latvia before 1990, and (2) OECD does not include Israel.
IEEJ:October 2017 © IEEJ2017
Annex
IEEJ Outlook 2018 Annex-6
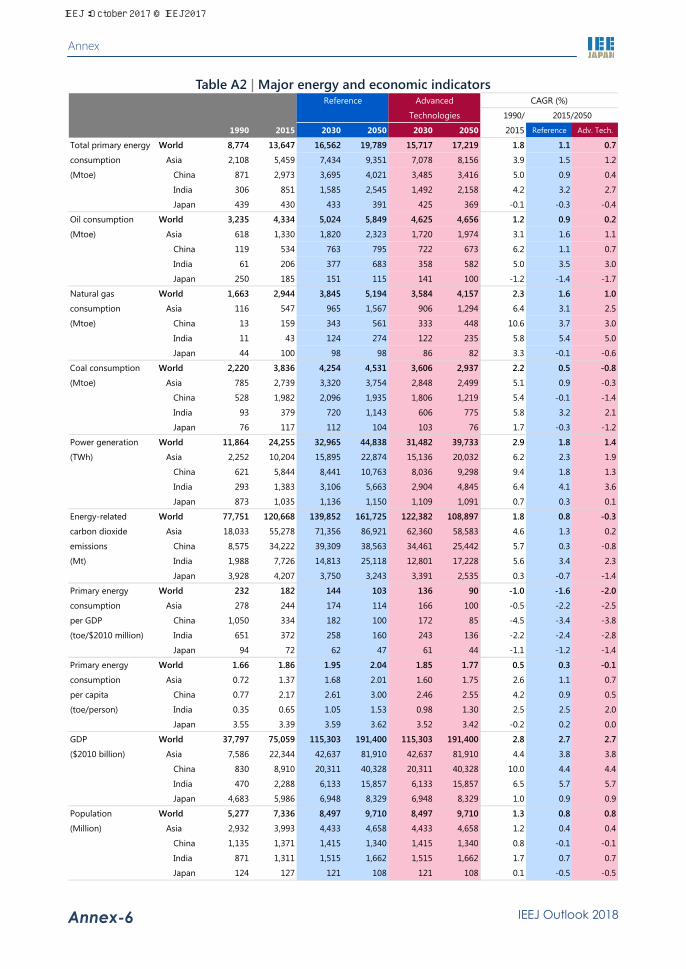
Table A2 | Major energy and economic indicators Reference Advanced CAGR (%)
Technologies 1990/ 2015/2050
1990 2015 2030 2050 2030 2050 2015 Reference Adv. Tech.
Total primary energy World 8,774 13,647 16,562 19,789 15,717 17,219 1.8 1.1 0.7
consumption Asia 2,108 5,459 7,434 9,351 7,078 8,156 3.9 1.5 1.2
(Mtoe) China 871 2,973 3,695 4,021 3,485 3,416 5.0 0.9 0.4
India 306 851 1,585 2,545 1,492 2,158 4.2 3.2 2.7
Japan 439 430 433 391 425 369 -0.1 -0.3 -0.4
Oil consumption World 3,235 4,334 5,024 5,849 4,625 4,656 1.2 0.9 0.2
(Mtoe) Asia 618 1,330 1,820 2,323 1,720 1,974 3.1 1.6 1.1
China 119 534 763 795 722 673 6.2 1.1 0.7
India 61 206 377 683 358 582 5.0 3.5 3.0
Japan 250 185 151 115 141 100 -1.2 -1.4 -1.7
Natural gas World 1,663 2,944 3,845 5,194 3,584 4,157 2.3 1.6 1.0
consumption Asia 116 547 965 1,567 906 1,294 6.4 3.1 2.5
(Mtoe) China 13 159 343 561 333 448 10.6 3.7 3.0
India 11 43 124 274 122 235 5.8 5.4 5.0
Japan 44 100 98 98 86 82 3.3 -0.1 -0.6
Coal consumption World 2,220 3,836 4,254 4,531 3,606 2,937 2.2 0.5 -0.8
(Mtoe) Asia 785 2,739 3,320 3,754 2,848 2,499 5.1 0.9 -0.3
China 528 1,982 2,096 1,935 1,806 1,219 5.4 -0.1 -1.4
India 93 379 720 1,143 606 775 5.8 3.2 2.1
Japan 76 117 112 104 103 76 1.7 -0.3 -1.2
Power generation World 11,864 24,255 32,965 44,838 31,482 39,733 2.9 1.8 1.4
(TWh) Asia 2,252 10,204 15,895 22,874 15,136 20,032 6.2 2.3 1.9
China 621 5,844 8,441 10,763 8,036 9,298 9.4 1.8 1.3
India 293 1,383 3,106 5,663 2,904 4,845 6.4 4.1 3.6
Japan 873 1,035 1,136 1,150 1,109 1,091 0.7 0.3 0.1
Energy-related World 77,751 120,668 139,852 161,725 122,382 108,897 1.8 0.8 -0.3
carbon dioxide Asia 18,033 55,278 71,356 86,921 62,360 58,583 4.6 1.3 0.2
emissions China 8,575 34,222 39,309 38,563 34,461 25,442 5.7 0.3 -0.8
(Mt) India 1,988 7,726 14,813 25,118 12,801 17,228 5.6 3.4 2.3
Japan 3,928 4,207 3,750 3,243 3,391 2,535 0.3 -0.7 -1.4
Primary energy World 232 182 144 103 136 90 -1.0 -1.6 -2.0
consumption Asia 278 244 174 114 166 100 -0.5 -2.2 -2.5
per GDP China 1,050 334 182 100 172 85 -4.5 -3.4 -3.8
(toe/$2010 million) India 651 372 258 160 243 136 -2.2 -2.4 -2.8
Japan 94 72 62 47 61 44 -1.1 -1.2 -1.4
Primary energy World 1.66 1.86 1.95 2.04 1.85 1.77 0.5 0.3 -0.1
consumption Asia 0.72 1.37 1.68 2.01 1.60 1.75 2.6 1.1 0.7
per capita China 0.77 2.17 2.61 3.00 2.46 2.55 4.2 0.9 0.5
(toe/person) India 0.35 0.65 1.05 1.53 0.98 1.30 2.5 2.5 2.0
Japan 3.55 3.39 3.59 3.62 3.52 3.42 -0.2 0.2 0.0
GDP World 37,797 75,059 115,303 191,400 115,303 191,400 2.8 2.7 2.7
($2010 billion) Asia 7,586 22,344 42,637 81,910 42,637 81,910 4.4 3.8 3.8
China 830 8,910 20,311 40,328 20,311 40,328 10.0 4.4 4.4
India 470 2,288 6,133 15,857 6,133 15,857 6.5 5.7 5.7
Japan 4,683 5,986 6,948 8,329 6,948 8,329 1.0 0.9 0.9
Population World 5,277 7,336 8,497 9,710 8,497 9,710 1.3 0.8 0.8
(Million) Asia 2,932 3,993 4,433 4,658 4,433 4,658 1.2 0.4 0.4
China 1,135 1,371 1,415 1,340 1,415 1,340 0.8 -0.1 -0.1
India 871 1,311 1,515 1,662 1,515 1,662 1.7 0.7 0.7
Japan 124 127 121 108 121 108 0.1 -0.5 -0.5
IEEJ:October 2017 © IEEJ2017

Annex
IEEJ Outlook 2018 Annex-7
Table A3 | Population (Million)
1990/ 2015/ 2030/ 2040/ 2015/1990 2000 2015 2030 2040 2050 2015 2030 2040 2050 20505,277 6,108 7,336 8,497 9,152 9,710
(100) (100) (100) (100) (100) (100)2,932 3,407 3,993 4,433 4,595 4,658(55.6) (55.8) (54.4) (52.2) (50.2) (48.0)
1,135 1,263 1,371 1,415 1,391 1,340(21.5) (20.7) (18.7) (16.6) (15.2) (13.8)871 1,053 1,311 1,515 1,608 1,662
(16.5) (17.2) (17.9) (17.8) (17.6) (17.1)124 127 127 121 114 108(2.3) (2.1) (1.7) (1.4) (1.2) (1.1)43 47 51 53 52 50
(0.8) (0.8) (0.7) (0.6) (0.6) (0.5)20 22 23 24 24 23
(0.4) (0.4) (0.3) (0.3) (0.3) (0.2)430 505 608 696 736 761(8.1) (8.3) (8.3) (8.2) (8.0) (7.8)181 212 258 295 312 322(3.4) (3.5) (3.5) (3.5) (3.4) (3.3)18 23 30 36 39 41
(0.3) (0.4) (0.4) (0.4) (0.4) (0.4)42 48 54 61 63 64
(0.8) (0.8) (0.7) (0.7) (0.7) (0.7)62 78 101 124 138 150
(1.2) (1.3) (1.4) (1.5) (1.5) (1.5)3 4 6 6 7 7
(0.1) (0.1) (0.1) (0.1) (0.1) (0.1)57 63 68 69 68 65
(1.1) (1.0) (0.9) (0.8) (0.7) (0.7)66 78 92 104 109 112
(1.3) (1.3) (1.3) (1.2) (1.2) (1.2)2,809 3,281 3,866 4,313 4,481 4,551(53.2) (53.7) (52.7) (50.8) (49.0) (46.9)277 313 357 397 419 436(5.3) (5.1) (4.9) (4.7) (4.6) (4.5)250 282 321 356 376 391(4.7) (4.6) (4.4) (4.2) (4.1) (4.0)442 522 629 715 754 777(8.4) (8.5) (8.6) (8.4) (8.2) (8.0)502 524 566 586 591 589(9.5) (8.6) (7.7) (6.9) (6.5) (6.1)478 488 510 524 526 523(9.1) (8.0) (6.9) (6.2) (5.7) (5.4)341 339 341 344 341 337(6.5) (5.5) (4.7) (4.1) (3.7) (3.5)631 813 1,185 1,691 2,085 2,509
(12.0) (13.3) (16.2) (19.9) (22.8) (25.8)132 168 235 297 332 364(2.5) (2.7) (3.2) (3.5) (3.6) (3.7)20 23 28 33 36 39
(0.4) (0.4) (0.4) (0.4) (0.4) (0.4)1,065 1,151 1,275 1,358 1,392 1,409(20.2) (18.8) (17.4) (16.0) (15.2) (14.5)
4,213 4,957 6,062 7,139 7,760 8,301(79.8) (81.2) (82.6) (84.0) (84.8) (85.5)
Source: United Nations "Population Estimates and Projections: The 2017 Revision", World Bank "World Development Indicators" Note: Figures in parentheses are global shares (%).
Japan
China
India
Asia excl. Japan
World
0.1
0.71.5 1.1
Asia
North America
United States
Latin America
OECD Europe
Non-OECD Europe
European Union
0.4
0.31.4
Middle East
Oceania
OECD
Non-OECD
Africa 2.2
0.0 0.1 -0.1
0.00.1
0.0
2.6
-0.1 0.10.3
0.2 0.1
0.2 0.0
Singapore
0.9 0.5
Viet Nam
1.3 0.7
1.0 0.7
1.3
Thailand
0.7 0.51.0
0.6
0.5
0.0
-0.1
0.81.0
2.0 1.4 1.1 0.8
0.9
0.7 0.1 -0.2
0.10.4
0.50.30.92.4
0.7
-0.5
0.9
0.9 0.6
Philippines
ASEAN
0.6
2.1 1.2 0.7
0.6 0.3
0.9
0.3
0.5
Indonesia
Malaysia
1.4
1.4
0.6
Myanmar
Korea
Chinese Taipei
-0.4
0.4
0.6
-0.5
-0.4
-0.5
-0.1
0.6 0.2 -0.1
0.7 0.3
0.1 -0.3
0.2 -0.2
-0.6
1.7 1.0
CAGR (%)
1.2 0.7 0.1
0.3
0.4
0.8 -0.1
0.2
1.1
0.5 0.3
0.0
-0.4
0.5
-0.1
0.6
0.6
0.4
0.40.5
0.2
0.6
0.5
0.8
-0.1
1.92.4
1.3 1.1
0.81.3 1.0 0.7 0.6
0.9
0.3
2.1
0.8 0.90.7
2.3 1.6 1.1 1.30.9
0.7 0.4
IEEJ:October 2017 © IEEJ2017

Annex
IEEJ Outlook 2018 Annex-8
Table A4 | GDP ($2010 billion)
1990/ 2015/ 2030/ 2040/ 2015/1990 2000 2015 2030 2040 2050 2015 2030 2040 2050 2050
37,797 49,825 75,059 115,303 152,089 191,400(100) (100) (100) (100) (100) (100)
7,586 11,047 22,344 42,637 61,674 81,910(20.1) (22.2) (29.8) (37.0) (40.6) (42.8)830 2,237 8,910 20,311 30,759 40,328(2.2) (4.5) (11.9) (17.6) (20.2) (21.1)470 809 2,288 6,133 10,236 15,857(1.2) (1.6) (3.0) (5.3) (6.7) (8.3)
4,683 5,349 5,986 6,948 7,705 8,329(12.4) (10.7) (8.0) (6.0) (5.1) (4.4)377 710 1,267 1,877 2,284 2,633(1.0) (1.4) (1.7) (1.6) (1.5) (1.4)162 309 527 715 851 975(0.4) (0.6) (0.7) (0.6) (0.6) (0.5)741 1,180 2,490 4,955 7,383 10,390(2.0) (2.4) (3.3) (4.3) (4.9) (5.4)310 453 988 2,124 3,329 4,819(0.8) (0.9) (1.3) (1.8) (2.2) (2.5)82 163 330 629 895 1,205
(0.2) (0.3) (0.4) (0.5) (0.6) (0.6)7 13 59 153 252 384
(0.0) (0.0) (0.1) (0.1) (0.2) (0.2)95 125 266 609 901 1,286
(0.3) (0.3) (0.4) (0.5) (0.6) (0.7)68 134 287 407 487 547
(0.2) (0.3) (0.4) (0.4) (0.3) (0.3)142 218 392 642 884 1,157(0.4) (0.4) (0.5) (0.6) (0.6) (0.6)29 61 155 367 607 957
(0.1) (0.1) (0.2) (0.3) (0.4) (0.5)2,903 5,698 16,358 35,689 53,969 73,581
(7.7) (11.4) (21.8) (31.0) (35.5) (38.4)10,078 14,056 18,394 25,027 30,559 36,274
(26.7) (28.2) (24.5) (21.7) (20.1) (19.0)9,064 12,713 16,597 22,629 27,677 32,902(24.0) (25.5) (22.1) (19.6) (18.2) (17.2)
2,779 3,767 5,779 8,545 11,704 14,903(7.4) (7.6) (7.7) (7.4) (7.7) (7.8)
12,666 15,889 19,517 24,815 28,286 31,565(33.5) (31.9) (26.0) (21.5) (18.6) (16.5)
11,888 14,768 17,885 22,762 26,005 29,079(31.5) (29.6) (23.8) (19.7) (17.1) (15.2)
2,142 1,496 2,658 3,862 5,106 6,671(5.7) (3.0) (3.5) (3.3) (3.4) (3.5)876 1,145 2,261 4,224 6,841 10,197(2.3) (2.3) (3.0) (3.7) (4.5) (5.3)949 1,430 2,582 4,001 5,302 6,834(2.5) (2.9) (3.4) (3.5) (3.5) (3.6)721 995 1,524 2,192 2,619 3,045(1.9) (2.0) (2.0) (1.9) (1.7) (1.6)
29,226 38,029 48,159 63,177 74,658 85,986(77.3) (76.3) (64.2) (54.8) (49.1) (44.9)
8,572 11,796 26,900 52,126 77,431 105,413(22.7) (23.7) (35.8) (45.2) (50.9) (55.1)
Source: World Bank "World Development Indicators", etc. (historical)
Note: Figures in parentheses are global shares (%).
Non-OECD
Asia excl. Japan
World
North America
United States
Latin America
OECD Europe
Non-OECD Europe
European Union
Africa
Viet Nam
Oceania
OECD
Singapore
1.41.6 1.6 1.3 1.1
4.7
3.1
2.7
5.3
2.0
4.4
1.7
1.4
2.7
1.1
2.4
2.4 2.1 2.0 1.7 2.0
3.1
5.2
4.2
2.0
3.0 2.6 3.2
1.7 1.6 1.3
3.2
1.82.4
7.2
1.7
Middle East
Asia
5.0
5.7
10.0
2.0 1.8
5.3
2.4 2.1
Thailand
Korea
Malaysia
Philippines
Chinese Taipei
4.4
5.7
4.7
4.2 3.3
6.9 5.9
6.0
9.1 6.5
4.7 5.2
4.2
1.0 1.0 1.0
China
Indonesia
India
Japan
ASEAN
Myanmar
2.1
5.0 2.7
4.8
5.3
1.8
2.1
4.2
1.8
CAGR (%)
2.9
2.7
5.7
4.4
4.4 4.4 3.8
5.6
6.5 6.8 4.5
0.9
4.2
3.8
1.4
1.4
2.0
1.2 1.9
5.1
3.84.6
3.6
3.5
3.0
4.1
5.54.3
4.0 4.63.6
3.8
4.6
0.9 2.5 2.8 2.7
3.9 4.3 4.9
2.7
4.1
4.0
1.7
4.7 4.5
1.4
3.1
2.72.8 2.9 2.8 2.3
4.0
2.0
4.1 3.0 2.9 2.8
3.0 2.5 1.8
2.6
1.5
0.8
4.4
IEEJ:October 2017 © IEEJ2017
Annex
IEEJ Outlook 2018 Annex-9
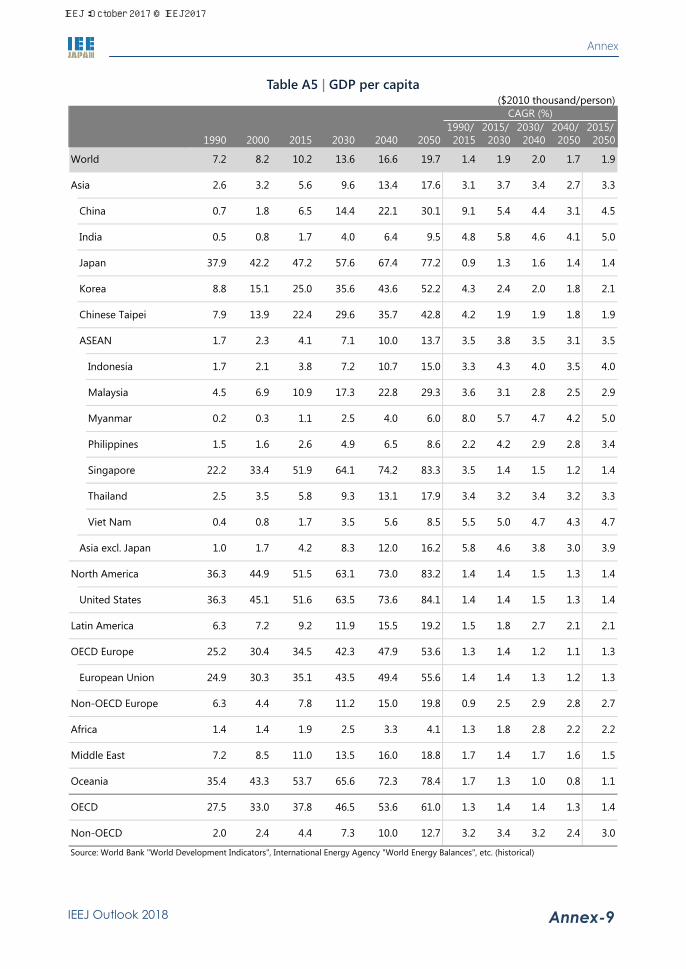
Table A5 | GDP per capita ($2010 thousand/person)
1990/ 2015/ 2030/ 2040/ 2015/1990 2000 2015 2030 2040 2050 2015 2030 2040 2050 2050
Source: World Bank "World Development Indicators", International Energy Agency "World Energy Balances", etc. (historical)
55.6
6.3 7.2 9.2 11.9
63.5 84.1
1.41.4
10.0 13.7 3.5 3.81.7 7.1
73.6
63.151.5
15.0
10.9 17.3 22.8 29.3
10.7
64.1
6.5 8.6
13.1 17.9
1.0
2.3
73.0 83.2
4.0 6.0 8.0 5.7 4.7
44.9
1.7 4.2
83.3
3.5
16.2
0.8 1.7
9.35.8
33.4 51.9
3.5
8.3
2.2 4.2
4.6 3.8
Non-OECD
World
1.4
8.2 10.2 13.6
4.2
27.5 33.0
2.0 2.4 7.3
53.6 61.0
1.4 1.4
2.6
1.1
36.3 45.1 51.6
0.3
1.5
2.5
Oceania
OECD
7.2
North America
United States
Latin America
OECD Europe
Non-OECD Europe
European Union
Africa
Middle East
Asia excl. Japan
2.6
ASEAN
Indonesia
0.4
22.2
Malaysia
Philippines
Singapore
Myanmar
Thailand
Viet Nam
36.3
9.5
9.65.6 13.4 17.6
6.4
14.4 22.16.5
1.7
3.2
0.5
1.8
0.8
Korea
Chinese Taipei
China
India
Japan
8.8 15.1
7.9 13.9
Asia
22.4
4.9
4.0
0.7
25.0 35.6
29.6
37.9 42.2 47.2 57.6
0.2
1.6
2.1
4.1
4.5 6.9
1.7 3.8 7.2
2.5
19.8
12.0
15.5 19.2
47.9 53.6
74.2
4.1
4.5
8.55.6
77.2
35.7
43.6 52.2
42.8
67.4
3.1
4.1
1.4
1.8
1.8
2.5
30.1
1.4 1.9 2.5 3.3
25.2 30.4 34.5 42.3
15.06.3 4.4
24.9 30.3 35.1 43.5 49.4
7.8 11.2
CAGR (%)
3.4
4.4
1.9
4.3 2.4 2.0 2.1
4.2 1.9 1.9
3.1
1.4
4.8 5.8 4.6 5.0
0.9 1.3 1.6
3.32.7
9.1 5.4
3.5 3.1 3.5
3.7
2.9 3.42.8
2.9
3.3 4.3 4.0 4.0
3.6 3.1 2.8
3.5
5.0
1.4
5.0 4.7 4.7
1.3
3.5 1.4 1.5 1.2
3.2
4.3
1.5 1.8 2.7 2.1
3.33.4 3.2 3.4
5.5
3.9
1.5 1.4
5.8
1.3
3.0
1.3 1.4 1.2
1.4
1.8 2.8 2.2
0.9 2.5 2.9
1.4 1.4
1.3 1.2
1.5 1.3
2.1
1.3
1.1
1.1
1.5
2.8
2.2
1.7 1.4 1.7 1.6
0.81.01.7 1.343.335.4 72.3 78.465.6
16.07.2 8.5 11.0 13.5 18.8
53.7
3.0
1.3 1.4 1.4 1.437.8 46.5
1.91.4 1.9 2.0 1.7
10.0 12.74.4 2.4
1.3
3.2 3.4 3.2
16.6 19.7
2.7
1.3
IEEJ:October 2017 © IEEJ2017
Annex
IEEJ Outlook 2018 Annex-10
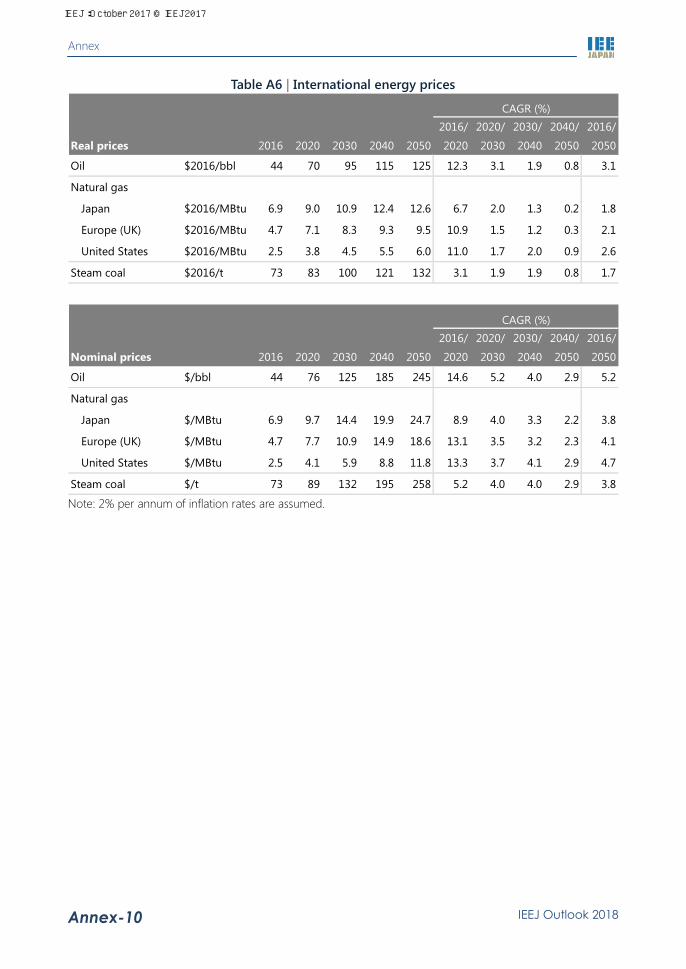
Table A6 | International energy prices
CAGR (%)2016/ 2020/ 2030/ 2040/ 2016/
Real prices 2016 2020 2030 2040 2050 2020 2030 2040 2050 2050
Oil $2016/bbl 44 70 95 115 125 12.3 3.1 1.9 0.8 3.1
Natural gas
Japan $2016/MBtu 6.9 9.0 10.9 12.4 12.6 6.7 2.0 1.3 0.2 1.8
Europe (UK) $2016/MBtu 4.7 7.1 8.3 9.3 9.5 10.9 1.5 1.2 0.3 2.1
United States $2016/MBtu 2.5 3.8 4.5 5.5 6.0 11.0 1.7 2.0 0.9 2.6
Steam coal $2016/t 73 83 100 121 132 3.1 1.9 1.9 0.8 1.7
CAGR (%)2016/ 2020/ 2030/ 2040/ 2016/
Nominal prices 2016 2020 2030 2040 2050 2020 2030 2040 2050 2050
Oil $/bbl 44 76 125 185 245 14.6 5.2 4.0 2.9 5.2
Natural gas
Japan $/MBtu 6.9 9.7 14.4 19.9 24.7 8.9 4.0 3.3 2.2 3.8
Europe (UK) $/MBtu 4.7 7.7 10.9 14.9 18.6 13.1 3.5 3.2 2.3 4.1
United States $/MBtu 2.5 4.1 5.9 8.8 11.8 13.3 3.7 4.1 2.9 4.7
Steam coal $/t 73 89 132 195 258 5.2 4.0 4.0 2.9 3.8 Note: 2% per annum of inflation rates are assumed.
IEEJ:October 2017 © IEEJ2017

Annex
IEEJ Outlook 2018 Annex-11
Table A7 | Primary energy consumption [Reference Scenario] (Mtoe)
1990/ 2015/ 2030/ 2040/ 2015/1990 2000 2015 2030 2040 2050 2015 2030 2040 2050 20508,774 10,028 13,647 16,562 18,374 19,789
(100) (100) (100) (100) (100) (100)2,108 2,887 5,459 7,434 8,548 9,351(24.0) (28.8) (40.0) (44.9) (46.5) (47.3)871 1,130 2,973 3,695 4,005 4,021(9.9) (11.3) (21.8) (22.3) (21.8) (20.3)306 441 851 1,585 2,061 2,545(3.5) (4.4) (6.2) (9.6) (11.2) (12.9)439 518 430 433 414 391(5.0) (5.2) (3.1) (2.6) (2.3) (2.0)93 188 273 292 283 263
(1.1) (1.9) (2.0) (1.8) (1.5) (1.3)48 85 109 110 109 103
(0.5) (0.8) (0.8) (0.7) (0.6) (0.5)233 379 621 982 1,259 1,544(2.7) (3.8) (4.5) (5.9) (6.9) (7.8)99 156 225 394 511 619
(1.1) (1.6) (1.7) (2.4) (2.8) (3.1)22 49 86 120 142 158
(0.2) (0.5) (0.6) (0.7) (0.8) (0.8)11 13 20 35 50 69
(0.1) (0.1) (0.1) (0.2) (0.3) (0.3)29 40 52 97 132 175
(0.3) (0.4) (0.4) (0.6) (0.7) (0.9)12 19 26 30 33 34
(0.1) (0.2) (0.2) (0.2) (0.2) (0.2)42 72 135 174 210 245
(0.5) (0.7) (1.0) (1.1) (1.1) (1.2)18 29 74 128 178 240
(0.2) (0.3) (0.5) (0.8) (1.0) (1.2)1,669 2,369 5,029 7,001 8,134 8,960(19.0) (23.6) (36.8) (42.3) (44.3) (45.3)
2,126 2,527 2,458 2,420 2,382 2,312(24.2) (25.2) (18.0) (14.6) (13.0) (11.7)
1,915 2,273 2,188 2,154 2,116 2,049(21.8) (22.7) (16.0) (13.0) (11.5) (10.4)465 600 851 1,092 1,264 1,378(5.3) (6.0) (6.2) (6.6) (6.9) (7.0)
1,629 1,752 1,706 1,658 1,606 1,561(18.6) (17.5) (12.5) (10.0) (8.7) (7.9)
1,647 1,695 1,586 1,545 1,499 1,458(18.8) (16.9) (11.6) (9.3) (8.2) (7.4)
1,530 1,000 1,106 1,216 1,322 1,451(17.4) (10.0) (8.1) (7.3) (7.2) (7.3)393 496 788 1,086 1,349 1,635(4.5) (4.9) (5.8) (6.6) (7.3) (8.3)223 372 752 993 1,153 1,291(2.5) (3.7) (5.5) (6.0) (6.3) (6.5)99 120 146 153 152 150
(1.1) (1.2) (1.1) (0.9) (0.8) (0.8)4,524 5,281 5,236 5,240 5,162 5,032(51.6) (52.7) (38.4) (31.6) (28.1) (25.4)
4,048 4,472 8,029 10,812 12,613 14,096(46.1) (44.6) (58.8) (65.3) (68.6) (71.2)
Source: International Energy Agency "World Energy Balances" (historical)
Note: Figures in parentheses are global shares (%). World includes international bunkers.
World
North America
United States
Latin America
OECD Europe
Non-OECD Europe
European Union
Africa
Middle East
Asia excl. Japan
Myanmar
Indonesia
Malaysia
Philippines
OECD
Non-OECD
Oceania
Viet Nam
Singapore
5.0 1.9 1.5
-0.1 -0.2
0.6 0.8
Thailand
2.5 3.9
0.6
5.8 3.7 3.3
0.8
0.2
0.5
1.9
4.5 2.2 1.5
-0.1 -0.2
CAGR (%)
Japan
4.2
3.4 3.8
5.6 2.3
4.8 1.7
3.2 1.2
ASEAN
Korea
Chinese Taipei
4.3
4.0 3.1
2.4
1.8
2.9
3.5
0.8
China 0.9
3.9 2.1 0.9
0.0
India
1.4 1.5
5.0 1.5 0.8
3.22.14.2 2.7
Asia
4.4 0.5 -0.3 -0.1
3.3 0.1 -0.2
-0.4-0.1 0.0
2.1
-0.2
3.0
1.7
3.0
-0.6 -0.3
-0.3
2.5
3.4
-0.2
1.71.0
-0.3
3.3
1.9
1.1
3.6
0.4
2.9
1.6
3.6
2.7
1.7
0.8
1.92.8 2.2 2.2
2.6
-0.7
-0.5
-0.3
2.5 1.7 1.5 1.4
0.9
-0.2 -0.3
0.9
-0.3
-0.1 -0.2 -0.3 -0.3 -0.2
-0.1
1.11.8 1.3 1.0 0.7
-0.3
1.6
0.6 0.0 -0.1
1.6
1.6 0.3 -0.1
1.1
-0.1
-0.1
1.12.8 2.0 1.6
0.1
2.1
-1.3
IEEJ:October 2017 © IEEJ2017

Annex
IEEJ Outlook 2018 Annex-12
Table A8 | Primary energy consumption, coal [Reference Scenario] (Mtoe)
1990/ 2015/ 2030/ 2040/ 2015/1990 2000 2015 2030 2040 2050 2015 2030 2040 2050 20502,220 2,311 3,836 4,254 4,486 4,531
(100) (100) (100) (100) (100) (100)785 1,037 2,739 3,320 3,632 3,754
(35.4) (44.9) (71.4) (78.0) (81.0) (82.9)528 665 1,982 2,096 2,109 1,935
(23.8) (28.8) (51.7) (49.3) (47.0) (42.7)93 146 379 720 932 1,143
(4.2) (6.3) (9.9) (16.9) (20.8) (25.2)76 97 117 112 110 104
(3.4) (4.2) (3.1) (2.6) (2.5) (2.3)25 42 81 92 91 82
(1.1) (1.8) (2.1) (2.2) (2.0) (1.8)11 30 40 42 39 33
(0.5) (1.3) (1.0) (1.0) (0.9) (0.7)13 32 114 217 300 398
(0.6) (1.4) (3.0) (5.1) (6.7) (8.8)4 12 41 87 123 161
(0.2) (0.5) (1.1) (2.0) (2.7) (3.6)1 2 18 31 38 47
(0.1) (0.1) (0.5) (0.7) (0.8) (1.0)0 0 0 3 5 9
(0.0) (0.0) (0.0) (0.1) (0.1) (0.2)2 5 13 25 36 49
(0.1) (0.2) (0.3) (0.6) (0.8) (1.1)0 - 0 0 0 0
(0.0) (-) (0.0) (0.0) (0.0) (0.0)4 8 17 24 30 34
(0.2) (0.3) (0.4) (0.6) (0.7) (0.8)2 4 25 47 68 97
(0.1) (0.2) (0.7) (1.1) (1.5) (2.1)708 939 2,622 3,208 3,521 3,650
(31.9) (40.7) (68.3) (75.4) (78.5) (80.6)485 565 393 289 230 168
(21.8) (24.5) (10.2) (6.8) (5.1) (3.7)460 534 374 278 221 162
(20.7) (23.1) (9.8) (6.5) (4.9) (3.6)21 27 47 59 68 72
(1.0) (1.2) (1.2) (1.4) (1.5) (1.6)449 331 285 226 186 154
(20.2) (14.3) (7.4) (5.3) (4.1) (3.4)455 321 263 210 173 144
(20.5) (13.9) (6.9) (4.9) (3.9) (3.2)367 209 211 185 183 183
(16.5) (9.0) (5.5) (4.3) (4.1) (4.0)74 90 107 122 134 150
(3.3) (3.9) (2.8) (2.9) (3.0) (3.3)3 8 10 16 18 19
(0.1) (0.3) (0.3) (0.4) (0.4) (0.4)36 44 44 39 34 31
(1.6) (1.9) (1.2) (0.9) (0.8) (0.7)1,079 1,089 941 786 685 575(48.6) (47.1) (24.5) (18.5) (15.3) (12.7)
1,141 1,222 2,895 3,468 3,801 3,956(51.4) (52.9) (75.5) (81.5) (84.7) (87.3)
Source: International Energy Agency "World Energy Balances" (historical)
Note: Figures in parentheses are global shares (%). World includes international bunkers.
Non-OECD
Asia excl. Japan
World
North America
United States
Latin America
OECD Europe
Non-OECD Europe
European Union
Africa
Viet Nam
Oceania
OECD
Singapore
-1.7-2.2 -1.5 -1.9 -1.8
3.6
0.4
1.3
4.0
-2.4
1.0
-3.1
-1.7
1.2
-1.9
0.6
-0.8 -2.0 -2.3 -3.1 -2.4
2.0
3.9
0.9
-2.3
3.3 1.4 1.6
-1.8 -1.5 -1.9
2.2
0.00.1
5.4
-1.4
Middle East
Asia
9.2
10.8
5.4
-0.5 -1.2
1.4
-0.8 -2.0
Thailand
Korea
Malaysia
Philippines
Chinese Taipei
4.0
4.7
4.4
6.1 2.4
10.2 4.3
12.5
7.9 13.4
10.3 5.1
8.8
1.7 -0.3 -0.1
China
Indonesia
India
Japan
ASEAN
Myanmar
0.4
4.7 0.9
5.1
2.6
-0.5
0.0
3.6
-0.9
CAGR (%)
0.3
-0.9
3.2
-0.1
5.1 1.3 0.9
0.4
5.8 4.4 2.1
-0.3
0.1
0.9
-1.0
-1.5
-0.1
-0.5 -0.1
6.2
2.83.6
1.9
2.9
2.3
3.3
9.05.3
3.4 3.93.2
2.9
4.0
-2.2 -0.9 -0.1 -0.4
1.5 0.8 1.0
0.0
1.1
0.9
-1.4
3.8 1.2
-1.7
0.4
0.52.2 0.7 0.5 0.1
0.9
-1.0
4.9 3.3 1.2 2.0
0.8 -0.9 -1.2
0.8
-1.1
-0.6
1.0
IEEJ:October 2017 © IEEJ2017

Annex
IEEJ Outlook 2018 Annex-13
Table A9 | Primary energy consumption, oil [Reference Scenario] (Mtoe)
1990/ 2015/ 2030/ 2040/ 2015/1990 2000 2015 2030 2040 2050 2015 2030 2040 2050 20503,235 3,660 4,334 5,024 5,471 5,849
(100) (100) (100) (100) (100) (100)618 916 1,330 1,820 2,089 2,323
(19.1) (25.0) (30.7) (36.2) (38.2) (39.7)119 221 534 763 809 795(3.7) (6.0) (12.3) (15.2) (14.8) (13.6)61 112 206 377 521 683
(1.9) (3.1) (4.8) (7.5) (9.5) (11.7)250 255 185 151 133 115(7.7) (7.0) (4.3) (3.0) (2.4) (2.0)50 99 103 105 99 91
(1.5) (2.7) (2.4) (2.1) (1.8) (1.6)26 38 42 42 40 37
(0.8) (1.0) (1.0) (0.8) (0.7) (0.6)89 153 210 305 394 493
(2.7) (4.2) (4.9) (6.1) (7.2) (8.4)33 58 71 107 142 176
(1.0) (1.6) (1.6) (2.1) (2.6) (3.0)11 19 28 34 37 40
(0.4) (0.5) (0.6) (0.7) (0.7) (0.7)1 2 5 15 24 36
(0.0) (0.1) (0.1) (0.3) (0.4) (0.6)11 16 18 34 49 68
(0.3) (0.4) (0.4) (0.7) (0.9) (1.2)11 17 15 18 20 21
(0.4) (0.5) (0.4) (0.4) (0.4) (0.4)18 32 54 64 75 87
(0.6) (0.9) (1.2) (1.3) (1.4) (1.5)3 8 19 32 46 64
(0.1) (0.2) (0.4) (0.6) (0.8) (1.1)368 661 1,145 1,669 1,956 2,208
(11.4) (18.1) (26.4) (33.2) (35.8) (37.7)833 958 888 805 751 695
(25.8) (26.2) (20.5) (16.0) (13.7) (11.9)757 871 794 717 670 622
(23.4) (23.8) (18.3) (14.3) (12.3) (10.6)238 303 377 449 487 491(7.4) (8.3) (8.7) (8.9) (8.9) (8.4)611 653 554 484 433 387
(18.9) (17.8) (12.8) (9.6) (7.9) (6.6)608 625 516 450 401 357
(18.8) (17.1) (11.9) (9.0) (7.3) (6.1)465 201 238 247 271 301
(14.4) (5.5) (5.5) (4.9) (5.0) (5.1)86 97 176 252 340 458
(2.7) (2.7) (4.1) (5.0) (6.2) (7.8)146 217 341 422 485 536(4.5) (5.9) (7.9) (8.4) (8.9) (9.2)35 40 49 48 46 44
(1.1) (1.1) (1.1) (1.0) (0.8) (0.7)1,867 2,105 1,885 1,714 1,588 1,455(57.7) (57.5) (43.5) (34.1) (29.0) (24.9)
1,166 1,281 2,068 2,815 3,315 3,780(36.0) (35.0) (47.7) (56.0) (60.6) (64.6)
Source: International Energy Agency "World Energy Balances" (historical)
Note: Figures in parentheses are global shares (%). World includes international bunkers.
World
North America
United States
Latin America
OECD Europe
Non-OECD Europe
European Union
Africa
Middle East
Asia excl. Japan
Myanmar
Indonesia
Malaysia
Philippines
OECD
Non-OECD
Oceania
Viet Nam
Singapore
3.4 1.4 1.4
-0.7 -0.7
0.3 0.9
Thailand
8.4 7.1
0.3
8.1 3.6 3.5
0.9
-0.4
0.2
1.7
4.6 2.5 1.6
-0.7 -0.7
CAGR (%)
Japan
4.1
3.1 2.8
3.6 1.4
4.5 1.1
1.2 1.1
ASEAN
Korea
Chinese Taipei
4.4
3.5 2.5
2.0
1.1
2.6
3.9
0.9
China 1.1
3.1 2.1 1.1
-0.2
India
1.4 1.6
6.2 2.4 0.6
3.52.75.0 3.3
Asia
2.9 0.1 -0.5 -0.3
2.0 -0.1 -0.4
-1.3-1.2 -1.3
2.3
-0.7
3.4
1.4
3.7
-1.4 -1.4
-0.8
2.6
3.5
-0.7
1.91.2
-0.8
4.2
2.2
0.7
5.6
0.6
3.4
1.4
4.7
2.8
1.0
0.7
3.02.9 2.4 3.1
2.5
-0.9
-0.7
-1.0
1.9 1.2 0.8 0.8
1.1
-0.9 -1.1
0.1
-1.1
-0.7 -0.9 -1.1 -1.2 -1.0
-0.4
0.91.2 1.0 0.9 0.7
-0.9
1.7
0.0 -0.6 -0.8
1.3
1.4 0.0 -0.5
1.0
-0.6
-0.7
1.32.3 2.1 1.6
-0.3
2.8
-2.6
IEEJ:October 2017 © IEEJ2017

Annex
IEEJ Outlook 2018 Annex-14
Table A10 | Primary energy consumption, natural gas [Reference Scenario] (Mtoe)
1990/ 2015/ 2030/ 2040/ 2015/1990 2000 2015 2030 2040 2050 2015 2030 2040 2050 20501,663 2,071 2,944 3,845 4,550 5,194
(100) (100) (100) (100) (100) (100)116 232 547 965 1,285 1,567(7.0) (11.2) (18.6) (25.1) (28.2) (30.2)13 21 159 343 468 561
(0.8) (1.0) (5.4) (8.9) (10.3) (10.8)11 23 43 124 195 274
(0.6) (1.1) (1.5) (3.2) (4.3) (5.3)44 66 100 98 100 98
(2.7) (3.2) (3.4) (2.6) (2.2) (1.9)3 17 39 56 64 68
(0.2) (0.8) (1.3) (1.4) (1.4) (1.3)1 6 15 22 25 27
(0.1) (0.3) (0.5) (0.6) (0.5) (0.5)30 74 140 216 280 344
(1.8) (3.6) (4.8) (5.6) (6.2) (6.6)16 27 38 72 101 131
(1.0) (1.3) (1.3) (1.9) (2.2) (2.5)7 25 38 50 57 61
(0.4) (1.2) (1.3) (1.3) (1.3) (1.2)1 1 3 5 7 10
(0.0) (0.1) (0.1) (0.1) (0.2) (0.2)- 0 3 9 15 24
(-) (0.0) (0.1) (0.2) (0.3) (0.5)- 1 9 11 11 11
(-) (0.1) (0.3) (0.3) (0.2) (0.2)5 17 38 49 59 67
(0.3) (0.8) (1.3) (1.3) (1.3) (1.3)0 1 10 18 27 38
(0.0) (0.1) (0.3) (0.5) (0.6) (0.7)72 167 446 866 1,185 1,469
(4.3) (8.0) (15.2) (22.5) (26.0) (28.3)493 622 733 819 877 905
(29.6) (30.0) (24.9) (21.3) (19.3) (17.4)438 548 646 724 772 794
(26.3) (26.4) (22.0) (18.8) (17.0) (15.3)72 119 207 281 364 437
(4.3) (5.7) (7.0) (7.3) (8.0) (8.4)262 394 389 425 431 426
(15.8) (19.0) (13.2) (11.0) (9.5) (8.2)297 396 358 393 400 397
(17.9) (19.1) (12.1) (10.2) (8.8) (7.6)600 487 526 598 676 751
(36.1) (23.5) (17.9) (15.6) (14.8) (14.5)30 47 108 183 253 359
(1.8) (2.3) (3.7) (4.8) (5.6) (6.9)72 145 397 523 602 677
(4.3) (7.0) (13.5) (13.6) (13.2) (13.0)19 24 36 42 44 45
(1.1) (1.2) (1.2) (1.1) (1.0) (0.9)845 1,164 1,367 1,531 1,628 1,674
(50.8) (56.2) (46.4) (39.8) (35.8) (32.2)818 908 1,577 2,305 2,905 3,493
(49.2) (43.8) (53.6) (59.9) (63.8) (67.2)Source: International Energy Agency "World Energy Balances" (historical)
Note: Figures in parentheses are global shares (%). World includes international bunkers.
Non-OECD
Asia excl. Japan
World
North America
United States
Latin America
OECD Europe
Non-OECD Europe
European Union
Africa
Viet Nam
Oceania
OECD
Singapore
0.30.7 0.6 0.2 -0.1
3.3
2.2
1.3
4.0
0.6
3.5
0.3
0.3
2.2
-0.1
1.8
1.6 0.8 0.7 0.3 0.6
1.6
4.0
3.2
0.7
4.3 2.1 2.6
1.6 0.6 0.1
1.9
0.41.0
7.6
0.6
Middle East
Asia
6.3
7.1
10.6
1.9 0.8
4.5
1.6 0.7
Thailand
Korea
Malaysia
Philippines
Chinese Taipei
1.9
7.6
2.9
8.4 1.7
38.6 4.4
-
5.7 3.0
3.6 4.4
-
3.3 -0.1 0.2
China
Indonesia
India
Japan
ASEAN
Myanmar
2.7
11.3 2.3
9.9
4.6
1.7
1.6
2.6
1.3
CAGR (%)
2.0
1.8
5.4
3.7
6.4 3.9 3.1
5.3
5.8 7.3 3.5
-0.1
3.2
2.9
0.6
0.9
1.4
0.0 0.6
4.4
2.63.4
1.4
2.1
0.6
2.7
3.53.4
5.4 6.24.8
1.4
3.6
-0.5 0.9 1.2 1.0
5.3 3.6 3.3
1.1
3.5
2.3
0.6
2.7 2.6
0.3
1.9
1.62.3 1.8 1.7 1.3
2.3
0.6
7.1 1.9 1.4 1.5
2.7 1.0 0.4
1.2
0.2
-0.2
3.5
IEEJ:October 2017 © IEEJ2017
Annex
IEEJ Outlook 2018 Annex-15
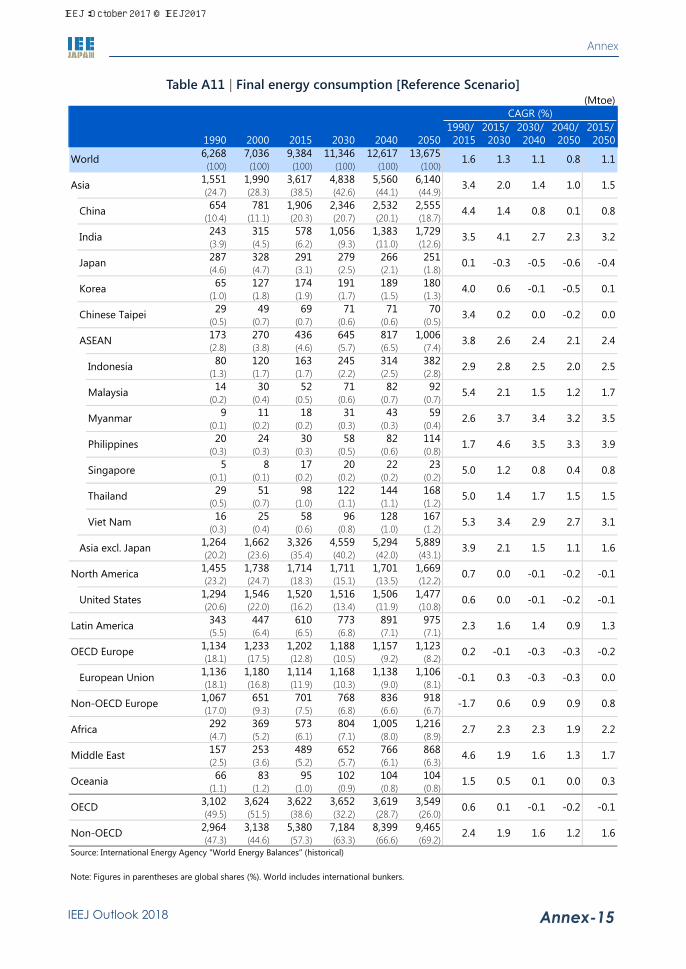
Table A11 | Final energy consumption [Reference Scenario] (Mtoe)
1990/ 2015/ 2030/ 2040/ 2015/1990 2000 2015 2030 2040 2050 2015 2030 2040 2050 20506,268 7,036 9,384 11,346 12,617 13,675
(100) (100) (100) (100) (100) (100)1,551 1,990 3,617 4,838 5,560 6,140(24.7) (28.3) (38.5) (42.6) (44.1) (44.9)654 781 1,906 2,346 2,532 2,555
(10.4) (11.1) (20.3) (20.7) (20.1) (18.7)243 315 578 1,056 1,383 1,729(3.9) (4.5) (6.2) (9.3) (11.0) (12.6)287 328 291 279 266 251(4.6) (4.7) (3.1) (2.5) (2.1) (1.8)65 127 174 191 189 180
(1.0) (1.8) (1.9) (1.7) (1.5) (1.3)29 49 69 71 71 70
(0.5) (0.7) (0.7) (0.6) (0.6) (0.5)173 270 436 645 817 1,006(2.8) (3.8) (4.6) (5.7) (6.5) (7.4)80 120 163 245 314 382
(1.3) (1.7) (1.7) (2.2) (2.5) (2.8)14 30 52 71 82 92
(0.2) (0.4) (0.5) (0.6) (0.7) (0.7)9 11 18 31 43 59
(0.1) (0.2) (0.2) (0.3) (0.3) (0.4)20 24 30 58 82 114
(0.3) (0.3) (0.3) (0.5) (0.6) (0.8)5 8 17 20 22 23
(0.1) (0.1) (0.2) (0.2) (0.2) (0.2)29 51 98 122 144 168
(0.5) (0.7) (1.0) (1.1) (1.1) (1.2)16 25 58 96 128 167
(0.3) (0.4) (0.6) (0.8) (1.0) (1.2)1,264 1,662 3,326 4,559 5,294 5,889(20.2) (23.6) (35.4) (40.2) (42.0) (43.1)
1,455 1,738 1,714 1,711 1,701 1,669(23.2) (24.7) (18.3) (15.1) (13.5) (12.2)
1,294 1,546 1,520 1,516 1,506 1,477(20.6) (22.0) (16.2) (13.4) (11.9) (10.8)343 447 610 773 891 975(5.5) (6.4) (6.5) (6.8) (7.1) (7.1)
1,134 1,233 1,202 1,188 1,157 1,123(18.1) (17.5) (12.8) (10.5) (9.2) (8.2)
1,136 1,180 1,114 1,168 1,138 1,106(18.1) (16.8) (11.9) (10.3) (9.0) (8.1)
1,067 651 701 768 836 918(17.0) (9.3) (7.5) (6.8) (6.6) (6.7)292 369 573 804 1,005 1,216(4.7) (5.2) (6.1) (7.1) (8.0) (8.9)157 253 489 652 766 868(2.5) (3.6) (5.2) (5.7) (6.1) (6.3)66 83 95 102 104 104
(1.1) (1.2) (1.0) (0.9) (0.8) (0.8)3,102 3,624 3,622 3,652 3,619 3,549(49.5) (51.5) (38.6) (32.2) (28.7) (26.0)
2,964 3,138 5,380 7,184 8,399 9,465(47.3) (44.6) (57.3) (63.3) (66.6) (69.2)
Source: International Energy Agency "World Energy Balances" (historical)
Note: Figures in parentheses are global shares (%). World includes international bunkers.
Non-OECD
Asia excl. Japan
World
North America
United States
Latin America
OECD Europe
Non-OECD Europe
European Union
Africa
Viet Nam
Oceania
OECD
Singapore
0.0-0.1 0.3 -0.3 -0.3
2.7
1.1
1.5
3.1
-0.1
1.6
-0.2
-0.2
1.3
-0.3
0.9
0.6 0.0 -0.1 -0.2 -0.1
1.5
2.9
1.5
-0.1
2.3 1.6 1.4
0.2 -0.1 -0.3
1.7
0.81.2
3.9
-0.1
Middle East
Asia
3.8
5.4
4.4
0.6 0.1
2.1
0.7 0.0
Thailand
Korea
Malaysia
Philippines
Chinese Taipei
2.1
4.6
2.6
5.0 1.4
5.3 3.4
5.0
2.6 3.7
2.9 2.8
1.7
0.1 -0.3 -0.5
China
Indonesia
India
Japan
ASEAN
Myanmar
0.2
4.0 0.6
3.4
2.7
0.0
0.1
2.4
0.0
CAGR (%)
1.0
0.1
3.2
0.8
3.4 2.0 1.5
1.4
3.5 4.1 2.3
-0.4
0.8
1.4
-0.5
-0.2
-0.1
0.4 0.8
3.4
2.02.5
1.5
2.1
1.2
2.4
3.53.2
3.5 3.93.3
1.7
2.5
-1.7 0.6 0.9 0.8
2.7 2.3 2.3
0.9
1.9
1.6
-0.1
2.4 1.9
-0.2
1.2
1.11.6 1.3 1.1 0.8
1.6
0.3
4.6 1.9 1.6 1.7
1.5 0.5 0.1
1.3
0.0
-0.6
2.2
IEEJ:October 2017 © IEEJ2017

Annex
IEEJ Outlook 2018 Annex-16
Table A12 | Final energy consumption, industry [Reference Scenario] (Mtoe)
1990/ 2015/ 2030/ 2040/ 2015/1990 2000 2015 2030 2040 2050 2015 2030 2040 2050 20501,809 1,868 2,712 3,146 3,499 3,779
(100) (100) (100) (100) (100) (100)517 646 1,481 1,759 1,956 2,097
(28.6) (34.6) (54.6) (55.9) (55.9) (55.5)234 299 966 965 973 937
(12.9) (16.0) (35.6) (30.7) (27.8) (24.8)67 83 195 376 492 597
(3.7) (4.5) (7.2) (12.0) (14.1) (15.8)110 100 82 81 81 78(6.1) (5.3) (3.0) (2.6) (2.3) (2.1)19 38 49 53 53 50
(1.1) (2.1) (1.8) (1.7) (1.5) (1.3)12 19 23 23 23 23
(0.7) (1.0) (0.8) (0.7) (0.7) (0.6)43 75 125 198 257 318
(2.4) (4.0) (4.6) (6.3) (7.3) (8.4)18 30 42 69 92 115
(1.0) (1.6) (1.5) (2.2) (2.6) (3.0)6 12 15 24 30 36
(0.3) (0.6) (0.6) (0.8) (0.9) (0.9)0 1 2 5 7 10
(0.0) (0.1) (0.1) (0.2) (0.2) (0.3)5 5 7 13 18 24
(0.3) (0.3) (0.3) (0.4) (0.5) (0.6)1 2 6 6 7 7
(0.0) (0.1) (0.2) (0.2) (0.2) (0.2)9 17 31 38 46 53
(0.5) (0.9) (1.1) (1.2) (1.3) (1.4)5 8 23 42 57 73
(0.3) (0.4) (0.8) (1.3) (1.6) (1.9)407 546 1,399 1,678 1,876 2,019
(22.5) (29.2) (51.6) (53.4) (53.6) (53.4)331 388 304 305 305 299
(18.3) (20.7) (11.2) (9.7) (8.7) (7.9)284 332 262 264 265 259
(15.7) (17.8) (9.6) (8.4) (7.6) (6.9)114 148 191 229 274 310(6.3) (7.9) (7.0) (7.3) (7.8) (8.2)328 326 280 279 276 271
(18.2) (17.4) (10.3) (8.9) (7.9) (7.2)347 309 254 279 279 278
(19.2) (16.6) (9.4) (8.9) (8.0) (7.4)394 205 191 214 243 275
(21.8) (11.0) (7.0) (6.8) (6.9) (7.3)55 58 87 126 173 222
(3.0) (3.1) (3.2) (4.0) (5.0) (5.9)47 71 150 203 241 274
(2.6) (3.8) (5.5) (6.4) (6.9) (7.3)23 28 28 30 30 30
(1.3) (1.5) (1.0) (1.0) (0.9) (0.8)840 914 789 806 815 808
(46.5) (48.9) (29.1) (25.6) (23.3) (21.4)968 954 1,923 2,340 2,684 2,970
(53.5) (51.1) (70.9) (74.4) (76.7) (78.6)Source: International Energy Agency "World Energy Balances" (historical)
Note: Figures in parentheses are global shares (%).
Non-OECD
Asia excl. Japan
World
North America
United States
Latin America
OECD Europe
Non-OECD Europe
European Union
Africa
Viet Nam
Oceania
OECD
Singapore
0.3-1.2 0.6 0.0 0.0
2.6
0.7
1.4
3.4
-0.1
1.1
-0.2
-0.1
1.4
-0.2
1.2
-0.3 0.1 0.0 -0.2 0.0
1.6
3.1
1.1
0.0
2.1 1.2 1.8
-0.6 0.0 -0.1
1.7
0.50.8
5.1
0.1
Middle East
Asia
4.4
4.1
5.8
-0.2 0.1
1.2
-0.3 0.0
Thailand
Korea
Malaysia
Philippines
Chinese Taipei
3.1
4.0
3.1
5.2 1.5
6.7 4.1
9.3
7.1 5.8
3.4 3.4
1.9
-1.1 -0.1 0.0
China
Indonesia
India
Japan
ASEAN
Myanmar
0.1
3.8 0.5
2.4
2.7
0.0
0.1
2.7
0.0
CAGR (%)
0.7
-0.4
3.2
-0.1
4.3 1.2 1.0
0.0
4.4 4.5 2.0
-0.1
0.1
1.1
-0.5
-0.1
-0.1
0.1 0.5
4.0
2.33.0
2.3
2.2
1.7
2.6
4.42.8
3.0 3.43.0
2.5
3.0
-2.9 0.8 1.3 1.0
1.9 2.5 3.2
1.3
2.5
1.4
0.1
2.8 1.3
-0.1
1.0
1.01.6 1.0 1.1 0.8
1.3
0.2
4.8 2.0 1.7 1.7
0.9 0.5 0.0
1.3
-0.1
-0.3
2.7
IEEJ:October 2017 © IEEJ2017

Annex
IEEJ Outlook 2018 Annex-17
Table A13 | Final energy consumption, transport [Reference Scenario] (Mtoe)
1990/ 2015/ 2030/ 2040/ 2015/1990 2000 2015 2030 2040 2050 2015 2030 2040 2050 20501,573 1,961 2,703 3,230 3,528 3,765
(100) (100) (100) (100) (100) (100)186 320 648 989 1,149 1,274
(11.9) (16.3) (24.0) (30.6) (32.6) (33.8)33 87 299 504 541 537
(2.1) (4.5) (11.0) (15.6) (15.3) (14.3)21 32 86 163 236 304
(1.3) (1.6) (3.2) (5.0) (6.7) (8.1)68 84 71 57 52 47
(4.3) (4.3) (2.6) (1.8) (1.5) (1.2)15 26 33 36 34 30
(0.9) (1.3) (1.2) (1.1) (0.9) (0.8)7 12 12 12 11 9
(0.4) (0.6) (0.5) (0.4) (0.3) (0.2)32 61 117 170 215 270
(2.1) (3.1) (4.3) (5.3) (6.1) (7.2)11 21 44 68 88 110
(0.7) (1.1) (1.6) (2.1) (2.5) (2.9)5 11 21 24 25 25
(0.3) (0.6) (0.8) (0.7) (0.7) (0.7)0 1 4 10 16 25
(0.0) (0.1) (0.1) (0.3) (0.5) (0.7)5 8 11 24 35 50
(0.3) (0.4) (0.4) (0.7) (1.0) (1.3)1 2 2 2 2 2
(0.1) (0.1) (0.1) (0.1) (0.1) (0.1)9 15 24 26 28 30
(0.6) (0.7) (0.9) (0.8) (0.8) (0.8)1 3 11 15 20 27
(0.1) (0.2) (0.4) (0.5) (0.6) (0.7)118 236 576 931 1,097 1,227(7.5) (12.0) (21.3) (28.8) (31.1) (32.6)531 640 690 640 609 584
(33.7) (32.7) (25.5) (19.8) (17.3) (15.5)488 588 629 578 550 528
(31.0) (30.0) (23.3) (17.9) (15.6) (14.0)103 140 222 284 316 332(6.5) (7.2) (8.2) (8.8) (9.0) (8.8)267 317 335 293 264 241
(17.0) (16.2) (12.4) (9.1) (7.5) (6.4)259 303 312 273 245 223
(16.5) (15.5) (11.6) (8.4) (6.9) (5.9)171 110 143 147 153 162
(10.9) (5.6) (5.3) (4.6) (4.3) (4.3)38 54 105 149 196 247
(2.4) (2.8) (3.9) (4.6) (5.6) (6.5)51 75 141 180 206 229
(3.2) (3.8) (5.2) (5.6) (5.8) (6.1)24 30 37 37 37 36
(1.5) (1.5) (1.4) (1.2) (1.0) (1.0)936 1,139 1,227 1,131 1,067 1,012
(59.5) (58.1) (45.4) (35.0) (30.2) (26.9)435 547 1,095 1,588 1,862 2,092
(27.7) (27.9) (40.5) (49.2) (52.8) (55.6)Source: International Energy Agency "World Energy Balances" (historical)
Note: Figures in parentheses are global shares (%). World includes international bunkers.
Non-OECD
Asia excl. Japan
World
North America
United States
Latin America
OECD Europe
Non-OECD Europe
European Union
Africa
Viet Nam
Oceania
OECD
Singapore
-1.00.8 -0.9 -1.1 -0.9
3.2
1.1
0.6
2.7
-0.5
2.2
-0.4
-0.9
1.2
-0.9
0.5
1.0 -0.6 -0.5 -0.4 -0.5
0.7
2.6
1.7
-0.5
3.1 1.7 1.1
0.9 -0.9 -1.0
0.8
-0.6-0.1
6.5
-0.6
Middle East
Asia
5.2
6.0
9.2
1.1 -0.5
3.3
1.1 -0.5
Thailand
Korea
Malaysia
Philippines
Chinese Taipei
0.8
5.5
2.5
3.9 0.6
8.5 2.4
2.3
8.6 7.2
5.8 2.9
3.5
0.2 -1.4 -1.0
China
Indonesia
India
Japan
ASEAN
Myanmar
-0.4
3.4 0.4
2.6
3.8
-0.8
-0.3
2.4
-0.9
CAGR (%)
1.0
-0.1
3.7
1.7
5.1 2.9 2.0
3.6
5.8 4.3 2.6
-1.2
0.7
1.5
-1.0
-1.4
-0.6
-1.0 -0.5
4.9
2.22.6
0.4
2.3
0.2
2.4
5.84.6
4.0 4.53.6
0.5
2.6
-0.7 0.2 0.4 0.3
4.2 2.4 2.8
0.5
2.3
1.6
-0.5
3.8 2.5
-0.5
1.2
1.02.2 1.2 0.9 0.7
1.9
-0.1
4.2 1.6 1.4 1.4
1.8 0.0 -0.2
1.0
-0.2
-1.0
2.5
IEEJ:October 2017 © IEEJ2017

Annex
IEEJ Outlook 2018 Annex-18
Table A14 | Final energy consumption, buildings, etc. [Reference Scenario] (Mtoe)
1990/ 2015/ 2030/ 2040/ 2015/1990 2000 2015 2030 2040 2050 2015 2030 2040 2050 20502,409 2,591 3,132 3,911 4,367 4,779
(100) (100) (100) (100) (100) (100)733 836 1,124 1,593 1,872 2,126
(30.4) (32.3) (35.9) (40.7) (42.9) (44.5)344 335 483 661 767 814
(14.3) (12.9) (15.4) (16.9) (17.6) (17.0)142 173 250 420 525 671(5.9) (6.7) (8.0) (10.7) (12.0) (14.0)76 103 99 103 97 90
(3.1) (4.0) (3.2) (2.6) (2.2) (1.9)24 37 44 50 50 48
(1.0) (1.4) (1.4) (1.3) (1.1) (1.0)7 10 12 14 14 14
(0.3) (0.4) (0.4) (0.4) (0.3) (0.3)87 113 147 211 262 317
(3.6) (4.4) (4.7) (5.4) (6.0) (6.6)44 59 70 97 119 140
(1.8) (2.3) (2.2) (2.5) (2.7) (2.9)3 5 9 14 17 20
(0.1) (0.2) (0.3) (0.4) (0.4) (0.4)8 9 12 15 19 23
(0.4) (0.4) (0.4) (0.4) (0.4) (0.5)10 10 11 19 25 34
(0.4) (0.4) (0.3) (0.5) (0.6) (0.7)1 2 3 3 3 3
(0.0) (0.1) (0.1) (0.1) (0.1) (0.1)11 14 21 29 35 41
(0.4) (0.5) (0.7) (0.7) (0.8) (0.9)10 14 21 33 43 55
(0.4) (0.5) (0.7) (0.8) (1.0) (1.2)657 734 1,025 1,491 1,775 2,036
(27.3) (28.3) (32.7) (38.1) (40.7) (42.6)460 537 574 607 621 623
(19.1) (20.7) (18.3) (15.5) (14.2) (13.0)403 473 506 537 549 551
(16.7) (18.2) (16.2) (13.7) (12.6) (11.5)101 120 160 212 246 272(4.2) (4.6) (5.1) (5.4) (5.6) (5.7)438 475 485 509 508 501
(18.2) (18.3) (15.5) (13.0) (11.6) (10.5)430 454 450 515 511 501
(17.9) (17.5) (14.4) (13.2) (11.7) (10.5)436 287 274 291 298 307
(18.1) (11.1) (8.7) (7.4) (6.8) (6.4)188 242 362 499 595 695(7.8) (9.3) (11.6) (12.8) (13.6) (14.5)40 75 129 170 197 222
(1.7) (2.9) (4.1) (4.4) (4.5) (4.6)15 19 24 29 31 33
(0.6) (0.7) (0.8) (0.7) (0.7) (0.7)1,036 1,201 1,260 1,344 1,359 1,353(43.0) (46.4) (40.2) (34.4) (31.1) (28.3)
1,373 1,390 1,872 2,567 3,008 3,425(57.0) (53.6) (59.8) (65.6) (68.9) (71.7)
Source: International Energy Agency "World Energy Balances" (historical)
Note: Figures in parentheses are global shares (%).
World
North America
United States
Latin America
OECD Europe
Non-OECD Europe
European Union
Africa
Middle East
Asia excl. Japan
Myanmar
Indonesia
Malaysia
Philippines
OECD
Non-OECD
Oceania
Viet Nam
Singapore
4.8 1.9 1.4
0.4 0.2
0.4 0.2
Thailand
1.3 1.7
0.9
3.0 3.0 2.7
0.6
0.4
0.9
2.0
1.8 2.5 1.8
0.4 0.2
CAGR (%)
Japan
3.5
1.9 2.2
5.2 2.8
2.7 2.1
3.2 1.3
ASEAN
Korea
Chinese Taipei
4.0
2.1 2.5
0.1
2.1
2.0
3.4
0.8
China 1.5
1.7 2.4 1.3
0.6
India
1.6 1.8
1.4 2.1 1.5
2.92.52.3 2.3
Asia
2.4 0.8 0.0 0.2
2.5 1.0 0.3
-0.61.1 0.3
1.9
0.2
2.6
1.9
3.0
-0.7 -0.3
0.0
2.2
2.8
0.2
2.01.4
0.0
2.0
1.6
1.4
1.9
0.1
3.0
1.6
2.0
2.0
1.9
0.3
1.62.7 2.2 1.8
2.2
-0.3
0.0
0.1
1.9 1.9 1.5 1.5
0.3
0.3 0.0
1.0
-0.1
0.2 0.9 -0.1 -0.2 0.3
0.5
1.21.1 1.5 1.1 0.9
0.0
1.7
0.8 0.4 0.1
1.6
2.0 1.2 0.7
1.2
0.5
0.2
1.31.2 2.1 1.6
0.9
1.9
-1.8
IEEJ:October 2017 © IEEJ2017
Annex
IEEJ Outlook 2018 Annex-19
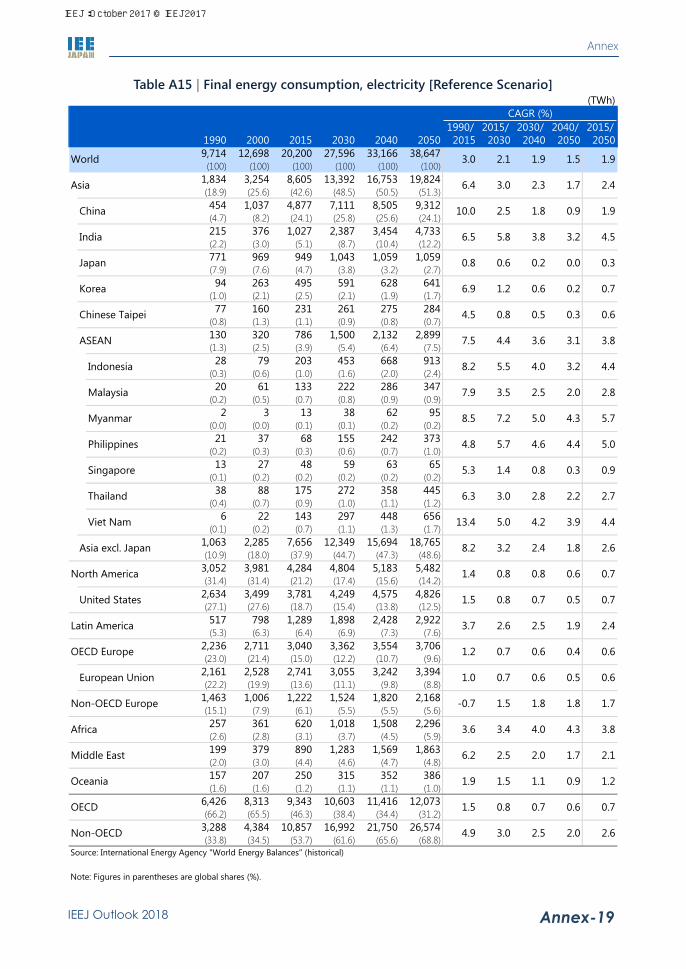
Table A15 | Final energy consumption, electricity [Reference Scenario] (TWh)
1990/ 2015/ 2030/ 2040/ 2015/1990 2000 2015 2030 2040 2050 2015 2030 2040 2050 20509,714 12,698 20,200 27,596 33,166 38,647
(100) (100) (100) (100) (100) (100)1,834 3,254 8,605 13,392 16,753 19,824(18.9) (25.6) (42.6) (48.5) (50.5) (51.3)454 1,037 4,877 7,111 8,505 9,312(4.7) (8.2) (24.1) (25.8) (25.6) (24.1)215 376 1,027 2,387 3,454 4,733(2.2) (3.0) (5.1) (8.7) (10.4) (12.2)771 969 949 1,043 1,059 1,059(7.9) (7.6) (4.7) (3.8) (3.2) (2.7)94 263 495 591 628 641
(1.0) (2.1) (2.5) (2.1) (1.9) (1.7)77 160 231 261 275 284
(0.8) (1.3) (1.1) (0.9) (0.8) (0.7)130 320 786 1,500 2,132 2,899(1.3) (2.5) (3.9) (5.4) (6.4) (7.5)28 79 203 453 668 913
(0.3) (0.6) (1.0) (1.6) (2.0) (2.4)20 61 133 222 286 347
(0.2) (0.5) (0.7) (0.8) (0.9) (0.9)2 3 13 38 62 95
(0.0) (0.0) (0.1) (0.1) (0.2) (0.2)21 37 68 155 242 373
(0.2) (0.3) (0.3) (0.6) (0.7) (1.0)13 27 48 59 63 65
(0.1) (0.2) (0.2) (0.2) (0.2) (0.2)38 88 175 272 358 445
(0.4) (0.7) (0.9) (1.0) (1.1) (1.2)6 22 143 297 448 656
(0.1) (0.2) (0.7) (1.1) (1.3) (1.7)1,063 2,285 7,656 12,349 15,694 18,765(10.9) (18.0) (37.9) (44.7) (47.3) (48.6)
3,052 3,981 4,284 4,804 5,183 5,482(31.4) (31.4) (21.2) (17.4) (15.6) (14.2)
2,634 3,499 3,781 4,249 4,575 4,826(27.1) (27.6) (18.7) (15.4) (13.8) (12.5)517 798 1,289 1,898 2,428 2,922(5.3) (6.3) (6.4) (6.9) (7.3) (7.6)
2,236 2,711 3,040 3,362 3,554 3,706(23.0) (21.4) (15.0) (12.2) (10.7) (9.6)
2,161 2,528 2,741 3,055 3,242 3,394(22.2) (19.9) (13.6) (11.1) (9.8) (8.8)
1,463 1,006 1,222 1,524 1,820 2,168(15.1) (7.9) (6.1) (5.5) (5.5) (5.6)257 361 620 1,018 1,508 2,296(2.6) (2.8) (3.1) (3.7) (4.5) (5.9)199 379 890 1,283 1,569 1,863(2.0) (3.0) (4.4) (4.6) (4.7) (4.8)157 207 250 315 352 386(1.6) (1.6) (1.2) (1.1) (1.1) (1.0)
6,426 8,313 9,343 10,603 11,416 12,073(66.2) (65.5) (46.3) (38.4) (34.4) (31.2)
3,288 4,384 10,857 16,992 21,750 26,574(33.8) (34.5) (53.7) (61.6) (65.6) (68.8)
Source: International Energy Agency "World Energy Balances" (historical)
Note: Figures in parentheses are global shares (%).
Non-OECD
Asia excl. Japan
World
North America
United States
Latin America
OECD Europe
Non-OECD Europe
European Union
Africa
Viet Nam
Oceania
OECD
Singapore
0.61.0 0.7 0.6 0.5
3.9
1.8
2.2
4.4
0.7
2.6
0.6
0.6
2.4
0.4
1.9
1.5 0.8 0.7 0.5 0.7
2.7
4.2
2.4
0.8
3.7 2.6 2.5
1.2 0.7 0.6
2.8
0.81.4
8.2
0.7
Middle East
Asia
7.5
7.9
10.0
1.5 0.8
3.2
1.4 0.8
Thailand
Korea
Malaysia
Philippines
Chinese Taipei
3.5
5.7
4.4
6.3 3.0
13.4 5.0
5.3
8.5 7.2
8.2 5.5
4.8
0.8 0.6 0.2
China
Indonesia
India
Japan
ASEAN
Myanmar
0.8
6.9 1.2
4.5
3.8
0.6
0.7
3.8
0.5
CAGR (%)
1.7
0.9
4.5
1.9
6.4 3.0 2.4
2.5
6.5 5.8 3.2
0.3
1.8
2.3
0.2
0.3
0.6
0.3 0.9
5.0
3.24.0
2.5
3.1
2.0
3.6
5.74.3
4.6 5.04.4
2.8
4.4
-0.7 1.5 1.8 1.7
3.6 3.4 4.0
1.8
4.3
2.5
0.7
4.9 3.0
0.6
2.0
1.93.0 2.1 1.9 1.5
2.6
1.2
6.2 2.5 2.0 2.1
1.9 1.5 1.1
1.7
0.9
0.0
3.8
IEEJ:October 2017 © IEEJ2017

Annex
IEEJ Outlook 2018 Annex-20
Table A16 | Electricity generation [Reference Scenario] (TWh)
1990/ 2015/ 2030/ 2040/ 2015/1990 2000 2015 2030 2040 2050 2015 2030 2040 2050 2050
11,864 15,471 24,255 32,965 39,101 44,838(100) (100) (100) (100) (100) (100)
2,252 4,013 10,204 15,895 19,641 22,874(19.0) (25.9) (42.1) (48.2) (50.2) (51.0)621 1,356 5,844 8,441 9,970 10,763(5.2) (8.8) (24.1) (25.6) (25.5) (24.0)293 570 1,383 3,106 4,311 5,663(2.5) (3.7) (5.7) (9.4) (11.0) (12.6)873 1,088 1,035 1,136 1,152 1,150(7.4) (7.0) (4.3) (3.4) (2.9) (2.6)105 289 549 655 694 707(0.9) (1.9) (2.3) (2.0) (1.8) (1.6)88 181 255 288 303 312
(0.7) (1.2) (1.1) (0.9) (0.8) (0.7)154 370 868 1,670 2,374 3,220(1.3) (2.4) (3.6) (5.1) (6.1) (7.2)33 93 234 520 762 1,035
(0.3) (0.6) (1.0) (1.6) (1.9) (2.3)23 69 150 250 321 388
(0.2) (0.4) (0.6) (0.8) (0.8) (0.9)2 5 16 66 103 149
(0.0) (0.0) (0.1) (0.2) (0.3) (0.3)26 45 82 186 287 434
(0.2) (0.3) (0.3) (0.6) (0.7) (1.0)16 32 50 62 67 69
(0.1) (0.2) (0.2) (0.2) (0.2) (0.2)44 96 178 260 341 422
(0.4) (0.6) (0.7) (0.8) (0.9) (0.9)9 27 153 320 487 716
(0.1) (0.2) (0.6) (1.0) (1.2) (1.6)1,380 2,925 9,169 14,760 18,490 21,724(11.6) (18.9) (37.8) (44.8) (47.3) (48.5)
3,685 4,631 4,968 5,538 5,929 6,218(31.1) (29.9) (20.5) (16.8) (15.2) (13.9)
3,203 4,026 4,297 4,829 5,169 5,414(27.0) (26.0) (17.7) (14.6) (13.2) (12.1)623 1,009 1,598 2,314 2,906 3,426(5.3) (6.5) (6.6) (7.0) (7.4) (7.6)
2,668 3,227 3,559 3,913 4,099 4,231(22.5) (20.9) (14.7) (11.9) (10.5) (9.4)
2,577 3,006 3,204 3,571 3,774 3,935(21.7) (19.4) (13.2) (10.8) (9.7) (8.8)
1,888 1,428 1,738 2,083 2,383 2,713(15.9) (9.2) (7.2) (6.3) (6.1) (6.1)316 442 781 1,266 1,832 2,717(2.7) (2.9) (3.2) (3.8) (4.7) (6.1)244 472 1,111 1,585 1,902 2,215(2.1) (3.1) (4.6) (4.8) (4.9) (4.9)187 249 296 370 409 444(1.6) (1.6) (1.2) (1.1) (1.0) (1.0)
7,652 9,730 10,794 12,189 13,031 13,670(64.5) (62.9) (44.5) (37.0) (33.3) (30.5)
4,212 5,741 13,461 20,776 26,070 31,168(35.5) (37.1) (55.5) (63.0) (66.7) (69.5)
Source: International Energy Agency "World Energy Balances" (historical)
Note: Figures in parentheses are global shares (%).
1.3
4.0
-0.3
0.7
Oceania
Thailand
Viet Nam
Singapore
Asia excl. Japan
4.2
4.8 1.4 0.8
3.9
0.3
5.7
2.3
0.6 0.3
3.8 1.7
0.71.2 0.8
2.6 2.8
4.4
12.2 5.0
2.4
0.7
1.2
3.6
1.3
2.0
0.9 0.6
4.8 2.9
0.5
1.8
1.4 0.8 0.7
2.3
3.7 3.3
1.5 1.0
0.4
1.5
0.8
6.2
0.51.2
4.6
2.5
4.3
1.2 0.7 0.7
7.9 3.2 2.3
4.9
0.5
3.7
1.6
0.6
0.7
2.2
0.9
0.5
2.2
6.6
4.5
2.5
0.6
3.8
0.3
0.8
0.1
0.7
0.0
1.9
0.5
1.2
0.6
0.2
0.3
3.15.5 3.9
4.5 3.6 3.1
3.5 2.5 2.8
4.3
0.6
CAGR (%)
India
1.89.4 2.5 0.81.7China
4.1
2.3
5.5
1.56.2 3.0 2.1
2.8
Asia
3.3
1.82.9 2.1 1.7 1.4
OECD
Non-OECD
World
2.4 1.8
1.9
2.5
1.2 1.4
0.5
0.6
3.8
9.9
7.8Malaysia
North America
United States
Latin America
OECD Europe
Non-OECD Europe
European Union
Africa
Middle East
6.8
0.7
Indonesia
Philippines
Japan
6.4
8.2
4.7 5.6
Korea
Chinese Taipei
Myanmar 7.7
ASEAN 7.2
4.3
IEEJ:October 2017 © IEEJ2017

Annex
IEEJ Outlook 2018 Annex-21
Table A17 | Primary energy consumption per capita [Reference Scenario] (toe/person)
1990/ 2015/ 2030/ 2040/ 2015/1990 2000 2015 2030 2040 2050 2015 2030 2040 2050 2050
Source: World Bank "World Development Indicators", International Energy Agency "World Energy Balances", etc. (historical)
Note: World includes international bunkers.
Non-OECD Europe
European Union
Africa
Korea
Chinese Taipei
Myanmar
Indonesia
Malaysia
Philippines
Thailand
Viet Nam
Singapore
ASEAN
Asia excl. Japan
-0.4
0.6
-0.3
0.8
Asia
North America
United States
Latin America
OECD Europe
China
India
Japan
0.27 0.37
3.78 4.63
0.27 0.80
0.72
1.53 1.68
7.66
1.82
2.13
Middle East
Oceania
OECD
Non-OECD
World
0.54
-0.7 -0.7
0.58
-0.7
3.1 3.10.79 1.07 1.5
1.62
1.7 2.01.71 2.03 2.6 2.2
3.1 3.1
2.04
1.70
4.11
1.97
0.75 1.02 1.41
7.67
3.47 3.11 2.95 2.85
5.63
2.01
4.48 3.24 3.53 3.88
3.44
4.30
0.66 0.64 0.65
1.66 1.86 1.95
0.62
1.30
8.06 6.81 6.04
3.86
3.25
4.80
1.05
0.59
0.74
2.09
0.46 0.52 0.78
0.42
0.85
0.89
2.34 4.63 4.57
1.23
0.96
0.65
3.54
4.19
1.69 3.19 3.35 3.47
4.25 4.59
4.86 5.14 4.58
3.57
1.32 1.51 1.63
1.63
2.53 3.10
0.37
5.24
5.30
3.79
3.71
2.79
3.85
2.652.83 2.72
1.77
3.01
6.88 6.10 5.698.08
1.35
0.95 1.17
0.74 1.99
3.84
0.54 0.87 1.33 1.64 1.92
1.20 2.83 3.31 3.62
0.51
1.15
4.63
0.25
5.00 5.19
3.55 4.08 3.39
2.17
3.59
0.35 0.65
4.00
3.81
5.39 5.54
1.05
2.01
2.880.77 2.17 2.61
0.72
3.00
1.861.37 1.68
-0.1
0.0
-0.3
0.20.1
1.8
0.0
3.7 0.2
2.8 -0.1
-0.3
CAGR (%)
0.9
2.6 1.4 1.0
1.2
2.5 3.2
-0.2 0.4
4.2
2.5
1.1
1.0
0.8
0.4
2.1
0.30.5 0.3 0.3 0.2
0.90.6
0.0
1.9
2.31.61.9 2.8 2.1
0.93.5 1.0
-0.1
2.9
0.4
0.3
2.42.12.8 2.0
0.4
2.7
0.4
1.92.02.1
2.8
1.6
0.2
2.9
1.0 0.8
0.3 -0.2 0.1 0.1
1.0
1.1
0.9 0.8
-0.7
1.5
-0.8 -0.7
0.8
-0.4 -0.2 -0.3-0.4 -0.4
-0.5 -0.8
-0.4-0.3 -0.4
-0.7
1.2
0.4
-0.8
2.6 0.3 0.4 0.3
0.2 -0.8 -0.9
0.2
-0.8
0.7
-0.4 -0.4 -0.4
0.9 0.7
-0.4
-0.1
-1.3 0.6
1.64
1.15
3.35
2.95
0.61
2.22
5.22
0.90
1.0
-0.1
1.3
3.2
-0.4
0.8
4.0
4.5
1.28 1.53
3.62
4.54
5.39
4.56
5.21
3.62
IEEJ:October 2017 © IEEJ2017

Annex
IEEJ Outlook 2018 Annex-22
Table A18 | Primary energy consumption per GDP [Reference Scenario] (toe/$2010 million)
1990/ 2015/ 2030/ 2040/ 2015/1990 2000 2015 2030 2040 2050 2015 2030 2040 2050 2050
Source: World Bank "World Development Indicators", International Energy Agency "World Energy Balances", etc. (historical)
Note: World includes international bunkers.
OECD
Non-OECD
World
North America
United States
Latin America
OECD Europe
Non-OECD Europe
European Union
Africa
Middle East
Asia excl. Japan
Thailand
Viet Nam
Philippines
Singapore
Japan
Oceania
349
67
271
315
160
-1.9 -1.7
0.9
-1.4
-2.0
-1.4
293
212
250 -1.0 -2.1 -1.7
0.6 -1.6
-2.6 -1.2
-1.3
-1.4
-2.0
-1.8
-1.9
-1.6-1.8
-1.9
-2.1
-1.0 -1.0
-1.4
-1.0-0.7
-2.1
-1.8
-0.8
-1.1
-1.6
-0.9
-2.6
-1.0
163 134472 379 298 207
-0.5 -2.1 -2.3
-2.2-1.9 -2.195 76 62
50
128 108 -0.5
67 57
92
-1.6
291
121 103232 201 182 144
58 49
69 59155 139 109 83
217
248
138 121 96 70
217 189235 260
668 416
179 132
257 197449 433 348
159
129 110
259
139 115 89 68 58
714
147
87
167
211
296
606
Korea
Chinese Taipei
Myanmar
470 478
265
171 139
196304 319
1,593 960
228
ASEAN
Indonesia
Malaysia
246
295 274 207
332
154
336 230
94 97 72
314
318 343
267 301
215
322
185
278 261 244 114
160
100
174
China
India 258
334
139
201
1301821,050 505
372651 545
Asia
CAGR (%)
-3.4
-0.5 -2.2 -2.3 -2.2
-4.5 -4.0
-1.9
-2.6-3.3
-1.0 -1.6 -1.7 -1.5
345
89 75
-1.1 -0.9
154 128
260 191
62
160
249 198 171 149 -0.9 -1.5
-1.7 -1.4
62
156
146 136
238
54
159 131
47
124 100
128 106
198 179
-1.2
-2.2 -2.4 -2.5 -2.2
-1.3
-2.4
-1.5
-1.4 -1.5
-1.9
-2.2-2.1
-1.8-1.4 -1.9
-1.5
-1.9
-1.3 -1.4 -1.9
-0.1 -2.0 -1.8
-1.5
-1.8 -2.4
-2.1
-2.4
-1.4 -1.8 -1.8
-1.8
-2.5
-1.0
-6.0 -2.5
-2.0
-1.6
-1.8-1.7
-1.6
-2.0
-1.9 -1.9
-1.1 -1.3
-2.1
-2.2
-2.3
-1.2
-2.1
-2.6
-2.1
-2.1
-2.0
-3.0
-1.4
-1.8
-2.6
-1.8
-1.6
-0.9 -1.7
-1.6
-1.5 -1.3
-1.5 -1.8
-1.6-1.8 -1.8
49
122
211 180 134 97 78 64
416 307575 196 151
IEEJ:October 2017 © IEEJ2017

Annex
IEEJ Outlook 2018 Annex-23
Table A19 | Energy-related carbon dioxide emissions [Reference Scenario] (Mt)
1990/ 2015/ 2030/ 2040/ 2015/1990 2000 2015 2030 2040 2050 2015 2030 2040 2050 2050
21,205 23,416 32,910 38,142 41,613 44,107(100) (100) (100) (100) (100) (100)
4,918 6,891 15,076 19,461 22,011 23,706(23.2) (29.4) (45.8) (51.0) (52.9) (53.7)
2,339 3,164 9,333 10,721 11,088 10,517(11.0) (13.5) (28.4) (28.1) (26.6) (23.8)542 899 2,107 4,040 5,400 6,850(2.6) (3.8) (6.4) (10.6) (13.0) (15.5)
1,071 1,195 1,147 1,023 966 884(5.1) (5.1) (3.5) (2.7) (2.3) (2.0)239 433 582 656 652 603(1.1) (1.9) (1.8) (1.7) (1.6) (1.4)115 225 255 277 263 239(0.5) (1.0) (0.8) (0.7) (0.6) (0.5)362 711 1,288 2,111 2,812 3,602(1.7) (3.0) (3.9) (5.5) (6.8) (8.2)134 262 451 811 1,120 1,440(0.6) (1.1) (1.4) (2.1) (2.7) (3.3)54 121 227 323 372 421
(0.3) (0.5) (0.7) (0.8) (0.9) (1.0)4 10 25 68 111 169
(0.0) (0.0) (0.1) (0.2) (0.3) (0.4)39 69 108 218 314 440
(0.2) (0.3) (0.3) (0.6) (0.8) (1.0)29 48 50 56 59 59
(0.1) (0.2) (0.2) (0.1) (0.1) (0.1)81 152 252 319 381 428
(0.4) (0.6) (0.8) (0.8) (0.9) (1.0)17 44 168 308 449 635
(0.1) (0.2) (0.5) (0.8) (1.1) (1.4)3,847 5,696 13,928 18,438 21,046 22,821(18.1) (24.3) (42.3) (48.3) (50.6) (51.7)
5,236 6,126 5,574 5,066 4,786 4,438(24.7) (26.2) (16.9) (13.3) (11.5) (10.1)
4,820 5,617 5,071 4,598 4,328 4,004(22.7) (24.0) (15.4) (12.1) (10.4) (9.1)909 1,206 1,724 2,137 2,469 2,651(4.3) (5.2) (5.2) (5.6) (5.9) (6.0)
3,971 3,897 3,436 3,057 2,752 2,471(18.7) (16.6) (10.4) (8.0) (6.6) (5.6)
4,068 3,783 3,176 2,835 2,552 2,292(19.2) (16.2) (9.6) (7.4) (6.1) (5.2)
4,104 2,455 2,543 2,577 2,749 2,928(19.4) (10.5) (7.7) (6.8) (6.6) (6.6)593 718 1,168 1,605 2,064 2,705(2.8) (3.1) (3.5) (4.2) (5.0) (6.1)573 945 1,822 2,310 2,630 2,910(2.7) (4.0) (5.5) (6.1) (6.3) (6.6)281 337 395 385 366 347(1.3) (1.4) (1.2) (1.0) (0.9) (0.8)
11,120 12,402 11,687 10,860 10,277 9,551(52.4) (53.0) (35.5) (28.5) (24.7) (21.7)
9,464 10,174 20,051 25,738 29,551 32,605(44.6) (43.4) (60.9) (67.5) (71.0) (73.9)
Source: Compiled from International Energy Agency "World Energy Balances" (historical)
Note: Figures in parentheses are global shares (%). World includes international bunkers.
Oceania
OECD
Non-OECD
World
North America
United States
Latin America
OECD Europe
Non-OECD Europe
European Union
Africa
Middle East
Asia excl. Japan
Philippines
Thailand
Viet Nam
3.4
1.2
3.5
0.1
-0.8
4.8 3.7
3.9
4.1
0.6
0.2 -0.7 -0.6
2.6 1.4 1.5
0.5
-0.6
1.4
0.3
4.2
3.2
-1.0
4.1 3.8
-1.0
-0.6 -0.6
ASEAN
Myanmar
5.9
3.4 2.95.2
7.5
5.0Indonesia
Malaysia
Singapore
6.9 5.0
0.3
-0.5
-0.7-0.6
5.6 4.4
-0.8
0.8
Chinese Taipei
-0.1
4.4
1.3
0.6 -0.5
4.7 1.6 1.8
2.2 0.7 0.5
9.6
5.3 1.9 1.3
5.6
-0.7
1.5
-0.9
CAGR (%)
0.7
Korea
2.4
-0.9-0.8
China
India
Japan
3.6 0.8
0.3
4.6 1.3
5.7 0.9
1.2Asia 1.7
1.8
3.4
-0.2
0.1
3.0
2.4 1.4
2.54.0 3.3
2.5
1.4
1.8
3.0 1.7 1.0
1.0 0.9
1.2
-0.6 -0.8 -1.0 -1.1
0.7
-0.6-0.7
0.8
1.4
-0.4
2.4
-0.8
1.4 -0.2 -0.5
1.0
2.5
0.6
2.7
-1.9 0.1 0.4
0.6
0.2 -0.5 -0.6
-0.5
4.7 1.6 1.3 1.3
2.7 2.1
2.9 3.4
-1.0
-0.8
-1.1 -0.9
0.3
IEEJ:October 2017 © IEEJ2017
Annex
IEEJ Outlook 2018 Annex-24
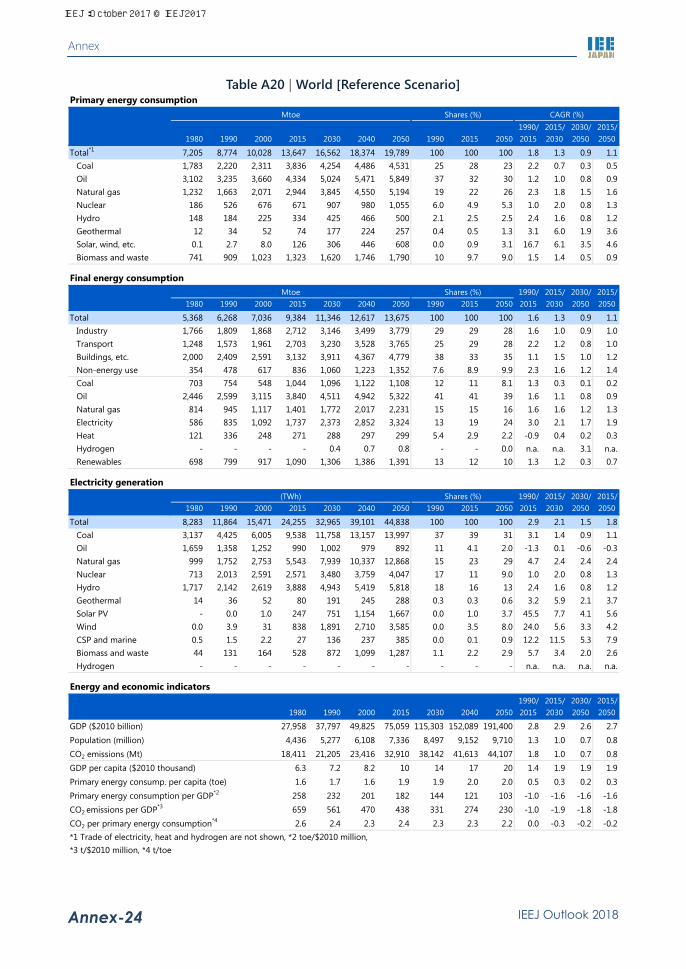
Table A20 | World [Reference Scenario] Primary energy consumption
Mtoe Shares (%) CAGR (%)1990/ 2015/ 2030/ 2015/
1980 1990 2000 2015 2030 2040 2050 1990 2015 2050 2015 2030 2050 2050
Total*1 7,205 8,774 10,028 13,647 16,562 18,374 19,789 100 100 100 1.8 1.3 0.9 1.1Coal 1,783 2,220 2,311 3,836 4,254 4,486 4,531 25 28 23 2.2 0.7 0.3 0.5Oil 3,102 3,235 3,660 4,334 5,024 5,471 5,849 37 32 30 1.2 1.0 0.8 0.9Natural gas 1,232 1,663 2,071 2,944 3,845 4,550 5,194 19 22 26 2.3 1.8 1.5 1.6Nuclear 186 526 676 671 907 980 1,055 6.0 4.9 5.3 1.0 2.0 0.8 1.3Hydro 148 184 225 334 425 466 500 2.1 2.5 2.5 2.4 1.6 0.8 1.2Geothermal 12 34 52 74 177 224 257 0.4 0.5 1.3 3.1 6.0 1.9 3.6Solar, wind, etc. 0.1 2.7 8.0 126 306 446 608 0.0 0.9 3.1 16.7 6.1 3.5 4.6Biomass and waste 741 909 1,023 1,323 1,620 1,746 1,790 10 9.7 9.0 1.5 1.4 0.5 0.9
Final energy consumptionMtoe Shares (%) 1990/ 2015/ 2030/ 2015/
1980 1990 2000 2015 2030 2040 2050 1990 2015 2050 2015 2030 2050 2050
Total 5,368 6,268 7,036 9,384 11,346 12,617 13,675 100 100 100 1.6 1.3 0.9 1.1Industry 1,766 1,809 1,868 2,712 3,146 3,499 3,779 29 29 28 1.6 1.0 0.9 1.0Transport 1,248 1,573 1,961 2,703 3,230 3,528 3,765 25 29 28 2.2 1.2 0.8 1.0Buildings, etc. 2,000 2,409 2,591 3,132 3,911 4,367 4,779 38 33 35 1.1 1.5 1.0 1.2Non-energy use 354 478 617 836 1,060 1,223 1,352 7.6 8.9 9.9 2.3 1.6 1.2 1.4Coal 703 754 548 1,044 1,096 1,122 1,108 12 11 8.1 1.3 0.3 0.1 0.2Oil 2,446 2,599 3,115 3,840 4,511 4,942 5,322 41 41 39 1.6 1.1 0.8 0.9Natural gas 814 945 1,117 1,401 1,772 2,017 2,231 15 15 16 1.6 1.6 1.2 1.3Electricity 586 835 1,092 1,737 2,373 2,852 3,324 13 19 24 3.0 2.1 1.7 1.9Heat 121 336 248 271 288 297 299 5.4 2.9 2.2 -0.9 0.4 0.2 0.3Hydrogen - - - - 0.4 0.7 0.8 - - 0.0 n.a. n.a. 3.1 n.a.Renewables 698 799 917 1,090 1,306 1,386 1,391 13 12 10 1.3 1.2 0.3 0.7
Electricity generation(TWh) Shares (%) 1990/ 2015/ 2030/ 2015/
1980 1990 2000 2015 2030 2040 2050 1990 2015 2050 2015 2030 2050 2050
Total 8,283 11,864 15,471 24,255 32,965 39,101 44,838 100 100 100 2.9 2.1 1.5 1.8Coal 3,137 4,425 6,005 9,538 11,758 13,157 13,997 37 39 31 3.1 1.4 0.9 1.1Oil 1,659 1,358 1,252 990 1,002 979 892 11 4.1 2.0 -1.3 0.1 -0.6 -0.3Natural gas 999 1,752 2,753 5,543 7,939 10,337 12,868 15 23 29 4.7 2.4 2.4 2.4Nuclear 713 2,013 2,591 2,571 3,480 3,759 4,047 17 11 9.0 1.0 2.0 0.8 1.3Hydro 1,717 2,142 2,619 3,888 4,943 5,419 5,818 18 16 13 2.4 1.6 0.8 1.2Geothermal 14 36 52 80 191 245 288 0.3 0.3 0.6 3.2 5.9 2.1 3.7Solar PV - 0.0 1.0 247 751 1,154 1,667 0.0 1.0 3.7 45.5 7.7 4.1 5.6Wind 0.0 3.9 31 838 1,891 2,710 3,585 0.0 3.5 8.0 24.0 5.6 3.3 4.2CSP and marine 0.5 1.5 2.2 27 136 237 385 0.0 0.1 0.9 12.2 11.5 5.3 7.9Biomass and waste 44 131 164 528 872 1,099 1,287 1.1 2.2 2.9 5.7 3.4 2.0 2.6Hydrogen - - - - - - - - - - n.a. n.a. n.a. n.a.
Energy and economic indicators1990/ 2015/ 2030/ 2015/
1980 1990 2000 2015 2030 2040 2050 2015 2030 2050 2050
GDP ($2010 billion) 27,958 37,797 49,825 75,059 115,303 152,089 191,400 2.8 2.9 2.6 2.7Population (million) 4,436 5,277 6,108 7,336 8,497 9,152 9,710 1.3 1.0 0.7 0.8CO2 emissions (Mt) 18,411 21,205 23,416 32,910 38,142 41,613 44,107 1.8 1.0 0.7 0.8GDP per capita ($2010 thousand) 6.3 7.2 8.2 10 14 17 20 1.4 1.9 1.9 1.9Primary energy consump. per capita (toe) 1.6 1.7 1.6 1.9 1.9 2.0 2.0 0.5 0.3 0.2 0.3Primary energy consumption per GDP*2 258 232 201 182 144 121 103 -1.0 -1.6 -1.6 -1.6CO2 emissions per GDP*3 659 561 470 438 331 274 230 -1.0 -1.9 -1.8 -1.8CO2 per primary energy consumption*4 2.6 2.4 2.3 2.4 2.3 2.3 2.2 0.0 -0.3 -0.2 -0.2*1 Trade of electricity, heat and hydrogen are not shown, *2 toe/$2010 million,*3 t/$2010 million, *4 t/toe
IEEJ:October 2017 © IEEJ2017

Annex
IEEJ Outlook 2018 Annex-25
Table A21 | Asia [Reference Scenario] Primary energy consumption
Mtoe Shares (%) CAGR (%)1990/ 2015/ 2030/ 2015/
1980 1990 2000 2015 2030 2040 2050 1990 2015 2050 2015 2030 2050 2050
Total*1 1,439 2,108 2,887 5,459 7,434 8,548 9,351 100 100 100 3.9 2.1 1.2 1.5Coal 466 785 1,037 2,739 3,320 3,632 3,754 37 50 40 5.1 1.3 0.6 0.9Oil 477 618 916 1,330 1,820 2,089 2,323 29 24 25 3.1 2.1 1.2 1.6Natural gas 51 116 232 547 965 1,285 1,567 5.5 10 17 6.4 3.9 2.5 3.1Nuclear 25 77 132 111 298 369 441 3.6 2.0 4.7 1.5 6.8 2.0 4.0Hydro 20 32 41 131 182 205 221 1.5 2.4 2.4 5.8 2.2 1.0 1.5Geothermal 2.6 8.2 23 34 92 115 127 0.4 0.6 1.4 5.9 6.8 1.6 3.8Solar, wind, etc. - 1.5 2.2 51 129 194 265 0.1 0.9 2.8 15.3 6.3 3.7 4.8Biomass and waste 397 471 503 515 625 657 652 22 9.4 7.0 0.4 1.3 0.2 0.7
Final energy consumptionMtoe Shares (%) 1990/ 2015/ 2030/ 2015/
1980 1990 2000 2015 2030 2040 2050 1990 2015 2050 2015 2030 2050 2050
Total 1,129 1,551 1,990 3,617 4,838 5,560 6,140 100 100 100 3.4 2.0 1.2 1.5Industry 383 517 646 1,481 1,759 1,956 2,097 33 41 34 4.3 1.2 0.9 1.0Transport 126 186 320 648 989 1,149 1,274 12 18 21 5.1 2.9 1.3 2.0Buildings, etc. 567 733 836 1,124 1,593 1,872 2,126 47 31 35 1.7 2.4 1.5 1.8Non-energy use 54 115 188 365 496 583 642 7.4 10 10 4.7 2.1 1.3 1.6Coal 301 424 378 901 951 974 960 27 25 16 3.1 0.4 0.0 0.2Oil 327 453 727 1,164 1,633 1,896 2,135 29 32 35 3.9 2.3 1.3 1.7Natural gas 21 47 88 252 446 576 688 3.0 7.0 11 6.9 3.9 2.2 2.9Electricity 88 158 280 740 1,152 1,441 1,705 10 20 28 6.4 3.0 2.0 2.4Heat 7.5 14 30 89 105 114 115 0.9 2.5 1.9 7.6 1.1 0.5 0.7Hydrogen - - - - 0.2 0.3 0.3 - - 0.0 n.a. n.a. 3.5 n.a.Renewables 386 456 488 471 551 558 536 29 13 8.7 0.1 1.0 -0.1 0.4
Electricity generation(TWh) Shares (%) 1990/ 2015/ 2030/ 2015/
1980 1990 2000 2015 2030 2040 2050 1990 2015 2050 2015 2030 2050 2050
Total 1,196 2,252 4,013 10,204 15,895 19,641 22,874 100 100 100 6.2 3.0 1.8 2.3Coal 298 863 1,994 6,203 8,742 10,331 11,449 38 61 50 8.2 2.3 1.4 1.8Oil 476 469 430 250 226 194 139 21 2.5 0.6 -2.5 -0.7 -2.4 -1.7Natural gas 90 240 565 1,296 2,246 3,148 4,046 11 13 18 7.0 3.7 3.0 3.3Nuclear 97 294 505 425 1,143 1,417 1,692 13 4.2 7.4 1.5 6.8 2.0 4.0Hydro 232 367 479 1,521 2,121 2,385 2,569 16 15 11 5.8 2.2 1.0 1.5Geothermal 3.0 8.4 20 24 63 78 86 0.4 0.2 0.4 4.3 6.7 1.6 3.7Solar PV - 0.0 0.6 95 374 617 925 0.0 0.9 4.0 49.6 9.6 4.6 6.7Wind - 0.0 2.4 239 696 1,071 1,465 0.0 2.3 6.4 42.5 7.4 3.8 5.3CSP and marine - 0.0 0.0 2.0 8.2 17 37 0.0 0.0 0.2 25.5 9.7 7.8 8.6Biomass and waste 0.0 10 17 150 277 383 466 0.5 1.5 2.0 11.4 4.1 2.6 3.3Hydrogen - - - - - - - - - - n.a. n.a. n.a. n.a.
Energy and economic indicators1990/ 2015/ 2030/ 2015/
1980 1990 2000 2015 2030 2040 2050 2015 2030 2050 2050
GDP ($2010 billion) 4,455 7,586 11,047 22,344 42,637 61,674 81,910 4.4 4.4 3.3 3.8Population (million) 2,440 2,932 3,407 3,993 4,433 4,595 4,658 1.2 0.7 0.2 0.4CO2 emissions (Mt) 3,268 4,918 6,891 15,076 19,461 22,011 23,706 4.6 1.7 1.0 1.3GDP per capita ($2010 thousand) 1.8 2.6 3.2 5.6 9.6 13 18 3.1 3.7 3.1 3.3Primary energy consump. per capita (toe) 0.6 0.7 0.8 1.4 1.7 1.9 2.0 2.6 1.4 0.9 1.1Primary energy consumption per GDP*2 323 278 261 244 174 139 114 -0.5 -2.2 -2.1 -2.2CO2 emissions per GDP*3 733 648 624 675 456 357 289 0.2 -2.6 -2.3 -2.4CO2 per primary energy consumption*4 2.3 2.3 2.4 2.8 2.6 2.6 2.5 0.7 -0.4 -0.2 -0.2*1 Trade of electricity, heat and hydrogen are not shown, *2 toe/$2010 million,*3 t/$2010 million, *4 t/toe
IEEJ:October 2017 © IEEJ2017

Annex
IEEJ Outlook 2018 Annex-26
Table A22 | China [Reference Scenario] Primary energy consumption
Mtoe Shares (%) CAGR (%)1990/ 2015/ 2030/ 2015/
1980 1990 2000 2015 2030 2040 2050 1990 2015 2050 2015 2030 2050 2050
Total*1 598 871 1,130 2,973 3,695 4,005 4,021 100 100 100 5.0 1.5 0.4 0.9Coal 313 528 665 1,982 2,096 2,109 1,935 61 67 48 5.4 0.4 -0.4 -0.1Oil 89 119 221 534 763 809 795 14 18 20 6.2 2.4 0.2 1.1Natural gas 12 13 21 159 343 468 561 1.5 5.3 14 10.6 5.3 2.5 3.7Nuclear - - 4.4 45 165 223 282 - 1.5 7.0 n.a. 9.1 2.7 5.4Hydro 5.0 11 19 96 122 132 135 1.3 3.2 3.4 9.1 1.6 0.5 1.0Geothermal - - 1.7 5.1 7.4 8.7 9.2 - 0.2 0.2 n.a. 2.5 1.1 1.7Solar, wind, etc. - 0.0 1.0 41 95 136 176 0.0 1.4 4.4 33.0 5.7 3.1 4.2Biomass and waste 180 200 198 114 106 120 129 23 3.8 3.2 -2.2 -0.5 1.0 0.4
Final energy consumptionMtoe Shares (%) 1990/ 2015/ 2030/ 2015/
1980 1990 2000 2015 2030 2040 2050 1990 2015 2050 2015 2030 2050 2050
Total 487 654 781 1,906 2,346 2,532 2,555 100 100 100 4.4 1.4 0.4 0.8Industry 181 234 299 966 965 973 937 36 51 37 5.8 0.0 -0.1 -0.1Transport 24 33 87 299 504 541 537 5.1 16 21 9.2 3.6 0.3 1.7Buildings, etc. 272 344 335 483 661 767 814 53 25 32 1.4 2.1 1.0 1.5Non-energy use 10 43 60 158 215 250 266 6.6 8.3 10 5.3 2.1 1.1 1.5Coal 214 308 274 701 628 574 486 47 37 19 3.3 -0.7 -1.3 -1.0Oil 59 85 180 480 700 747 739 13 25 29 7.2 2.5 0.3 1.2Natural gas 6.4 8.9 12 105 206 269 315 1.4 5.5 12 10.4 4.6 2.1 3.2Electricity 21 39 89 419 612 731 801 6.0 22 31 10.0 2.5 1.4 1.9Heat 7.4 13 25 83 98 107 109 2.0 4.4 4.3 7.6 1.1 0.5 0.8Hydrogen - - - - 0.1 0.2 0.2 - - 0.0 n.a. n.a. 2.8 n.a.Renewables 180 200 199 116 102 103 105 31 6.1 4.1 -2.2 -0.9 0.2 -0.3
Electricity generation(TWh) Shares (%) 1990/ 2015/ 2030/ 2015/
1980 1990 2000 2015 2030 2040 2050 1990 2015 2050 2015 2030 2050 2050
Total 301 621 1,356 5,844 8,441 9,970 10,763 100 100 100 9.4 2.5 1.2 1.8Coal 159 441 1,060 4,109 5,112 5,616 5,509 71 70 51 9.3 1.5 0.4 0.8Oil 82 50 47 9.7 9.0 7.6 4.9 8.1 0.2 0.0 -6.4 -0.5 -3.0 -1.9Natural gas 0.7 2.8 5.8 145 427 663 853 0.4 2.5 7.9 17.2 7.4 3.5 5.2Nuclear - - 17 171 632 856 1,081 - 2.9 10 n.a. 9.1 2.7 5.4Hydro 58 127 222 1,114 1,414 1,531 1,574 20 19 15 9.1 1.6 0.5 1.0Geothermal - 0.1 0.1 0.1 0.4 0.4 0.5 0.0 0.0 0.0 3.2 7.6 1.3 4.0Solar PV - 0.0 0.0 45 212 302 395 0.0 0.8 3.7 49.3 10.8 3.2 6.4Wind - 0.0 0.6 186 507 791 1,088 0.0 3.2 10 58.0 6.9 3.9 5.2CSP and marine - 0.0 0.0 0.0 2.5 6.0 12 0.0 0.0 0.1 6.6 33.0 8.3 18.2Biomass and waste - - 2.4 64 126 195 244 - 1.1 2.3 n.a. 4.6 3.4 3.9Hydrogen - - - - - - - - - - n.a. n.a. n.a. n.a.
Energy and economic indicators1990/ 2015/ 2030/ 2015/
1980 1990 2000 2015 2030 2040 2050 2015 2030 2050 2050
GDP ($2010 billion) 341 830 2,237 8,910 20,311 30,759 40,328 10.0 5.6 3.5 4.4Population (million) 981 1,135 1,263 1,371 1,415 1,391 1,340 0.8 0.2 -0.3 -0.1CO2 emissions (Mt) 1,505 2,339 3,164 9,333 10,721 11,088 10,517 5.7 0.9 -0.1 0.3GDP per capita ($2010 thousand) 0.3 0.7 1.8 6.5 14 22 30 9.1 5.4 3.8 4.5Primary energy consump. per capita (toe) 0.6 0.8 0.9 2.2 2.6 2.9 3.0 4.2 1.2 0.7 0.9Primary energy consumption per GDP*2 1,752 1,050 505 334 182 130 100 -4.5 -4.0 -3.0 -3.4CO2 emissions per GDP*3 4,410 2,819 1,414 1,048 528 360 261 -3.9 -4.5 -3.5 -3.9CO2 per primary energy consumption*4 2.5 2.7 2.8 3.1 2.9 2.8 2.6 0.6 -0.5 -0.5 -0.5*1 Trade of electricity, heat and hydrogen are not shown, *2 toe/$2010 million,*3 t/$2010 million, *4 t/toe
IEEJ:October 2017 © IEEJ2017

Annex
IEEJ Outlook 2018 Annex-27
Table A23 | India [Reference Scenario] Primary energy consumption
Mtoe Shares (%) CAGR (%)1990/ 2015/ 2030/ 2015/
1980 1990 2000 2015 2030 2040 2050 1990 2015 2050 2015 2030 2050 2050
Total*1 200 306 441 851 1,585 2,061 2,545 100 100 100 4.2 4.2 2.4 3.2Coal 44 93 146 379 720 932 1,143 30 45 45 5.8 4.4 2.3 3.2Oil 33 61 112 206 377 521 683 20 24 27 5.0 4.1 3.0 3.5Natural gas 1.3 11 23 43 124 195 274 3.5 5.1 11 5.8 7.3 4.0 5.4Nuclear 0.8 1.6 4.4 9.8 48 67 79 0.5 1.1 3.1 7.5 11.2 2.5 6.2Hydro 4.0 6.2 6.4 12 24 31 38 2.0 1.4 1.5 2.7 4.8 2.4 3.4Geothermal - - - - - - - - - - n.a. n.a. n.a. n.a.Solar, wind, etc. - 0.0 0.2 4.8 21 38 59 0.0 0.6 2.3 27.8 10.4 5.3 7.4Biomass and waste 116 133 149 196 269 277 268 44 23 11 1.6 2.1 0.0 0.9
Final energy consumptionMtoe Shares (%) 1990/ 2015/ 2030/ 2015/
1980 1990 2000 2015 2030 2040 2050 1990 2015 2050 2015 2030 2050 2050
Total 174 243 315 578 1,056 1,383 1,729 100 100 100 3.5 4.1 2.5 3.2Industry 41 67 83 195 376 492 597 27 34 35 4.4 4.5 2.3 3.2Transport 17 21 32 86 163 236 304 8.6 15 18 5.8 4.3 3.2 3.7Buildings, etc. 110 142 173 250 420 525 671 59 43 39 2.3 3.5 2.4 2.9Non-energy use 5.7 13 27 46 97 130 158 5.5 8.0 9.1 5.1 5.0 2.5 3.6Coal 25 39 35 108 211 277 341 16 19 20 4.2 4.5 2.4 3.3Oil 27 50 94 174 332 467 622 21 30 36 5.1 4.4 3.2 3.7Natural gas 0.7 5.6 9.7 29 72 105 137 2.3 5.0 8.0 6.8 6.2 3.3 4.6Electricity 7.8 18 32 88 205 297 407 7.6 15 24 6.5 5.8 3.5 4.5Heat - - - - - - - - - - n.a. n.a. n.a. n.a.Hydrogen - - - - 0.0 0.0 0.0 - - 0.0 n.a. n.a. 7.5 n.a.Renewables 114 130 144 178 237 237 221 54 31 13 1.3 1.9 -0.3 0.6
Electricity generation(TWh) Shares (%) 1990/ 2015/ 2030/ 2015/
1980 1990 2000 2015 2030 2040 2050 1990 2015 2050 2015 2030 2050 2050
Total 120 293 570 1,383 3,106 4,311 5,663 100 100 100 6.4 5.5 3.0 4.1Coal 61 192 390 1,042 2,085 2,753 3,485 65 75 62 7.0 4.7 2.6 3.5Oil 8.8 13 29 23 30 27 17 4.5 1.7 0.3 2.2 1.8 -2.7 -0.8Natural gas 0.6 10.0 56 68 254 448 719 3.4 4.9 13 8.0 9.2 5.3 7.0Nuclear 3.0 6.1 17 37 185 257 303 2.1 2.7 5.3 7.5 11.2 2.5 6.2Hydro 47 72 74 138 280 364 447 24 10.0 7.9 2.7 4.8 2.4 3.4Geothermal - - - - - - - - - - n.a. n.a. n.a. n.a.Solar PV - - 0.0 5.6 56 151 281 - 0.4 5.0 n.a. 16.5 8.4 11.8Wind - 0.0 1.7 43 154 226 300 0.0 3.1 5.3 33.4 8.9 3.4 5.7CSP and marine - - - - 3.1 5.9 13 - - 0.2 n.a. n.a. 7.4 n.a.Biomass and waste - - 1.3 27 59 78 99 - 1.9 1.7 n.a. 5.4 2.6 3.8Hydrogen - - - - - - - - - - n.a. n.a. n.a. n.a.
Energy and economic indicators1990/ 2015/ 2030/ 2015/
1980 1990 2000 2015 2030 2040 2050 2015 2030 2050 2050
GDP ($2010 billion) 274 470 809 2,288 6,133 10,236 15,857 6.5 6.8 4.9 5.7Population (million) 697 871 1,053 1,311 1,515 1,608 1,662 1.7 1.0 0.5 0.7CO2 emissions (Mt) 263 542 899 2,107 4,040 5,400 6,850 5.6 4.4 2.7 3.4GDP per capita ($2010 thousand) 0.4 0.5 0.8 1.7 4.0 6.4 9.5 4.8 5.8 4.4 5.0Primary energy consump. per capita (toe) 0.3 0.4 0.4 0.6 1.0 1.3 1.5 2.5 3.2 1.9 2.5Primary energy consumption per GDP*2 731 651 545 372 258 201 160 -2.2 -2.4 -2.4 -2.4CO2 emissions per GDP*3 962 1,154 1,112 921 659 528 432 -0.9 -2.2 -2.1 -2.1CO2 per primary energy consumption*4 1.3 1.8 2.0 2.5 2.5 2.6 2.7 1.3 0.2 0.3 0.2*1 Trade of electricity, heat and hydrogen are not shown, *2 toe/$2010 million,*3 t/$2010 million, *4 t/toe
IEEJ:October 2017 © IEEJ2017

Annex
IEEJ Outlook 2018 Annex-28
Table A24 | Japan [Reference Scenario] Primary energy consumption
Mtoe Shares (%) CAGR (%)1990/ 2015/ 2030/ 2015/
1980 1990 2000 2015 2030 2040 2050 1990 2015 2050 2015 2030 2050 2050
Total*1 345 439 518 430 433 414 391 100 100 100 -0.1 0.0 -0.5 -0.3Coal 60 76 97 117 112 110 104 17 27 27 1.7 -0.3 -0.4 -0.3Oil 234 250 255 185 151 133 115 57 43 29 -1.2 -1.3 -1.4 -1.4Natural gas 21 44 66 100 98 100 98 10 23 25 3.3 -0.1 0.0 -0.1Nuclear 22 53 84 2.5 38 33 33 12 0.6 8.4 -11.5 20.0 -0.7 7.7Hydro 7.6 7.5 7.3 7.3 7.9 8.1 8.1 1.7 1.7 2.1 -0.1 0.5 0.2 0.3Geothermal 0.8 1.6 3.1 2.4 5.4 7.4 8.7 0.4 0.6 2.2 1.7 5.6 2.4 3.8Solar, wind, etc. - 1.4 0.9 3.9 6.9 9.0 11 0.3 0.9 2.8 4.2 4.0 2.3 3.0Biomass and waste - 4.5 4.7 11 13 14 14 1.0 2.7 3.6 3.8 0.9 0.4 0.6
Final energy consumptionMtoe Shares (%) 1990/ 2015/ 2030/ 2015/
1980 1990 2000 2015 2030 2040 2050 1990 2015 2050 2015 2030 2050 2050
Total 232 287 328 291 279 266 251 100 100 100 0.1 -0.3 -0.5 -0.4Industry 91 110 100 82 81 81 78 38 28 31 -1.1 -0.1 -0.2 -0.1Transport 54 68 84 71 57 52 47 24 24 19 0.2 -1.4 -1.0 -1.2Buildings, etc. 58 76 103 99 103 97 90 26 34 36 1.1 0.3 -0.6 -0.3Non-energy use 28 34 41 39 38 37 36 12 13 14 0.6 -0.2 -0.3 -0.3Coal 25 30 24 24 22 21 20 11 8.1 7.8 -1.0 -0.4 -0.7 -0.5Oil 157 171 194 152 128 115 102 59 52 41 -0.5 -1.1 -1.1 -1.1Natural gas 5.8 15 22 29 34 34 34 5.3 10 14 2.7 0.9 0.1 0.4Electricity 44 66 83 82 90 91 91 23 28 36 0.8 0.6 0.1 0.3Heat 0.1 0.2 0.5 0.5 0.5 0.5 0.4 0.1 0.2 0.2 3.8 -0.1 -1.2 -0.7Hydrogen - - - - 0.0 0.0 0.0 - - 0.0 n.a. n.a. -0.8 n.a.Renewables - 4.1 3.8 3.8 4.3 4.3 4.1 1.4 1.3 1.6 -0.2 0.8 -0.3 0.2
Electricity generation(TWh) Shares (%) 1990/ 2015/ 2030/ 2015/
1980 1990 2000 2015 2030 2040 2050 1990 2015 2050 2015 2030 2050 2050
Total 573 873 1,088 1,035 1,136 1,152 1,150 100 100 100 0.7 0.6 0.1 0.3Coal 55 118 234 343 326 337 336 13 33 29 4.4 -0.4 0.2 -0.1Oil 265 284 179 103 59 37 14 33 9.9 1.2 -4.0 -3.7 -6.9 -5.5Natural gas 81 171 254 410 381 390 384 20 40 33 3.6 -0.5 0.0 -0.2Nuclear 83 202 322 9.4 145 125 125 23 0.9 11 -11.5 20.0 -0.7 7.7Hydro 88 87 85 85 92 94 94 10.0 8.2 8.2 -0.1 0.5 0.2 0.3Geothermal 0.9 1.7 3.3 2.6 6.1 8.5 9.9 0.2 0.2 0.9 1.6 5.9 2.4 3.9Solar PV - 0.0 0.3 36 63 81 95 0.0 3.5 8.3 52.1 3.8 2.1 2.8Wind - - 0.1 5.2 14 21 29 - 0.5 2.5 n.a. 7.0 3.7 5.1CSP and marine - - - - 0.1 0.1 0.4 - - 0.0 n.a. n.a. 11.0 n.a.Biomass and waste - 9.6 10 41 50 57 61 1.1 4.0 5.3 6.0 1.3 1.0 1.1Hydrogen - - - - - - - - - - n.a. n.a. n.a. n.a.
Energy and economic indicators1990/ 2015/ 2030/ 2015/
1980 1990 2000 2015 2030 2040 2050 2015 2030 2050 2050
GDP ($2010 billion) 2,977 4,683 5,349 5,986 6,948 7,705 8,329 1.0 1.0 0.9 0.9Population (million) 117 124 127 127 121 114 108 0.1 -0.3 -0.6 -0.5CO2 emissions (Mt) 916 1,071 1,195 1,147 1,023 966 884 0.3 -0.8 -0.7 -0.7GDP per capita ($2010 thousand) 25 38 42 47 58 67 77 0.9 1.3 1.5 1.4Primary energy consump. per capita (toe) 3.0 3.6 4.1 3.4 3.6 3.6 3.6 -0.2 0.4 0.0 0.2Primary energy consumption per GDP*2 116 94 97 72 62 54 47 -1.1 -0.9 -1.4 -1.2CO2 emissions per GDP*3 308 229 223 192 147 125 106 -0.7 -1.7 -1.6 -1.7CO2 per primary energy consumption*4 2.7 2.4 2.3 2.7 2.4 2.3 2.3 0.4 -0.8 -0.2 -0.5*1 Trade of electricity, heat and hydrogen are not shown, *2 toe/$2010 million,*3 t/$2010 million, *4 t/toe
IEEJ:October 2017 © IEEJ2017

Annex
IEEJ Outlook 2018 Annex-29
Table A25 | Korea [Reference Scenario] Primary energy consumption
Mtoe Shares (%) CAGR (%)1990/ 2015/ 2030/ 2015/
1980 1990 2000 2015 2030 2040 2050 1990 2015 2050 2015 2030 2050 2050
Total*1 41 93 188 273 292 283 263 100 100 100 4.4 0.5 -0.5 -0.1Coal 14 25 42 81 92 91 82 27 30 31 4.7 0.9 -0.6 0.0Oil 27 50 99 103 105 99 91 54 38 35 2.9 0.1 -0.7 -0.3Natural gas - 2.7 17 39 56 64 68 2.9 14 26 11.3 2.3 1.0 1.6Nuclear 0.9 14 28 43 31 19 11 15 16 4.1 4.7 -2.2 -5.1 -3.9Hydro 0.2 0.5 0.3 0.2 0.3 0.3 0.3 0.6 0.1 0.1 -4.3 3.8 0.0 1.6Geothermal - - - 0.1 0.2 0.2 0.2 - 0.0 0.1 n.a. 1.8 0.6 1.1Solar, wind, etc. - 0.0 0.0 0.6 1.8 2.8 4.4 0.0 0.2 1.7 18.1 7.1 4.6 5.7Biomass and waste - 0.7 1.4 5.9 6.9 6.9 6.7 0.8 2.2 2.5 8.7 1.1 -0.2 0.4
Final energy consumptionMtoe Shares (%) 1990/ 2015/ 2030/ 2015/
1980 1990 2000 2015 2030 2040 2050 1990 2015 2050 2015 2030 2050 2050
Total 31 65 127 174 191 189 180 100 100 100 4.0 0.6 -0.3 0.1Industry 10 19 38 49 53 53 50 30 28 28 3.8 0.5 -0.3 0.1Transport 4.8 15 26 33 36 34 30 22 19 17 3.4 0.4 -0.8 -0.3Buildings, etc. 13 24 37 44 50 50 48 38 25 27 2.4 0.8 -0.2 0.2Non-energy use 3.1 6.7 25 47 52 52 52 10 27 29 8.1 0.6 0.0 0.2Coal 9.7 12 9.1 12 11 9.8 8.1 18 6.8 4.5 0.0 -0.3 -1.6 -1.1Oil 19 44 80 90 93 89 82 67 52 45 2.9 0.2 -0.7 -0.3Natural gas - 0.7 11 20 26 27 27 1.0 12 15 14.6 1.5 0.2 0.7Electricity 2.8 8.1 23 43 51 54 55 13 24 31 6.9 1.2 0.4 0.7Heat - - 3.3 4.4 4.7 4.3 3.8 - 2.5 2.1 n.a. 0.6 -1.1 -0.4Hydrogen - - - - 0.0 0.0 0.0 - - 0.0 n.a. n.a. 2.8 n.a.Renewables - 0.7 1.3 4.7 5.2 5.2 5.1 1.1 2.7 2.8 7.6 0.8 -0.1 0.3
Electricity generation(TWh) Shares (%) 1990/ 2015/ 2030/ 2015/
1980 1990 2000 2015 2030 2040 2050 1990 2015 2050 2015 2030 2050 2050
Total 37 105 289 549 655 694 707 100 100 100 6.8 1.2 0.4 0.7Coal 2.5 18 111 237 293 314 305 17 43 43 10.9 1.4 0.2 0.7Oil 29 19 35 13 9.6 5.3 - 18 2.3 - -1.6 -1.8 -100 -100Natural gas - 9.6 29 123 203 261 300 9.1 22 42 10.7 3.4 2.0 2.6Nuclear 3.5 53 109 165 119 72 41 50 30 5.9 4.7 -2.2 -5.1 -3.9Hydro 2.0 6.4 4.0 2.1 3.7 3.7 3.7 6.0 0.4 0.5 -4.3 3.8 0.0 1.6Geothermal - - - - - - - - - - n.a. n.a. n.a. n.a.Solar PV - 0.0 0.0 3.9 14 20 29 0.0 0.7 4.1 39.2 8.9 3.7 5.9Wind - - 0.0 1.2 4.1 6.9 11 - 0.2 1.6 n.a. 8.6 5.1 6.6CSP and marine - - - 2.0 2.4 5.2 11 - 0.4 1.5 n.a. 1.3 7.7 4.9Biomass and waste - - 0.1 3.2 5.0 5.4 5.6 - 0.6 0.8 n.a. 3.2 0.6 1.7Hydrogen - - - - - - - - - - n.a. n.a. n.a. n.a.
Energy and economic indicators1990/ 2015/ 2030/ 2015/
1980 1990 2000 2015 2030 2040 2050 2015 2030 2050 2050
GDP ($2010 billion) 149 377 710 1,267 1,877 2,284 2,633 5.0 2.7 1.7 2.1Population (million) 38 43 47 51 53 52 50 0.7 0.3 -0.2 0.0CO2 emissions (Mt) 126 239 433 582 656 652 603 3.6 0.8 -0.4 0.1GDP per capita ($2010 thousand) 3.9 8.8 15 25 36 44 52 4.3 2.4 1.9 2.1Primary energy consump. per capita (toe) 1.1 2.2 4.0 5.4 5.5 5.4 5.2 3.7 0.2 -0.3 -0.1Primary energy consumption per GDP*2 277 246 265 215 156 124 100 -0.5 -2.1 -2.2 -2.2CO2 emissions per GDP*3 845 634 610 460 349 285 229 -1.3 -1.8 -2.1 -2.0CO2 per primary energy consumption*4 3.1 2.6 2.3 2.1 2.2 2.3 2.3 -0.7 0.3 0.1 0.2*1 Trade of electricity, heat and hydrogen are not shown, *2 toe/$2010 million,*3 t/$2010 million, *4 t/toe
IEEJ:October 2017 © IEEJ2017
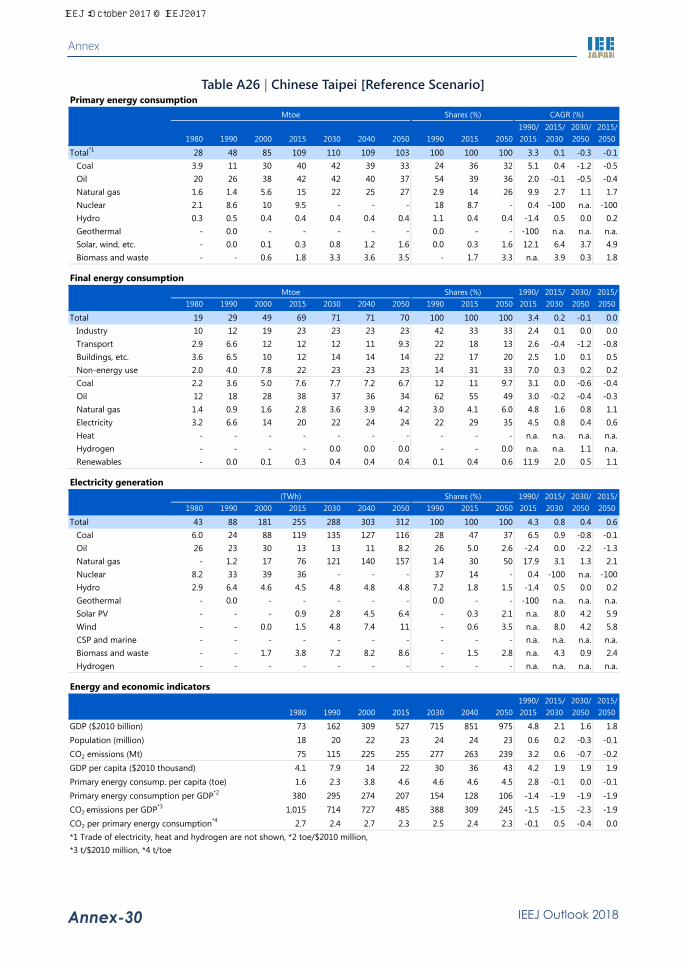
Annex
IEEJ Outlook 2018 Annex-30
Table A26 | Chinese Taipei [Reference Scenario] Primary energy consumption
Mtoe Shares (%) CAGR (%)1990/ 2015/ 2030/ 2015/
1980 1990 2000 2015 2030 2040 2050 1990 2015 2050 2015 2030 2050 2050
Total*1 28 48 85 109 110 109 103 100 100 100 3.3 0.1 -0.3 -0.1Coal 3.9 11 30 40 42 39 33 24 36 32 5.1 0.4 -1.2 -0.5Oil 20 26 38 42 42 40 37 54 39 36 2.0 -0.1 -0.5 -0.4Natural gas 1.6 1.4 5.6 15 22 25 27 2.9 14 26 9.9 2.7 1.1 1.7Nuclear 2.1 8.6 10 9.5 - - - 18 8.7 - 0.4 -100 n.a. -100Hydro 0.3 0.5 0.4 0.4 0.4 0.4 0.4 1.1 0.4 0.4 -1.4 0.5 0.0 0.2Geothermal - 0.0 - - - - - 0.0 - - -100 n.a. n.a. n.a.Solar, wind, etc. - 0.0 0.1 0.3 0.8 1.2 1.6 0.0 0.3 1.6 12.1 6.4 3.7 4.9Biomass and waste - - 0.6 1.8 3.3 3.6 3.5 - 1.7 3.3 n.a. 3.9 0.3 1.8
Final energy consumptionMtoe Shares (%) 1990/ 2015/ 2030/ 2015/
1980 1990 2000 2015 2030 2040 2050 1990 2015 2050 2015 2030 2050 2050
Total 19 29 49 69 71 71 70 100 100 100 3.4 0.2 -0.1 0.0Industry 10 12 19 23 23 23 23 42 33 33 2.4 0.1 0.0 0.0Transport 2.9 6.6 12 12 12 11 9.3 22 18 13 2.6 -0.4 -1.2 -0.8Buildings, etc. 3.6 6.5 10 12 14 14 14 22 17 20 2.5 1.0 0.1 0.5Non-energy use 2.0 4.0 7.8 22 23 23 23 14 31 33 7.0 0.3 0.2 0.2Coal 2.2 3.6 5.0 7.6 7.7 7.2 6.7 12 11 9.7 3.1 0.0 -0.6 -0.4Oil 12 18 28 38 37 36 34 62 55 49 3.0 -0.2 -0.4 -0.3Natural gas 1.4 0.9 1.6 2.8 3.6 3.9 4.2 3.0 4.1 6.0 4.8 1.6 0.8 1.1Electricity 3.2 6.6 14 20 22 24 24 22 29 35 4.5 0.8 0.4 0.6Heat - - - - - - - - - - n.a. n.a. n.a. n.a.Hydrogen - - - - 0.0 0.0 0.0 - - 0.0 n.a. n.a. 1.1 n.a.Renewables - 0.0 0.1 0.3 0.4 0.4 0.4 0.1 0.4 0.6 11.9 2.0 0.5 1.1
Electricity generation(TWh) Shares (%) 1990/ 2015/ 2030/ 2015/
1980 1990 2000 2015 2030 2040 2050 1990 2015 2050 2015 2030 2050 2050
Total 43 88 181 255 288 303 312 100 100 100 4.3 0.8 0.4 0.6Coal 6.0 24 88 119 135 127 116 28 47 37 6.5 0.9 -0.8 -0.1Oil 26 23 30 13 13 11 8.2 26 5.0 2.6 -2.4 0.0 -2.2 -1.3Natural gas - 1.2 17 76 121 140 157 1.4 30 50 17.9 3.1 1.3 2.1Nuclear 8.2 33 39 36 - - - 37 14 - 0.4 -100 n.a. -100Hydro 2.9 6.4 4.6 4.5 4.8 4.8 4.8 7.2 1.8 1.5 -1.4 0.5 0.0 0.2Geothermal - 0.0 - - - - - 0.0 - - -100 n.a. n.a. n.a.Solar PV - - - 0.9 2.8 4.5 6.4 - 0.3 2.1 n.a. 8.0 4.2 5.9Wind - - 0.0 1.5 4.8 7.4 11 - 0.6 3.5 n.a. 8.0 4.2 5.8CSP and marine - - - - - - - - - - n.a. n.a. n.a. n.a.Biomass and waste - - 1.7 3.8 7.2 8.2 8.6 - 1.5 2.8 n.a. 4.3 0.9 2.4Hydrogen - - - - - - - - - - n.a. n.a. n.a. n.a.
Energy and economic indicators1990/ 2015/ 2030/ 2015/
1980 1990 2000 2015 2030 2040 2050 2015 2030 2050 2050
GDP ($2010 billion) 73 162 309 527 715 851 975 4.8 2.1 1.6 1.8Population (million) 18 20 22 23 24 24 23 0.6 0.2 -0.3 -0.1CO2 emissions (Mt) 75 115 225 255 277 263 239 3.2 0.6 -0.7 -0.2GDP per capita ($2010 thousand) 4.1 7.9 14 22 30 36 43 4.2 1.9 1.9 1.9Primary energy consump. per capita (toe) 1.6 2.3 3.8 4.6 4.6 4.6 4.5 2.8 -0.1 0.0 -0.1Primary energy consumption per GDP*2 380 295 274 207 154 128 106 -1.4 -1.9 -1.9 -1.9CO2 emissions per GDP*3 1,015 714 727 485 388 309 245 -1.5 -1.5 -2.3 -1.9CO2 per primary energy consumption*4 2.7 2.4 2.7 2.3 2.5 2.4 2.3 -0.1 0.5 -0.4 0.0*1 Trade of electricity, heat and hydrogen are not shown, *2 toe/$2010 million,*3 t/$2010 million, *4 t/toe
IEEJ:October 2017 © IEEJ2017

Annex
IEEJ Outlook 2018 Annex-31
Table A27 | ASEAN [Reference Scenario] Primary energy consumption
Mtoe Shares (%) CAGR (%)1990/ 2015/ 2030/ 2015/
1980 1990 2000 2015 2030 2040 2050 1990 2015 2050 2015 2030 2050 2050
Total*1 142 233 379 621 982 1,259 1,544 100 100 100 4.0 3.1 2.3 2.6Coal 3.6 13 32 114 217 300 398 5.4 18 26 9.2 4.4 3.1 3.6Oil 58 89 153 210 305 394 493 38 34 32 3.5 2.5 2.4 2.5Natural gas 8.6 30 74 140 216 280 344 13 23 22 6.3 2.9 2.4 2.6Nuclear - - - - 2.2 14 23 - - 1.5 n.a. n.a. 12.5 n.a.Hydro 0.8 2.3 4.1 9.2 18 20 22 1.0 1.5 1.4 5.6 4.6 1.1 2.6Geothermal 1.8 6.6 18 27 79 99 109 2.8 4.3 7.0 5.7 7.5 1.6 4.1Solar, wind, etc. - - - 0.3 2.3 4.9 9.4 - 0.1 0.6 n.a. 13.5 7.2 9.9Biomass and waste 70 93 98 119 141 145 143 40 19 9.2 1.0 1.1 0.1 0.5
Final energy consumptionMtoe Shares (%) 1990/ 2015/ 2030/ 2015/
1980 1990 2000 2015 2030 2040 2050 1990 2015 2050 2015 2030 2050 2050
Total 112 173 270 436 645 817 1,006 100 100 100 3.8 2.6 2.2 2.4Industry 22 43 75 125 198 257 318 25 29 32 4.4 3.1 2.4 2.7Transport 17 32 61 117 170 215 270 19 27 27 5.2 2.5 2.3 2.4Buildings, etc. 71 87 113 147 211 262 317 50 34 32 2.1 2.5 2.1 2.2Non-energy use 2.4 11 21 47 66 83 101 6.3 11 10 6.0 2.3 2.1 2.2Coal 2.1 6.0 13 34 50 61 70 3.5 7.8 7.0 7.2 2.6 1.7 2.1Oil 41 67 123 193 285 370 468 38 44 47 4.4 2.6 2.5 2.6Natural gas 2.5 7.5 17 37 62 83 104 4.4 8.6 10 6.6 3.5 2.6 3.0Electricity 4.7 11 28 68 129 183 249 6.4 16 25 7.5 4.4 3.3 3.8Heat - - - - - - - - - - n.a. n.a. n.a. n.a.Hydrogen - - - - 0.0 0.0 0.0 - - 0.0 n.a. n.a. 5.8 n.a.Renewables 61 82 89 104 118 119 115 47 24 11 1.0 0.9 -0.2 0.3
Electricity generation(TWh) Shares (%) 1990/ 2015/ 2030/ 2015/
1980 1990 2000 2015 2030 2040 2050 1990 2015 2050 2015 2030 2050 2050
Total 62 154 370 868 1,670 2,374 3,220 100 100 100 7.2 4.5 3.3 3.8Coal 3.0 28 79 311 720 1,088 1,582 18 36 49 10.2 5.7 4.0 4.8Oil 47 66 72 29 23 22 13 43 3.4 0.4 -3.2 -1.7 -2.7 -2.2Natural gas 0.7 26 154 384 599 811 1,046 17 44 32 11.3 3.0 2.8 2.9Nuclear - - - - 8.4 53 88 - - 2.7 n.a. n.a. 12.5 n.a.Hydro 9.8 27 47 107 208 238 259 18 12 8.1 5.6 4.6 1.1 2.6Geothermal 2.1 6.6 16 21 56 68 75 4.3 2.4 2.3 4.8 6.7 1.5 3.7Solar PV - - - 2.9 21 46 92 - 0.3 2.9 n.a. 14.1 7.8 10.4Wind - - - 1.2 6.3 11 16 - 0.1 0.5 n.a. 11.7 4.7 7.7CSP and marine - - - - 0.1 0.3 0.5 - - 0.0 n.a. n.a. 8.3 n.a.Biomass and waste - 0.6 1.0 12 29 38 48 0.4 1.3 1.5 12.5 6.4 2.5 4.1Hydrogen - - - - - - - - - - n.a. n.a. n.a. n.a.
Energy and economic indicators1990/ 2015/ 2030/ 2015/
1980 1990 2000 2015 2030 2040 2050 2015 2030 2050 2050
GDP ($2010 billion) 440 741 1,180 2,490 4,955 7,383 10,390 5.0 4.7 3.8 4.2Population (million) 347 430 505 608 696 736 761 1.4 0.9 0.4 0.6CO2 emissions (Mt) 205 362 711 1,288 2,111 2,812 3,602 5.2 3.4 2.7 3.0GDP per capita ($2010 thousand) 1.3 1.7 2.3 4.1 7.1 10 14 3.5 3.8 3.3 3.5Primary energy consump. per capita (toe) 0.4 0.5 0.8 1.0 1.4 1.7 2.0 2.6 2.2 1.8 2.0Primary energy consumption per GDP*2 323 314 322 249 198 171 149 -0.9 -1.5 -1.4 -1.5CO2 emissions per GDP*3 466 489 602 517 426 381 347 0.2 -1.3 -1.0 -1.1CO2 per primary energy consumption*4 1.4 1.6 1.9 2.1 2.1 2.2 2.3 1.2 0.2 0.4 0.3*1 Trade of electricity, heat and hydrogen are not shown, *2 toe/$2010 million,*3 t/$2010 million, *4 t/toe
IEEJ:October 2017 © IEEJ2017

Annex
IEEJ Outlook 2018 Annex-32
Table A28 | Indonesia [Reference Scenario] Primary energy consumption
Mtoe Shares (%) CAGR (%)1990/ 2015/ 2030/ 2015/
1980 1990 2000 2015 2030 2040 2050 1990 2015 2050 2015 2030 2050 2050
Total*1 56 99 156 225 394 511 619 100 100 100 3.4 3.8 2.3 2.9Coal 0.2 3.5 12 41 87 123 161 3.6 18 26 10.3 5.1 3.2 4.0Oil 20 33 58 71 107 142 176 34 32 29 3.1 2.8 2.5 2.6Natural gas 4.9 16 27 38 72 101 131 16 17 21 3.6 4.4 3.0 3.6Nuclear - - - - - - - - - - n.a. n.a. n.a. n.a.Hydro 0.1 0.5 0.9 1.2 1.7 1.8 2.0 0.5 0.5 0.3 3.6 2.3 1.0 1.6Geothermal - 1.9 8.4 17 62 80 88 2.0 7.7 14 9.2 8.9 1.7 4.8Solar, wind, etc. - - - 0.0 0.0 0.1 0.2 - 0.0 0.0 n.a. 29.9 8.4 17.2Biomass and waste 30 44 50 57 63 64 60 44 25 9.7 1.1 0.7 -0.2 0.2
Final energy consumptionMtoe Shares (%) 1990/ 2015/ 2030/ 2015/
1980 1990 2000 2015 2030 2040 2050 1990 2015 2050 2015 2030 2050 2050
Total 50 80 120 163 245 314 382 100 100 100 2.9 2.8 2.2 2.5Industry 6.7 18 30 42 69 92 115 23 26 30 3.4 3.4 2.6 3.0Transport 6.0 11 21 44 68 88 110 13 27 29 5.8 2.9 2.4 2.6Buildings, etc. 36 44 59 70 97 119 140 55 43 37 1.9 2.2 1.8 2.0Non-energy use 1.2 7.4 9.8 7.2 11 14 17 9.2 4.4 4.4 -0.1 3.0 2.0 2.4Coal 0.1 2.2 4.7 9.6 15 20 25 2.7 5.9 6.4 6.1 3.0 2.5 2.7Oil 17 27 48 63 99 132 166 34 39 43 3.4 3.0 2.6 2.8Natural gas 2.4 6.0 12 17 31 43 55 7.5 10 14 4.2 4.1 2.9 3.4Electricity 0.6 2.4 6.8 17 39 57 79 3.0 11 21 8.2 5.5 3.6 4.4Heat - - - - - - - - - - n.a. n.a. n.a. n.a.Hydrogen - - - - 0.0 0.0 0.0 - - 0.0 n.a. n.a. 5.6 n.a.Renewables 29 42 49 56 62 62 58 53 34 15 1.1 0.7 -0.3 0.1
Electricity generation(TWh) Shares (%) 1990/ 2015/ 2030/ 2015/
1980 1990 2000 2015 2030 2040 2050 1990 2015 2050 2015 2030 2050 2050
Total 7.5 33 93 234 520 762 1,035 100 100 100 8.2 5.5 3.5 4.3Coal - 9.8 34 131 314 472 657 30 56 63 10.9 6.0 3.8 4.7Oil 6.2 15 18 20 14 14 9.5 47 8.4 0.9 1.0 -2.3 -1.9 -2.0Natural gas - 0.7 26 59 134 204 287 2.2 25 28 19.2 5.6 3.9 4.6Nuclear - - - - - - - - - - n.a. n.a. n.a. n.a.Hydro 1.3 5.7 10 14 19 21 24 17 5.9 2.3 3.6 2.3 1.0 1.6Geothermal - 1.1 4.9 10 36 46 51 3.4 4.3 4.9 9.2 8.9 1.7 4.8Solar PV - - - 0.0 0.4 1.4 2.2 - 0.0 0.2 n.a. 34.5 8.6 19.0Wind - - - 0.0 0.0 0.1 0.1 - 0.0 0.0 n.a. 13.4 6.1 9.2CSP and marine - - - - - - - - - - n.a. n.a. n.a. n.a.Biomass and waste - - 0.0 1.1 2.6 3.5 4.4 - 0.5 0.4 n.a. 5.8 2.6 4.0Hydrogen - - - - - - - - - - n.a. n.a. n.a. n.a.
Energy and economic indicators1990/ 2015/ 2030/ 2015/
1980 1990 2000 2015 2030 2040 2050 2015 2030 2050 2050
GDP ($2010 billion) 182 310 453 988 2,124 3,329 4,819 4.7 5.2 4.2 4.6Population (million) 147 181 212 258 295 312 322 1.4 0.9 0.4 0.6CO2 emissions (Mt) 72 134 262 451 811 1,120 1,440 5.0 4.0 2.9 3.4GDP per capita ($2010 thousand) 1.2 1.7 2.1 3.8 7.2 11 15 3.3 4.3 3.7 4.0Primary energy consump. per capita (toe) 0.4 0.5 0.7 0.9 1.3 1.6 1.9 1.9 2.8 1.9 2.3Primary energy consumption per GDP*2 307 318 343 228 185 154 128 -1.3 -1.4 -1.8 -1.6CO2 emissions per GDP*3 394 432 578 457 382 336 299 0.2 -1.2 -1.2 -1.2CO2 per primary energy consumption*4 1.3 1.4 1.7 2.0 2.1 2.2 2.3 1.6 0.2 0.6 0.4*1 Trade of electricity, heat and hydrogen are not shown, *2 toe/$2010 million,*3 t/$2010 million, *4 t/toe
IEEJ:October 2017 © IEEJ2017

Annex
IEEJ Outlook 2018 Annex-33
Table A29 | Malaysia [Reference Scenario] Primary energy consumption
Mtoe Shares (%) CAGR (%)1990/ 2015/ 2030/ 2015/
1980 1990 2000 2015 2030 2040 2050 1990 2015 2050 2015 2030 2050 2050
Total*1 12 22 49 86 120 142 158 100 100 100 5.6 2.3 1.4 1.8Coal 0.1 1.4 2.3 18 31 38 47 6.2 20 30 10.8 4.0 2.1 2.9Oil 7.9 11 19 28 34 37 40 53 32 25 3.6 1.4 0.8 1.1Natural gas 2.2 6.8 25 38 50 57 61 31 44 38 7.1 1.9 1.0 1.4Nuclear - - - - - 3.7 3.7 - - 2.3 n.a. n.a. n.a. n.a.Hydro 0.1 0.3 0.6 1.2 2.4 2.8 3.1 1.6 1.4 2.0 5.1 4.7 1.3 2.8Geothermal - - - - - - - - - - n.a. n.a. n.a. n.a.Solar, wind, etc. - - - 0.0 0.1 0.3 0.5 - 0.0 0.3 n.a. 11.9 6.8 9.0Biomass and waste 1.6 1.9 1.9 1.9 2.6 2.8 3.0 8.5 2.3 1.9 0.2 2.0 0.6 1.2
Final energy consumptionMtoe Shares (%) 1990/ 2015/ 2030/ 2015/
1980 1990 2000 2015 2030 2040 2050 1990 2015 2050 2015 2030 2050 2050
Total 7.2 14 30 52 71 82 92 100 100 100 5.4 2.1 1.3 1.7Industry 3.1 5.6 12 15 24 30 36 40 29 39 4.1 3.1 2.0 2.5Transport 2.1 4.9 11 21 24 25 25 35 41 27 6.0 0.8 0.3 0.5Buildings, etc. 1.7 2.6 5.0 9.4 14 17 20 19 18 21 5.2 2.8 1.6 2.1Non-energy use 0.3 0.8 2.2 5.9 8.5 10 12 6.0 11 13 8.1 2.5 1.6 2.0Coal 0.1 0.5 1.0 1.8 2.8 3.4 4.0 3.7 3.4 4.3 5.1 3.0 1.8 2.3Oil 5.3 9.3 18 28 34 37 40 67 54 43 4.4 1.3 0.8 1.0Natural gas 0.0 1.1 3.9 9.6 14 16 17 7.9 19 19 9.1 2.3 1.2 1.7Electricity 0.7 1.7 5.3 11 19 25 30 12 22 32 7.9 3.5 2.2 2.8Heat - - - - - - - - - - n.a. n.a. n.a. n.a.Hydrogen - - - - 0.0 0.0 0.0 - - 0.0 n.a. n.a. 3.3 n.a.Renewables 1.0 1.3 1.3 1.2 1.6 1.6 1.7 9.1 2.4 1.8 -0.1 1.7 0.2 0.9
Electricity generation(TWh) Shares (%) 1990/ 2015/ 2030/ 2015/
1980 1990 2000 2015 2030 2040 2050 1990 2015 2050 2015 2030 2050 2050
Total 10 23 69 150 250 321 388 100 100 100 7.8 3.5 2.2 2.8Coal - 2.9 7.7 63 131 164 221 13 42 57 13.1 4.9 2.7 3.6Oil 8.5 11 3.6 1.7 2.0 1.7 1.2 46 1.2 0.3 -7.0 0.8 -2.4 -1.1Natural gas 0.1 5.5 51 70 87 103 108 24 47 28 10.7 1.4 1.1 1.2Nuclear - - - - - 14 14 - - 3.6 n.a. n.a. n.a. n.a.Hydro 1.4 4.0 7.0 14 28 32 36 17 9.3 9.3 5.1 4.7 1.3 2.8Geothermal - - - - - - - - - - n.a. n.a. n.a. n.a.Solar PV - - - 0.3 1.5 3.5 5.6 - 0.2 1.4 n.a. 11.9 6.8 9.0Wind - - - - - - - - - - n.a. n.a. n.a. n.a.CSP and marine - - - - - - - - - - n.a. n.a. n.a. n.a.Biomass and waste - - - 0.8 1.8 2.5 3.1 - 0.5 0.8 n.a. 6.2 2.6 4.1Hydrogen - - - - - - - - - - n.a. n.a. n.a. n.a.
Energy and economic indicators1990/ 2015/ 2030/ 2015/
1980 1990 2000 2015 2030 2040 2050 2015 2030 2050 2050
GDP ($2010 billion) 46 82 163 330 629 895 1,205 5.7 4.4 3.3 3.8Population (million) 14 18 23 30 36 39 41 2.1 1.2 0.6 0.9CO2 emissions (Mt) 29 54 121 227 323 372 421 5.9 2.4 1.3 1.8GDP per capita ($2010 thousand) 3.3 4.5 6.9 11 17 23 29 3.6 3.1 2.7 2.9Primary energy consump. per capita (toe) 0.9 1.2 2.1 2.8 3.3 3.6 3.8 3.5 1.0 0.8 0.9Primary energy consumption per GDP*2 260 267 301 260 191 159 131 -0.1 -2.0 -1.9 -1.9CO2 emissions per GDP*3 630 666 744 689 514 416 349 0.1 -1.9 -1.9 -1.9CO2 per primary energy consumption*4 2.4 2.5 2.5 2.6 2.7 2.6 2.7 0.2 0.1 -0.1 0.0*1 Trade of electricity, heat and hydrogen are not shown, *2 toe/$2010 million,*3 t/$2010 million, *4 t/toe
IEEJ:October 2017 © IEEJ2017

Annex
IEEJ Outlook 2018 Annex-34
Table A30 | Myanmar [Reference Scenario] Primary energy consumption
Mtoe Shares (%) CAGR (%)1990/ 2015/ 2030/ 2015/
1980 1990 2000 2015 2030 2040 2050 1990 2015 2050 2015 2030 2050 2050
Total*1 9.4 11 13 20 35 50 69 100 100 100 2.5 3.9 3.4 3.6Coal 0.2 0.1 0.3 0.4 2.9 5.4 8.9 0.6 2.2 13 7.9 13.4 5.7 9.0Oil 1.3 0.7 2.0 5.4 15 24 36 6.8 27 53 8.4 7.1 4.5 5.6Natural gas 0.3 0.8 1.2 3.0 4.7 7.3 10 7.1 15 15 5.7 3.0 3.9 3.5Nuclear - - - - - - - - - - n.a. n.a. n.a. n.a.Hydro 0.1 0.1 0.2 0.8 3.2 4.2 5.1 1.0 4.1 7.3 8.6 9.5 2.4 5.4Geothermal - - - - - - - - - - n.a. n.a. n.a. n.a.Solar, wind, etc. - - - - 0.1 0.1 0.2 - - 0.3 n.a. n.a. 6.8 n.a.Biomass and waste 7.6 9.0 9.2 10 11 11 11 84 51 16 0.5 0.3 0.2 0.3
Final energy consumptionMtoe Shares (%) 1990/ 2015/ 2030/ 2015/
1980 1990 2000 2015 2030 2040 2050 1990 2015 2050 2015 2030 2050 2050
Total 8.4 9.4 11 18 31 43 59 100 100 100 2.6 3.7 3.3 3.5Industry 0.6 0.4 1.1 2.2 5.1 7.5 9.9 4.2 12 17 7.1 5.8 3.4 4.4Transport 0.6 0.4 1.2 3.5 10.0 16 25 4.7 20 43 8.6 7.2 4.8 5.8Buildings, etc. 7.0 8.5 9.1 12 15 19 23 90 66 39 1.3 1.7 2.0 1.9Non-energy use 0.1 0.1 0.1 0.3 0.4 0.6 0.7 1.0 1.5 1.1 4.2 3.3 2.1 2.6Coal 0.1 0.1 0.3 0.4 0.5 0.6 0.6 0.5 2.1 1.0 8.3 2.0 0.8 1.3Oil 1.2 0.6 1.5 5.4 15 24 36 6.2 31 62 9.3 7.0 4.5 5.6Natural gas 0.1 0.2 0.3 0.7 1.3 1.9 2.6 2.4 4.0 4.4 4.7 3.9 3.7 3.8Electricity 0.1 0.1 0.3 1.2 3.3 5.4 8.1 1.6 6.5 14 8.5 7.2 4.6 5.7Heat - - - - - - - - - - n.a. n.a. n.a. n.a.Hydrogen - - - - 0.0 0.0 0.0 - - 0.0 n.a. n.a. 6.6 n.a.Renewables 6.9 8.4 9.0 10 11 11 11 89 57 19 0.7 0.3 0.2 0.3
Electricity generation(TWh) Shares (%) 1990/ 2015/ 2030/ 2015/
1980 1990 2000 2015 2030 2040 2050 1990 2015 2050 2015 2030 2050 2050
Total 1.5 2.5 5.1 16 66 103 149 100 100 100 7.7 9.9 4.2 6.6Coal 0.0 0.0 - 0.3 12 25 46 1.6 1.8 31 8.2 28.3 7.0 15.7Oil 0.5 0.3 0.7 0.1 0.2 0.2 0.2 11 0.3 0.1 -6.2 7.5 1.1 3.8Natural gas 0.2 1.0 2.5 6.2 16 28 42 39 39 28 7.7 6.5 4.9 5.6Nuclear - - - - - - - - - - n.a. n.a. n.a. n.a.Hydro 0.8 1.2 1.9 9.4 37 49 59 48 59 39 8.6 9.5 2.4 5.4Geothermal - - - - - - - - - - n.a. n.a. n.a. n.a.Solar PV - - - - 0.3 0.8 1.8 - - 1.2 n.a. n.a. 10.1 n.a.Wind - - - - 0.4 0.6 0.8 - - 0.5 n.a. n.a. 3.0 n.a.CSP and marine - - - - - - - - - - n.a. n.a. n.a. n.a.Biomass and waste - - - - - - - - - - n.a. n.a. n.a. n.a.Hydrogen - - - - - - - - - - n.a. n.a. n.a. n.a.
Energy and economic indicators1990/ 2015/ 2030/ 2015/
1980 1990 2000 2015 2030 2040 2050 2015 2030 2050 2050
GDP ($2010 billion) 5.9 6.7 13 59 153 252 384 9.1 6.5 4.7 5.5Population (million) 34 42 48 54 61 63 64 1.0 0.8 0.3 0.5CO2 emissions (Mt) 5.2 4.1 9.9 25 68 111 169 7.5 6.9 4.7 5.6GDP per capita ($2010 thousand) 0.2 0.2 0.3 1.1 2.5 4.0 6.0 8.0 5.7 4.4 5.0Primary energy consump. per capita (toe) 0.3 0.3 0.3 0.4 0.6 0.8 1.1 1.5 3.1 3.1 3.1Primary energy consumption per GDP*2 1,597 1,593 960 336 230 198 179 -6.0 -2.5 -1.2 -1.8CO2 emissions per GDP*3 888 606 741 421 445 439 441 -1.4 0.4 0.0 0.1CO2 per primary energy consumption*4 0.6 0.4 0.8 1.3 1.9 2.2 2.5 4.9 2.9 1.2 1.9*1 Trade of electricity, heat and hydrogen are not shown, *2 toe/$2010 million,*3 t/$2010 million, *4 t/toe
IEEJ:October 2017 © IEEJ2017
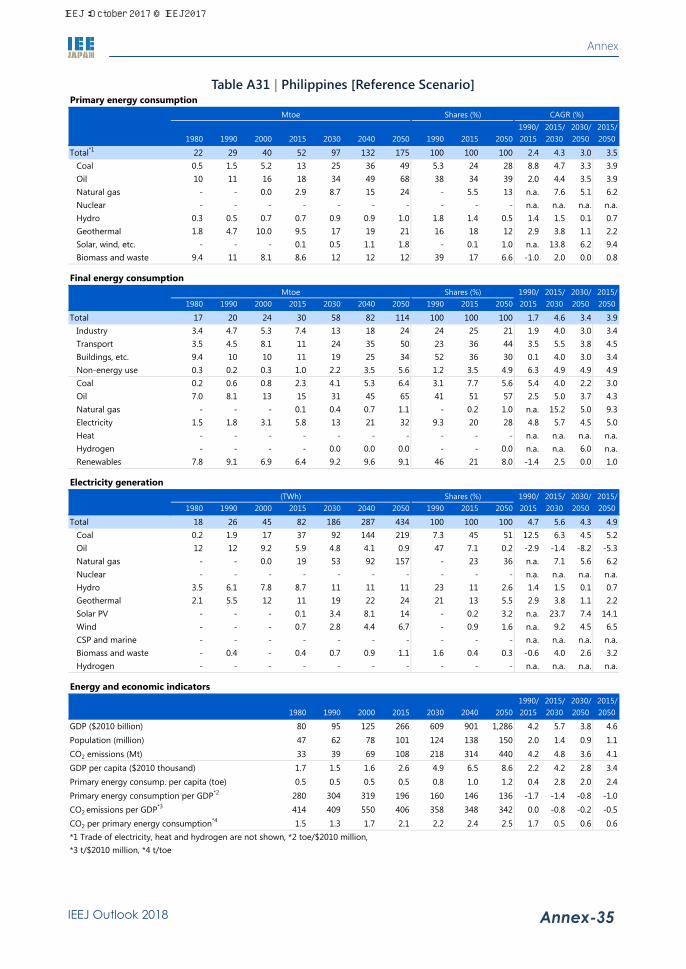
Annex
IEEJ Outlook 2018 Annex-35
Table A31 | Philippines [Reference Scenario] Primary energy consumption
Mtoe Shares (%) CAGR (%)1990/ 2015/ 2030/ 2015/
1980 1990 2000 2015 2030 2040 2050 1990 2015 2050 2015 2030 2050 2050
Total*1 22 29 40 52 97 132 175 100 100 100 2.4 4.3 3.0 3.5Coal 0.5 1.5 5.2 13 25 36 49 5.3 24 28 8.8 4.7 3.3 3.9Oil 10 11 16 18 34 49 68 38 34 39 2.0 4.4 3.5 3.9Natural gas - - 0.0 2.9 8.7 15 24 - 5.5 13 n.a. 7.6 5.1 6.2Nuclear - - - - - - - - - - n.a. n.a. n.a. n.a.Hydro 0.3 0.5 0.7 0.7 0.9 0.9 1.0 1.8 1.4 0.5 1.4 1.5 0.1 0.7Geothermal 1.8 4.7 10.0 9.5 17 19 21 16 18 12 2.9 3.8 1.1 2.2Solar, wind, etc. - - - 0.1 0.5 1.1 1.8 - 0.1 1.0 n.a. 13.8 6.2 9.4Biomass and waste 9.4 11 8.1 8.6 12 12 12 39 17 6.6 -1.0 2.0 0.0 0.8
Final energy consumptionMtoe Shares (%) 1990/ 2015/ 2030/ 2015/
1980 1990 2000 2015 2030 2040 2050 1990 2015 2050 2015 2030 2050 2050
Total 17 20 24 30 58 82 114 100 100 100 1.7 4.6 3.4 3.9Industry 3.4 4.7 5.3 7.4 13 18 24 24 25 21 1.9 4.0 3.0 3.4Transport 3.5 4.5 8.1 11 24 35 50 23 36 44 3.5 5.5 3.8 4.5Buildings, etc. 9.4 10 10 11 19 25 34 52 36 30 0.1 4.0 3.0 3.4Non-energy use 0.3 0.2 0.3 1.0 2.2 3.5 5.6 1.2 3.5 4.9 6.3 4.9 4.9 4.9Coal 0.2 0.6 0.8 2.3 4.1 5.3 6.4 3.1 7.7 5.6 5.4 4.0 2.2 3.0Oil 7.0 8.1 13 15 31 45 65 41 51 57 2.5 5.0 3.7 4.3Natural gas - - - 0.1 0.4 0.7 1.1 - 0.2 1.0 n.a. 15.2 5.0 9.3Electricity 1.5 1.8 3.1 5.8 13 21 32 9.3 20 28 4.8 5.7 4.5 5.0Heat - - - - - - - - - - n.a. n.a. n.a. n.a.Hydrogen - - - - 0.0 0.0 0.0 - - 0.0 n.a. n.a. 6.0 n.a.Renewables 7.8 9.1 6.9 6.4 9.2 9.6 9.1 46 21 8.0 -1.4 2.5 0.0 1.0
Electricity generation(TWh) Shares (%) 1990/ 2015/ 2030/ 2015/
1980 1990 2000 2015 2030 2040 2050 1990 2015 2050 2015 2030 2050 2050
Total 18 26 45 82 186 287 434 100 100 100 4.7 5.6 4.3 4.9Coal 0.2 1.9 17 37 92 144 219 7.3 45 51 12.5 6.3 4.5 5.2Oil 12 12 9.2 5.9 4.8 4.1 0.9 47 7.1 0.2 -2.9 -1.4 -8.2 -5.3Natural gas - - 0.0 19 53 92 157 - 23 36 n.a. 7.1 5.6 6.2Nuclear - - - - - - - - - - n.a. n.a. n.a. n.a.Hydro 3.5 6.1 7.8 8.7 11 11 11 23 11 2.6 1.4 1.5 0.1 0.7Geothermal 2.1 5.5 12 11 19 22 24 21 13 5.5 2.9 3.8 1.1 2.2Solar PV - - - 0.1 3.4 8.1 14 - 0.2 3.2 n.a. 23.7 7.4 14.1Wind - - - 0.7 2.8 4.4 6.7 - 0.9 1.6 n.a. 9.2 4.5 6.5CSP and marine - - - - - - - - - - n.a. n.a. n.a. n.a.Biomass and waste - 0.4 - 0.4 0.7 0.9 1.1 1.6 0.4 0.3 -0.6 4.0 2.6 3.2Hydrogen - - - - - - - - - - n.a. n.a. n.a. n.a.
Energy and economic indicators1990/ 2015/ 2030/ 2015/
1980 1990 2000 2015 2030 2040 2050 2015 2030 2050 2050
GDP ($2010 billion) 80 95 125 266 609 901 1,286 4.2 5.7 3.8 4.6Population (million) 47 62 78 101 124 138 150 2.0 1.4 0.9 1.1CO2 emissions (Mt) 33 39 69 108 218 314 440 4.2 4.8 3.6 4.1GDP per capita ($2010 thousand) 1.7 1.5 1.6 2.6 4.9 6.5 8.6 2.2 4.2 2.8 3.4Primary energy consump. per capita (toe) 0.5 0.5 0.5 0.5 0.8 1.0 1.2 0.4 2.8 2.0 2.4Primary energy consumption per GDP*2 280 304 319 196 160 146 136 -1.7 -1.4 -0.8 -1.0CO2 emissions per GDP*3 414 409 550 406 358 348 342 0.0 -0.8 -0.2 -0.5CO2 per primary energy consumption*4 1.5 1.3 1.7 2.1 2.2 2.4 2.5 1.7 0.5 0.6 0.6*1 Trade of electricity, heat and hydrogen are not shown, *2 toe/$2010 million,*3 t/$2010 million, *4 t/toe
IEEJ:October 2017 © IEEJ2017

Annex
IEEJ Outlook 2018 Annex-36
Table A32 | Thailand [Reference Scenario] Primary energy consumption
Mtoe Shares (%) CAGR (%)1990/ 2015/ 2030/ 2015/
1980 1990 2000 2015 2030 2040 2050 1990 2015 2050 2015 2030 2050 2050
Total*1 22 42 72 135 174 210 245 100 100 100 4.8 1.7 1.7 1.7Coal 0.5 3.8 7.7 17 24 30 34 9.1 12 14 6.1 2.4 1.8 2.0Oil 11 18 32 54 64 75 87 43 40 35 4.5 1.1 1.6 1.4Natural gas - 5.0 17 38 49 59 67 12 28 27 8.4 1.7 1.6 1.6Nuclear - - - - - 3.7 8.8 - - 3.6 n.a. n.a. n.a. n.a.Hydro 0.1 0.4 0.5 0.4 0.6 0.7 0.7 1.0 0.3 0.3 -0.2 3.1 0.1 1.4Geothermal - 0.0 0.0 0.0 0.0 0.0 0.0 0.0 0.0 0.0 0.0 10.3 1.1 4.9Solar, wind, etc. - - - 0.2 1.4 2.9 6.0 - 0.2 2.4 n.a. 12.9 7.4 9.7Biomass and waste 11 15 15 25 33 35 37 35 19 15 2.2 1.7 0.6 1.1
Final energy consumptionMtoe Shares (%) 1990/ 2015/ 2030/ 2015/
1980 1990 2000 2015 2030 2040 2050 1990 2015 2050 2015 2030 2050 2050
Total 15 29 51 98 122 144 168 100 100 100 5.0 1.4 1.6 1.5Industry 4.0 8.7 17 31 38 46 53 30 31 31 5.2 1.5 1.6 1.6Transport 3.2 9.0 15 24 26 28 30 31 24 18 3.9 0.6 0.7 0.7Buildings, etc. 7.8 11 14 21 29 35 41 37 22 24 2.7 2.1 1.8 1.9Non-energy use 0.2 0.4 5.6 23 29 36 44 1.5 23 26 17.2 1.6 2.2 1.9Coal 0.1 1.3 3.5 8.2 8.9 9.5 10 4.5 8.3 6.0 7.6 0.6 0.6 0.6Oil 7.3 15 29 52 61 72 83 52 53 50 5.1 1.1 1.5 1.4Natural gas - 0.1 1.1 7.2 11 14 19 0.5 7.3 11 17.1 2.6 2.9 2.8Electricity 1.1 3.3 7.6 15 23 31 38 11 15 23 6.3 3.0 2.5 2.7Heat - - - - - - - - - - n.a. n.a. n.a. n.a.Hydrogen - - - - 0.0 0.0 0.0 - - 0.0 n.a. n.a. 4.2 n.a.Renewables 6.7 9.2 9.4 16 18 18 17 32 16 10 2.2 0.6 -0.1 0.2
Electricity generation(TWh) Shares (%) 1990/ 2015/ 2030/ 2015/
1980 1990 2000 2015 2030 2040 2050 1990 2015 2050 2015 2030 2050 2050
Total 14 44 96 178 260 341 422 100 100 100 5.7 2.6 2.5 2.5Coal 1.4 11 18 35 65 93 116 25 19 28 4.7 4.3 3.0 3.5Oil 12 10 10 1.0 0.6 0.1 - 23 0.6 - -8.9 -3.5 -100 -100Natural gas - 18 62 127 150 165 161 40 71 38 8.2 1.1 0.4 0.7Nuclear - - - - - 14 34 - - 8.0 n.a. n.a. n.a. n.a.Hydro 1.3 5.0 6.0 4.7 7.5 7.6 7.7 11 2.7 1.8 -0.2 3.1 0.1 1.4Geothermal - 0.0 0.0 0.0 0.0 0.0 0.0 0.0 0.0 0.0 0.0 10.3 1.1 4.9Solar PV - - - 2.4 14 29 62 - 1.3 15 n.a. 12.5 7.8 9.8Wind - - - 0.3 2.3 4.0 5.7 - 0.2 1.3 n.a. 14.0 4.5 8.5CSP and marine - - - - 0.1 0.3 0.5 - - 0.1 n.a. n.a. 8.3 n.a.Biomass and waste - - 0.5 7.7 21 27 35 - 4.3 8.2 n.a. 6.8 2.6 4.4Hydrogen - - - - - - - - - - n.a. n.a. n.a. n.a.
Energy and economic indicators1990/ 2015/ 2030/ 2015/
1980 1990 2000 2015 2030 2040 2050 2015 2030 2050 2050
GDP ($2010 billion) 67 142 218 392 642 884 1,157 4.2 3.3 3.0 3.1Population (million) 47 57 63 68 69 68 65 0.7 0.1 -0.3 -0.1CO2 emissions (Mt) 34 81 152 252 319 381 428 4.7 1.6 1.5 1.5GDP per capita ($2010 thousand) 1.4 2.5 3.5 5.8 9.3 13 18 3.4 3.2 3.3 3.3Primary energy consump. per capita (toe) 0.5 0.7 1.2 2.0 2.5 3.1 3.8 4.0 1.6 2.0 1.9Primary energy consumption per GDP*2 331 296 332 345 271 238 212 0.6 -1.6 -1.2 -1.4CO2 emissions per GDP*3 512 570 697 642 497 431 370 0.5 -1.7 -1.5 -1.6CO2 per primary energy consumption*4 1.5 1.9 2.1 1.9 1.8 1.8 1.7 -0.1 -0.1 -0.2 -0.2*1 Trade of electricity, heat and hydrogen are not shown, *2 toe/$2010 million,*3 t/$2010 million, *4 t/toe
IEEJ:October 2017 © IEEJ2017

Annex
IEEJ Outlook 2018 Annex-37
Table A33 | Viet Nam [Reference Scenario] Primary energy consumption
Mtoe Shares (%) CAGR (%)1990/ 2015/ 2030/ 2015/
1980 1990 2000 2015 2030 2040 2050 1990 2015 2050 2015 2030 2050 2050
Total*1 14 18 29 74 128 178 240 100 100 100 5.8 3.7 3.2 3.4Coal 2.3 2.2 4.4 25 47 68 97 12 34 41 10.2 4.3 3.7 4.0Oil 1.8 2.7 7.8 19 32 46 64 15 25 27 8.1 3.6 3.5 3.5Natural gas - 0.0 1.1 9.5 18 27 38 0.0 13 16 38.6 4.4 3.7 4.0Nuclear - - - - 2.2 6.4 11 - - 4.4 n.a. n.a. 8.2 n.a.Hydro 0.1 0.5 1.3 4.8 9.2 10 11 2.6 6.5 4.4 9.8 4.4 0.7 2.2Geothermal - - - - - - - - - - n.a. n.a. n.a. n.a.Solar, wind, etc. - - - 0.0 0.1 0.3 0.5 - 0.0 0.2 n.a. 17.8 7.7 11.9Biomass and waste 10 12 14 16 19 19 18 70 21 7.6 0.9 1.2 -0.1 0.5
Final energy consumptionMtoe Shares (%) 1990/ 2015/ 2030/ 2015/
1980 1990 2000 2015 2030 2040 2050 1990 2015 2050 2015 2030 2050 2050
Total 13 16 25 58 96 128 167 100 100 100 5.3 3.4 2.8 3.1Industry 3.8 4.5 7.9 23 42 57 73 28 39 44 6.7 4.1 2.9 3.4Transport 0.6 1.4 3.5 11 15 20 27 8.6 18 16 8.5 2.4 2.9 2.7Buildings, etc. 8.6 10 14 21 33 43 55 63 36 33 3.0 3.0 2.6 2.8Non-energy use 0.0 0.0 0.1 3.6 6.3 8.5 11 0.2 6.1 6.5 21.5 3.8 2.8 3.2Coal 1.5 1.3 3.2 12 19 22 25 8.3 20 15 9.1 3.1 1.4 2.1Oil 1.7 2.3 6.5 18 31 44 62 15 31 37 8.5 3.7 3.5 3.6Natural gas - - 0.0 1.5 3.6 5.2 7.0 - 2.6 4.2 n.a. 6.1 3.4 4.5Electricity 0.2 0.5 1.9 12 26 38 56 3.3 21 34 13.4 5.0 4.0 4.4Heat - - - - - - - - - - n.a. n.a. n.a. n.a.Hydrogen - - - - 0.0 0.0 0.0 - - 0.0 n.a. n.a. 9.1 n.a.Renewables 9.7 12 13 15 18 18 17 74 25 10 0.8 1.2 -0.1 0.5
Electricity generation(TWh) Shares (%) 1990/ 2015/ 2030/ 2015/
1980 1990 2000 2015 2030 2040 2050 1990 2015 2050 2015 2030 2050 2050
Total 3.6 8.7 27 153 320 487 716 100 100 100 12.2 5.0 4.1 4.5Coal 1.4 2.0 3.1 45 106 190 322 23 30 45 13.3 5.8 5.7 5.8Oil 0.7 1.3 4.5 0.7 1.1 1.2 1.0 15 0.5 0.1 -2.2 2.4 -0.1 1.0Natural gas - 0.0 4.4 51 97 151 224 0.1 33 31 43.6 4.4 4.3 4.3Nuclear - - - - 8.4 25 41 - - 5.7 n.a. n.a. 8.2 n.a.Hydro 1.5 5.4 15 56 106 117 122 62 37 17 9.8 4.4 0.7 2.2Geothermal - - - - - - - - - - n.a. n.a. n.a. n.a.Solar PV - - - - 0.7 2.2 3.5 - - 0.5 n.a. n.a. 8.6 n.a.Wind - - - 0.1 0.7 1.5 2.7 - 0.1 0.4 n.a. 12.7 6.7 9.2CSP and marine - - - - - - - - - - n.a. n.a. n.a. n.a.Biomass and waste - - - 0.1 0.2 0.2 0.3 - 0.0 0.0 n.a. 6.5 2.6 4.3Hydrogen - - - - - - - - - - n.a. n.a. n.a. n.a.
Energy and economic indicators1990/ 2015/ 2030/ 2015/
1980 1990 2000 2015 2030 2040 2050 2015 2030 2050 2050
GDP ($2010 billion) 17 29 61 155 367 607 957 6.9 5.9 4.9 5.3Population (million) 54 66 78 92 104 109 112 1.3 0.9 0.4 0.6CO2 emissions (Mt) 15 17 44 168 308 449 635 9.6 4.1 3.7 3.9GDP per capita ($2010 thousand) 0.3 0.4 0.8 1.7 3.5 5.6 8.5 5.5 5.0 4.5 4.7Primary energy consump. per capita (toe) 0.3 0.3 0.4 0.8 1.2 1.6 2.1 4.5 2.9 2.8 2.8Primary energy consumption per GDP*2 851 606 470 478 349 293 250 -1.0 -2.1 -1.6 -1.8CO2 emissions per GDP*3 860 579 711 1,088 839 739 663 2.6 -1.7 -1.2 -1.4CO2 per primary energy consumption*4 1.0 1.0 1.5 2.3 2.4 2.5 2.7 3.5 0.4 0.5 0.4*1 Trade of electricity, heat and hydrogen are not shown, *2 toe/$2010 million,*3 t/$2010 million, *4 t/toe
IEEJ:October 2017 © IEEJ2017

Annex
IEEJ Outlook 2018 Annex-38
Table A34 | North America [Reference Scenario] Primary energy consumption
Mtoe Shares (%) CAGR (%)1990/ 2015/ 2030/ 2015/
1980 1990 2000 2015 2030 2040 2050 1990 2015 2050 2015 2030 2050 2050
Total*1 1,997 2,126 2,527 2,458 2,420 2,382 2,312 100 100 100 0.6 -0.1 -0.2 -0.2Coal 397 485 565 393 289 230 168 23 16 7.3 -0.8 -2.0 -2.7 -2.4Oil 885 833 958 888 805 751 695 39 36 30 0.3 -0.7 -0.7 -0.7Natural gas 522 493 622 733 819 877 905 23 30 39 1.6 0.7 0.5 0.6Nuclear 80 179 227 243 229 208 183 8.4 9.9 7.9 1.2 -0.4 -1.1 -0.8Hydro 46 49 53 54 61 62 62 2.3 2.2 2.7 0.4 0.8 0.1 0.4Geothermal 4.6 14 13 9.0 21 26 31 0.7 0.4 1.3 -1.8 5.8 1.9 3.6Solar, wind, etc. - 0.3 2.1 25 63 89 124 0.0 1.0 5.4 19.0 6.4 3.4 4.7Biomass and waste 62 73 87 113 132 138 144 3.4 4.6 6.2 1.7 1.1 0.4 0.7
Final energy consumptionMtoe Shares (%) 1990/ 2015/ 2030/ 2015/
1980 1990 2000 2015 2030 2040 2050 1990 2015 2050 2015 2030 2050 2050
Total 1,466 1,455 1,738 1,714 1,711 1,701 1,669 100 100 100 0.7 0.0 -0.1 -0.1Industry 437 331 388 304 305 305 299 23 18 18 -0.3 0.0 -0.1 -0.1Transport 470 531 640 690 640 609 584 36 40 35 1.1 -0.5 -0.5 -0.5Buildings, etc. 446 460 537 574 607 621 623 32 34 37 0.9 0.4 0.1 0.2Non-energy use 114 134 173 145 160 166 164 9.2 8.4 9.8 0.3 0.7 0.1 0.4Coal 60 59 36 22 19 17 15 4.0 1.3 0.9 -3.9 -1.0 -1.3 -1.2Oil 769 752 874 847 776 727 676 52 49 41 0.5 -0.6 -0.7 -0.6Natural gas 374 346 413 380 403 410 406 24 22 24 0.4 0.4 0.0 0.2Electricity 200 262 342 368 413 446 471 18 21 28 1.4 0.8 0.7 0.7Heat 1.0 2.8 6.1 6.1 6.7 7.0 7.1 0.2 0.4 0.4 3.2 0.6 0.3 0.4Hydrogen - - - - 0.1 0.1 0.1 - - 0.0 n.a. n.a. 1.4 n.a.Renewables 62 33 66 90 94 94 94 2.3 5.2 5.6 4.1 0.3 0.0 0.1
Electricity generation(TWh) Shares (%) 1990/ 2015/ 2030/ 2015/
1980 1990 2000 2015 2030 2040 2050 1990 2015 2050 2015 2030 2050 2050
Total 2,801 3,685 4,631 4,968 5,538 5,929 6,218 100 100 100 1.2 0.7 0.6 0.6Coal 1,303 1,782 2,247 1,537 1,189 982 708 48 31 11 -0.6 -1.7 -2.6 -2.2Oil 277 147 133 47 32 25 14 4.0 0.9 0.2 -4.5 -2.4 -4.1 -3.4Natural gas 380 391 668 1,440 1,888 2,296 2,615 11 29 42 5.3 1.8 1.6 1.7Nuclear 304 685 871 932 879 799 701 19 19 11 1.2 -0.4 -1.1 -0.8Hydro 530 570 612 632 712 721 725 15 13 12 0.4 0.8 0.1 0.4Geothermal 5.4 16 15 19 44 56 65 0.4 0.4 1.1 0.6 5.9 2.0 3.6Solar PV - 0.0 0.2 35 119 163 226 0.0 0.7 3.6 45.4 8.5 3.3 5.5Wind - 3.1 5.9 219 443 574 739 0.1 4.4 12 18.6 4.8 2.6 3.5CSP and marine - 0.7 0.6 14 67 116 192 0.0 0.3 3.1 12.9 10.8 5.4 7.7Biomass and waste 1.8 90 80 93 164 199 231 2.5 1.9 3.7 0.1 3.9 1.7 2.6Hydrogen - - - - - - - - - - n.a. n.a. n.a. n.a.
Energy and economic indicators1990/ 2015/ 2030/ 2015/
1980 1990 2000 2015 2030 2040 2050 2015 2030 2050 2050
GDP ($2010 billion) 7,310 10,078 14,056 18,394 25,027 30,559 36,274 2.4 2.1 1.9 2.0Population (million) 252 277 313 357 397 419 436 1.0 0.7 0.5 0.6CO2 emissions (Mt) 5,170 5,236 6,126 5,574 5,066 4,786 4,438 0.3 -0.6 -0.7 -0.6GDP per capita ($2010 thousand) 29 36 45 51 63 73 83 1.4 1.4 1.4 1.4Primary energy consump. per capita (toe) 7.9 7.7 8.1 6.9 6.1 5.7 5.3 -0.4 -0.8 -0.7 -0.7Primary energy consumption per GDP*2 273 211 180 134 97 78 64 -1.8 -2.1 -2.1 -2.1CO2 emissions per GDP*3 707 520 436 303 202 157 122 -2.1 -2.7 -2.5 -2.6CO2 per primary energy consumption*4 2.6 2.5 2.4 2.3 2.1 2.0 1.9 -0.3 -0.5 -0.4 -0.5*1 Trade of electricity, heat and hydrogen are not shown, *2 toe/$2010 million,*3 t/$2010 million, *4 t/toe
IEEJ:October 2017 © IEEJ2017
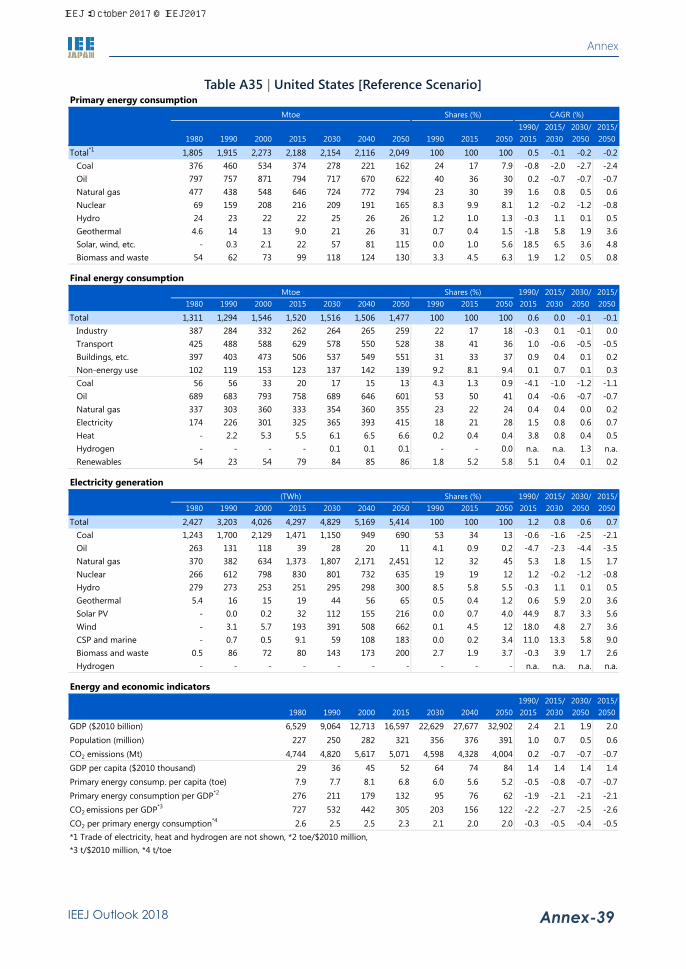
Annex
IEEJ Outlook 2018 Annex-39
Table A35 | United States [Reference Scenario] Primary energy consumption
Mtoe Shares (%) CAGR (%)1990/ 2015/ 2030/ 2015/
1980 1990 2000 2015 2030 2040 2050 1990 2015 2050 2015 2030 2050 2050
Total*1 1,805 1,915 2,273 2,188 2,154 2,116 2,049 100 100 100 0.5 -0.1 -0.2 -0.2Coal 376 460 534 374 278 221 162 24 17 7.9 -0.8 -2.0 -2.7 -2.4Oil 797 757 871 794 717 670 622 40 36 30 0.2 -0.7 -0.7 -0.7Natural gas 477 438 548 646 724 772 794 23 30 39 1.6 0.8 0.5 0.6Nuclear 69 159 208 216 209 191 165 8.3 9.9 8.1 1.2 -0.2 -1.2 -0.8Hydro 24 23 22 22 25 26 26 1.2 1.0 1.3 -0.3 1.1 0.1 0.5Geothermal 4.6 14 13 9.0 21 26 31 0.7 0.4 1.5 -1.8 5.8 1.9 3.6Solar, wind, etc. - 0.3 2.1 22 57 81 115 0.0 1.0 5.6 18.5 6.5 3.6 4.8Biomass and waste 54 62 73 99 118 124 130 3.3 4.5 6.3 1.9 1.2 0.5 0.8
Final energy consumptionMtoe Shares (%) 1990/ 2015/ 2030/ 2015/
1980 1990 2000 2015 2030 2040 2050 1990 2015 2050 2015 2030 2050 2050
Total 1,311 1,294 1,546 1,520 1,516 1,506 1,477 100 100 100 0.6 0.0 -0.1 -0.1Industry 387 284 332 262 264 265 259 22 17 18 -0.3 0.1 -0.1 0.0Transport 425 488 588 629 578 550 528 38 41 36 1.0 -0.6 -0.5 -0.5Buildings, etc. 397 403 473 506 537 549 551 31 33 37 0.9 0.4 0.1 0.2Non-energy use 102 119 153 123 137 142 139 9.2 8.1 9.4 0.1 0.7 0.1 0.3Coal 56 56 33 20 17 15 13 4.3 1.3 0.9 -4.1 -1.0 -1.2 -1.1Oil 689 683 793 758 689 646 601 53 50 41 0.4 -0.6 -0.7 -0.7Natural gas 337 303 360 333 354 360 355 23 22 24 0.4 0.4 0.0 0.2Electricity 174 226 301 325 365 393 415 18 21 28 1.5 0.8 0.6 0.7Heat - 2.2 5.3 5.5 6.1 6.5 6.6 0.2 0.4 0.4 3.8 0.8 0.4 0.5Hydrogen - - - - 0.1 0.1 0.1 - - 0.0 n.a. n.a. 1.3 n.a.Renewables 54 23 54 79 84 85 86 1.8 5.2 5.8 5.1 0.4 0.1 0.2
Electricity generation(TWh) Shares (%) 1990/ 2015/ 2030/ 2015/
1980 1990 2000 2015 2030 2040 2050 1990 2015 2050 2015 2030 2050 2050
Total 2,427 3,203 4,026 4,297 4,829 5,169 5,414 100 100 100 1.2 0.8 0.6 0.7Coal 1,243 1,700 2,129 1,471 1,150 949 690 53 34 13 -0.6 -1.6 -2.5 -2.1Oil 263 131 118 39 28 20 11 4.1 0.9 0.2 -4.7 -2.3 -4.4 -3.5Natural gas 370 382 634 1,373 1,807 2,171 2,451 12 32 45 5.3 1.8 1.5 1.7Nuclear 266 612 798 830 801 732 635 19 19 12 1.2 -0.2 -1.2 -0.8Hydro 279 273 253 251 295 298 300 8.5 5.8 5.5 -0.3 1.1 0.1 0.5Geothermal 5.4 16 15 19 44 56 65 0.5 0.4 1.2 0.6 5.9 2.0 3.6Solar PV - 0.0 0.2 32 112 155 216 0.0 0.7 4.0 44.9 8.7 3.3 5.6Wind - 3.1 5.7 193 391 508 662 0.1 4.5 12 18.0 4.8 2.7 3.6CSP and marine - 0.7 0.5 9.1 59 108 183 0.0 0.2 3.4 11.0 13.3 5.8 9.0Biomass and waste 0.5 86 72 80 143 173 200 2.7 1.9 3.7 -0.3 3.9 1.7 2.6Hydrogen - - - - - - - - - - n.a. n.a. n.a. n.a.
Energy and economic indicators1990/ 2015/ 2030/ 2015/
1980 1990 2000 2015 2030 2040 2050 2015 2030 2050 2050
GDP ($2010 billion) 6,529 9,064 12,713 16,597 22,629 27,677 32,902 2.4 2.1 1.9 2.0Population (million) 227 250 282 321 356 376 391 1.0 0.7 0.5 0.6CO2 emissions (Mt) 4,744 4,820 5,617 5,071 4,598 4,328 4,004 0.2 -0.7 -0.7 -0.7GDP per capita ($2010 thousand) 29 36 45 52 64 74 84 1.4 1.4 1.4 1.4Primary energy consump. per capita (toe) 7.9 7.7 8.1 6.8 6.0 5.6 5.2 -0.5 -0.8 -0.7 -0.7Primary energy consumption per GDP*2 276 211 179 132 95 76 62 -1.9 -2.1 -2.1 -2.1CO2 emissions per GDP*3 727 532 442 305 203 156 122 -2.2 -2.7 -2.5 -2.6CO2 per primary energy consumption*4 2.6 2.5 2.5 2.3 2.1 2.0 2.0 -0.3 -0.5 -0.4 -0.5*1 Trade of electricity, heat and hydrogen are not shown, *2 toe/$2010 million,*3 t/$2010 million, *4 t/toe
IEEJ:October 2017 © IEEJ2017

Annex
IEEJ Outlook 2018 Annex-40
Table A36 | Latin America [Reference Scenario] Primary energy consumption
Mtoe Shares (%) CAGR (%)1990/ 2015/ 2030/ 2015/
1980 1990 2000 2015 2030 2040 2050 1990 2015 2050 2015 2030 2050 2050
Total*1 382 465 600 851 1,092 1,264 1,378 100 100 100 2.5 1.7 1.2 1.4Coal 13 21 27 47 59 68 72 4.5 5.6 5.3 3.3 1.4 1.1 1.2Oil 223 238 303 377 449 487 491 51 44 36 1.9 1.2 0.4 0.8Natural gas 48 72 119 207 281 364 437 16 24 32 4.3 2.1 2.2 2.2Nuclear 0.6 3.2 5.3 8.7 26 28 28 0.7 1.0 2.1 4.0 7.6 0.4 3.4Hydro 19 33 50 60 77 82 88 7.2 7.1 6.4 2.4 1.7 0.7 1.1Geothermal 1.2 5.1 6.3 6.5 19 27 35 1.1 0.8 2.6 1.0 7.3 3.2 4.9Solar, wind, etc. - 0.0 0.2 4.6 13 22 32 0.0 0.5 2.3 25.0 7.2 4.5 5.7Biomass and waste 78 92 89 139 167 184 193 20 16 14 1.7 1.2 0.7 0.9
Final energy consumptionMtoe Shares (%) 1990/ 2015/ 2030/ 2015/
1980 1990 2000 2015 2030 2040 2050 1990 2015 2050 2015 2030 2050 2050
Total 288 343 447 610 773 891 975 100 100 100 2.3 1.6 1.2 1.3Industry 98 114 148 191 229 274 310 33 31 32 2.1 1.2 1.5 1.4Transport 85 103 140 222 284 316 332 30 36 34 3.1 1.7 0.8 1.2Buildings, etc. 89 101 120 160 212 246 272 29 26 28 1.9 1.9 1.3 1.5Non-energy use 16 26 38 38 48 55 61 7.5 6.3 6.3 1.6 1.5 1.2 1.3Coal 6.1 7.8 11 15 18 21 21 2.3 2.5 2.2 2.7 1.2 0.8 0.9Oil 159 179 240 304 374 414 432 52 50 44 2.1 1.4 0.7 1.0Natural gas 27 38 53 78 100 120 137 11 13 14 3.0 1.7 1.6 1.6Electricity 27 44 69 111 163 209 251 13 18 26 3.7 2.6 2.2 2.4Heat - - - - - - - - - - n.a. n.a. n.a. n.a.Hydrogen - - - - 0.1 0.1 0.1 - - 0.0 n.a. n.a. 3.5 n.a.Renewables 69 74 74 102 118 128 133 22 17 14 1.3 0.9 0.6 0.7
Electricity generation(TWh) Shares (%) 1990/ 2015/ 2030/ 2015/
1980 1990 2000 2015 2030 2040 2050 1990 2015 2050 2015 2030 2050 2050
Total 380 623 1,009 1,598 2,314 2,906 3,426 100 100 100 3.8 2.5 2.0 2.2Coal 7.8 23 43 106 148 190 215 3.8 6.7 6.3 6.2 2.2 1.9 2.0Oil 111 128 198 198 183 168 102 21 12 3.0 1.8 -0.5 -2.9 -1.9Natural gas 35 60 141 436 702 1,063 1,406 9.6 27 41 8.3 3.2 3.5 3.4Nuclear 2.3 12 20 33 101 109 109 2.0 2.1 3.2 4.0 7.6 0.4 3.4Hydro 218 386 584 701 899 959 1,027 62 44 30 2.4 1.7 0.7 1.1Geothermal 1.4 5.9 7.8 10 29 44 58 1.0 0.6 1.7 2.2 7.3 3.5 5.1Solar PV - 0.0 0.0 2.5 14 27 49 0.0 0.2 1.4 36.8 12.3 6.3 8.8Wind - 0.0 0.2 40 120 200 292 0.0 2.5 8.5 52.8 7.6 4.6 5.8CSP and marine - - - - - - - - - - n.a. n.a. n.a. n.a.Biomass and waste 3.9 7.6 14 69 118 146 167 1.2 4.3 4.9 9.3 3.6 1.7 2.5Hydrogen - - - - - - - - - - n.a. n.a. n.a. n.a.
Energy and economic indicators1990/ 2015/ 2030/ 2015/
1980 1990 2000 2015 2030 2040 2050 2015 2030 2050 2050
GDP ($2010 billion) 2,404 2,779 3,767 5,779 8,545 11,704 14,903 3.0 2.6 2.8 2.7Population (million) 361 442 522 629 715 754 777 1.4 0.9 0.4 0.6CO2 emissions (Mt) 801 909 1,206 1,724 2,137 2,469 2,651 2.6 1.4 1.1 1.2GDP per capita ($2010 thousand) 6.7 6.3 7.2 9.2 12 16 19 1.5 1.8 2.4 2.1Primary energy consump. per capita (toe) 1.1 1.1 1.2 1.4 1.5 1.7 1.8 1.0 0.8 0.8 0.8Primary energy consumption per GDP*2 159 167 159 147 128 108 92 -0.5 -0.9 -1.6 -1.3CO2 emissions per GDP*3 333 327 320 298 250 211 178 -0.4 -1.2 -1.7 -1.5CO2 per primary energy consumption*4 2.1 2.0 2.0 2.0 2.0 2.0 1.9 0.1 -0.2 -0.1 -0.1*1 Trade of electricity, heat and hydrogen are not shown, *2 toe/$2010 million,*3 t/$2010 million, *4 t/toe
IEEJ:October 2017 © IEEJ2017

Annex
IEEJ Outlook 2018 Annex-41
Table A37 | OECD Europe [Reference Scenario] Primary energy consumption
Mtoe Shares (%) CAGR (%)1990/ 2015/ 2030/ 2015/
1980 1990 2000 2015 2030 2040 2050 1990 2015 2050 2015 2030 2050 2050
Total*1 1,494 1,629 1,752 1,706 1,658 1,606 1,561 100 100 100 0.2 -0.2 -0.3 -0.3Coal 464 449 331 285 226 186 154 28 17 9.9 -1.8 -1.5 -1.9 -1.7Oil 688 611 653 554 484 433 387 38 32 25 -0.4 -0.9 -1.1 -1.0Natural gas 206 262 394 389 425 431 426 16 23 27 1.6 0.6 0.0 0.3Nuclear 60 205 245 222 203 206 216 13 13 14 0.3 -0.6 0.3 -0.1Hydro 36 39 47 49 51 52 54 2.4 2.9 3.4 0.9 0.3 0.2 0.3Geothermal 3.0 4.9 7.2 15 21 24 26 0.3 0.9 1.7 4.6 2.2 1.1 1.6Solar, wind, etc. 0.1 0.3 2.7 40 77 100 121 0.0 2.4 7.7 21.1 4.4 2.3 3.2Biomass and waste 36 55 72 149 168 173 176 3.4 8.7 11 4.0 0.8 0.2 0.5
Final energy consumptionMtoe Shares (%) 1990/ 2015/ 2030/ 2015/
1980 1990 2000 2015 2030 2040 2050 1990 2015 2050 2015 2030 2050 2050
Total 1,081 1,134 1,233 1,202 1,188 1,157 1,123 100 100 100 0.2 -0.1 -0.3 -0.2Industry 356 328 326 280 279 276 271 29 23 24 -0.6 0.0 -0.1 -0.1Transport 209 267 317 335 293 264 241 24 28 21 0.9 -0.9 -1.0 -0.9Buildings, etc. 425 438 475 485 509 508 501 39 40 45 0.4 0.3 -0.1 0.1Non-energy use 90 101 115 103 108 109 109 8.9 8.6 9.8 0.1 0.3 0.1 0.2Coal 156 125 63 46 43 41 38 11 3.9 3.4 -3.9 -0.4 -0.7 -0.6Oil 551 524 572 501 437 390 347 46 42 31 -0.2 -0.9 -1.1 -1.0Natural gas 161 203 268 255 267 267 265 18 21 24 0.9 0.3 0.0 0.1Electricity 147 192 233 261 289 306 319 17 22 28 1.2 0.7 0.5 0.6Heat 35 43 41 47 48 47 47 3.8 3.9 4.2 0.3 0.2 -0.1 0.0Hydrogen - - - - 0.0 0.1 0.1 - - 0.0 n.a. n.a. 2.7 n.a.Renewables 31 47 55 92 103 106 107 4.2 7.6 9.6 2.7 0.8 0.2 0.5
Electricity generation(TWh) Shares (%) 1990/ 2015/ 2030/ 2015/
1980 1990 2000 2015 2030 2040 2050 1990 2015 2050 2015 2030 2050 2050
Total 2,049 2,668 3,227 3,559 3,913 4,099 4,231 100 100 100 1.2 0.6 0.4 0.5Coal 887 1,030 968 859 731 603 482 39 24 11 -0.7 -1.1 -2.1 -1.6Oil 364 206 179 57 40 28 17 7.7 1.6 0.4 -5.0 -2.3 -4.3 -3.4Natural gas 138 169 513 585 731 780 785 6.3 16 19 5.1 1.5 0.4 0.8Nuclear 230 787 939 853 781 791 829 29 24 20 0.3 -0.6 0.3 -0.1Hydro 416 451 549 569 596 610 623 17 16 15 0.9 0.3 0.2 0.3Geothermal 2.7 3.6 6.2 15 22 26 29 0.1 0.4 0.7 5.9 2.7 1.3 1.9Solar PV - 0.0 0.1 100 176 220 267 0.0 2.8 6.3 43.0 3.8 2.1 2.9Wind 0.0 0.8 22 306 527 684 802 0.0 8.6 19 27.0 3.7 2.1 2.8CSP and marine 0.5 0.7 1.6 9.9 36 51 70 0.0 0.3 1.6 10.9 9.0 3.4 5.7Biomass and waste 11 21 48 204 273 305 325 0.8 5.7 7.7 9.6 2.0 0.9 1.3Hydrogen - - - - - - - - - - n.a. n.a. n.a. n.a.
Energy and economic indicators1990/ 2015/ 2030/ 2015/
1980 1990 2000 2015 2030 2040 2050 2015 2030 2050 2050
GDP ($2010 billion) 9,940 12,666 15,889 19,517 24,815 28,286 31,565 1.7 1.6 1.2 1.4Population (million) 479 502 524 566 586 591 589 0.5 0.2 0.0 0.1CO2 emissions (Mt) 4,165 3,971 3,897 3,436 3,057 2,752 2,471 -0.6 -0.8 -1.1 -0.9GDP per capita ($2010 thousand) 21 25 30 34 42 48 54 1.3 1.4 1.2 1.3Primary energy consump. per capita (toe) 3.1 3.2 3.3 3.0 2.8 2.7 2.6 -0.3 -0.4 -0.3 -0.4Primary energy consumption per GDP*2 150 129 110 87 67 57 49 -1.5 -1.8 -1.5 -1.6CO2 emissions per GDP*3 419 313 245 176 123 97 78 -2.3 -2.4 -2.2 -2.3CO2 per primary energy consumption*4 2.8 2.4 2.2 2.0 1.8 1.7 1.6 -0.8 -0.6 -0.8 -0.7*1 Trade of electricity, heat and hydrogen are not shown, *2 toe/$2010 million,*3 t/$2010 million, *4 t/toe
IEEJ:October 2017 © IEEJ2017

Annex
IEEJ Outlook 2018 Annex-42
Table A38 | Non-OECD Europe [Reference Scenario] Primary energy consumption
Mtoe Shares (%) CAGR (%)1990/ 2015/ 2030/ 2015/
1980 1990 2000 2015 2030 2040 2050 1990 2015 2050 2015 2030 2050 2050
Total*1 1,241 1,530 1,000 1,106 1,216 1,322 1,451 100 100 100 -1.3 0.6 0.9 0.8Coal 362 367 209 211 185 183 183 24 19 13 -2.2 -0.9 -0.1 -0.4Oil 464 465 201 238 247 271 301 30 21 21 -2.6 0.3 1.0 0.7Natural gas 355 600 487 526 598 676 751 39 48 52 -0.5 0.9 1.1 1.0Nuclear 21 59 64 82 118 112 121 3.9 7.4 8.3 1.3 2.5 0.1 1.1Hydro 20 23 23 25 28 29 30 1.5 2.2 2.1 0.4 0.9 0.3 0.5Geothermal - 0.0 0.1 0.2 0.6 0.6 0.7 0.0 0.0 0.0 9.3 6.4 1.0 3.3Solar, wind, etc. - - 0.0 1.5 4.8 8.7 14 - 0.1 0.9 n.a. 7.9 5.3 6.4Biomass and waste 21 17 16 23 35 42 52 1.1 2.1 3.6 1.3 2.7 2.0 2.3
Final energy consumptionMtoe Shares (%) 1990/ 2015/ 2030/ 2015/
1980 1990 2000 2015 2030 2040 2050 1990 2015 2050 2015 2030 2050 2050
Total 869 1,067 651 701 768 836 918 100 100 100 -1.7 0.6 0.9 0.8Industry 394 394 205 191 214 243 275 37 27 30 -2.9 0.8 1.3 1.0Transport 107 171 110 143 147 153 162 16 20 18 -0.7 0.2 0.5 0.3Buildings, etc. 301 436 287 274 291 298 307 41 39 33 -1.8 0.4 0.3 0.3Non-energy use 67 66 49 93 115 142 174 6.2 13 19 1.4 1.5 2.1 1.8Coal 152 113 36 34 33 34 34 11 4.9 3.7 -4.7 -0.1 0.1 0.0Oil 310 278 145 203 217 238 264 26 29 29 -1.2 0.4 1.0 0.7Natural gas 215 260 200 213 241 264 289 24 30 32 -0.8 0.8 0.9 0.9Electricity 95 126 87 105 131 157 186 12 15 20 -0.7 1.5 1.8 1.7Heat 78 276 171 129 128 128 130 26 18 14 -3.0 -0.1 0.1 0.0Hydrogen - - - - 0.0 0.0 0.0 - - 0.0 n.a. n.a. 3.3 n.a.Renewables 21 13 11 16 17 16 16 1.2 2.3 1.7 0.9 0.3 -0.5 -0.1
Electricity generation(TWh) Shares (%) 1990/ 2015/ 2030/ 2015/
1980 1990 2000 2015 2030 2040 2050 1990 2015 2050 2015 2030 2050 2050
Total 1,461 1,888 1,428 1,738 2,083 2,383 2,713 100 100 100 -0.3 1.2 1.3 1.3Coal 471 429 338 386 412 461 483 23 22 18 -0.4 0.4 0.8 0.6Oil 357 256 70 21 18 18 15 14 1.2 0.6 -9.5 -0.9 -1.0 -1.0Natural gas 295 714 503 706 787 984 1,170 38 41 43 0.0 0.7 2.0 1.5Nuclear 79 226 242 313 453 431 464 12 18 17 1.3 2.5 0.1 1.1Hydro 232 262 272 289 329 340 347 14 17 13 0.4 0.9 0.3 0.5Geothermal - 0.0 0.1 0.5 1.8 2.1 2.2 0.0 0.0 0.1 11.8 9.5 1.1 4.6Solar PV - - - 4.6 16 28 43 - 0.3 1.6 n.a. 8.8 5.0 6.6Wind - - 0.0 12 38 70 113 - 0.7 4.2 n.a. 8.1 5.6 6.6CSP and marine - - - - 0.0 0.0 0.1 - - 0.0 n.a. n.a. 12.7 n.a.Biomass and waste 27 0.0 2.6 5.0 26 47 75 0.0 0.3 2.8 20.4 11.5 5.5 8.0Hydrogen - - - - - - - - - - n.a. n.a. n.a. n.a.
Energy and economic indicators1990/ 2015/ 2030/ 2015/
1980 1990 2000 2015 2030 2040 2050 2015 2030 2050 2050
GDP ($2010 billion) 1,748 2,142 1,496 2,658 3,862 5,106 6,671 0.9 2.5 2.8 2.7Population (million) 317 341 339 341 344 341 337 0.0 0.1 -0.1 0.0CO2 emissions (Mt) 3,497 4,104 2,455 2,543 2,577 2,749 2,928 -1.9 0.1 0.6 0.4GDP per capita ($2010 thousand) 5.5 6.3 4.4 7.8 11 15 20 0.9 2.5 2.9 2.7Primary energy consump. per capita (toe) 3.9 4.5 3.0 3.2 3.5 3.9 4.3 -1.3 0.6 1.0 0.8Primary energy consumption per GDP*2 710 714 668 416 315 259 217 -2.1 -1.8 -1.8 -1.8CO2 emissions per GDP*3 2,000 1,916 1,641 957 667 538 439 -2.7 -2.4 -2.1 -2.2CO2 per primary energy consumption*4 2.8 2.7 2.5 2.3 2.1 2.1 2.0 -0.6 -0.5 -0.2 -0.4*1 Trade of electricity, heat and hydrogen are not shown, *2 toe/$2010 million,*3 t/$2010 million, *4 t/toe
IEEJ:October 2017 © IEEJ2017

Annex
IEEJ Outlook 2018 Annex-43
Table A39 | European Union [Reference Scenario] Primary energy consumption
Mtoe Shares (%) CAGR (%)1990/ 2015/ 2030/ 2015/
1980 1990 2000 2015 2030 2040 2050 1990 2015 2050 2015 2030 2050 2050
Total*1 n.a. 1,647 1,695 1,586 1,545 1,499 1,458 100 100 100 -0.1 -0.2 -0.3 -0.2Coal n.a. 455 321 263 210 173 144 28 17 9.9 -2.2 -1.5 -1.9 -1.7Oil n.a. 608 625 516 450 401 357 37 33 24 -0.7 -0.9 -1.2 -1.0Natural gas n.a. 297 396 358 393 400 397 18 23 27 0.7 0.6 0.0 0.3Nuclear n.a. 207 246 223 204 206 216 13 14 15 0.3 -0.6 0.3 -0.1Hydro n.a. 25 31 29 31 31 32 1.5 1.8 2.2 0.6 0.3 0.2 0.2Geothermal n.a. 3.2 4.6 6.5 8.3 9.1 9.9 0.2 0.4 0.7 2.9 1.7 0.9 1.2Solar, wind, etc. n.a. 0.3 2.4 39 76 99 120 0.0 2.5 8.2 21.5 4.5 2.3 3.3Biomass and waste n.a. 48 67 149 171 176 180 2.9 9.4 12 4.7 0.9 0.2 0.5
Final energy consumptionMtoe Shares (%) 1990/ 2015/ 2030/ 2015/
1980 1990 2000 2015 2030 2040 2050 1990 2015 2050 2015 2030 2050 2050
Total n.a. 1,136 1,180 1,114 1,168 1,138 1,106 100 100 100 -0.1 0.3 -0.3 0.0Industry n.a. 347 309 254 279 279 278 31 23 25 -1.2 0.6 0.0 0.3Transport n.a. 259 303 312 273 245 223 23 28 20 0.8 -0.9 -1.0 -1.0Buildings, etc. n.a. 430 454 450 515 511 501 38 40 45 0.2 0.9 -0.1 0.3Non-energy use n.a. 100 113 97 101 103 103 8.8 8.7 9.3 -0.1 0.3 0.1 0.2Coal n.a. 122 52 36 33 31 29 11 3.2 2.6 -4.8 -0.5 -0.7 -0.6Oil n.a. 506 543 465 405 360 320 45 42 29 -0.3 -0.9 -1.2 -1.1Natural gas n.a. 227 272 241 253 253 251 20 22 23 0.2 0.3 0.0 0.1Electricity n.a. 186 217 236 263 279 292 16 21 26 1.0 0.7 0.5 0.6Heat n.a. 55 45 46 111 110 109 4.9 4.1 9.9 -0.7 6.1 -0.1 2.5Hydrogen n.a. - - - 0.0 0.1 0.1 - - 0.0 n.a. n.a. 2.7 n.a.Renewables n.a. 40 50 90 103 104 105 3.5 8.1 9.5 3.3 0.8 0.1 0.4
Electricity generation(TWh) Shares (%) 1990/ 2015/ 2030/ 2015/
1980 1990 2000 2015 2030 2040 2050 1990 2015 2050 2015 2030 2050 2050
Total n.a. 2,577 3,006 3,204 3,571 3,774 3,935 100 100 100 0.9 0.7 0.5 0.6Coal n.a. 1,050 968 826 716 597 483 41 26 12 -1.0 -0.9 -2.0 -1.5Oil n.a. 224 181 61 45 32 20 8.7 1.9 0.5 -5.1 -2.1 -4.0 -3.2Natural gas n.a. 193 480 497 633 684 697 7.5 15 18 3.9 1.6 0.5 1.0Nuclear n.a. 795 945 857 782 792 829 31 27 21 0.3 -0.6 0.3 -0.1Hydro n.a. 290 357 341 358 365 372 11 11 9.5 0.6 0.3 0.2 0.2Geothermal n.a. 3.2 4.8 6.5 8.5 9.5 10 0.1 0.2 0.3 2.9 1.8 0.9 1.3Solar PV n.a. 0.0 0.1 102 185 236 290 0.0 3.2 7.4 43.6 4.0 2.3 3.0Wind n.a. 0.8 22 302 529 689 809 0.0 9.4 21 26.9 3.8 2.1 2.9CSP and marine n.a. 0.7 1.6 9.5 35 53 79 0.0 0.3 2.0 11.1 9.0 4.2 6.3Biomass and waste n.a. 20 46 201 275 313 343 0.8 6.3 8.7 9.8 2.1 1.1 1.5Hydrogen n.a. - - - - - - - - - n.a. n.a. n.a. n.a.
Energy and economic indicators1990/ 2015/ 2030/ 2015/
1980 1990 2000 2015 2030 2040 2050 2015 2030 2050 2050
GDP ($2010 billion) n.a. 11,888 14,768 17,885 22,762 26,005 29,079 1.6 1.6 1.2 1.4Population (million) n.a. 478 488 510 524 526 523 0.3 0.2 0.0 0.1CO2 emissions (Mt) n.a. 4,068 3,783 3,176 2,835 2,552 2,292 -1.0 -0.8 -1.1 -0.9GDP per capita ($2010 thousand) n.a. 25 30 35 43 49 56 1.4 1.4 1.2 1.3Primary energy consump. per capita (toe) n.a. 3.4 3.5 3.1 3.0 2.8 2.8 -0.4 -0.4 -0.3 -0.3Primary energy consumption per GDP*2 n.a. 139 115 89 68 58 50 -1.8 -1.8 -1.5 -1.6CO2 emissions per GDP*3 n.a. 342 256 178 125 98 79 -2.6 -2.3 -2.3 -2.3CO2 per primary energy consumption*4 n.a. 2.5 2.2 2.0 1.8 1.7 1.6 -0.8 -0.6 -0.8 -0.7*1 Trade of electricity, heat and hydrogen are not shown, *2 toe/$2010 million,*3 t/$2010 million, *4 t/toe
IEEJ:October 2017 © IEEJ2017

Annex
IEEJ Outlook 2018 Annex-44
Table A40 | Africa [Reference Scenario] Primary energy consumption
Mtoe Shares (%) CAGR (%)1990/ 2015/ 2030/ 2015/
1980 1990 2000 2015 2030 2040 2050 1990 2015 2050 2015 2030 2050 2050
Total*1 273 393 496 788 1,086 1,349 1,635 100 100 100 2.8 2.2 2.1 2.1Coal 52 74 90 107 122 134 150 19 14 9.2 1.5 0.8 1.1 1.0Oil 61 86 97 176 252 340 458 22 22 28 2.9 2.4 3.0 2.8Natural gas 12 30 47 108 183 253 359 7.5 14 22 5.3 3.6 3.4 3.5Nuclear - 2.2 3.4 3.2 8.6 19 24 0.6 0.4 1.5 1.5 6.9 5.2 5.9Hydro 4.1 4.8 6.4 10 19 29 39 1.2 1.3 2.4 3.1 4.1 3.7 3.9Geothermal - 0.3 0.4 3.9 16 23 29 0.1 0.5 1.7 11.0 9.7 3.1 5.9Solar, wind, etc. - 0.0 0.0 1.0 8.6 18 29 0.0 0.1 1.8 35.7 15.2 6.3 10.0Biomass and waste 143 196 250 377 478 532 547 50 48 33 2.7 1.6 0.7 1.1
Final energy consumptionMtoe Shares (%) 1990/ 2015/ 2030/ 2015/
1980 1990 2000 2015 2030 2040 2050 1990 2015 2050 2015 2030 2050 2050
Total 218 292 369 573 804 1,005 1,216 100 100 100 2.7 2.3 2.1 2.2Industry 46 55 58 87 126 173 222 19 15 18 1.9 2.5 2.9 2.7Transport 27 38 54 105 149 196 247 13 18 20 4.2 2.4 2.6 2.5Buildings, etc. 139 188 242 362 499 595 695 64 63 57 2.7 2.2 1.7 1.9Non-energy use 5.4 11 15 18 29 40 53 3.8 3.2 4.4 2.0 3.1 3.0 3.1Coal 22 20 19 20 24 29 32 6.7 3.5 2.6 0.1 1.3 1.4 1.3Oil 54 71 89 154 226 305 409 24 27 34 3.2 2.6 3.0 2.8Natural gas 2.8 8.6 14 34 56 78 101 2.9 5.9 8.3 5.6 3.5 3.0 3.2Electricity 14 22 31 53 88 130 197 7.6 9.3 16 3.6 3.4 4.2 3.8Heat - - - - - - - - - - n.a. n.a. n.a. n.a.Hydrogen - - - - 0.0 0.0 0.0 - - 0.0 n.a. n.a. 5.5 n.a.Renewables 126 171 216 312 410 463 477 59 54 39 2.4 1.8 0.8 1.2
Electricity generation(TWh) Shares (%) 1990/ 2015/ 2030/ 2015/
1980 1990 2000 2015 2030 2040 2050 1990 2015 2050 2015 2030 2050 2050
Total 184 316 442 781 1,266 1,832 2,717 100 100 100 3.7 3.3 3.9 3.6Coal 100 165 209 257 321 373 446 52 33 16 1.8 1.5 1.7 1.6Oil 22 41 51 88 116 152 206 13 11 7.6 3.1 1.9 2.9 2.5Natural gas 14 45 92 285 489 741 1,268 14 37 47 7.7 3.7 4.9 4.4Nuclear - 8.4 13 12 33 73 91 2.7 1.6 3.4 1.5 6.9 5.2 5.9Hydro 47 56 75 121 220 336 455 18 15 17 3.1 4.1 3.7 3.9Geothermal - 0.3 0.4 4.5 18 26 33 0.1 0.6 1.2 11.0 9.7 3.1 5.9Solar PV - - 0.0 2.6 18 36 64 - 0.3 2.3 n.a. 13.6 6.6 9.6Wind - - 0.2 7.5 22 39 72 - 1.0 2.6 n.a. 7.3 6.2 6.7CSP and marine - - - 0.0 19 42 66 - 0.0 2.4 n.a. 71.2 6.4 30.5Biomass and waste 0.2 0.5 1.1 1.9 7.7 11 14 0.1 0.2 0.5 5.9 9.7 3.1 5.9Hydrogen - - - - - - - - - - n.a. n.a. n.a. n.a.
Energy and economic indicators1990/ 2015/ 2030/ 2015/
1980 1990 2000 2015 2030 2040 2050 2015 2030 2050 2050
GDP ($2010 billion) 717 876 1,145 2,261 4,224 6,841 10,197 3.9 4.3 4.5 4.4Population (million) 477 631 813 1,185 1,691 2,085 2,509 2.6 2.4 2.0 2.2CO2 emissions (Mt) 403 593 718 1,168 1,605 2,064 2,705 2.7 2.1 2.6 2.4GDP per capita ($2010 thousand) 1.5 1.4 1.4 1.9 2.5 3.3 4.1 1.3 1.8 2.5 2.2Primary energy consump. per capita (toe) 0.6 0.6 0.6 0.7 0.6 0.6 0.7 0.3 -0.2 0.1 -0.1Primary energy consumption per GDP*2 381 449 433 348 257 197 160 -1.0 -2.0 -2.3 -2.2CO2 emissions per GDP*3 563 677 627 516 380 302 265 -1.1 -2.0 -1.8 -1.9CO2 per primary energy consumption*4 1.5 1.5 1.4 1.5 1.5 1.5 1.7 -0.1 0.0 0.6 0.3*1 Trade of electricity, heat and hydrogen are not shown, *2 toe/$2010 million,*3 t/$2010 million, *4 t/toe
IEEJ:October 2017 © IEEJ2017

Annex
IEEJ Outlook 2018 Annex-45
Table A41 | Middle East [Reference Scenario] Primary energy consumption
Mtoe Shares (%) CAGR (%)1990/ 2015/ 2030/ 2015/
1980 1990 2000 2015 2030 2040 2050 1990 2015 2050 2015 2030 2050 2050
Total*1 121 223 372 752 993 1,153 1,291 100 100 100 5.0 1.9 1.3 1.6Coal 1.2 3.0 8.1 9.8 16 18 19 1.3 1.3 1.5 4.9 3.3 1.0 2.0Oil 90 146 217 341 422 485 536 66 45 41 3.4 1.4 1.2 1.3Natural gas 29 72 145 397 523 602 677 32 53 52 7.1 1.9 1.3 1.5Nuclear - - - 0.8 24 36 42 - 0.1 3.2 n.a. 25.7 2.9 12.1Hydro 0.8 1.0 0.7 1.5 2.1 2.3 2.5 0.5 0.2 0.2 1.6 2.1 1.0 1.5Geothermal - - - - - - - - - - n.a. n.a. n.a. n.a.Solar, wind, etc. - 0.4 0.7 0.7 4.2 7.6 13 0.2 0.1 1.0 2.3 12.3 5.8 8.5Biomass and waste 0.3 0.4 0.4 0.9 0.9 0.8 0.8 0.2 0.1 0.1 2.8 0.0 -0.7 -0.4
Final energy consumptionMtoe Shares (%) 1990/ 2015/ 2030/ 2015/
1980 1990 2000 2015 2030 2040 2050 1990 2015 2050 2015 2030 2050 2050
Total 84 157 253 489 652 766 868 100 100 100 4.6 1.9 1.4 1.7Industry 30 47 71 150 203 241 274 30 31 32 4.8 2.0 1.5 1.7Transport 26 51 75 141 180 206 229 32 29 26 4.2 1.6 1.2 1.4Buildings, etc. 22 40 75 129 170 197 222 25 26 26 4.8 1.9 1.3 1.6Non-energy use 5.6 20 32 69 99 122 143 12 14 16 5.2 2.4 1.9 2.1Coal 0.3 0.2 0.5 2.6 3.9 4.9 5.7 0.1 0.5 0.7 11.1 2.8 1.9 2.3Oil 67 108 153 236 304 357 400 69 48 46 3.2 1.7 1.4 1.5Natural gas 9.8 31 65 173 232 267 300 20 35 35 7.1 2.0 1.3 1.6Electricity 6.5 17 33 77 110 135 160 11 16 18 6.2 2.5 1.9 2.1Heat - - - - - - - - - - n.a. n.a. n.a. n.a.Hydrogen - - - - 0.0 0.0 0.0 - - 0.0 n.a. n.a. 4.4 n.a.Renewables 0.2 0.7 1.0 1.3 1.5 1.6 1.8 0.5 0.3 0.2 2.3 0.7 1.1 0.9
Electricity generation(TWh) Shares (%) 1990/ 2015/ 2030/ 2015/
1980 1990 2000 2015 2030 2040 2050 1990 2015 2050 2015 2030 2050 2050
Total 95 244 472 1,111 1,585 1,902 2,215 100 100 100 6.2 2.4 1.7 2.0Coal 0.1 11 30 30 51 57 63 4.3 2.7 2.8 4.3 3.6 1.1 2.2Oil 47 108 188 322 378 390 393 44 29 18 4.5 1.1 0.2 0.6Natural gas 39 114 246 737 1,013 1,233 1,474 47 66 67 7.7 2.1 1.9 2.0Nuclear - - - 2.9 91 140 161 - 0.3 7.2 n.a. 25.7 2.9 12.1Hydro 9.7 12 8.0 18 24 27 30 4.9 1.6 1.3 1.6 2.1 1.0 1.5Geothermal - - - - - - - - - - n.a. n.a. n.a. n.a.Solar PV - - - 1.2 16 29 47 - 0.1 2.1 n.a. 19.1 5.5 11.1Wind - 0.0 0.0 0.4 5.7 16 28 0.0 0.0 1.2 26.4 20.4 8.2 13.3CSP and marine - - - 0.2 6.0 10 20 - 0.0 0.9 n.a. 23.9 6.2 13.4Biomass and waste - - - 0.1 0.3 0.4 0.5 - 0.0 0.0 n.a. 8.3 2.2 4.8Hydrogen - - - - - - - - - - n.a. n.a. n.a. n.a.
Energy and economic indicators1990/ 2015/ 2030/ 2015/
1980 1990 2000 2015 2030 2040 2050 2015 2030 2050 2050
GDP ($2010 billion) 858 949 1,430 2,582 4,001 5,302 6,834 4.1 3.0 2.7 2.8Population (million) 92 132 168 235 297 332 364 2.3 1.6 1.0 1.3CO2 emissions (Mt) 332 573 945 1,822 2,310 2,630 2,910 4.7 1.6 1.2 1.3GDP per capita ($2010 thousand) 9.3 7.2 8.5 11 13 16 19 1.7 1.4 1.7 1.5Primary energy consump. per capita (toe) 1.3 1.7 2.2 3.2 3.3 3.5 3.5 2.6 0.3 0.3 0.3Primary energy consumption per GDP*2 142 235 260 291 248 217 189 0.9 -1.1 -1.4 -1.2CO2 emissions per GDP*3 387 603 661 706 577 496 426 0.6 -1.3 -1.5 -1.4CO2 per primary energy consumption*4 2.7 2.6 2.5 2.4 2.3 2.3 2.3 -0.2 -0.3 -0.2 -0.2*1 Trade of electricity, heat and hydrogen are not shown, *2 toe/$2010 million,*3 t/$2010 million, *4 t/toe
IEEJ:October 2017 © IEEJ2017
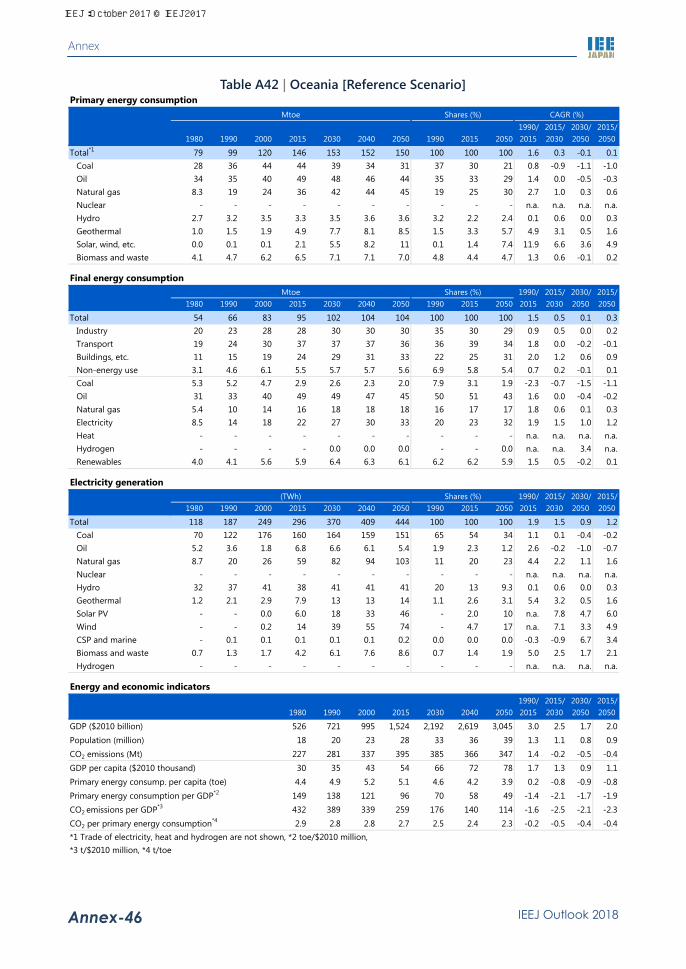
Annex
IEEJ Outlook 2018 Annex-46
Table A42 | Oceania [Reference Scenario] Primary energy consumption
Mtoe Shares (%) CAGR (%)1990/ 2015/ 2030/ 2015/
1980 1990 2000 2015 2030 2040 2050 1990 2015 2050 2015 2030 2050 2050
Total*1 79 99 120 146 153 152 150 100 100 100 1.6 0.3 -0.1 0.1Coal 28 36 44 44 39 34 31 37 30 21 0.8 -0.9 -1.1 -1.0Oil 34 35 40 49 48 46 44 35 33 29 1.4 0.0 -0.5 -0.3Natural gas 8.3 19 24 36 42 44 45 19 25 30 2.7 1.0 0.3 0.6Nuclear - - - - - - - - - - n.a. n.a. n.a. n.a.Hydro 2.7 3.2 3.5 3.3 3.5 3.6 3.6 3.2 2.2 2.4 0.1 0.6 0.0 0.3Geothermal 1.0 1.5 1.9 4.9 7.7 8.1 8.5 1.5 3.3 5.7 4.9 3.1 0.5 1.6Solar, wind, etc. 0.0 0.1 0.1 2.1 5.5 8.2 11 0.1 1.4 7.4 11.9 6.6 3.6 4.9Biomass and waste 4.1 4.7 6.2 6.5 7.1 7.1 7.0 4.8 4.4 4.7 1.3 0.6 -0.1 0.2
Final energy consumptionMtoe Shares (%) 1990/ 2015/ 2030/ 2015/
1980 1990 2000 2015 2030 2040 2050 1990 2015 2050 2015 2030 2050 2050
Total 54 66 83 95 102 104 104 100 100 100 1.5 0.5 0.1 0.3Industry 20 23 28 28 30 30 30 35 30 29 0.9 0.5 0.0 0.2Transport 19 24 30 37 37 37 36 36 39 34 1.8 0.0 -0.2 -0.1Buildings, etc. 11 15 19 24 29 31 33 22 25 31 2.0 1.2 0.6 0.9Non-energy use 3.1 4.6 6.1 5.5 5.7 5.7 5.6 6.9 5.8 5.4 0.7 0.2 -0.1 0.1Coal 5.3 5.2 4.7 2.9 2.6 2.3 2.0 7.9 3.1 1.9 -2.3 -0.7 -1.5 -1.1Oil 31 33 40 49 49 47 45 50 51 43 1.6 0.0 -0.4 -0.2Natural gas 5.4 10 14 16 18 18 18 16 17 17 1.8 0.6 0.1 0.3Electricity 8.5 14 18 22 27 30 33 20 23 32 1.9 1.5 1.0 1.2Heat - - - - - - - - - - n.a. n.a. n.a. n.a.Hydrogen - - - - 0.0 0.0 0.0 - - 0.0 n.a. n.a. 3.4 n.a.Renewables 4.0 4.1 5.6 5.9 6.4 6.3 6.1 6.2 6.2 5.9 1.5 0.5 -0.2 0.1
Electricity generation(TWh) Shares (%) 1990/ 2015/ 2030/ 2015/
1980 1990 2000 2015 2030 2040 2050 1990 2015 2050 2015 2030 2050 2050
Total 118 187 249 296 370 409 444 100 100 100 1.9 1.5 0.9 1.2Coal 70 122 176 160 164 159 151 65 54 34 1.1 0.1 -0.4 -0.2Oil 5.2 3.6 1.8 6.8 6.6 6.1 5.4 1.9 2.3 1.2 2.6 -0.2 -1.0 -0.7Natural gas 8.7 20 26 59 82 94 103 11 20 23 4.4 2.2 1.1 1.6Nuclear - - - - - - - - - - n.a. n.a. n.a. n.a.Hydro 32 37 41 38 41 41 41 20 13 9.3 0.1 0.6 0.0 0.3Geothermal 1.2 2.1 2.9 7.9 13 13 14 1.1 2.6 3.1 5.4 3.2 0.5 1.6Solar PV - - 0.0 6.0 18 33 46 - 2.0 10 n.a. 7.8 4.7 6.0Wind - - 0.2 14 39 55 74 - 4.7 17 n.a. 7.1 3.3 4.9CSP and marine - 0.1 0.1 0.1 0.1 0.1 0.2 0.0 0.0 0.0 -0.3 -0.9 6.7 3.4Biomass and waste 0.7 1.3 1.7 4.2 6.1 7.6 8.6 0.7 1.4 1.9 5.0 2.5 1.7 2.1Hydrogen - - - - - - - - - - n.a. n.a. n.a. n.a.
Energy and economic indicators1990/ 2015/ 2030/ 2015/
1980 1990 2000 2015 2030 2040 2050 2015 2030 2050 2050
GDP ($2010 billion) 526 721 995 1,524 2,192 2,619 3,045 3.0 2.5 1.7 2.0Population (million) 18 20 23 28 33 36 39 1.3 1.1 0.8 0.9CO2 emissions (Mt) 227 281 337 395 385 366 347 1.4 -0.2 -0.5 -0.4GDP per capita ($2010 thousand) 30 35 43 54 66 72 78 1.7 1.3 0.9 1.1Primary energy consump. per capita (toe) 4.4 4.9 5.2 5.1 4.6 4.2 3.9 0.2 -0.8 -0.9 -0.8Primary energy consumption per GDP*2 149 138 121 96 70 58 49 -1.4 -2.1 -1.7 -1.9CO2 emissions per GDP*3 432 389 339 259 176 140 114 -1.6 -2.5 -2.1 -2.3CO2 per primary energy consumption*4 2.9 2.8 2.8 2.7 2.5 2.4 2.3 -0.2 -0.5 -0.4 -0.4*1 Trade of electricity, heat and hydrogen are not shown, *2 toe/$2010 million,*3 t/$2010 million, *4 t/toe
IEEJ:October 2017 © IEEJ2017
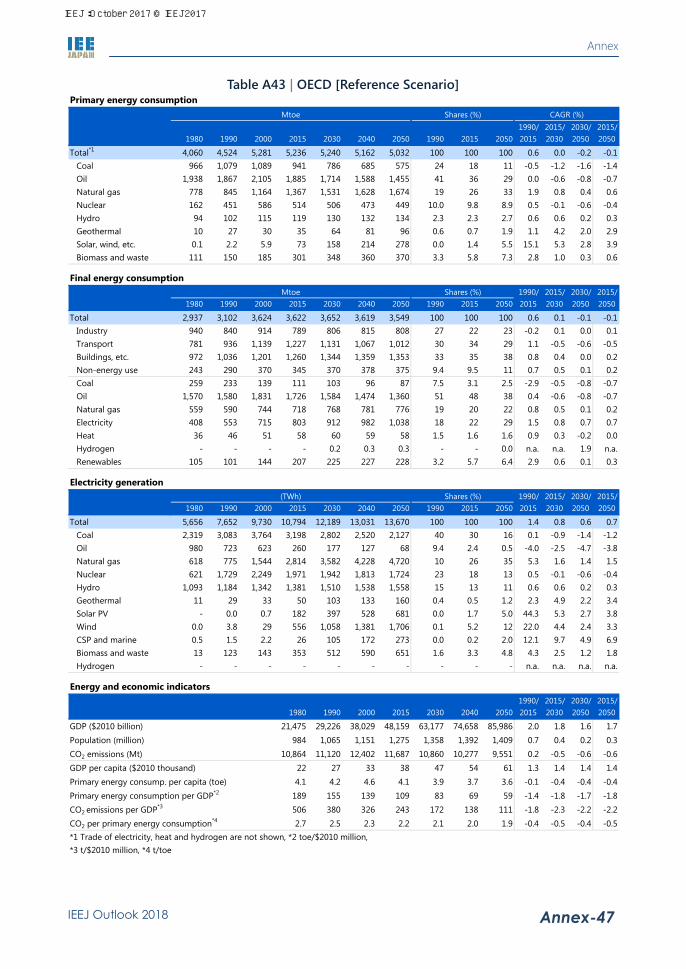
Annex
IEEJ Outlook 2018 Annex-47
Table A43 | OECD [Reference Scenario] Primary energy consumption
Mtoe Shares (%) CAGR (%)1990/ 2015/ 2030/ 2015/
1980 1990 2000 2015 2030 2040 2050 1990 2015 2050 2015 2030 2050 2050
Total*1 4,060 4,524 5,281 5,236 5,240 5,162 5,032 100 100 100 0.6 0.0 -0.2 -0.1Coal 966 1,079 1,089 941 786 685 575 24 18 11 -0.5 -1.2 -1.6 -1.4Oil 1,938 1,867 2,105 1,885 1,714 1,588 1,455 41 36 29 0.0 -0.6 -0.8 -0.7Natural gas 778 845 1,164 1,367 1,531 1,628 1,674 19 26 33 1.9 0.8 0.4 0.6Nuclear 162 451 586 514 506 473 449 10.0 9.8 8.9 0.5 -0.1 -0.6 -0.4Hydro 94 102 115 119 130 132 134 2.3 2.3 2.7 0.6 0.6 0.2 0.3Geothermal 10 27 30 35 64 81 96 0.6 0.7 1.9 1.1 4.2 2.0 2.9Solar, wind, etc. 0.1 2.2 5.9 73 158 214 278 0.0 1.4 5.5 15.1 5.3 2.8 3.9Biomass and waste 111 150 185 301 348 360 370 3.3 5.8 7.3 2.8 1.0 0.3 0.6
Final energy consumptionMtoe Shares (%) 1990/ 2015/ 2030/ 2015/
1980 1990 2000 2015 2030 2040 2050 1990 2015 2050 2015 2030 2050 2050
Total 2,937 3,102 3,624 3,622 3,652 3,619 3,549 100 100 100 0.6 0.1 -0.1 -0.1Industry 940 840 914 789 806 815 808 27 22 23 -0.2 0.1 0.0 0.1Transport 781 936 1,139 1,227 1,131 1,067 1,012 30 34 29 1.1 -0.5 -0.6 -0.5Buildings, etc. 972 1,036 1,201 1,260 1,344 1,359 1,353 33 35 38 0.8 0.4 0.0 0.2Non-energy use 243 290 370 345 370 378 375 9.4 9.5 11 0.7 0.5 0.1 0.2Coal 259 233 139 111 103 96 87 7.5 3.1 2.5 -2.9 -0.5 -0.8 -0.7Oil 1,570 1,580 1,831 1,726 1,584 1,474 1,360 51 48 38 0.4 -0.6 -0.8 -0.7Natural gas 559 590 744 718 768 781 776 19 20 22 0.8 0.5 0.1 0.2Electricity 408 553 715 803 912 982 1,038 18 22 29 1.5 0.8 0.7 0.7Heat 36 46 51 58 60 59 58 1.5 1.6 1.6 0.9 0.3 -0.2 0.0Hydrogen - - - - 0.2 0.3 0.3 - - 0.0 n.a. n.a. 1.9 n.a.Renewables 105 101 144 207 225 227 228 3.2 5.7 6.4 2.9 0.6 0.1 0.3
Electricity generation(TWh) Shares (%) 1990/ 2015/ 2030/ 2015/
1980 1990 2000 2015 2030 2040 2050 1990 2015 2050 2015 2030 2050 2050
Total 5,656 7,652 9,730 10,794 12,189 13,031 13,670 100 100 100 1.4 0.8 0.6 0.7Coal 2,319 3,083 3,764 3,198 2,802 2,520 2,127 40 30 16 0.1 -0.9 -1.4 -1.2Oil 980 723 623 260 177 127 68 9.4 2.4 0.5 -4.0 -2.5 -4.7 -3.8Natural gas 618 775 1,544 2,814 3,582 4,228 4,720 10 26 35 5.3 1.6 1.4 1.5Nuclear 621 1,729 2,249 1,971 1,942 1,813 1,724 23 18 13 0.5 -0.1 -0.6 -0.4Hydro 1,093 1,184 1,342 1,381 1,510 1,538 1,558 15 13 11 0.6 0.6 0.2 0.3Geothermal 11 29 33 50 103 133 160 0.4 0.5 1.2 2.3 4.9 2.2 3.4Solar PV - 0.0 0.7 182 397 528 681 0.0 1.7 5.0 44.3 5.3 2.7 3.8Wind 0.0 3.8 29 556 1,058 1,381 1,706 0.1 5.2 12 22.0 4.4 2.4 3.3CSP and marine 0.5 1.5 2.2 26 105 172 273 0.0 0.2 2.0 12.1 9.7 4.9 6.9Biomass and waste 13 123 143 353 512 590 651 1.6 3.3 4.8 4.3 2.5 1.2 1.8Hydrogen - - - - - - - - - - n.a. n.a. n.a. n.a.
Energy and economic indicators1990/ 2015/ 2030/ 2015/
1980 1990 2000 2015 2030 2040 2050 2015 2030 2050 2050
GDP ($2010 billion) 21,475 29,226 38,029 48,159 63,177 74,658 85,986 2.0 1.8 1.6 1.7Population (million) 984 1,065 1,151 1,275 1,358 1,392 1,409 0.7 0.4 0.2 0.3CO2 emissions (Mt) 10,864 11,120 12,402 11,687 10,860 10,277 9,551 0.2 -0.5 -0.6 -0.6GDP per capita ($2010 thousand) 22 27 33 38 47 54 61 1.3 1.4 1.4 1.4Primary energy consump. per capita (toe) 4.1 4.2 4.6 4.1 3.9 3.7 3.6 -0.1 -0.4 -0.4 -0.4Primary energy consumption per GDP*2 189 155 139 109 83 69 59 -1.4 -1.8 -1.7 -1.8CO2 emissions per GDP*3 506 380 326 243 172 138 111 -1.8 -2.3 -2.2 -2.2CO2 per primary energy consumption*4 2.7 2.5 2.3 2.2 2.1 2.0 1.9 -0.4 -0.5 -0.4 -0.5*1 Trade of electricity, heat and hydrogen are not shown, *2 toe/$2010 million,*3 t/$2010 million, *4 t/toe
IEEJ:October 2017 © IEEJ2017

Annex
IEEJ Outlook 2018 Annex-48
Table A44 | Non-OECD [Reference Scenario] Primary energy consumption
Mtoe Shares (%) CAGR (%)1990/ 2015/ 2030/ 2015/
1980 1990 2000 2015 2030 2040 2050 1990 2015 2050 2015 2030 2050 2050
Total*1 2,967 4,048 4,472 8,029 10,812 12,613 14,096 100 100 100 2.8 2.0 1.3 1.6Coal 817 1,141 1,222 2,895 3,468 3,801 3,956 28 36 28 3.8 1.2 0.7 0.9Oil 986 1,166 1,281 2,068 2,815 3,315 3,780 29 26 27 2.3 2.1 1.5 1.7Natural gas 454 818 908 1,577 2,305 2,905 3,493 20 20 25 2.7 2.6 2.1 2.3Nuclear 24 74 89 157 401 507 605 1.8 2.0 4.3 3.0 6.4 2.1 3.9Hydro 54 82 110 216 295 334 366 2.0 2.7 2.6 3.9 2.1 1.1 1.5Geothermal 2.2 7.6 22 39 113 143 161 0.2 0.5 1.1 6.8 7.3 1.8 4.1Solar, wind, etc. - 0.5 2.1 53 147 233 330 0.0 0.7 2.3 20.8 7.0 4.1 5.3Biomass and waste 631 759 838 1,022 1,265 1,374 1,401 19 13 9.9 1.2 1.4 0.5 0.9
Final energy consumptionMtoe Shares (%) 1990/ 2015/ 2030/ 2015/
1980 1990 2000 2015 2030 2040 2050 1990 2015 2050 2015 2030 2050 2050
Total 2,252 2,964 3,138 5,380 7,184 8,399 9,465 100 100 100 2.4 1.9 1.4 1.6Industry 825 968 954 1,923 2,340 2,684 2,970 33 36 31 2.8 1.3 1.2 1.3Transport 289 435 547 1,095 1,588 1,862 2,092 15 20 22 3.8 2.5 1.4 1.9Buildings, etc. 1,027 1,373 1,390 1,872 2,567 3,008 3,425 46 35 36 1.2 2.1 1.5 1.7Non-energy use 111 187 247 491 690 845 977 6.3 9.1 10 3.9 2.3 1.8 2.0Coal 444 521 409 933 993 1,026 1,020 18 17 11 2.4 0.4 0.1 0.3Oil 697 817 1,010 1,732 2,431 2,899 3,347 28 32 35 3.1 2.3 1.6 1.9Natural gas 256 354 372 684 995 1,219 1,428 12 13 15 2.7 2.5 1.8 2.1Electricity 178 283 377 934 1,461 1,871 2,285 9.5 17 24 4.9 3.0 2.3 2.6Heat 85 290 197 214 228 238 241 9.8 4.0 2.5 -1.2 0.4 0.3 0.3Hydrogen - - - - 0.2 0.4 0.5 - - 0.0 n.a. n.a. 3.9 n.a.Renewables 592 698 773 884 1,075 1,147 1,143 24 16 12 0.9 1.3 0.3 0.7
Electricity generation(TWh) Shares (%) 1990/ 2015/ 2030/ 2015/
1980 1990 2000 2015 2030 2040 2050 1990 2015 2050 2015 2030 2050 2050
Total 2,628 4,212 5,741 13,461 20,776 26,070 31,168 100 100 100 4.8 2.9 2.0 2.4Coal 817 1,342 2,242 6,340 8,956 10,637 11,869 32 47 38 6.4 2.3 1.4 1.8Oil 678 635 628 729 825 852 824 15 5.4 2.6 0.6 0.8 0.0 0.3Natural gas 381 977 1,209 2,729 4,357 6,110 8,147 23 20 26 4.2 3.2 3.2 3.2Nuclear 93 283 341 601 1,538 1,946 2,323 6.7 4.5 7.5 3.0 6.5 2.1 3.9Hydro 624 959 1,277 2,508 3,433 3,882 4,260 23 19 14 3.9 2.1 1.1 1.5Geothermal 2.6 7.8 19 30 88 112 128 0.2 0.2 0.4 5.5 7.4 1.9 4.2Solar PV - 0.0 0.3 64 354 626 986 0.0 0.5 3.2 51.5 12.0 5.3 8.1Wind - 0.0 2.8 282 833 1,329 1,879 0.0 2.1 6.0 43.3 7.5 4.2 5.6CSP and marine - 0.0 0.0 0.3 31 65 112 0.0 0.0 0.4 16.0 36.7 6.7 18.6Biomass and waste 31 7.7 21 175 360 510 637 0.2 1.3 2.0 13.3 4.9 2.9 3.8Hydrogen - - - - - - - - - - n.a. n.a. n.a. n.a.
Energy and economic indicators1990/ 2015/ 2030/ 2015/
1980 1990 2000 2015 2030 2040 2050 2015 2030 2050 2050
GDP ($2010 billion) 6,482 8,572 11,796 26,900 52,126 77,431 105,413 4.7 4.5 3.6 4.0Population (million) 3,452 4,213 4,957 6,062 7,139 7,760 8,301 1.5 1.1 0.8 0.9CO2 emissions (Mt) 6,999 9,464 10,174 20,051 25,738 29,551 32,605 3.0 1.7 1.2 1.4GDP per capita ($2010 thousand) 1.9 2.0 2.4 4.4 7.3 10.0 13 3.2 3.4 2.8 3.0Primary energy consump. per capita (toe) 0.9 1.0 0.9 1.3 1.5 1.6 1.7 1.3 0.9 0.6 0.7Primary energy consumption per GDP*2 458 472 379 298 207 163 134 -1.8 -2.4 -2.2 -2.3CO2 emissions per GDP*3 1,080 1,104 862 745 494 382 309 -1.6 -2.7 -2.3 -2.5CO2 per primary energy consumption*4 2.4 2.3 2.3 2.5 2.4 2.3 2.3 0.3 -0.3 -0.1 -0.2*1 Trade of electricity, heat and hydrogen are not shown, *2 toe/$2010 million,*3 t/$2010 million, *4 t/toe
IEEJ:October 2017 © IEEJ2017

Annex
IEEJ Outlook 2018 Annex-49
Table A45 | World [Advanced Technologies Scenario] Primary energy consumption
Mtoe Shares (%) CAGR (%)1990/ 2015/ 2030/ 2015/
1980 1990 2000 2015 2030 2040 2050 1990 2015 2050 2015 2030 2050 2050
Total*1 7,205 8,774 10,028 13,647 15,717 16,693 17,219 100 100 100 1.8 0.9 0.5 0.7Coal 1,783 2,220 2,311 3,836 3,606 3,372 2,937 25 28 17 2.2 -0.4 -1.0 -0.8Oil 3,102 3,235 3,660 4,334 4,625 4,655 4,656 37 32 27 1.2 0.4 0.0 0.2Natural gas 1,232 1,663 2,071 2,944 3,584 3,976 4,157 19 22 24 2.3 1.3 0.7 1.0Nuclear 186 526 676 671 1,180 1,441 1,754 6.0 4.9 10 1.0 3.8 2.0 2.8Hydro 148 184 225 334 425 466 500 2.1 2.5 2.9 2.4 1.6 0.8 1.2Geothermal 12 34 52 74 240 340 420 0.4 0.5 2.4 3.1 8.1 2.8 5.1Solar, wind, etc. 0.1 2.7 8.0 126 415 677 996 0.0 0.9 5.8 16.7 8.2 4.5 6.1Biomass and waste 741 909 1,023 1,323 1,639 1,761 1,794 10 9.7 10 1.5 1.4 0.5 0.9
Final energy consumptionMtoe Shares (%) 1990/ 2015/ 2030/ 2015/
1980 1990 2000 2015 2030 2040 2050 1990 2015 2050 2015 2030 2050 2050
Total 5,368 6,268 7,036 9,384 10,787 11,439 11,831 100 100 100 1.6 0.9 0.5 0.7Industry 1,766 1,809 1,868 2,712 3,044 3,233 3,273 29 29 28 1.6 0.8 0.4 0.5Transport 1,248 1,573 1,961 2,703 2,990 3,055 3,100 25 29 26 2.2 0.7 0.2 0.4Buildings, etc. 2,000 2,409 2,591 3,132 3,692 3,929 4,106 38 33 35 1.1 1.1 0.5 0.8Non-energy use 354 478 617 836 1,060 1,223 1,352 7.6 8.9 11 2.3 1.6 1.2 1.4Coal 703 754 548 1,044 1,064 1,046 979 12 11 8.3 1.3 0.1 -0.4 -0.2Oil 2,446 2,599 3,115 3,840 4,191 4,265 4,320 41 41 37 1.6 0.6 0.2 0.3Natural gas 814 945 1,117 1,401 1,708 1,876 1,987 15 15 17 1.6 1.3 0.8 1.0Electricity 586 835 1,092 1,737 2,288 2,670 3,012 13 19 25 3.0 1.9 1.4 1.6Heat 121 336 248 271 276 273 259 5.4 2.9 2.2 -0.9 0.1 -0.3 -0.1Hydrogen - - - - 0.4 1.1 2.6 - - 0.0 n.a. n.a. 10.5 n.a.Renewables 698 799 917 1,090 1,261 1,308 1,272 13 12 11 1.3 1.0 0.0 0.4
Electricity generation(TWh) Shares (%) 1990/ 2015/ 2030/ 2015/
1980 1990 2000 2015 2030 2040 2050 1990 2015 2050 2015 2030 2050 2050
Total 8,283 11,864 15,471 24,255 31,482 35,926 39,733 100 100 100 2.9 1.8 1.2 1.4Coal 3,137 4,425 6,005 9,538 8,920 8,069 6,672 37 39 17 3.1 -0.4 -1.4 -1.0Oil 1,659 1,358 1,252 990 790 638 440 11 4.1 1.1 -1.3 -1.5 -2.9 -2.3Natural gas 999 1,752 2,753 5,543 7,039 8,100 8,591 15 23 22 4.7 1.6 1.0 1.3Nuclear 713 2,013 2,591 2,571 4,527 5,530 6,729 17 11 17 1.0 3.8 2.0 2.8Hydro 1,717 2,142 2,619 3,888 4,943 5,419 5,818 18 16 15 2.4 1.6 0.8 1.2Geothermal 14 36 52 80 269 376 467 0.3 0.3 1.2 3.2 8.4 2.8 5.2Solar PV - 0.0 1.0 247 1,068 1,874 2,794 0.0 1.0 7.0 45.5 10.3 4.9 7.2Wind 0.0 3.9 31 838 2,686 4,145 5,761 0.0 3.5 15 24.0 8.1 3.9 5.7CSP and marine 0.5 1.5 2.2 27 212 458 870 0.0 0.1 2.2 12.2 14.9 7.3 10.5Biomass and waste 44 131 164 528 1,024 1,313 1,586 1.1 2.2 4.0 5.7 4.5 2.2 3.2Hydrogen - - - - - - - - - - n.a. n.a. n.a. n.a.
Energy and economic indicators1990/ 2015/ 2030/ 2015/
1980 1990 2000 2015 2030 2040 2050 2015 2030 2050 2050
GDP ($2010 billion) 27,958 37,797 49,825 75,059 115,303 152,089 191,400 2.8 2.9 2.6 2.7Population (million) 4,436 5,277 6,108 7,336 8,497 9,152 9,710 1.3 1.0 0.7 0.8CO2 emissions (Mt) 18,411 21,205 23,416 32,910 33,377 32,055 29,699 1.8 0.1 -0.6 -0.3GDP per capita ($2010 thousand) 6.3 7.2 8.2 10 14 17 20 1.4 1.9 1.9 1.9Primary energy consump. per capita (toe) 1.6 1.7 1.6 1.9 1.8 1.8 1.8 0.5 0.0 -0.2 -0.1Primary energy consumption per GDP*2 258 232 201 182 136 110 90 -1.0 -1.9 -2.1 -2.0CO2 emissions per GDP*3 659 561 470 438 289 211 155 -1.0 -2.7 -3.1 -2.9CO2 per primary energy consumption*4 2.6 2.4 2.3 2.4 2.1 1.9 1.7 0.0 -0.8 -1.0 -1.0*1 Trade of electricity, heat and hydrogen are not shown, *2 toe/$2010 million,*3 t/$2010 million, *4 t/toe
IEEJ:October 2017 © IEEJ2017

Annex
IEEJ Outlook 2018 Annex-50
Table A46 | Asia [Advanced Technologies Scenario] Primary energy consumption
Mtoe Shares (%) CAGR (%)1990/ 2015/ 2030/ 2015/
1980 1990 2000 2015 2030 2040 2050 1990 2015 2050 2015 2030 2050 2050
Total*1 1,439 2,108 2,887 5,459 7,078 7,794 8,156 100 100 100 3.9 1.7 0.7 1.2Coal 466 785 1,037 2,739 2,848 2,769 2,499 37 50 31 5.1 0.3 -0.7 -0.3Oil 477 618 916 1,330 1,720 1,860 1,974 29 24 24 3.1 1.7 0.7 1.1Natural gas 51 116 232 547 906 1,141 1,294 5.5 10 16 6.4 3.4 1.8 2.5Nuclear 25 77 132 111 516 722 918 3.6 2.0 11 1.5 10.8 2.9 6.2Hydro 20 32 41 131 182 205 221 1.5 2.4 2.7 5.8 2.2 1.0 1.5Geothermal 2.6 8.2 23 34 122 180 222 0.4 0.6 2.7 5.9 8.8 3.0 5.5Solar, wind, etc. - 1.5 2.2 51 171 279 406 0.1 0.9 5.0 15.3 8.3 4.4 6.1Biomass and waste 397 471 503 515 611 635 622 22 9.4 7.6 0.4 1.2 0.1 0.5
Final energy consumptionMtoe Shares (%) 1990/ 2015/ 2030/ 2015/
1980 1990 2000 2015 2030 2040 2050 1990 2015 2050 2015 2030 2050 2050
Total 1,129 1,551 1,990 3,617 4,619 5,068 5,337 100 100 100 3.4 1.6 0.7 1.1Industry 383 517 646 1,481 1,700 1,798 1,797 33 41 34 4.3 0.9 0.3 0.6Transport 126 186 320 648 918 1,002 1,058 12 18 20 5.1 2.4 0.7 1.4Buildings, etc. 567 733 836 1,124 1,505 1,686 1,839 47 31 34 1.7 2.0 1.0 1.4Non-energy use 54 115 188 365 496 583 642 7.4 10 12 4.7 2.1 1.3 1.6Coal 301 424 378 901 924 909 850 27 25 16 3.1 0.2 -0.4 -0.2Oil 327 453 727 1,164 1,550 1,699 1,827 29 32 34 3.9 1.9 0.8 1.3Natural gas 21 47 88 252 426 525 593 3.0 7.0 11 6.9 3.6 1.7 2.5Electricity 88 158 280 740 1,108 1,338 1,527 10 20 29 6.4 2.7 1.6 2.1Heat 7.5 14 30 89 101 104 98 0.9 2.5 1.8 7.6 0.8 -0.1 0.3Hydrogen - - - - 0.2 0.7 1.6 - - 0.0 n.a. n.a. 11.3 n.a.Renewables 386 456 488 471 510 494 441 29 13 8.3 0.1 0.5 -0.7 -0.2
Electricity generation(TWh) Shares (%) 1990/ 2015/ 2030/ 2015/
1980 1990 2000 2015 2030 2040 2050 1990 2015 2050 2015 2030 2050 2050
Total 1,196 2,252 4,013 10,204 15,136 17,884 20,032 100 100 100 6.2 2.7 1.4 1.9Coal 298 863 1,994 6,203 6,760 6,519 5,776 38 61 29 8.2 0.6 -0.8 -0.2Oil 476 469 430 250 184 136 79 21 2.5 0.4 -2.5 -2.0 -4.1 -3.2Natural gas 90 240 565 1,296 2,097 2,757 3,248 11 13 16 7.0 3.3 2.2 2.7Nuclear 97 294 505 425 1,981 2,769 3,523 13 4.2 18 1.5 10.8 2.9 6.2Hydro 232 367 479 1,521 2,121 2,385 2,569 16 15 13 5.8 2.2 1.0 1.5Geothermal 3.0 8.4 20 24 82 119 147 0.4 0.2 0.7 4.3 8.6 3.0 5.3Solar PV - 0.0 0.6 95 524 979 1,504 0.0 0.9 7.5 49.6 12.1 5.4 8.2Wind - 0.0 2.4 239 1,041 1,718 2,504 0.0 2.3 13 42.5 10.3 4.5 6.9CSP and marine - 0.0 0.0 2.0 15 37 85 0.0 0.0 0.4 25.5 14.2 9.1 11.2Biomass and waste 0.0 10 17 150 332 466 598 0.5 1.5 3.0 11.4 5.4 3.0 4.0Hydrogen - - - - - - - - - - n.a. n.a. n.a. n.a.
Energy and economic indicators1990/ 2015/ 2030/ 2015/
1980 1990 2000 2015 2030 2040 2050 2015 2030 2050 2050
GDP ($2010 billion) 4,455 7,586 11,047 22,344 42,637 61,674 81,910 4.4 4.4 3.3 3.8Population (million) 2,440 2,932 3,407 3,993 4,433 4,595 4,658 1.2 0.7 0.2 0.4CO2 emissions (Mt) 3,268 4,918 6,891 15,076 17,007 16,968 15,977 4.6 0.8 -0.3 0.2GDP per capita ($2010 thousand) 1.8 2.6 3.2 5.6 9.6 13 18 3.1 3.7 3.1 3.3Primary energy consump. per capita (toe) 0.6 0.7 0.8 1.4 1.6 1.7 1.8 2.6 1.0 0.5 0.7Primary energy consumption per GDP*2 323 278 261 244 166 126 100 -0.5 -2.5 -2.5 -2.5CO2 emissions per GDP*3 733 648 624 675 399 275 195 0.2 -3.4 -3.5 -3.5CO2 per primary energy consumption*4 2.3 2.3 2.4 2.8 2.4 2.2 2.0 0.7 -0.9 -1.0 -1.0*1 Trade of electricity, heat and hydrogen are not shown, *2 toe/$2010 million,*3 t/$2010 million, *4 t/toe
IEEJ:October 2017 © IEEJ2017

Annex
IEEJ Outlook 2018 Annex-51
Table A47 | China [Advanced Technologies Scenario] Primary energy consumption
Mtoe Shares (%) CAGR (%)1990/ 2015/ 2030/ 2015/
1980 1990 2000 2015 2030 2040 2050 1990 2015 2050 2015 2030 2050 2050
Total*1 598 871 1,130 2,973 3,485 3,591 3,416 100 100 100 5.0 1.1 -0.1 0.4Coal 313 528 665 1,982 1,806 1,599 1,219 61 67 36 5.4 -0.6 -1.9 -1.4Oil 89 119 221 534 722 717 673 14 18 20 6.2 2.0 -0.4 0.7Natural gas 12 13 21 159 333 422 448 1.5 5.3 13 10.6 5.1 1.5 3.0Nuclear - - 4.4 45 274 411 548 - 1.5 16 n.a. 12.9 3.5 7.4Hydro 5.0 11 19 96 122 132 135 1.3 3.2 4.0 9.1 1.6 0.5 1.0Geothermal - - 1.7 5.1 7.1 7.9 8.1 - 0.2 0.2 n.a. 2.2 0.7 1.4Solar, wind, etc. - 0.0 1.0 41 118 180 251 0.0 1.4 7.3 33.0 7.3 3.9 5.3Biomass and waste 180 200 198 114 104 122 135 23 3.8 4.0 -2.2 -0.6 1.3 0.5
Final energy consumptionMtoe Shares (%) 1990/ 2015/ 2030/ 2015/
1980 1990 2000 2015 2030 2040 2050 1990 2015 2050 2015 2030 2050 2050
Total 487 654 781 1,906 2,240 2,304 2,215 100 100 100 4.4 1.1 -0.1 0.4Industry 181 234 299 966 934 897 804 36 51 36 5.8 -0.2 -0.7 -0.5Transport 24 33 87 299 470 476 456 5.1 16 21 9.2 3.1 -0.2 1.2Buildings, etc. 272 344 335 483 621 682 689 53 25 31 1.4 1.7 0.5 1.0Non-energy use 10 43 60 158 215 250 266 6.6 8.3 12 5.3 2.1 1.1 1.5Coal 214 308 274 701 613 543 446 47 37 20 3.3 -0.9 -1.6 -1.3Oil 59 85 180 480 664 665 630 13 25 28 7.2 2.2 -0.3 0.8Natural gas 6.4 8.9 12 105 194 237 260 1.4 5.5 12 10.4 4.1 1.5 2.6Electricity 21 39 89 419 587 673 704 6.0 22 32 10.0 2.3 0.9 1.5Heat 7.4 13 25 83 94 97 92 2.0 4.4 4.2 7.6 0.8 -0.1 0.3Hydrogen - - - - 0.1 0.6 1.4 - - 0.1 n.a. n.a. 12.0 n.a.Renewables 180 200 199 116 88 88 82 31 6.1 3.7 -2.2 -1.9 -0.4 -1.0
Electricity generation(TWh) Shares (%) 1990/ 2015/ 2030/ 2015/
1980 1990 2000 2015 2030 2040 2050 1990 2015 2050 2015 2030 2050 2050
Total 301 621 1,356 5,844 8,036 9,041 9,298 100 100 100 9.4 2.1 0.7 1.3Coal 159 441 1,060 4,109 3,933 3,417 2,316 71 70 25 9.3 -0.3 -2.6 -1.6Oil 82 50 47 9.7 7.2 4.9 2.3 8.1 0.2 0.0 -6.4 -2.0 -5.6 -4.1Natural gas 0.7 2.8 5.8 145 472 630 594 0.4 2.5 6.4 17.2 8.2 1.2 4.1Nuclear - - 17 171 1,052 1,577 2,103 - 2.9 23 n.a. 12.9 3.5 7.4Hydro 58 127 222 1,114 1,414 1,531 1,574 20 19 17 9.1 1.6 0.5 1.0Geothermal - 0.1 0.1 0.1 0.5 0.6 0.7 0.0 0.0 0.0 3.2 9.4 2.1 5.2Solar PV - 0.0 0.0 45 272 429 596 0.0 0.8 6.4 49.3 12.7 4.0 7.6Wind - 0.0 0.6 186 729 1,210 1,783 0.0 3.2 19 58.0 9.5 4.6 6.7CSP and marine - 0.0 0.0 0.0 6.1 16 39 0.0 0.0 0.4 6.6 41.1 9.8 22.2Biomass and waste - - 2.4 64 152 225 290 - 1.1 3.1 n.a. 6.0 3.3 4.4Hydrogen - - - - - - - - - - n.a. n.a. n.a. n.a.
Energy and economic indicators1990/ 2015/ 2030/ 2015/
1980 1990 2000 2015 2030 2040 2050 2015 2030 2050 2050
GDP ($2010 billion) 341 830 2,237 8,910 20,311 30,759 40,328 10.0 5.6 3.5 4.4Population (million) 981 1,135 1,263 1,371 1,415 1,391 1,340 0.8 0.2 -0.3 -0.1CO2 emissions (Mt) 1,505 2,339 3,164 9,333 9,399 8,579 6,939 5.7 0.0 -1.5 -0.8GDP per capita ($2010 thousand) 0.3 0.7 1.8 6.5 14 22 30 9.1 5.4 3.8 4.5Primary energy consump. per capita (toe) 0.6 0.8 0.9 2.2 2.5 2.6 2.6 4.2 0.9 0.2 0.5Primary energy consumption per GDP*2 1,752 1,050 505 334 172 117 85 -4.5 -4.3 -3.5 -3.8CO2 emissions per GDP*3 4,410 2,819 1,414 1,048 463 279 172 -3.9 -5.3 -4.8 -5.0CO2 per primary energy consumption*4 2.5 2.7 2.8 3.1 2.7 2.4 2.0 0.6 -1.0 -1.4 -1.2*1 Trade of electricity, heat and hydrogen are not shown, *2 toe/$2010 million,*3 t/$2010 million, *4 t/toe
IEEJ:October 2017 © IEEJ2017

Annex
IEEJ Outlook 2018 Annex-52
Table A48 | India [Advanced Technologies Scenario] Primary energy consumption
Mtoe Shares (%) CAGR (%)1990/ 2015/ 2030/ 2015/
1980 1990 2000 2015 2030 2040 2050 1990 2015 2050 2015 2030 2050 2050
Total*1 200 306 441 851 1,492 1,837 2,158 100 100 100 4.2 3.8 1.9 2.7Coal 44 93 146 379 606 697 775 30 45 36 5.8 3.2 1.2 2.1Oil 33 61 112 206 358 465 582 20 24 27 5.0 3.8 2.5 3.0Natural gas 1.3 11 23 43 122 178 235 3.5 5.1 11 5.8 7.2 3.3 5.0Nuclear 0.8 1.6 4.4 9.8 78 122 156 0.5 1.1 7.2 7.5 14.9 3.5 8.2Hydro 4.0 6.2 6.4 12 24 31 38 2.0 1.4 1.8 2.7 4.8 2.4 3.4Geothermal - - - - - - - - - - n.a. n.a. n.a. n.a.Solar, wind, etc. - 0.0 0.2 4.8 36 68 107 0.0 0.6 5.0 27.8 14.3 5.6 9.3Biomass and waste 116 133 149 196 267 276 264 44 23 12 1.6 2.1 -0.1 0.8
Final energy consumptionMtoe Shares (%) 1990/ 2015/ 2030/ 2015/
1980 1990 2000 2015 2030 2040 2050 1990 2015 2050 2015 2030 2050 2050
Total 174 243 315 578 1,009 1,258 1,494 100 100 100 3.5 3.8 2.0 2.8Industry 41 67 83 195 359 440 491 27 34 33 4.4 4.1 1.6 2.7Transport 17 21 32 86 151 204 246 8.6 15 16 5.8 3.8 2.5 3.0Buildings, etc. 110 142 173 250 402 483 599 59 43 40 2.3 3.2 2.0 2.5Non-energy use 5.7 13 27 46 97 130 158 5.5 8.0 11 5.1 5.0 2.5 3.6Coal 25 39 35 108 201 249 286 16 19 19 4.2 4.2 1.8 2.8Oil 27 50 94 174 317 418 530 21 30 35 5.1 4.1 2.6 3.2Natural gas 0.7 5.6 9.7 29 70 100 126 2.3 5.0 8.4 6.8 6.1 3.0 4.3Electricity 7.8 18 32 88 197 275 364 7.6 15 24 6.5 5.5 3.1 4.1Heat - - - - - - - - - - n.a. n.a. n.a. n.a.Hydrogen - - - - 0.0 0.0 0.1 - - 0.0 n.a. n.a. 12.9 n.a.Renewables 114 130 144 178 225 216 188 54 31 13 1.3 1.6 -0.9 0.2
Electricity generation(TWh) Shares (%) 1990/ 2015/ 2030/ 2015/
1980 1990 2000 2015 2030 2040 2050 1990 2015 2050 2015 2030 2050 2050
Total 120 293 570 1,383 2,904 3,815 4,845 100 100 100 6.4 5.1 2.6 3.6Coal 61 192 390 1,042 1,586 1,722 1,900 65 75 39 7.0 2.8 0.9 1.7Oil 8.8 13 29 23 24 18 10 4.5 1.7 0.2 2.2 0.2 -4.1 -2.2Natural gas 0.6 10.0 56 68 256 405 604 3.4 4.9 12 8.0 9.2 4.4 6.4Nuclear 3.0 6.1 17 37 300 467 599 2.1 2.7 12 7.5 14.9 3.5 8.2Hydro 47 72 74 138 280 364 447 24 10.0 9.2 2.7 4.8 2.4 3.4Geothermal - - - - - - - - - - n.a. n.a. n.a. n.a.Solar PV - - 0.0 5.6 115 296 513 - 0.4 11 n.a. 22.2 7.8 13.8Wind - 0.0 1.7 43 262 417 586 0.0 3.1 12 33.4 12.8 4.1 7.8CSP and marine - - - - 5.4 13 29 - - 0.6 n.a. n.a. 8.8 n.a.Biomass and waste - - 1.3 27 76 113 156 - 1.9 3.2 n.a. 7.2 3.7 5.2Hydrogen - - - - - - - - - - n.a. n.a. n.a. n.a.
Energy and economic indicators1990/ 2015/ 2030/ 2015/
1980 1990 2000 2015 2030 2040 2050 2015 2030 2050 2050
GDP ($2010 billion) 274 470 809 2,288 6,133 10,236 15,857 6.5 6.8 4.9 5.7Population (million) 697 871 1,053 1,311 1,515 1,608 1,662 1.7 1.0 0.5 0.7CO2 emissions (Mt) 263 542 899 2,107 3,491 4,107 4,699 5.6 3.4 1.5 2.3GDP per capita ($2010 thousand) 0.4 0.5 0.8 1.7 4.0 6.4 9.5 4.8 5.8 4.4 5.0Primary energy consump. per capita (toe) 0.3 0.4 0.4 0.6 1.0 1.1 1.3 2.5 2.8 1.4 2.0Primary energy consumption per GDP*2 731 651 545 372 243 179 136 -2.2 -2.8 -2.9 -2.8CO2 emissions per GDP*3 962 1,154 1,112 921 569 401 296 -0.9 -3.2 -3.2 -3.2CO2 per primary energy consumption*4 1.3 1.8 2.0 2.5 2.3 2.2 2.2 1.3 -0.4 -0.4 -0.4*1 Trade of electricity, heat and hydrogen are not shown, *2 toe/$2010 million,*3 t/$2010 million, *4 t/toe
IEEJ:October 2017 © IEEJ2017

Annex
IEEJ Outlook 2018 Annex-53
Table A49 | Japan [Advanced Technologies Scenario] Primary energy consumption
Mtoe Shares (%) CAGR (%)1990/ 2015/ 2030/ 2015/
1980 1990 2000 2015 2030 2040 2050 1990 2015 2050 2015 2030 2050 2050
Total*1 345 439 518 430 425 397 369 100 100 100 -0.1 -0.1 -0.7 -0.4Coal 60 76 97 117 103 91 76 17 27 21 1.7 -0.9 -1.5 -1.2Oil 234 250 255 185 141 118 100 57 43 27 -1.2 -1.8 -1.7 -1.7Natural gas 21 44 66 100 86 86 82 10 23 22 3.3 -1.0 -0.2 -0.6Nuclear 22 53 84 2.5 58 56 56 12 0.6 15 -11.5 23.5 -0.2 9.3Hydro 7.6 7.5 7.3 7.3 7.9 8.1 8.1 1.7 1.7 2.2 -0.1 0.5 0.2 0.3Geothermal 0.8 1.6 3.1 2.4 6.7 9.9 14 0.4 0.6 3.7 1.7 7.1 3.6 5.1Solar, wind, etc. - 1.4 0.9 3.9 8.0 12 15 0.3 0.9 4.1 4.2 5.0 3.3 4.0Biomass and waste - 4.5 4.7 11 14 16 18 1.0 2.7 4.8 3.8 1.4 1.1 1.3
Final energy consumptionMtoe Shares (%) 1990/ 2015/ 2030/ 2015/
1980 1990 2000 2015 2030 2040 2050 1990 2015 2050 2015 2030 2050 2050
Total 232 287 328 291 267 249 231 100 100 100 0.1 -0.6 -0.7 -0.7Industry 91 110 100 82 81 80 77 38 28 33 -1.1 -0.1 -0.2 -0.2Transport 54 68 84 71 51 42 37 24 24 16 0.2 -2.2 -1.6 -1.8Buildings, etc. 58 76 103 99 98 90 81 26 34 35 1.1 -0.1 -0.9 -0.6Non-energy use 28 34 41 39 38 37 36 12 13 15 0.6 -0.2 -0.3 -0.3Coal 25 30 24 24 22 21 19 11 8.1 8.3 -1.0 -0.4 -0.8 -0.6Oil 157 171 194 152 120 102 89 59 52 38 -0.5 -1.6 -1.5 -1.5Natural gas 5.8 15 22 29 33 33 32 5.3 10 14 2.7 0.7 -0.1 0.2Electricity 44 66 83 82 88 88 86 23 28 37 0.8 0.5 -0.1 0.2Heat 0.1 0.2 0.5 0.5 0.5 0.4 0.4 0.1 0.2 0.2 3.8 -0.4 -1.3 -1.0Hydrogen - - - - 0.0 0.1 0.1 - - 0.0 n.a. n.a. 6.3 n.a.Renewables - 4.1 3.8 3.8 4.3 4.2 4.0 1.4 1.3 1.7 -0.2 0.7 -0.4 0.1
Electricity generation(TWh) Shares (%) 1990/ 2015/ 2030/ 2015/
1980 1990 2000 2015 2030 2040 2050 1990 2015 2050 2015 2030 2050 2050
Total 573 873 1,088 1,035 1,109 1,108 1,091 100 100 100 0.7 0.5 -0.1 0.1Coal 55 118 234 343 279 239 197 13 33 18 4.4 -1.4 -1.7 -1.6Oil 265 284 179 103 49 28 9.7 33 9.9 0.9 -4.0 -4.8 -7.8 -6.5Natural gas 81 171 254 410 313 315 302 20 40 28 3.6 -1.8 -0.2 -0.9Nuclear 83 202 322 9.4 224 215 215 23 0.9 20 -11.5 23.5 -0.2 9.3Hydro 88 87 85 85 92 94 94 10.0 8.2 8.7 -0.1 0.5 0.2 0.3Geothermal 0.9 1.7 3.3 2.6 7.6 11 16 0.2 0.2 1.4 1.6 7.5 3.7 5.3Solar PV - 0.0 0.3 36 72 107 131 0.0 3.5 12 52.1 4.8 3.0 3.8Wind - - 0.1 5.2 18 31 43 - 0.5 4.0 n.a. 8.5 4.6 6.3CSP and marine - - - - 0.1 0.3 0.8 - - 0.1 n.a. n.a. 11.9 n.a.Biomass and waste - 9.6 10 41 55 67 82 1.1 4.0 7.5 6.0 1.9 2.0 2.0Hydrogen - - - - - - - - - - n.a. n.a. n.a. n.a.
Energy and economic indicators1990/ 2015/ 2030/ 2015/
1980 1990 2000 2015 2030 2040 2050 2015 2030 2050 2050
GDP ($2010 billion) 2,977 4,683 5,349 5,986 6,948 7,705 8,329 1.0 1.0 0.9 0.9Population (million) 117 124 127 127 121 114 108 0.1 -0.3 -0.6 -0.5CO2 emissions (Mt) 916 1,071 1,195 1,147 925 811 691 0.3 -1.4 -1.4 -1.4GDP per capita ($2010 thousand) 25 38 42 47 58 67 77 0.9 1.3 1.5 1.4Primary energy consump. per capita (toe) 3.0 3.6 4.1 3.4 3.5 3.5 3.4 -0.2 0.3 -0.1 0.0Primary energy consumption per GDP*2 116 94 97 72 61 52 44 -1.1 -1.1 -1.6 -1.4CO2 emissions per GDP*3 308 229 223 192 133 105 83 -0.7 -2.4 -2.3 -2.4CO2 per primary energy consumption*4 2.7 2.4 2.3 2.7 2.2 2.0 1.9 0.4 -1.3 -0.7 -1.0*1 Trade of electricity, heat and hydrogen are not shown, *2 toe/$2010 million,*3 t/$2010 million, *4 t/toe
IEEJ:October 2017 © IEEJ2017
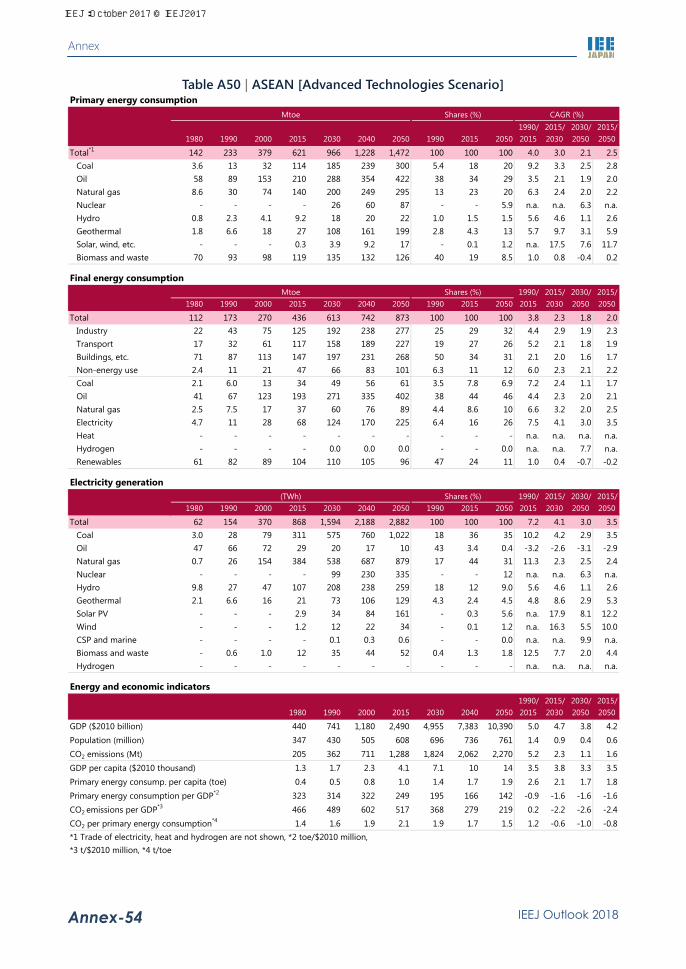
Annex
IEEJ Outlook 2018 Annex-54
Table A50 | ASEAN [Advanced Technologies Scenario] Primary energy consumption
Mtoe Shares (%) CAGR (%)1990/ 2015/ 2030/ 2015/
1980 1990 2000 2015 2030 2040 2050 1990 2015 2050 2015 2030 2050 2050
Total*1 142 233 379 621 966 1,228 1,472 100 100 100 4.0 3.0 2.1 2.5Coal 3.6 13 32 114 185 239 300 5.4 18 20 9.2 3.3 2.5 2.8Oil 58 89 153 210 288 354 422 38 34 29 3.5 2.1 1.9 2.0Natural gas 8.6 30 74 140 200 249 295 13 23 20 6.3 2.4 2.0 2.2Nuclear - - - - 26 60 87 - - 5.9 n.a. n.a. 6.3 n.a.Hydro 0.8 2.3 4.1 9.2 18 20 22 1.0 1.5 1.5 5.6 4.6 1.1 2.6Geothermal 1.8 6.6 18 27 108 161 199 2.8 4.3 13 5.7 9.7 3.1 5.9Solar, wind, etc. - - - 0.3 3.9 9.2 17 - 0.1 1.2 n.a. 17.5 7.6 11.7Biomass and waste 70 93 98 119 135 132 126 40 19 8.5 1.0 0.8 -0.4 0.2
Final energy consumptionMtoe Shares (%) 1990/ 2015/ 2030/ 2015/
1980 1990 2000 2015 2030 2040 2050 1990 2015 2050 2015 2030 2050 2050
Total 112 173 270 436 613 742 873 100 100 100 3.8 2.3 1.8 2.0Industry 22 43 75 125 192 238 277 25 29 32 4.4 2.9 1.9 2.3Transport 17 32 61 117 158 189 227 19 27 26 5.2 2.1 1.8 1.9Buildings, etc. 71 87 113 147 197 231 268 50 34 31 2.1 2.0 1.6 1.7Non-energy use 2.4 11 21 47 66 83 101 6.3 11 12 6.0 2.3 2.1 2.2Coal 2.1 6.0 13 34 49 56 61 3.5 7.8 6.9 7.2 2.4 1.1 1.7Oil 41 67 123 193 271 335 402 38 44 46 4.4 2.3 2.0 2.1Natural gas 2.5 7.5 17 37 60 76 89 4.4 8.6 10 6.6 3.2 2.0 2.5Electricity 4.7 11 28 68 124 170 225 6.4 16 26 7.5 4.1 3.0 3.5Heat - - - - - - - - - - n.a. n.a. n.a. n.a.Hydrogen - - - - 0.0 0.0 0.0 - - 0.0 n.a. n.a. 7.7 n.a.Renewables 61 82 89 104 110 105 96 47 24 11 1.0 0.4 -0.7 -0.2
Electricity generation(TWh) Shares (%) 1990/ 2015/ 2030/ 2015/
1980 1990 2000 2015 2030 2040 2050 1990 2015 2050 2015 2030 2050 2050
Total 62 154 370 868 1,594 2,188 2,882 100 100 100 7.2 4.1 3.0 3.5Coal 3.0 28 79 311 575 760 1,022 18 36 35 10.2 4.2 2.9 3.5Oil 47 66 72 29 20 17 10 43 3.4 0.4 -3.2 -2.6 -3.1 -2.9Natural gas 0.7 26 154 384 538 687 879 17 44 31 11.3 2.3 2.5 2.4Nuclear - - - - 99 230 335 - - 12 n.a. n.a. 6.3 n.a.Hydro 9.8 27 47 107 208 238 259 18 12 9.0 5.6 4.6 1.1 2.6Geothermal 2.1 6.6 16 21 73 106 129 4.3 2.4 4.5 4.8 8.6 2.9 5.3Solar PV - - - 2.9 34 84 161 - 0.3 5.6 n.a. 17.9 8.1 12.2Wind - - - 1.2 12 22 34 - 0.1 1.2 n.a. 16.3 5.5 10.0CSP and marine - - - - 0.1 0.3 0.6 - - 0.0 n.a. n.a. 9.9 n.a.Biomass and waste - 0.6 1.0 12 35 44 52 0.4 1.3 1.8 12.5 7.7 2.0 4.4Hydrogen - - - - - - - - - - n.a. n.a. n.a. n.a.
Energy and economic indicators1990/ 2015/ 2030/ 2015/
1980 1990 2000 2015 2030 2040 2050 2015 2030 2050 2050
GDP ($2010 billion) 440 741 1,180 2,490 4,955 7,383 10,390 5.0 4.7 3.8 4.2Population (million) 347 430 505 608 696 736 761 1.4 0.9 0.4 0.6CO2 emissions (Mt) 205 362 711 1,288 1,824 2,062 2,270 5.2 2.3 1.1 1.6GDP per capita ($2010 thousand) 1.3 1.7 2.3 4.1 7.1 10 14 3.5 3.8 3.3 3.5Primary energy consump. per capita (toe) 0.4 0.5 0.8 1.0 1.4 1.7 1.9 2.6 2.1 1.7 1.8Primary energy consumption per GDP*2 323 314 322 249 195 166 142 -0.9 -1.6 -1.6 -1.6CO2 emissions per GDP*3 466 489 602 517 368 279 219 0.2 -2.2 -2.6 -2.4CO2 per primary energy consumption*4 1.4 1.6 1.9 2.1 1.9 1.7 1.5 1.2 -0.6 -1.0 -0.8*1 Trade of electricity, heat and hydrogen are not shown, *2 toe/$2010 million,*3 t/$2010 million, *4 t/toe
IEEJ:October 2017 © IEEJ2017

Annex
IEEJ Outlook 2018 Annex-55
Table A51 | United States [Advanced Technologies Scenario] Primary energy consumption
Mtoe Shares (%) CAGR (%)1990/ 2015/ 2030/ 2015/
1980 1990 2000 2015 2030 2040 2050 1990 2015 2050 2015 2030 2050 2050
Total*1 1,805 1,915 2,273 2,188 2,037 1,917 1,800 100 100 100 0.5 -0.5 -0.6 -0.6Coal 376 460 534 374 225 144 73 24 17 4.1 -0.8 -3.3 -5.5 -4.6Oil 797 757 871 794 644 543 460 40 36 26 0.2 -1.4 -1.7 -1.5Natural gas 477 438 548 646 664 643 558 23 30 31 1.6 0.2 -0.9 -0.4Nuclear 69 159 208 216 209 207 236 8.3 9.9 13 1.2 -0.2 0.6 0.3Hydro 24 23 22 22 25 26 26 1.2 1.0 1.4 -0.3 1.1 0.1 0.5Geothermal 4.6 14 13 9.0 33 43 51 0.7 0.4 2.8 -1.8 9.1 2.1 5.1Solar, wind, etc. - 0.3 2.1 22 91 151 223 0.0 1.0 12 18.5 9.8 4.6 6.8Biomass and waste 54 62 73 99 140 155 168 3.3 4.5 9.3 1.9 2.3 0.9 1.5
Final energy consumptionMtoe Shares (%) 1990/ 2015/ 2030/ 2015/
1980 1990 2000 2015 2030 2040 2050 1990 2015 2050 2015 2030 2050 2050
Total 1,311 1,294 1,546 1,520 1,432 1,352 1,269 100 100 100 0.6 -0.4 -0.6 -0.5Industry 387 284 332 262 255 243 221 22 17 17 -0.3 -0.2 -0.7 -0.5Transport 425 488 588 629 535 475 437 38 41 34 1.0 -1.1 -1.0 -1.0Buildings, etc. 397 403 473 506 505 493 473 31 33 37 0.9 0.0 -0.3 -0.2Non-energy use 102 119 153 123 137 142 139 9.2 8.1 11 0.1 0.7 0.1 0.3Coal 56 56 33 20 16 14 11 4.3 1.3 0.9 -4.1 -1.2 -1.8 -1.5Oil 689 683 793 758 622 527 451 53 50 36 0.4 -1.3 -1.6 -1.5Natural gas 337 303 360 333 332 321 300 23 22 24 0.4 0.0 -0.5 -0.3Electricity 174 226 301 325 354 373 383 18 21 30 1.5 0.6 0.4 0.5Heat - 2.2 5.3 5.5 5.9 6.0 5.7 0.2 0.4 0.5 3.8 0.5 -0.1 0.1Hydrogen - - - - 0.1 0.2 0.6 - - 0.0 n.a. n.a. 11.5 n.a.Renewables 54 23 54 79 102 111 118 1.8 5.2 9.3 5.1 1.7 0.7 1.1
Electricity generation(TWh) Shares (%) 1990/ 2015/ 2030/ 2015/
1980 1990 2000 2015 2030 2040 2050 1990 2015 2050 2015 2030 2050 2050
Total 2,427 3,203 4,026 4,297 4,655 4,860 4,946 100 100 100 1.2 0.5 0.3 0.4Coal 1,243 1,700 2,129 1,471 867 516 204 53 34 4.1 -0.6 -3.5 -7.0 -5.5Oil 263 131 118 39 22 13 4.8 4.1 0.9 0.1 -4.7 -3.6 -7.4 -5.8Natural gas 370 382 634 1,373 1,551 1,518 1,159 12 32 23 5.3 0.8 -1.4 -0.5Nuclear 266 612 798 830 801 792 907 19 19 18 1.2 -0.2 0.6 0.3Hydro 279 273 253 251 295 298 300 8.5 5.8 6.1 -0.3 1.1 0.1 0.5Geothermal 5.4 16 15 19 71 91 108 0.5 0.4 2.2 0.6 9.3 2.2 5.1Solar PV - 0.0 0.2 32 171 316 448 0.0 0.7 9.1 44.9 11.8 4.9 7.8Wind - 3.1 5.7 193 611 906 1,205 0.1 4.5 24 18.0 8.0 3.5 5.4CSP and marine - 0.7 0.5 9.1 109 218 388 0.0 0.2 7.8 11.0 18.0 6.6 11.3Biomass and waste 0.5 86 72 80 156 190 221 2.7 1.9 4.5 -0.3 4.5 1.8 2.9Hydrogen - - - - - - - - - - n.a. n.a. n.a. n.a.
Energy and economic indicators1990/ 2015/ 2030/ 2015/
1980 1990 2000 2015 2030 2040 2050 2015 2030 2050 2050
GDP ($2010 billion) 6,529 9,064 12,713 16,597 22,629 27,677 32,902 2.4 2.1 1.9 2.0Population (million) 227 250 282 321 356 376 391 1.0 0.7 0.5 0.6CO2 emissions (Mt) 4,744 4,820 5,617 5,071 3,931 3,141 2,422 0.2 -1.7 -2.4 -2.1GDP per capita ($2010 thousand) 29 36 45 52 64 74 84 1.4 1.4 1.4 1.4Primary energy consump. per capita (toe) 7.9 7.7 8.1 6.8 5.7 5.1 4.6 -0.5 -1.2 -1.1 -1.1Primary energy consumption per GDP*2 276 211 179 132 90 69 55 -1.9 -2.5 -2.5 -2.5CO2 emissions per GDP*3 727 532 442 305 174 114 74 -2.2 -3.7 -4.2 -4.0CO2 per primary energy consumption*4 2.6 2.5 2.5 2.3 1.9 1.6 1.3 -0.3 -1.2 -1.8 -1.5*1 Trade of electricity, heat and hydrogen are not shown, *2 toe/$2010 million,*3 t/$2010 million, *4 t/toe
IEEJ:October 2017 © IEEJ2017
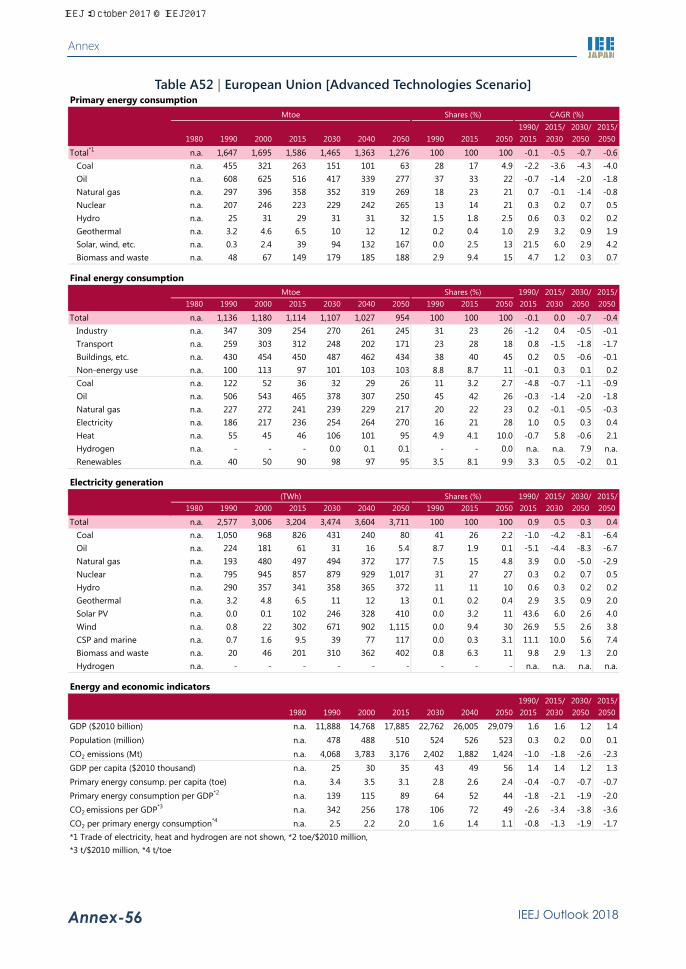
Annex
IEEJ Outlook 2018 Annex-56
Table A52 | European Union [Advanced Technologies Scenario] Primary energy consumption
Mtoe Shares (%) CAGR (%)1990/ 2015/ 2030/ 2015/
1980 1990 2000 2015 2030 2040 2050 1990 2015 2050 2015 2030 2050 2050
Total*1 n.a. 1,647 1,695 1,586 1,465 1,363 1,276 100 100 100 -0.1 -0.5 -0.7 -0.6Coal n.a. 455 321 263 151 101 63 28 17 4.9 -2.2 -3.6 -4.3 -4.0Oil n.a. 608 625 516 417 339 277 37 33 22 -0.7 -1.4 -2.0 -1.8Natural gas n.a. 297 396 358 352 319 269 18 23 21 0.7 -0.1 -1.4 -0.8Nuclear n.a. 207 246 223 229 242 265 13 14 21 0.3 0.2 0.7 0.5Hydro n.a. 25 31 29 31 31 32 1.5 1.8 2.5 0.6 0.3 0.2 0.2Geothermal n.a. 3.2 4.6 6.5 10 12 12 0.2 0.4 1.0 2.9 3.2 0.9 1.9Solar, wind, etc. n.a. 0.3 2.4 39 94 132 167 0.0 2.5 13 21.5 6.0 2.9 4.2Biomass and waste n.a. 48 67 149 179 185 188 2.9 9.4 15 4.7 1.2 0.3 0.7
Final energy consumptionMtoe Shares (%) 1990/ 2015/ 2030/ 2015/
1980 1990 2000 2015 2030 2040 2050 1990 2015 2050 2015 2030 2050 2050
Total n.a. 1,136 1,180 1,114 1,107 1,027 954 100 100 100 -0.1 0.0 -0.7 -0.4Industry n.a. 347 309 254 270 261 245 31 23 26 -1.2 0.4 -0.5 -0.1Transport n.a. 259 303 312 248 202 171 23 28 18 0.8 -1.5 -1.8 -1.7Buildings, etc. n.a. 430 454 450 487 462 434 38 40 45 0.2 0.5 -0.6 -0.1Non-energy use n.a. 100 113 97 101 103 103 8.8 8.7 11 -0.1 0.3 0.1 0.2Coal n.a. 122 52 36 32 29 26 11 3.2 2.7 -4.8 -0.7 -1.1 -0.9Oil n.a. 506 543 465 378 307 250 45 42 26 -0.3 -1.4 -2.0 -1.8Natural gas n.a. 227 272 241 239 229 217 20 22 23 0.2 -0.1 -0.5 -0.3Electricity n.a. 186 217 236 254 264 270 16 21 28 1.0 0.5 0.3 0.4Heat n.a. 55 45 46 106 101 95 4.9 4.1 10.0 -0.7 5.8 -0.6 2.1Hydrogen n.a. - - - 0.0 0.1 0.1 - - 0.0 n.a. n.a. 7.9 n.a.Renewables n.a. 40 50 90 98 97 95 3.5 8.1 9.9 3.3 0.5 -0.2 0.1
Electricity generation(TWh) Shares (%) 1990/ 2015/ 2030/ 2015/
1980 1990 2000 2015 2030 2040 2050 1990 2015 2050 2015 2030 2050 2050
Total n.a. 2,577 3,006 3,204 3,474 3,604 3,711 100 100 100 0.9 0.5 0.3 0.4Coal n.a. 1,050 968 826 431 240 80 41 26 2.2 -1.0 -4.2 -8.1 -6.4Oil n.a. 224 181 61 31 16 5.4 8.7 1.9 0.1 -5.1 -4.4 -8.3 -6.7Natural gas n.a. 193 480 497 494 372 177 7.5 15 4.8 3.9 0.0 -5.0 -2.9Nuclear n.a. 795 945 857 879 929 1,017 31 27 27 0.3 0.2 0.7 0.5Hydro n.a. 290 357 341 358 365 372 11 11 10 0.6 0.3 0.2 0.2Geothermal n.a. 3.2 4.8 6.5 11 12 13 0.1 0.2 0.4 2.9 3.5 0.9 2.0Solar PV n.a. 0.0 0.1 102 246 328 410 0.0 3.2 11 43.6 6.0 2.6 4.0Wind n.a. 0.8 22 302 671 902 1,115 0.0 9.4 30 26.9 5.5 2.6 3.8CSP and marine n.a. 0.7 1.6 9.5 39 77 117 0.0 0.3 3.1 11.1 10.0 5.6 7.4Biomass and waste n.a. 20 46 201 310 362 402 0.8 6.3 11 9.8 2.9 1.3 2.0Hydrogen n.a. - - - - - - - - - n.a. n.a. n.a. n.a.
Energy and economic indicators1990/ 2015/ 2030/ 2015/
1980 1990 2000 2015 2030 2040 2050 2015 2030 2050 2050
GDP ($2010 billion) n.a. 11,888 14,768 17,885 22,762 26,005 29,079 1.6 1.6 1.2 1.4Population (million) n.a. 478 488 510 524 526 523 0.3 0.2 0.0 0.1CO2 emissions (Mt) n.a. 4,068 3,783 3,176 2,402 1,882 1,424 -1.0 -1.8 -2.6 -2.3GDP per capita ($2010 thousand) n.a. 25 30 35 43 49 56 1.4 1.4 1.2 1.3Primary energy consump. per capita (toe) n.a. 3.4 3.5 3.1 2.8 2.6 2.4 -0.4 -0.7 -0.7 -0.7Primary energy consumption per GDP*2 n.a. 139 115 89 64 52 44 -1.8 -2.1 -1.9 -2.0CO2 emissions per GDP*3 n.a. 342 256 178 106 72 49 -2.6 -3.4 -3.8 -3.6CO2 per primary energy consumption*4 n.a. 2.5 2.2 2.0 1.6 1.4 1.1 -0.8 -1.3 -1.9 -1.7*1 Trade of electricity, heat and hydrogen are not shown, *2 toe/$2010 million,*3 t/$2010 million, *4 t/toe
IEEJ:October 2017 © IEEJ2017

Annex
IEEJ Outlook 2018 Annex-57
Table A53 | World [Peak Oil Demand Case] Primary energy consumption
Mtoe Shares (%) CAGR (%)1990/ 2015/ 2030/ 2015/
1980 1990 2000 2015 2030 2040 2050 1990 2015 2050 2015 2030 2050 2050
Total*1 7,205 8,774 10,028 13,647 16,333 17,888 19,115 100 100 100 1.8 1.2 0.8 1.0Coal 1,783 2,220 2,311 3,836 4,317 4,701 4,963 25 28 26 2.2 0.8 0.7 0.7Oil 3,102 3,235 3,660 4,334 4,702 4,585 4,254 37 32 22 1.2 0.5 -0.5 -0.1Natural gas 1,232 1,663 2,071 2,944 3,892 4,779 5,765 19 22 30 2.3 1.9 2.0 1.9Nuclear 186 526 676 671 907 980 1,055 6.0 4.9 5.5 1.0 2.0 0.8 1.3Hydro 148 184 225 334 425 466 500 2.1 2.5 2.6 2.4 1.6 0.8 1.2Geothermal 12 34 52 74 177 224 257 0.4 0.5 1.3 3.1 6.0 1.9 3.6Solar, wind, etc. 0.1 2.7 8.0 126 306 446 608 0.0 0.9 3.2 16.7 6.1 3.5 4.6Biomass and waste 741 909 1,023 1,323 1,604 1,702 1,708 10 9.7 8.9 1.5 1.3 0.3 0.7
Final energy consumptionMtoe Shares (%) 1990/ 2015/ 2030/ 2015/
1980 1990 2000 2015 2030 2040 2050 1990 2015 2050 2015 2030 2050 2050
Total 5,368 6,268 7,036 9,384 11,057 11,878 12,446 100 100 100 1.6 1.1 0.6 0.8Industry 1,766 1,809 1,868 2,712 3,146 3,499 3,779 29 29 30 1.6 1.0 0.9 1.0Transport 1,248 1,573 1,961 2,703 2,940 2,787 2,530 25 29 20 2.2 0.6 -0.7 -0.2Buildings, etc. 2,000 2,409 2,591 3,132 3,911 4,369 4,785 38 33 38 1.1 1.5 1.0 1.2Non-energy use 354 478 617 836 1,060 1,223 1,352 7.6 8.9 11 2.3 1.6 1.2 1.4Coal 703 754 548 1,044 1,096 1,122 1,108 12 11 8.9 1.3 0.3 0.1 0.2Oil 2,446 2,599 3,115 3,840 4,200 4,074 3,757 41 41 30 1.6 0.6 -0.6 -0.1Natural gas 814 945 1,117 1,401 1,761 1,994 2,190 15 15 18 1.6 1.5 1.1 1.3Electricity 586 835 1,092 1,737 2,418 3,035 3,736 13 19 30 3.0 2.2 2.2 2.2Heat 121 336 248 271 288 297 299 5.4 2.9 2.4 -0.9 0.4 0.2 0.3Hydrogen - - - - 2.9 13 47 - - 0.4 n.a. n.a. 15.0 n.a.Renewables 698 799 917 1,090 1,291 1,343 1,309 13 12 11 1.3 1.1 0.1 0.5
Electricity generation(TWh) Shares (%) 1990/ 2015/ 2030/ 2015/
1980 1990 2000 2015 2030 2040 2050 1990 2015 2050 2015 2030 2050 2050
Total 8,283 11,864 15,471 24,255 33,589 41,618 50,430 100 100 100 2.9 2.2 2.1 2.1Coal 3,137 4,425 6,005 9,538 12,031 14,145 16,055 37 39 32 3.1 1.6 1.5 1.5Oil 1,659 1,358 1,252 990 1,047 1,147 1,187 11 4.1 2.4 -1.3 0.4 0.6 0.5Natural gas 999 1,752 2,753 5,543 8,244 11,698 16,106 15 23 32 4.7 2.7 3.4 3.1Nuclear 713 2,013 2,591 2,571 3,480 3,759 4,047 17 11 8.0 1.0 2.0 0.8 1.3Hydro 1,717 2,142 2,619 3,888 4,943 5,419 5,818 18 16 12 2.4 1.6 0.8 1.2Geothermal 14 36 52 80 191 245 288 0.3 0.3 0.6 3.2 5.9 2.1 3.7Solar PV - 0.0 1.0 247 751 1,154 1,667 0.0 1.0 3.3 45.5 7.7 4.1 5.6Wind 0.0 3.9 31 838 1,891 2,710 3,585 0.0 3.5 7.1 24.0 5.6 3.3 4.2CSP and marine 0.5 1.5 2.2 27 136 237 385 0.0 0.1 0.8 12.2 11.5 5.3 7.9Biomass and waste 44 131 164 528 872 1,099 1,287 1.1 2.2 2.6 5.7 3.4 2.0 2.6Hydrogen - - - - - - - - - - n.a. n.a. n.a. n.a.
Energy and economic indicators1990/ 2015/ 2030/ 2015/
1980 1990 2000 2015 2030 2040 2050 2015 2030 2050 2050
GDP ($2010 billion) 27,958 37,797 49,825 75,059 115,303 152,089 191,400 2.8 2.9 2.6 2.7Population (million) 4,436 5,277 6,108 7,336 8,497 9,152 9,710 1.3 1.0 0.7 0.8CO2 emissions (Mt) 18,411 21,205 23,416 32,910 37,506 40,282 42,261 1.8 0.9 0.6 0.7GDP per capita ($2010 thousand) 6.3 7.2 8.2 10 14 17 20 1.4 1.9 1.9 1.9Primary energy consump. per capita (toe) 1.6 1.7 1.6 1.9 1.9 2.0 2.0 0.5 0.2 0.1 0.2Primary energy consumption per GDP*2 258 232 201 182 142 118 100 -1.0 -1.7 -1.7 -1.7CO2 emissions per GDP*3 659 561 470 438 325 265 221 -1.0 -2.0 -1.9 -1.9CO2 per primary energy consumption*4 2.6 2.4 2.3 2.4 2.3 2.3 2.2 0.0 -0.3 -0.2 -0.2*1 Trade of electricity, heat and hydrogen are not shown, *2 toe/$2010 million,*3 t/$2010 million, *4 t/toe
IEEJ:October 2017 © IEEJ2017
Contact :[email protected]