illicit discharge detection & elimination (idde)
TRANSCRIPT
Illicit Discharge Detection & Elimination
(IDDE)
Field Investigation Guide
2011
North Central Texas
TABLE OF CONTENTS
i
Preparing for a Field Inspection
Field Inspection Checklist 1
Illicit Flow Detection Process 2
Land Use Examples 3
Physical Indicators
Flow 4
Color 4
Odor 6
Turbidity 7
Sewage, Sheens & Scum 7
Outfall Condition 10
Outfall Classifications 11
Biological Indicators
Vegetation 12
Algae 12
Bacteria 12
Fish Kills 12
Aquatic Life 12
Chemical Indicators
Water Temperature 13
Celsius/Fahrenheit Conversion 13
Tier I Parameters 14
Tier II Parameters 15
Tracing Illicit Discharges
Storm Drain Network Investigations 17
Intermittent Discharges 18
On-Site Investigations 19
Plants & Snakes to Avoid
Poison Ivy 20
Poison Oak & Poison Sumac 21
Copperhead, Coral, 22
Cottonmouth & Rattlesnake
Important Contacts 23
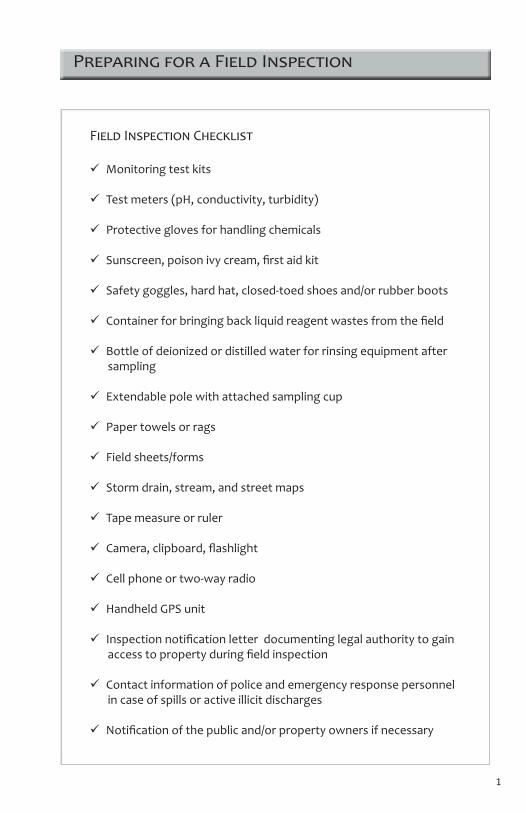
Field Inspection Checklist
Monitoring test kits Test meters (pH, conductivity, turbidity)
Protective gloves for handling chemicals
Sunscreen, poison ivy cream, first aid kit
Safety goggles, hard hat, closed-toed shoes and/or rubber boots
Container for bringing back liquid reagent wastes from the field
Bottle of deionized or distilled water for rinsing equipment after sampling
Extendable pole with attached sampling cup
Paper towels or rags
Field sheets/forms
Storm drain, stream, and street maps
Tape measure or ruler
Camera, clipboard, flashlight
Cell phone or two-way radio
Handheld GPS unit
Inspection notification letter documenting legal authority to gain access to property during field inspection
Contact information of police and emergency response personnel in case of spills or active illicit discharges
Notification of the public and/or property owners if necessary
Preparing for a Field Inspection
1
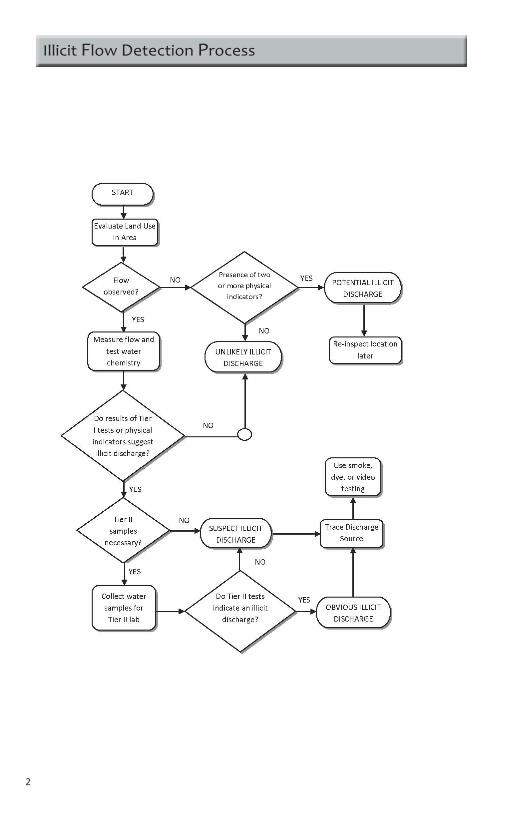
Illicit Flow Detection Process
2
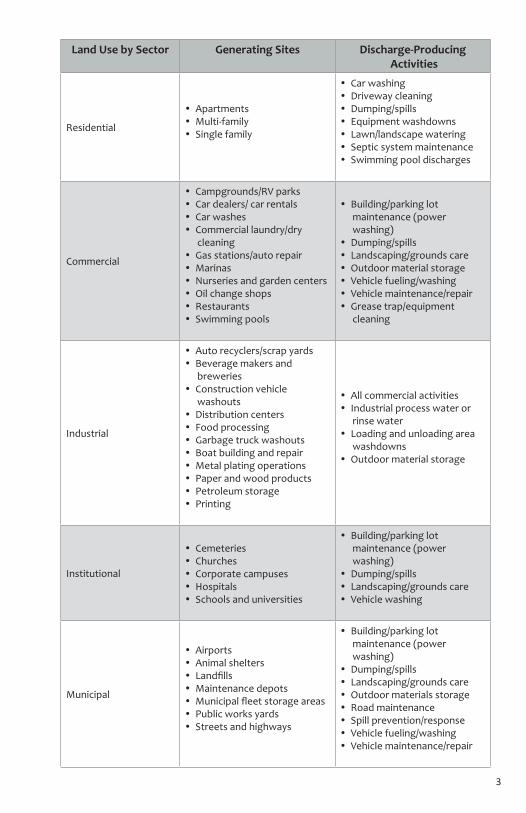
Land Use by Sector Generating Sites Discharge-Producing Activities
Residential
Apartments Multi-family Single family
Car washing Driveway cleaning Dumping/spills Equipment washdowns Lawn/landscape watering Septic system maintenance Swimming pool discharges
Commercial
Campgrounds/RV parks Car dealers/ car rentals Car washes Commercial laundry/dry
cleaning Gas stations/auto repair Marinas Nurseries and garden centers Oil change shops Restaurants Swimming pools
Building/parking lot maintenance (power washing)
Dumping/spills Landscaping/grounds care Outdoor material storage Vehicle fueling/washing Vehicle maintenance/repair Grease trap/equipment
cleaning
Industrial
Auto recyclers/scrap yards Beverage makers and
breweries Construction vehicle
washouts Distribution centers Food processing Garbage truck washouts Boat building and repair Metal plating operations Paper and wood products Petroleum storage Printing
All commercial activities Industrial process water or
rinse water Loading and unloading area
washdowns Outdoor material storage
Institutional
Cemeteries Churches Corporate campuses Hospitals Schools and universities
Building/parking lot maintenance (power washing)
Dumping/spills Landscaping/grounds care Vehicle washing
Municipal
Airports Animal shelters Landfills Maintenance depots Municipal fleet storage areas Public works yards Streets and highways
Building/parking lot maintenance (power washing)
Dumping/spills Landscaping/grounds care Outdoor materials storage Road maintenance Spill prevention/response Vehicle fueling/washing Vehicle maintenance/repair
3
Physical indicators are those that can be observed or sensed during dry weather field screenings and routine inspections. They can include the presence of unusual flow, color, odor, turbidity, and floatable liquids and solids.
Flow
Record whether there is a presence or absence of flow at the site.
Note: to measure flow, mark off a fixed flow length (about five feet) and drop a floatable object (i.e., stick, ping-pong ball, or cork) into the flow. Record the time it takes the object to travel the fixed length then calculate velocity (feet per second or ft/s).
Color
Collect a sample of the discharge in a clear test tube or sampling bottle.
Note: do not try to assess water color by looking directly into the waterway. Water depth, substrate composition, aquatic plants, and sky conditions can all influence your perception of the water color.
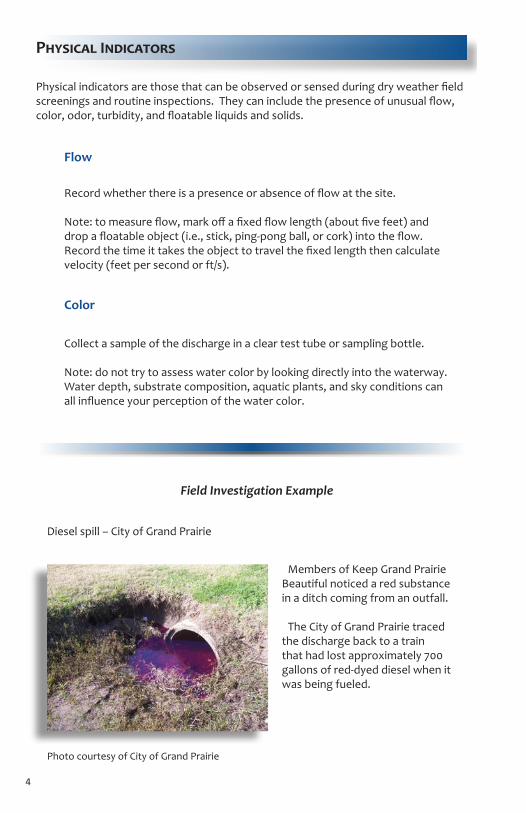
Field Investigation Example
Diesel spill – City of Grand Prairie
Members of Keep Grand Prairie Beautiful noticed a red substance in a ditch coming from an outfall.
The City of Grand Prairie traced the discharge back to a train that had lost approximately 700 gallons of red-dyed diesel when it was being fueled.
Photo courtesy of City of Grand Prairie
Physical Indicators
4
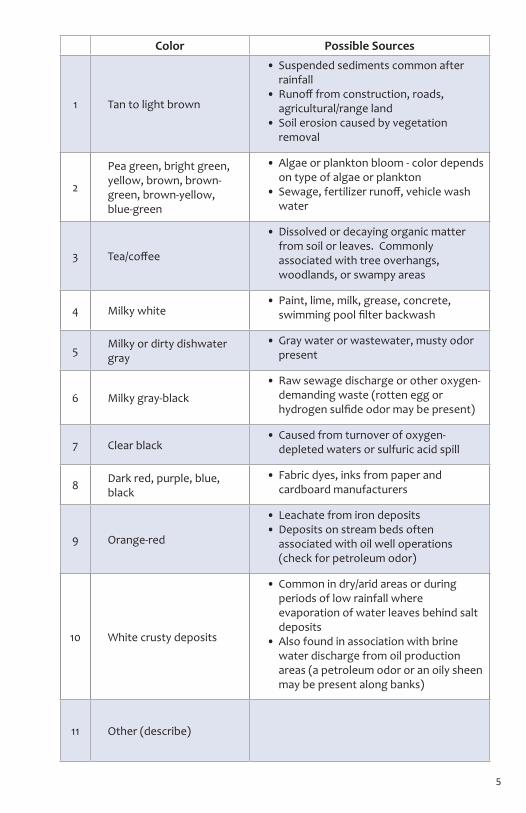
Color Possible Sources
1 Tan to light brown
Suspended sediments common after • rainfall Runoff from construction, roads, • agricultural/range landSoil erosion caused by vegetation • removal
2
Pea green, bright green, yellow, brown, brown-green, brown-yellow, blue-green
Algae or plankton bloom - color depends • on type of algae or plankton Sewage, fertilizer runoff, vehicle wash • water
3 Tea/coffee
Dissolved or decaying organic matter • from soil or leaves. Commonly associated with tree overhangs, woodlands, or swampy areas
4 Milky whitePaint, lime, milk, grease, concrete, • swimming pool filter backwash
5 Milky or dirty dishwater gray
Gray water or wastewater, musty odor • present
6 Milky gray-blackRaw sewage discharge or other oxygen-• demanding waste (rotten egg or hydrogen sulfide odor may be present)
7 Clear blackCaused from turnover of oxygen-• depleted waters or sulfuric acid spill
8 Dark red, purple, blue, black
Fabric dyes, inks from paper and • cardboard manufacturers
9 Orange-red
Leachate from iron deposits• Deposits on stream beds often • associated with oil well operations (check for petroleum odor)
10 White crusty deposits
Common in dry/arid areas or during • periods of low rainfall where evaporation of water leaves behind salt depositsAlso found in association with brine • water discharge from oil production areas (a petroleum odor or an oily sheen may be present along banks)
11 Other (describe)
5
Odor
Fill sample bottle at least halfway with sample water and hold about six inches away from your nose. Use your free hand to fan the scent to your nose.
Note: never inhale the air directly off the top of a sample as many potential contaminants are harmful to nasal membranes and lung tissue. Make sure that the origin of the odor is at the outfall. Sometimes shrubs, trash, or even spray paint used to mark the outfalls can confuse the nose.
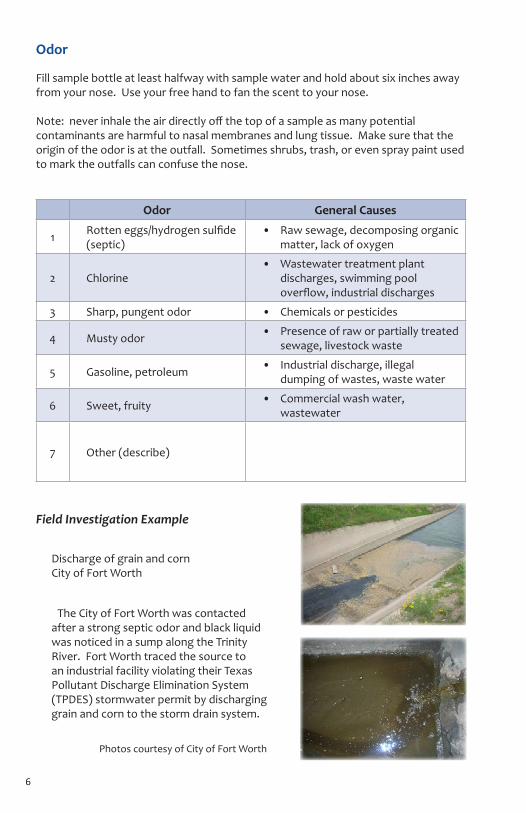
Field Investigation Example
Discharge of grain and corn City of Fort Worth
The City of Fort Worth was contacted after a strong septic odor and black liquid was noticed in a sump along the Trinity River. Fort Worth traced the source to an industrial facility violating their Texas Pollutant Discharge Elimination System (TPDES) stormwater permit by discharging grain and corn to the storm drain system.
Photos courtesy of City of Fort Worth
Odor General Causes
1 Rotten eggs/hydrogen sulfide (septic)
Raw sewage, decomposing organic • matter, lack of oxygen
2 ChlorineWastewater treatment plant • discharges, swimming pool overflow, industrial discharges
3 Sharp, pungent odor Chemicals or pesticides•
4 Musty odor Presence of raw or partially treated • sewage, livestock waste
5 Gasoline, petroleum Industrial discharge, illegal • dumping of wastes, waste water
6 Sweet, fruity Commercial wash water, • wastewater
7 Other (describe)
6

Turbidity
Causes of High Turbidity
Soil erosion
Runoff from a rain event
Algae blooms
Bottom sediment disturbances by aquatic life
Construction or dredging
If highly turbid (cloudy) water is observed, make sure to look upstream and downstream to see if anything around the site has changed since the last field inspection. An illicit discharge may be present if a highly turbid flow exists.
Note: to measure turbidity, collect a water sample and use a Secchi tube, turbidity meter, or turbidity comparator in the field sampling kit.
Sewage, Sheens & Surface Scum
Contaminated flows may contain floatable solids or liquids. Sewage, oil sheen, and suds/foam are examples of floatable indicators. Trash and debris, although more typically known as “floatables,” are not generally indicators of illicit flow.
Sheens can be naturally-produced or synthetic; oil sheens are often mistaken for naturally-produced sheen.
Sheen from bacteria forms a sheet-like film that breaks if disturbed. (See photos page 9)
Suds should be rated based on their foaminess and staying power.
Suds that travel several feet before breaking up should be considered as a possible illicit discharge.
In some cases, foam and suds can give off an odor.
A strong organic or sewage-like odor can indicate a sanitary sewer leak or overflow.
A fragrant or sweet smelling odor can indicate the presence of laundry water or similar wash waters.
7
Surface Scum General Causes
Tan foam
Usually associated with high flow or wave action; wind action plus flow churns water containing organic materials causing harmless foam; produces small patches to very large clumps.
White foamSometimes patchy or covering wide area around wastewater outfall, thin and billowy, mostly due to soap.
Yellow, brown, black film
Pine, cedar, and oak pollens form film on surface, especially in ponds, backwater areas, or slow moving water in streams.
Rainbow film
If a swirling pattern, then likely oil or other fuel type. Check for petroleum odor. If sheet-like and cracks if disturbed, then it is natural.
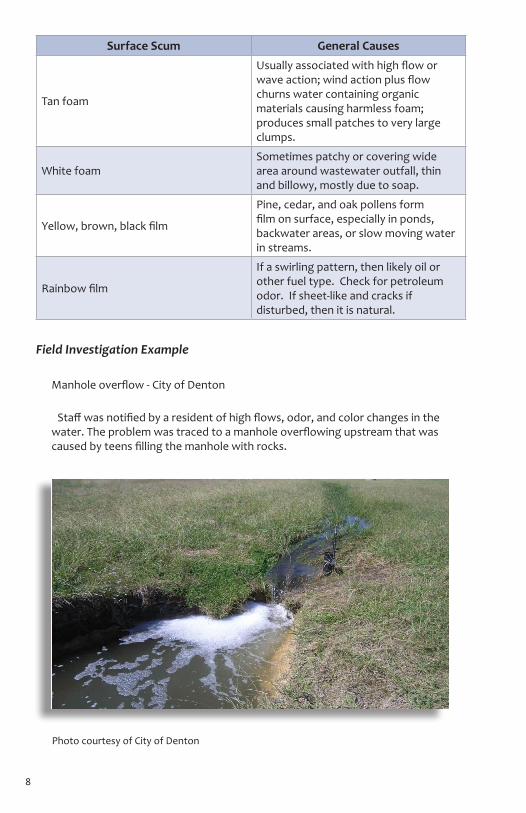
Manhole overflow - City of Denton
Photo courtesy of City of Denton
Staff was notified by a resident of high flows, odor, and color changes in the water. The problem was traced to a manhole overflowing upstream that was caused by teens filling the manhole with rocks.
Field Investigation Example
8
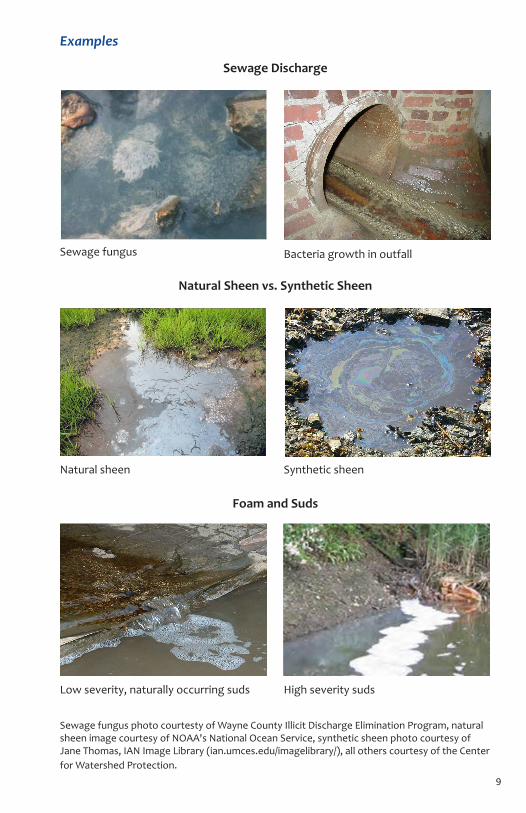
Sewage fungus photo courtesty of Wayne County Illicit Discharge Elimination Program, natural sheen image courtesy of NOAA's National Ocean Service, synthetic sheen photo courtesy of Jane Thomas, IAN Image Library (ian.umces.edu/imagelibrary/), all others courtesy of the Center for Watershed Protection.
Sewage Discharge
Sewage fungus Bacteria growth in outfall
Natural Sheen vs. Synthetic Sheen
Natural sheen Synthetic sheen
Foam and Suds
Low severity, naturally occurring suds High severity suds
9
Examples
Outfall Condition
The physical condition of an outfall can provide strong clues about the history of discharges passing through it.
Over time, intermittent discharges can cause outfall damage or leave behind remnants in the form of deposits or stains which can help an inspector determine what type of discharge traveled through the area.
Field inspectors should document that a deposit or stain is present even if there is no dry weather discharge observed.
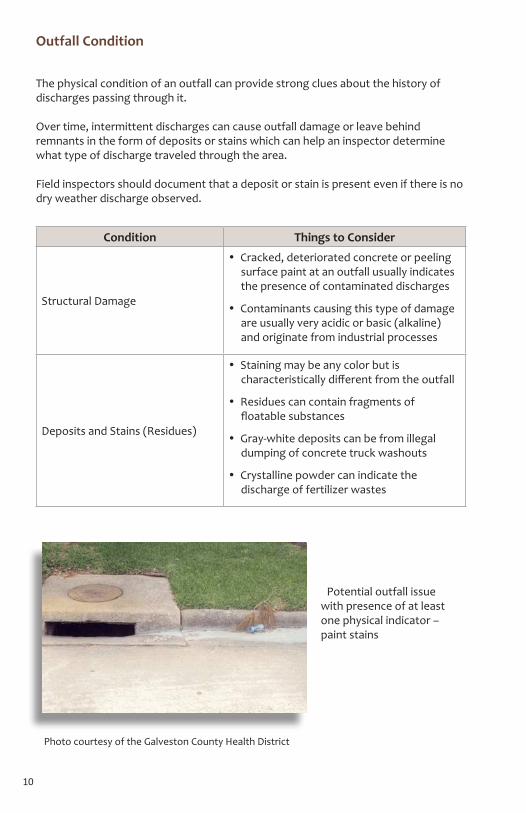
Potential outfall issue with presence of at least one physical indicator – paint stains
Photo courtesy of the Galveston County Health District
Condition Things to Consider
Structural Damage
Cracked, deteriorated concrete or peeling surface paint at an outfall usually indicates the presence of contaminated discharges
Contaminants causing this type of damage are usually very acidic or basic (alkaline) and originate from industrial processes
Deposits and Stains (Residues)
Staining may be any color but is characteristically different from the outfall
Residues can contain fragments of floatable substances
Gray-white deposits can be from illegal dumping of concrete truck washouts
Crystalline powder can indicate the discharge of fertilizer wastes
10
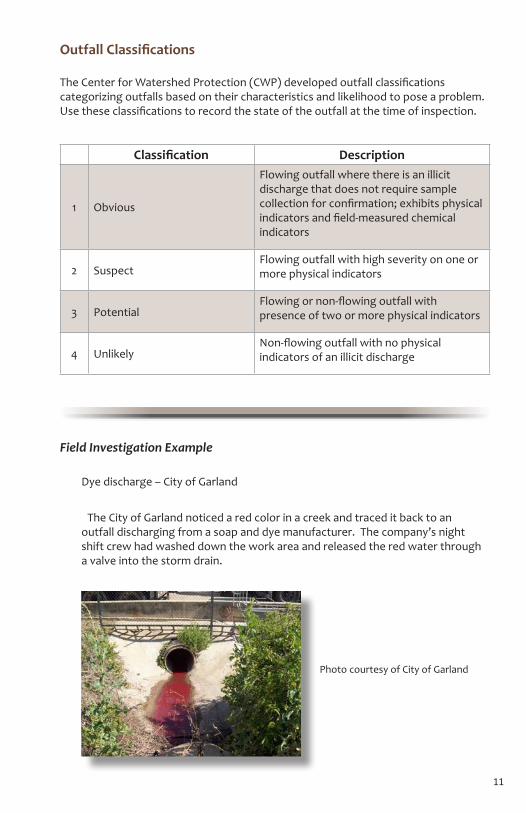
Field Investigation Example
Dye discharge – City of Garland
The City of Garland noticed a red color in a creek and traced it back to an outfall discharging from a soap and dye manufacturer. The company’s night shift crew had washed down the work area and released the red water through a valve into the storm drain.
Photo courtesy of City of Garland
Outfall Classifications
The Center for Watershed Protection (CWP) developed outfall classifications categorizing outfalls based on their characteristics and likelihood to pose a problem. Use these classifications to record the state of the outfall at the time of inspection.
Classification Description
1 Obvious
Flowing outfall where there is an illicit discharge that does not require sample collection for confirmation; exhibits physical indicators and field-measured chemical indicators
2 SuspectFlowing outfall with high severity on one or more physical indicators
3 PotentialFlowing or non-flowing outfall with presence of two or more physical indicators
4 UnlikelyNon-flowing outfall with no physical indicators of an illicit discharge
11

Biological Indicators
Biological indicators include things that live and grow. The biological indicators that should be investigated during a field inspection are: the condition of the surrounding vegetation, algae growth, amount and types of bacteria, fish kills, and the presence or absence of certain aquatic organisms.
Biological Indicators Things to Consider
Vegetation
Seasonal and recent weather conditions should be considered to accurately determine if the vegetation near an outfall is normal or abnormal. Increased or inhibited plant growth, as well as dead and decaying plants, near stormwater outfalls is often a sign of pollution.
Algae
An overabundance of nutrients can cause elevated plant growth or algae blooms. During an algae bloom, the water body typically becomes a pea-green color; however, the color depends on the dominant species of algae present.
Bacteria
The amount and types of bacteria present can be extremely significant. Bacteria can be associated with inadequately treated sewage, sanitary sewer overflows, improperly managed waste from livestock, failing septic systems, and pets and wildlife (e.g., birds nesting under a bridge). Although some types of bacteria are visible to the naked eye – such as sewage fungus or natural sheen, counts for indicators like E. coli are done in the laboratory.
Fish Kills
Fish kills can be caused by a wide variety of factors including a decrease in dissolved oxygen, infectious disease, a rise in water temperature, toxic algae blooms, parasites, and bacterial or viral infections. The loss of a single fish is typically a natural occurrence and is not usually a cause for concern.
Presence or Absence of Aquatic Life
The presence or absence of aquatic life in and around a water body can be an indicator of the health of the water body. Field inspectors should document whether or not they observe aquatic life at the time of inspection.
12
Chemical Indicators
Most chemical parameters have a test kit or meter available to determine the level of the pollutant.
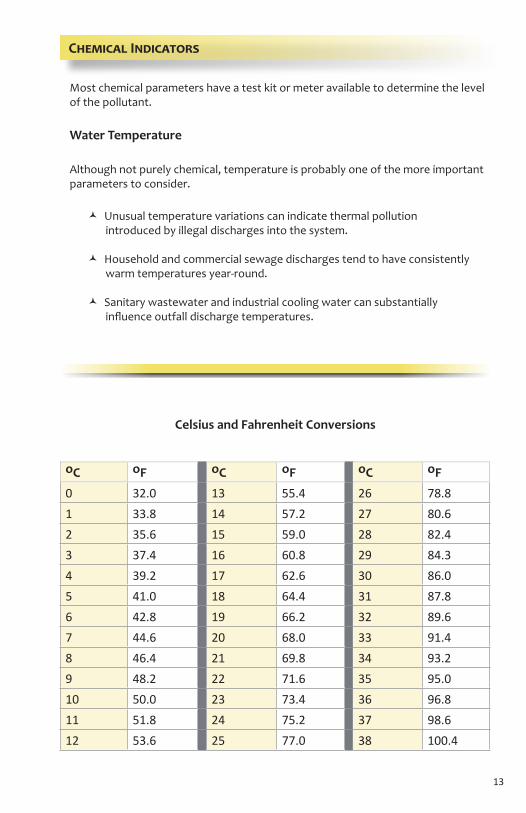
Water Temperature
Although not purely chemical, temperature is probably one of the more important parameters to consider.
Unusual temperature variations can indicate thermal pollution introduced by illegal discharges into the system.
Household and commercial sewage discharges tend to have consistently warm temperatures year-round.
Sanitary wastewater and industrial cooling water can substantially influence outfall discharge temperatures.
Celsius and Fahrenheit Conversions
oC oF oC oF oC oF
0 32.0 13 55.4 26 78.8
1 33.8 14 57.2 27 80.6
2 35.6 15 59.0 28 82.4
3 37.4 16 60.8 29 84.3
4 39.2 17 62.6 30 86.0
5 41.0 18 64.4 31 87.8
6 42.8 19 66.2 32 89.6
7 44.6 20 68.0 33 91.4
8 46.4 21 69.8 34 93.2
9 48.2 22 71.6 35 95.0
10 50.0 23 73.4 36 96.8
11 51.8 24 75.2 37 98.6
12 53.6 25 77.0 38 100.4
13

Tier I Chemical Parameters
When conditions warrant (see flow chart on page 2), Tier I parameter testing should be a regular part of a field inspection. Parameter measurements at or above the recommended levels should be investigated further.
Unless otherwise indicated, the levels of concern listed on pages 14 and 15 are based on local experiences for identifying illicit discharges and are meant to serve only as a guide.
Tier I Parameters Potential Sources Level of Concern
Ammonia-Nitrogen
Microbial decomposition of animal and plant proteins, sanitary wastewater, raw or partially-treated sewage,petroleum refining and chemical industries, synthetic fibers and dyes, drugs, pesticides, and fertilizer
1.0 mg/L
Chlorine
Used to indicate inflow from potable water sources; used as disinfectant in water and wastewater treatment processes
0.2 mg/L
Conductivity
Used to measure total dissolved solids (TDS); TDS can increase as a result of wastewater discharges, irrigation, and overuse of fertilizers
1500 µS/cm
Copper
Can indicate waste from manufacture of electrical components, coins, bronze, and brass products
0.2 mg/L
DetergentCan indicate a discharge from wash water or laundry 0.2 mg/L
pH
Extreme pH values (low or high) may indicate commercial or industrial flows
Below 6.0 su or above 9.0 su
14
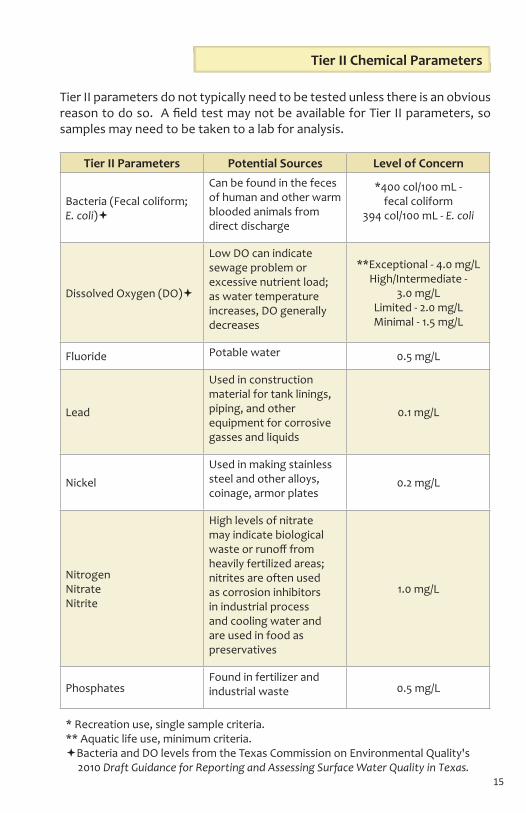
Tier II parameters do not typically need to be tested unless there is an obvious reason to do so. A field test may not be available for Tier II parameters, so samples may need to be taken to a lab for analysis.
Tier II Parameters Potential Sources Level of Concern
Bacteria (Fecal coliform; E. coli)
Can be found in the feces of human and other warm blooded animals from direct discharge
*400 col/100 mL - fecal coliform
394 col/100 mL - E. coli
Dissolved Oxygen (DO)
Low DO can indicate sewage problem or excessive nutrient load; as water temperature increases, DO generally decreases
**Exceptional - 4.0 mg/L High/Intermediate -
3.0 mg/L Limited - 2.0 mg/LMinimal - 1.5 mg/L
Fluoride Potable water 0.5 mg/L
Lead
Used in construction material for tank linings, piping, and other equipment for corrosive gasses and liquids
0.1 mg/L
Nickel
Used in making stainless steel and other alloys, coinage, armor plates
0.2 mg/L
NitrogenNitrateNitrite
High levels of nitrate may indicate biological waste or runoff from heavily fertilized areas; nitrites are often used as corrosion inhibitors in industrial process and cooling water and are used in food as preservatives
1.0 mg/L
PhosphatesFound in fertilizer and industrial waste 0.5 mg/L
* Recreation use, single sample criteria.** Aquatic life use, minimum criteria.Bacteria and DO levels from the Texas Commission on Environmental Quality's
2010 Draft Guidance for Reporting and Assessing Surface Water Quality in Texas.15
Tier II Chemical Parameters
Field Investigation Examples
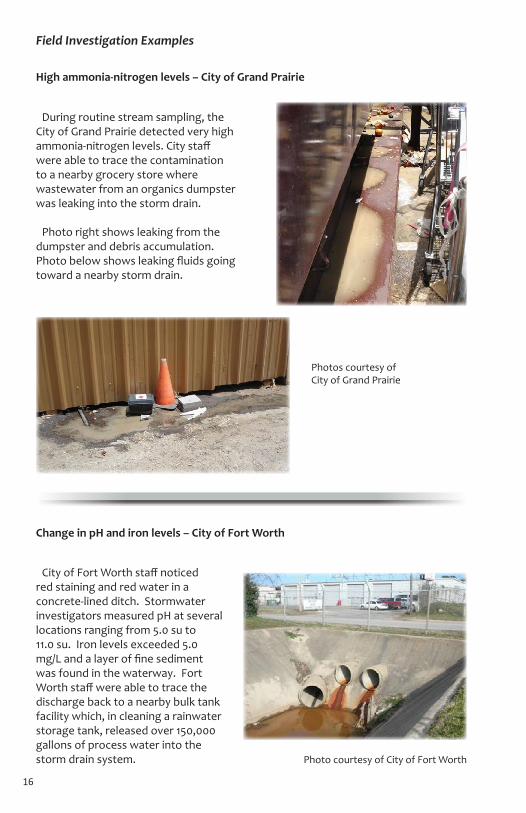
High ammonia-nitrogen levels – City of Grand Prairie
During routine stream sampling, the City of Grand Prairie detected very high ammonia-nitrogen levels. City staff were able to trace the contamination to a nearby grocery store where wastewater from an organics dumpster was leaking into the storm drain.
Photo right shows leaking from the dumpster and debris accumulation. Photo below shows leaking fluids going toward a nearby storm drain.
Photos courtesy of City of Grand Prairie
Change in pH and iron levels – City of Fort Worth
City of Fort Worth staff noticed red staining and red water in a concrete-lined ditch. Stormwater investigators measured pH at several locations ranging from 5.0 su to 11.0 su. Iron levels exceeded 5.0 mg/L and a layer of fine sediment was found in the waterway. Fort Worth staff were able to trace the discharge back to a nearby bulk tank facility which, in cleaning a rainwater storage tank, released over 150,000 gallons of process water into the storm drain system. Photo courtesy of City of Fort Worth
16
Tracing the Source of an Illicit Discharge
Once an illicit discharge has been found, the next step is to trace and remove the source of the discharge.
Storm Drain Network Investigations
This technique involves:
Inspecting manholes in a storm drain system by using chemical and physical indicators to isolate discharges to specific segments of the network.
Identifying where to inspect the network and what indicators to use to determine if a manhole is clean or contaminated.
Developing a strategic plan for inspecting the pipe network.
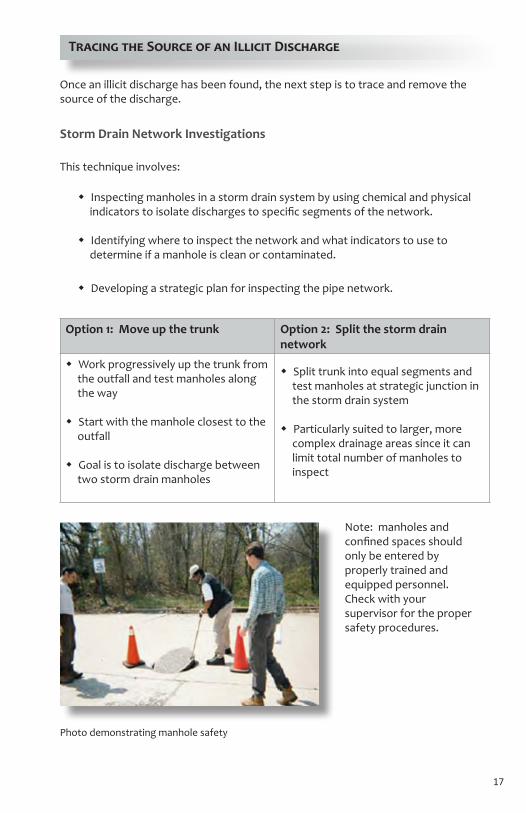
Note: manholes and confined spaces should only be entered by properly trained and equipped personnel. Check with your supervisor for the proper safety procedures.
Photo demonstrating manhole safety
Option 1: Move up the trunk Option 2: Split the storm drain network
Work progressively up the trunk from the outfall and test manholes along the way
Start with the manhole closest to the outfall
Goal is to isolate discharge between two storm drain manholes
Split trunk into equal segments and test manholes at strategic junction in the storm drain system
Particularly suited to larger, more complex drainage areas since it can limit total number of manholes to inspect
17
Intermittent Discharges
This technique involves:
Detecting intermittent discharges – those occurring at different times of the day or year and which do not occur on a frequent or regular basis.
Using the following methods to capture and detect illicit discharges: sandbags, optical brightener monitoring (OBM) traps, automatic samplers, and the observation of deposits and stains.
Note: refer to the CWP IDDE manual for more detailed information on how to use these techniques.
Field Investigation Example
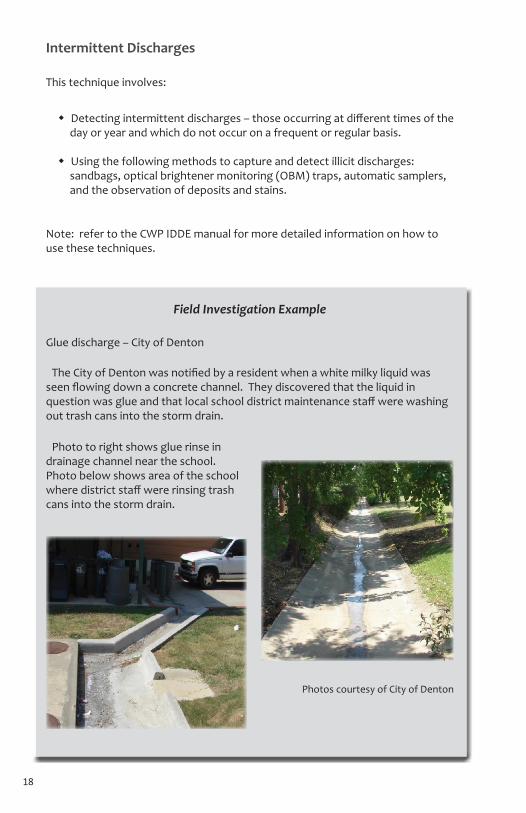
Glue discharge – City of Denton
The City of Denton was notified by a resident when a white milky liquid was seen flowing down a concrete channel. They discovered that the liquid in question was glue and that local school district maintenance staff were washing out trash cans into the storm drain.
Photos courtesy of City of Denton
Photo to right shows glue rinse in drainage channel near the school. Photo below shows area of the school where district staff were rinsing trash cans into the storm drain.
18
On-Site Investigations
There are three basic approaches to on-site investigations that will help determine the actual source of an illicit discharge: dye, video, and smoke testing. Note: these techniques should be used when conducting a follow-up investigation once an illicit discharge has been found. Refer to the CWP IDDE manual for more detailed information on how to use these techniques.
Before performing any dye or smoke testing, make sure to contact other city departments, spill response agencies, and downstream municipalities to let them know when and where these activities will take place.
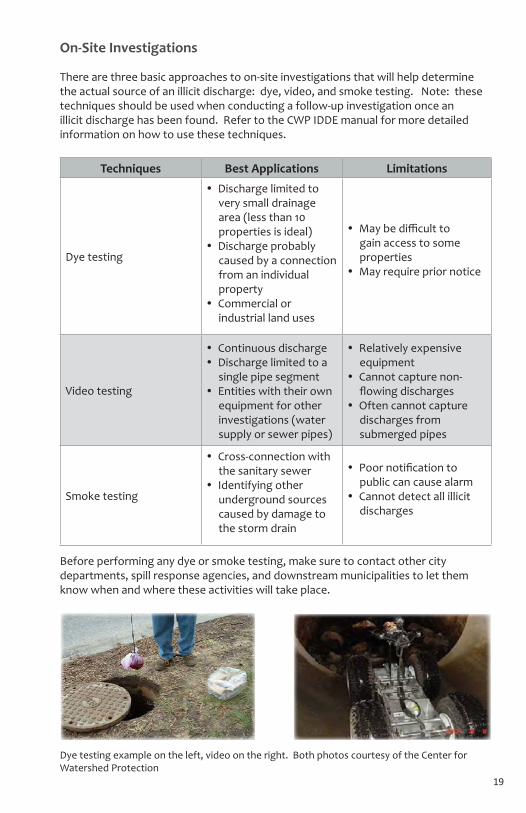
Dye testing example on the left, video on the right. Both photos courtesy of the Center for Watershed Protection
Techniques Best Applications Limitations
Dye testing
Discharge limited to very small drainage area (less than 10 properties is ideal)
Discharge probably caused by a connection from an individual property
Commercial or industrial land uses
May be difficult to gain access to some properties
May require prior notice
Video testing
Continuous discharge Discharge limited to a
single pipe segment Entities with their own
equipment for other investigations (water supply or sewer pipes)
Relatively expensive equipment
Cannot capture non-flowing discharges
Often cannot capture discharges from submerged pipes
Smoke testing
Cross-connection with the sanitary sewer
Identifying other underground sources caused by damage to the storm drain
Poor notification to public can cause alarm
Cannot detect all illicit discharges
19
PLANTS TO AVOID
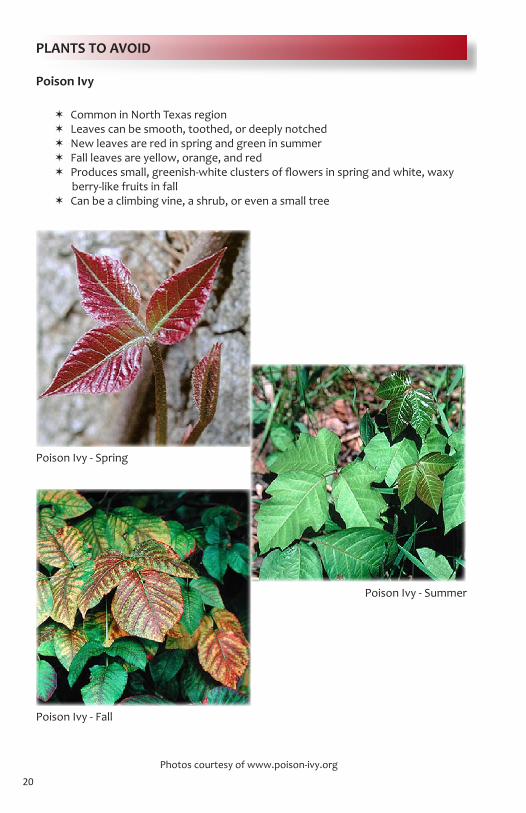
Poison Ivy
Common in North Texas region Leaves can be smooth, toothed, or deeply notched New leaves are red in spring and green in summer Fall leaves are yellow, orange, and red Produces small, greenish-white clusters of flowers in spring and white, waxy
berry-like fruits in fall Can be a climbing vine, a shrub, or even a small tree
Poison Ivy - Spring
Poison Ivy - Fall
Poison Ivy - Summer
Photos courtesy of www.poison-ivy.org
20
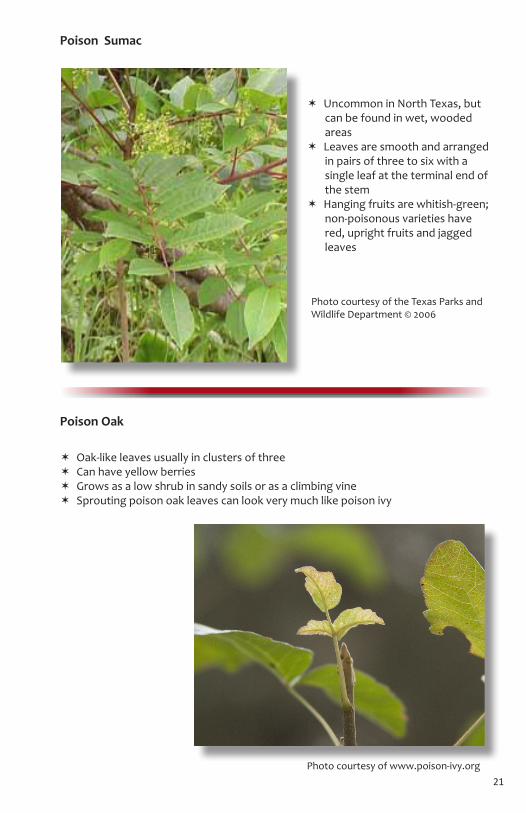
Uncommon in North Texas, but can be found in wet, wooded areas
Leaves are smooth and arranged in pairs of three to six with a single leaf at the terminal end of the stem
Hanging fruits are whitish-green; non-poisonous varieties have red, upright fruits and jagged leaves
Poison Sumac
Photo courtesy of the Texas Parks and Wildlife Department © 2006
Poison Oak
Oak-like leaves usually in clusters of three Can have yellow berries Grows as a low shrub in sandy soils or as a climbing vine Sprouting poison oak leaves can look very much like poison ivy
Photo courtesy of www.poison-ivy.org21
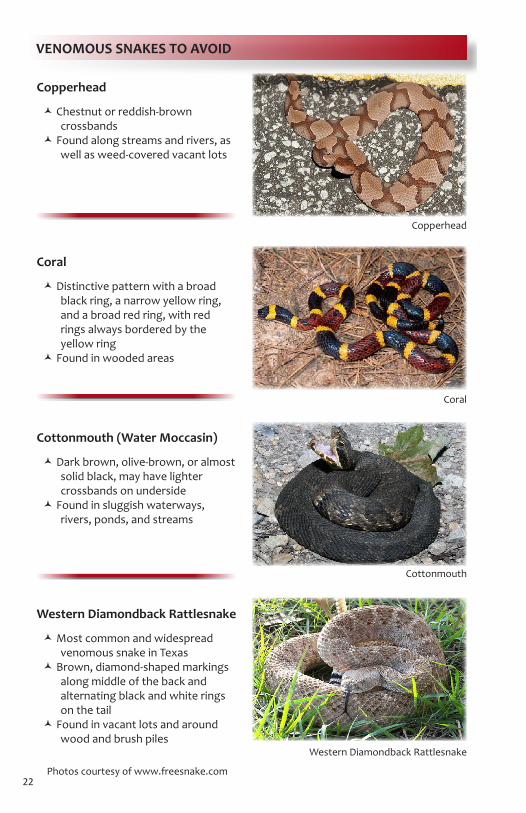
VENOMOUS SNAKES TO AVOID
Copperhead
Chestnut or reddish-brown crossbands
Found along streams and rivers, as well as weed-covered vacant lots
Coral
Distinctive pattern with a broad black ring, a narrow yellow ring, and a broad red ring, with red rings always bordered by the yellow ring
Found in wooded areas
Cottonmouth (Water Moccasin)
Dark brown, olive-brown, or almost solid black, may have lighter crossbands on underside
Found in sluggish waterways, rivers, ponds, and streams
Western Diamondback Rattlesnake
Most common and widespread venomous snake in Texas
Brown, diamond-shaped markings along middle of the back and alternating black and white rings on the tail
Found in vacant lots and around wood and brush piles
Photos courtesy of www.freesnake.com
Western Diamondback Rattlesnake
Cottonmouth
Coral
Copperhead
22

Create your own list of important local contacts using a waterproof marker or sticker label.
Organization Phone
TCEQ Region 4 - Small Business/Local Government Assistance
817-588-5800
TCEQ Hotline - Local Government Assistance
800-447-2827
TCEQ Hotline - Spill Reporting (24-hour)
800-832-8224
EPA Region 6 Compliance Assurance and Enforcement
214-665-8060
Texas Parks and Wildlife - Kills and Spills Team
254-867-7956 or 512-389-4848
(24-hour)
Important Contacts
23
This guidance manual was developed by the North Central Texas Council of Governments (NCTCOG) through the Regional Stormwater Management Program (RSWMP). It was adapted from a compilation of several local, state, and national resources and is intended to serve as guidance for entities in the North Central Texas region seeking to identify and eliminate illicit discharges and connections to their municipal separate storm sewer systems (MS4).
For more information on Illicit Discharge Detection and Elimination, contact NCTCOG's Department of Environment and Development at 817-695-9210 or visit www.dfwstormwater.com.