illicit discharge detection and elimination in six...
TRANSCRIPT
Illicit Discharge Detection and Elimination in Six Missisquoi River Basin Communities FINAL REPORT
Project ID 082219-W
March 20, 2011
Prepared for: Prepared by: Jim Pease Dave Braun VT Department of Environmental Conservation Stone Environmental, Inc. 10 North Building, 2nd Fl. 103 S. Main Street Waterbury, VT 05671-0408
535 Stone Cutters Way Montpelier, VT 05602
Tel. / 802-241-2683 Tel. / 802-229-5379 Fax. / 802-241-3287 Fax / 802-229-5417 E-Mail / [email protected] E-Mail / [email protected]
Table of Contents
1. INTRODUCTION ................................................................................................................... 1 1.1. Goal of the study ........................................................................................................................ 1 1.2. Municipal contacts ..................................................................................................................... 2
2. METHODS ............................................................................................................................. 2 2.1. Overview .................................................................................................................................... 2 2.2. Preparations for the assessment ............................................................................................... 2 2.3. Dry weather survey .................................................................................................................... 3
Water analysis methods ............................................................................................................ 3 2.4. Follow-up testing of stormwater discharge points ..................................................................... 4
Flow Measurement .................................................................................................................... 5 2.5. Isolating contaminant sources within storm sewer segments ................................................... 5 2.6. Advanced investigation to locate specific contaminant sources ............................................... 5 2.7. Municipal reports ........................................................................................................................ 6
3. RESULTS .............................................................................................................................. 6 3.1. Enosburg Falls ........................................................................................................................... 7
EN-040 ....................................................................................................................................... 8 EN-100 ....................................................................................................................................... 8 EN-160 ....................................................................................................................................... 9 EN-210 ....................................................................................................................................... 9 EN-280 ..................................................................................................................................... 10 EN-360 ..................................................................................................................................... 10
3.2. Highgate Center ....................................................................................................................... 11 3.3. Montgomery Center ................................................................................................................. 11 3.4. North Troy ................................................................................................................................ 12
NT-010 ..................................................................................................................................... 12 NT-060 ..................................................................................................................................... 13
3.5. Richford .................................................................................................................................... 13 RF-010X and RF-010Z ............................................................................................................ 13 RF-045 and RF-050 ................................................................................................................. 15 RF-140 ..................................................................................................................................... 16 RF-230 ..................................................................................................................................... 16 RF-270 ..................................................................................................................................... 17
3.6. Swanton ................................................................................................................................... 17 SW-140 (Ravine System) ........................................................................................................ 18 SW-150 .................................................................................................................................... 20 SW-170 .................................................................................................................................... 20 SW-290 .................................................................................................................................... 22 SW-300 .................................................................................................................................... 23
3.7. Total phosphorus loading ........................................................................................................ 23
4. CONCLUSION ......................................................................................................................24
5. REFERENCES .....................................................................................................................25
6. FIGURES ..............................................................................................................................26
APPENDICES ...........................................................................................................................41
APPENDIX A : LETTER TO VILLAGE OF ENOSBURG FALLS ...............................................42
APPENDIX B : CAMERA INSPECTION REPORTS FOR ENOSBURG FALLS ........................62
APPENDIX C : LETTER TO TOWN OF HIGHGATE CENTER .................................................71
APPENDIX D : LETTER TO TOWN OF MONTGOMERY CENTER ..........................................75
APPENDIX E : LETTERS TO TOWN OF NORTH TROY ..........................................................79
APPENDIX F : LETTERS TO TOWN OF RICHFORD ...............................................................94
APPENDIX G : DEC MEMORANDUM ON MSGP STATUS OF BLUE SEAL FEEDS .............103
APPENDIX H : LETTER TO VILLAGE OF SWANTON ...........................................................105
APPENDIX I : STONE ENVIRONMENTAL INC. LETTER TO POULIN GRAIN .......................137
APPENDIX J : DEC MEMORANDUM ON MSGP STATUS OF POULIN GRAIN ....................141
List of Figures Figure 1. Stormwater drainage system discharging at outfall EN-100 ............................................. 27
Figure 2. Stormwater drainage system discharging at outfall EN-210 ............................................. 28
Figure 3. Stormwater drainage system discharging at outfall EN-360 ............................................. 29
Figure 4. Stormwater drainage system discharging at outfall NT-010 ............................................. 30
Figure 5. Stormwater drainage system discharging at outfall NT-060 ............................................. 31
Figure 6. Stormwater drainage system discharging at outfall RF-010Y .......................................... 32
Figure 7. Pipe RF-010X, September 17, 2009 .................................................................................... 33
Figure 8. Stormwater drainage systems discharging at outfalls RF-045 and RF-050 ................... 34
Figure 9. Smoke testing at sewer manhole SMH#9-A (near Willow Street) ................................... 35
Figure 10. Smoke from outfall RF-045 .................................................................................................. 35
Figure 11. Smoke from outfall RF-050 .................................................................................................. 35
Figure 12. Stormwater drainage system discharging at outfall RF-230 ........................................... 36
Figure 13. Section of stormwater drainage system discharging at outfall SW-140 ....................... 37
Figure 14. Stormwater drainage system discharging at outfall SW-150 ......................................... 38
Figure 15. Section of stormwater drainage system discharging at outfall SW-170 ....................... 39
Figure 16. Stormwater drainage system discharging at outfall SW-290 ......................................... 40
List of Tables Table 1. Water quality tests at flowing outfalls and selected catch basins and manholes ............. 4
Table 2. Laboratory sample analyses ..................................................................................................... 5
Table 3. Summary of structures assessed and contaminated discharges indicated ....................... 6
Table 4. Contaminated dry weather flows in Enosburg Falls (from June, 2009 assessment) ....... 7
Table 5. Summary of water quality testing in the area of RF-010 .................................................... 14
Table 6. Summary of water quality testing at RF-050 ........................................................................ 15
Table 7. Summary of water quality testing at RF-230 ........................................................................ 17
Table 8. Summary of water quality testing of the SW-140 storm sewer .......................................... 18
Table 9. Investigation of the SW-150 storm sewer ............................................................................. 20
Table 10. Investigation of the SW-170 storm sewer (Canada Street and connecting streets) .... 21
Table 11. Investigation of the SW-290 storm sewer ........................................................................... 22
Table 12. Investigation of the SW-300 culvert ..................................................................................... 23
Table 13. Total phosphorus concentration and loading at sampled sites ....................................... 24
1. INTRODUCTION
This project provided a comprehensive assessment of the occurrence of contaminated, non-stormwater flows in separated stormwater drainage systems discharging to the Missisquoi River and its tributaries in Enosburg Falls, Highgate Center, Montgomery Center, North Troy, Richford, and Swanton. Stormwater infrastructure maps prepared by DEC were used in organizing and documenting the assessment.
In older town centers, the discharge of materials other than stormwater through the stormwater drainage system can be a source of bacteria and other contaminants of concern. Locating and eliminating illicit discharges can be a cost-effective element of a long-term strategy to reduce water pollution. Enosburg Falls, North Troy, Richford, and Swanton have aging wastewater collection systems and Highgate Center and Montgomery Center have on-site wastewater treatment. Both centralized wastewater collection systems and on-site wastewater systems can contribute illicit discharges to surface waters. Other potential sources of contamination include contaminated discharges from industrial facilities and petroleum contaminated groundwater from former industrial sites, gas stations, and town garages. Municipal tapwater leaks are often identified, the correction of which reduces chlorine entering the environment and saves water.
Illicit discharges enter stormwater drainage systems through either direct connections or indirect connections. Examples of direct connections include:
• Wastewater piping mistakenly or deliberately connected to the stormwater drainage system; • A shop floor drain that is connected to the stormwater drainage system; and • A cross-connection between the sanitary sewer and stormwater drainage system.
Examples of indirect connections include:
• Infiltration into the stormwater drainage system from a leaking sanitary sewer line; • Infiltration or surface discharge into the stormwater drainage system from a failed septic
system; • A spill flowing to a catch basin; and • Materials (e.g., paint or used oil) dumped directly into a catch basin.
Prior to this project, there had been no systematic assessment of stormwater infrastructure in Enosburg Falls, Highgate Center, Montgomery Center, North Troy, Richford, and Swanton for the presence of illicit discharges. These communities are not subject to the requirements of the EPA Phase II stormwater rule, which include a requirement to perform IDDE; therefore they had not initiated IDDE programs. This report describes the assessment and its results.
1.1. Goal of the study The goal of this project was to improve water quality by identifying and eliminating contaminated, non-stormwater discharges entering stormwater drainage systems and discharging to the Missisquoi River
Center for Clean and Clear / Missisquoi Basin IDDE / March 20, 2011 1
and its tributaries in Enosburg Falls, Highgate Center, Montgomery Center, North Troy, Richford, and Swanton.
1.2. Municipal contacts The primary municipal contacts were:
Enosburg Falls Gary Atherton, Director of Public Works
Highgate Center David Jescavage, Town Administrator
Montgomery Center Mark Brouillette, Asst. Water System Operator
North Troy Marcel Mayhew, Water Treatment Plant Superintendent
Richford John Nutting, Town of Richford Highway Dept. / Rich Mackay, Simon’s Operating Service (treatment plant operator)/ Mary Mankin, Water/Wastewater Superintendent
Swanton Village Mike Menard, Director of Public Works
2. METHODS
2.1. Overview DEC had previously completed mapping of stormwater systems in the participating communities. DEC’s stormwater infrastructure maps were used to guide the field assessment. The primary tasks performed were: 1) to record observations and perform basic water quality tests at flowing outfalls, other discharge points, and selected catch basins and junction manholes during dry-weather periods; and 2) where monitoring indicated contamination, to work with the community or business to investigate potential pollutant sources through the stormwater drainage system. The scope of this assessment included the entire extent of the municipal closed drainage systems in Enosburg Falls, Highgate Center, Montgomery Center, North Troy, Richford, and Swanton.
2.2. Preparations for the assessment Preparations for the illicit discharge assessment included obtaining and assembling necessary equipment and supplies; preparing a field data form, field maps, a Health and Safety Plan, and other documents and organizing these in a project notebook; and contacting municipal representatives to gather information and plan the project in each community. Field equipment was assembled from Stone’s inventory. Consumable supplies, including but not limited to test reagents, sample bottles, latex gloves, and ice packs, were purchased to meet the needs of the project. Large format field maps were prepared by overlaying DEC’s stormwater infrastructure mapping and the best available orthophotography. These maps were annotated in the field. A Health and Safety Plan was prepared with directions to emergency medical facilities. A project notebook was assembled containing all these
Center for Clean and Clear / Missisquoi Basin IDDE / March 20, 2011 2

documents plus contact information, laboratory chain of custody forms, standard operating procedures, and other documents.
2.3. Dry weather survey Field scientists assessed all accessible stormwater outfalls and selected catch basins and manholes in the participating municipalities during dry weather. The catch basins and manholes selected for assessment in this initial assessment were generally those located at junctions of branched collection systems. Stormwater outfalls, catch basins, and manholes were accessed along the public right-of-way. In certain cases stormwater structures located on private property were assessed if these structures were connected to a municipal system and permission was granted. In general we completed assessments of individual separate stormwater systems before moving to a new area.
Stormwater structures were assessed during dry weather to minimize dilution by stormwater. Dry weather was defined as negligible rainfall (less than 0.1 inches) since approximately 12:00 p.m. on the previous day. With certain exceptions, structures where no dry-weather flow was observed were assumed not to have illicit connections and no further assessment was made. Further assessment of dry structures was made only if there was evidence of contamination in the area below the outfall or in a catch basin or manhole sump, such as deposits, staining, or offensive odors.
Every outfall or other stormwater structure assessed was assigned a unique identifying code. Scientists described the physical condition of each discharge point, the condition immediately surrounding each discharge point, and the characteristics of any dry weather discharge. Field data were entered on printed forms and noted on field maps. Where appropriate, a GPS receiver was used to record structure positions and enter field data. Using the GPS receiver or manual notations on the printed maps, outfall locations were added to DEC’s stormwater infrastructure mapping where missing outfalls were identified in the field. Outfall locations were also corrected when necessary. Field data collected on forms and maps were transcribed to data tables to be used in data interpretation and preparation of reports.
Dry weather flows were sampled by hand or by using a telescoping pole sampler. At catch basins and manholes located at junctions in the storm sewer, samples were collected independently from each inflowing pipe, if possible.
Water analysis methods
Table 1 identifies the analysis methods used to characterize water samples. Samples were tested for ammonia concentration immediately upon collection using Aquacheck ammonia test strips. Samples intended for specific conductance, detergents, and fluoride analysis were collected in clean HDPE bottles and analyzed within 24 hours at Stone Environmental’s facility in Montpelier. Specific conductance was measured using a calibrated Oakton model conductivity meter. Detergents (anionic surfactants only) were analyzed using a test for methylene blue active substances from CHEMetrics (product number K-9400). Samples collected in Enosburg Falls and Swanton, which have fluoridated water supplies, were analyzed for fluoride concentration using a Hach DR/890 Colorimeter according to
Center for Clean and Clear / Missisquoi Basin IDDE / March 20, 2011 3
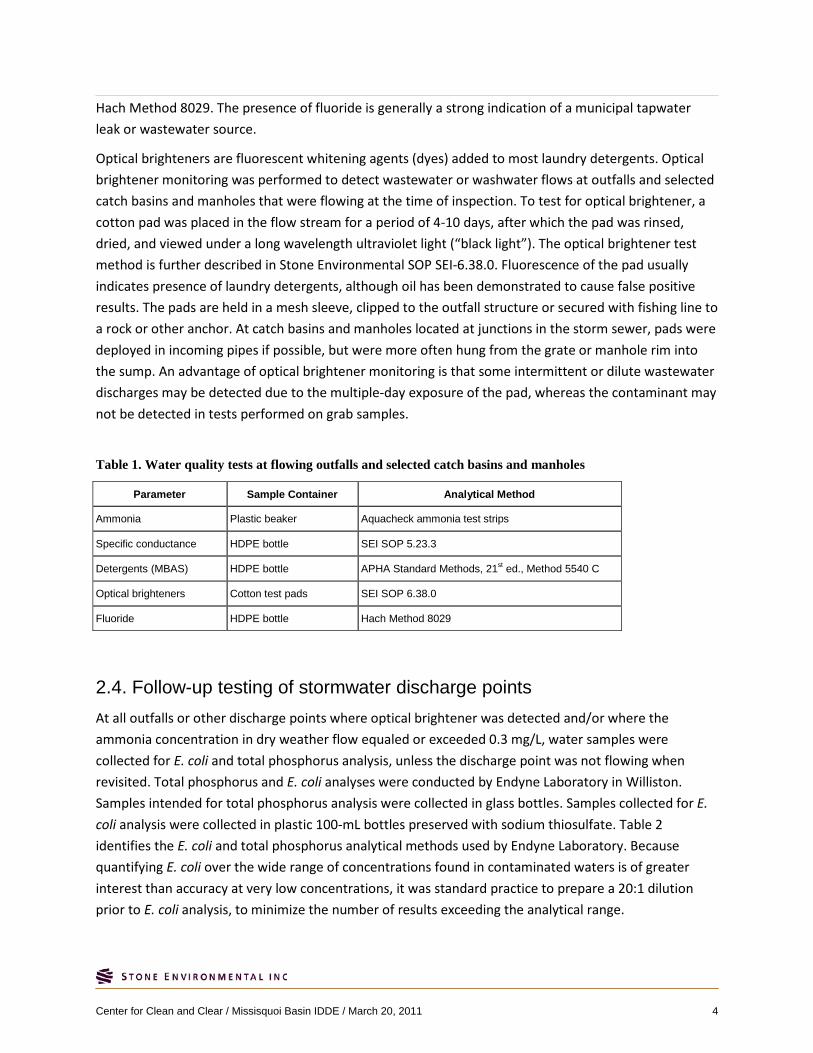
Hach Method 8029. The presence of fluoride is generally a strong indication of a municipal tapwater leak or wastewater source.
Optical brighteners are fluorescent whitening agents (dyes) added to most laundry detergents. Optical brightener monitoring was performed to detect wastewater or washwater flows at outfalls and selected catch basins and manholes that were flowing at the time of inspection. To test for optical brightener, a cotton pad was placed in the flow stream for a period of 4-10 days, after which the pad was rinsed, dried, and viewed under a long wavelength ultraviolet light (“black light”). The optical brightener test method is further described in Stone Environmental SOP SEI-6.38.0. Fluorescence of the pad usually indicates presence of laundry detergents, although oil has been demonstrated to cause false positive results. The pads are held in a mesh sleeve, clipped to the outfall structure or secured with fishing line to a rock or other anchor. At catch basins and manholes located at junctions in the storm sewer, pads were deployed in incoming pipes if possible, but were more often hung from the grate or manhole rim into the sump. An advantage of optical brightener monitoring is that some intermittent or dilute wastewater discharges may be detected due to the multiple-day exposure of the pad, whereas the contaminant may not be detected in tests performed on grab samples.
Table 1. Water quality tests at flowing outfalls and selected catch basins and manholes
Parameter Sample Container Analytical Method
Ammonia Plastic beaker Aquacheck ammonia test strips
Specific conductance HDPE bottle SEI SOP 5.23.3
Detergents (MBAS) HDPE bottle APHA Standard Methods, 21st ed., Method 5540 C
Optical brighteners Cotton test pads SEI SOP 6.38.0
Fluoride HDPE bottle Hach Method 8029
2.4. Follow-up testing of stormwater discharge points At all outfalls or other discharge points where optical brightener was detected and/or where the ammonia concentration in dry weather flow equaled or exceeded 0.3 mg/L, water samples were collected for E. coli and total phosphorus analysis, unless the discharge point was not flowing when revisited. Total phosphorus and E. coli analyses were conducted by Endyne Laboratory in Williston. Samples intended for total phosphorus analysis were collected in glass bottles. Samples collected for E. coli analysis were collected in plastic 100-mL bottles preserved with sodium thiosulfate. Table 2 identifies the E. coli and total phosphorus analytical methods used by Endyne Laboratory. Because quantifying E. coli over the wide range of concentrations found in contaminated waters is of greater interest than accuracy at very low concentrations, it was standard practice to prepare a 20:1 dilution prior to E. coli analysis, to minimize the number of results exceeding the analytical range.
Center for Clean and Clear / Missisquoi Basin IDDE / March 20, 2011 4
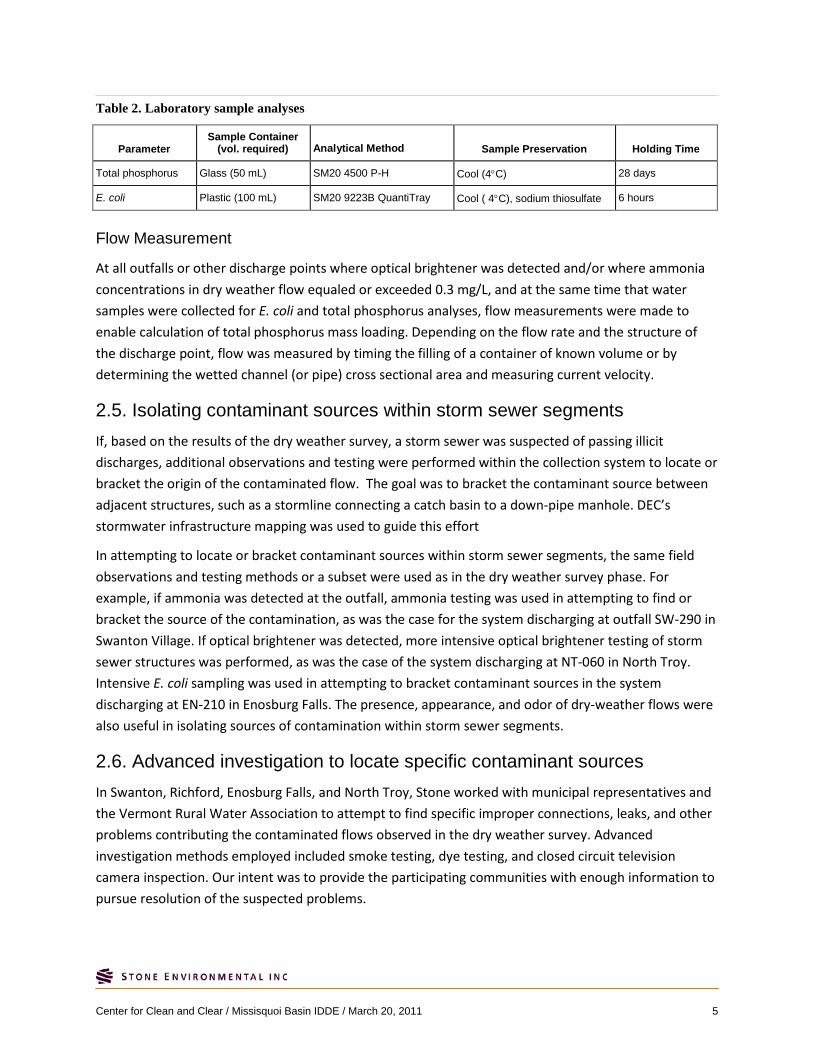
Table 2. Laboratory sample analyses
Parameter Sample Container
(vol. required) Analytical Method Sample Preservation Holding Time
Total phosphorus Glass (50 mL) SM20 4500 P-H Cool (4°C) 28 days
E. coli Plastic (100 mL) SM20 9223B QuantiTray Cool ( 4°C), sodium thiosulfate 6 hours
Flow Measurement
At all outfalls or other discharge points where optical brightener was detected and/or where ammonia concentrations in dry weather flow equaled or exceeded 0.3 mg/L, and at the same time that water samples were collected for E. coli and total phosphorus analyses, flow measurements were made to enable calculation of total phosphorus mass loading. Depending on the flow rate and the structure of the discharge point, flow was measured by timing the filling of a container of known volume or by determining the wetted channel (or pipe) cross sectional area and measuring current velocity.
2.5. Isolating contaminant sources within storm sewer segments If, based on the results of the dry weather survey, a storm sewer was suspected of passing illicit discharges, additional observations and testing were performed within the collection system to locate or bracket the origin of the contaminated flow. The goal was to bracket the contaminant source between adjacent structures, such as a stormline connecting a catch basin to a down-pipe manhole. DEC’s stormwater infrastructure mapping was used to guide this effort
In attempting to locate or bracket contaminant sources within storm sewer segments, the same field observations and testing methods or a subset were used as in the dry weather survey phase. For example, if ammonia was detected at the outfall, ammonia testing was used in attempting to find or bracket the source of the contamination, as was the case for the system discharging at outfall SW-290 in Swanton Village. If optical brightener was detected, more intensive optical brightener testing of storm sewer structures was performed, as was the case of the system discharging at NT-060 in North Troy. Intensive E. coli sampling was used in attempting to bracket contaminant sources in the system discharging at EN-210 in Enosburg Falls. The presence, appearance, and odor of dry-weather flows were also useful in isolating sources of contamination within storm sewer segments.
2.6. Advanced investigation to locate specific contaminant sources In Swanton, Richford, Enosburg Falls, and North Troy, Stone worked with municipal representatives and the Vermont Rural Water Association to attempt to find specific improper connections, leaks, and other problems contributing the contaminated flows observed in the dry weather survey. Advanced investigation methods employed included smoke testing, dye testing, and closed circuit television camera inspection. Our intent was to provide the participating communities with enough information to pursue resolution of the suspected problems.
Center for Clean and Clear / Missisquoi Basin IDDE / March 20, 2011 5
2.7. Municipal reports Written letter reports describing the status of the investigations were prepared for each participating municipality. Copies of these municipal reports are included in the appendices. These reports contain most of the study raw data.
3. RESULTS
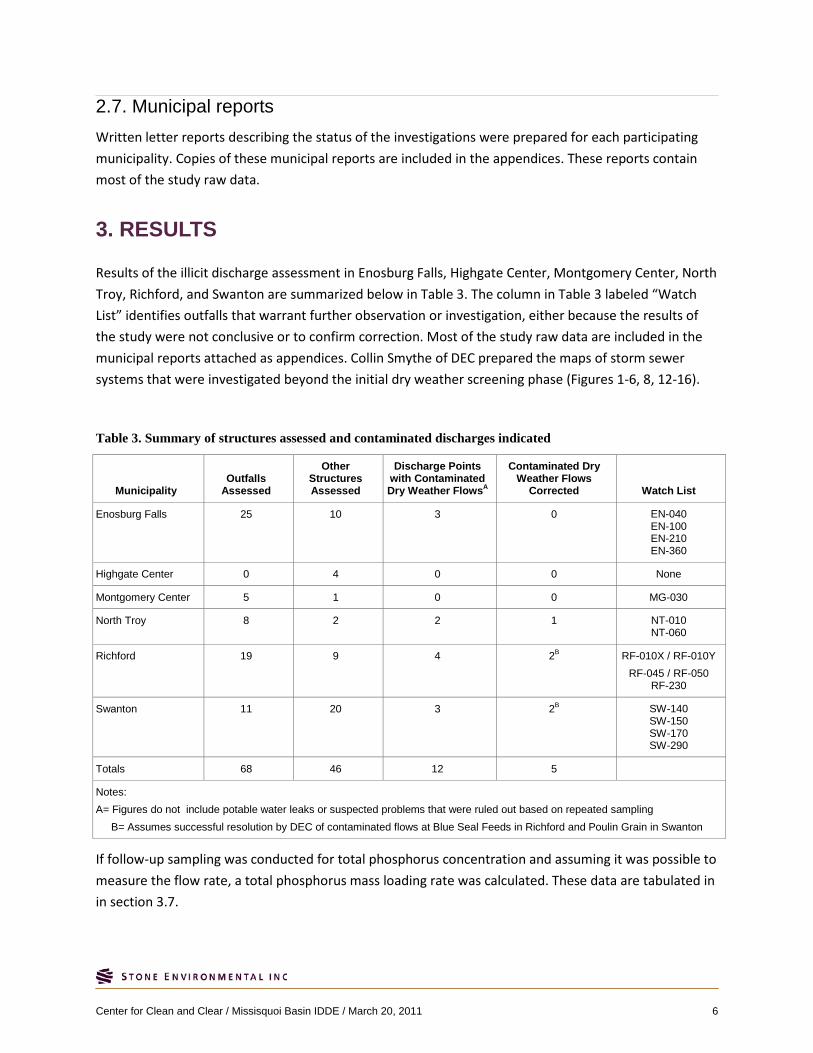
Results of the illicit discharge assessment in Enosburg Falls, Highgate Center, Montgomery Center, North Troy, Richford, and Swanton are summarized below in Table 3. The column in Table 3 labeled “Watch List” identifies outfalls that warrant further observation or investigation, either because the results of the study were not conclusive or to confirm correction. Most of the study raw data are included in the municipal reports attached as appendices. Collin Smythe of DEC prepared the maps of storm sewer systems that were investigated beyond the initial dry weather screening phase (Figures 1-6, 8, 12-16).
Table 3. Summary of structures assessed and contaminated discharges indicated
Municipality Outfalls
Assessed
Other Structures Assessed
Discharge Points with Contaminated Dry Weather FlowsA
Contaminated Dry Weather Flows
Corrected Watch List
Enosburg Falls 25 10 3 0 EN-040 EN-100 EN-210 EN-360
Highgate Center 0 4 0 0 None
Montgomery Center 5 1 0 0 MG-030
North Troy 8 2 2 1 NT-010 NT-060
Richford 19 9 4 2B RF-010X / RF-010Y RF-045 / RF-050
RF-230
Swanton 11 20 3 2B SW-140 SW-150 SW-170 SW-290
Totals 68 46 12 5
Notes: A= Figures do not include potable water leaks or suspected problems that were ruled out based on repeated sampling
B= Assumes successful resolution by DEC of contaminated flows at Blue Seal Feeds in Richford and Poulin Grain in Swanton
If follow-up sampling was conducted for total phosphorus concentration and assuming it was possible to measure the flow rate, a total phosphorus mass loading rate was calculated. These data are tabulated in in section 3.7.
Center for Clean and Clear / Missisquoi Basin IDDE / March 20, 2011 6
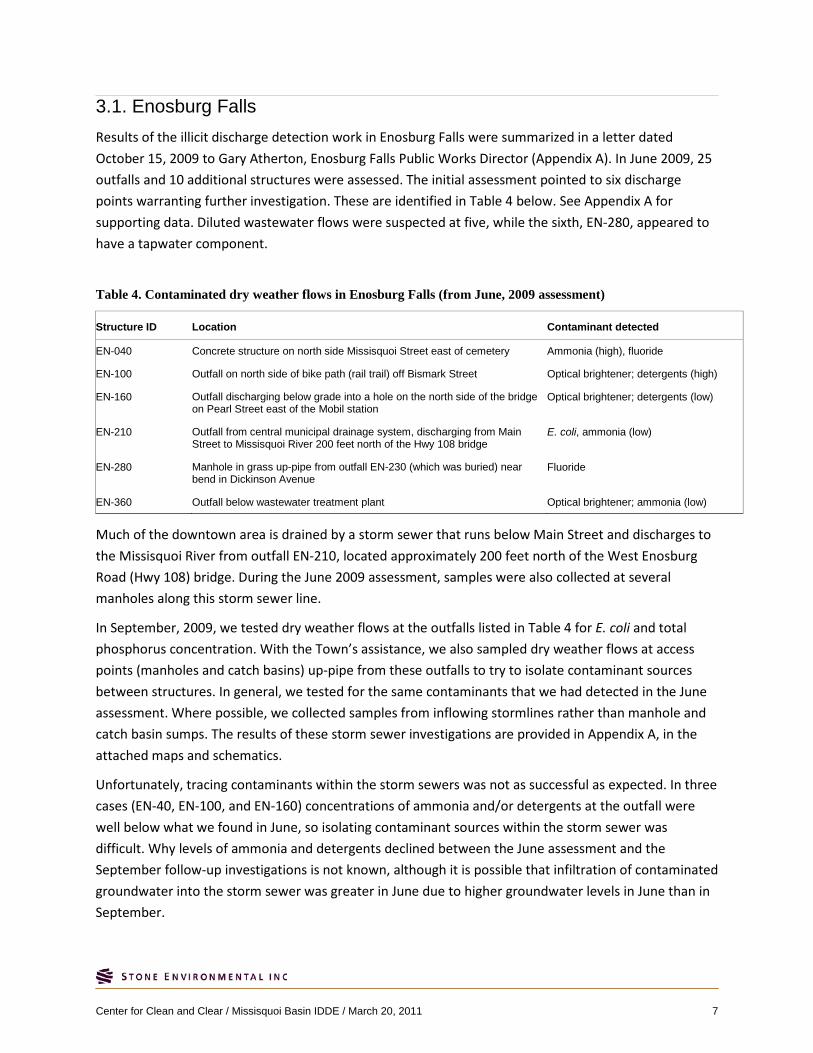
3.1. Enosburg Falls Results of the illicit discharge detection work in Enosburg Falls were summarized in a letter dated October 15, 2009 to Gary Atherton, Enosburg Falls Public Works Director (Appendix A). In June 2009, 25 outfalls and 10 additional structures were assessed. The initial assessment pointed to six discharge points warranting further investigation. These are identified in Table 4 below. See Appendix A for supporting data. Diluted wastewater flows were suspected at five, while the sixth, EN-280, appeared to have a tapwater component.
Table 4. Contaminated dry weather flows in Enosburg Falls (from June, 2009 assessment)
Structure ID Location Contaminant detected
EN-040 Concrete structure on north side Missisquoi Street east of cemetery Ammonia (high), fluoride
EN-100 Outfall on north side of bike path (rail trail) off Bismark Street Optical brightener; detergents (high)
EN-160 Outfall discharging below grade into a hole on the north side of the bridge on Pearl Street east of the Mobil station
Optical brightener; detergents (low)
EN-210 Outfall from central municipal drainage system, discharging from Main Street to Missisquoi River 200 feet north of the Hwy 108 bridge
E. coli, ammonia (low)
EN-280 Manhole in grass up-pipe from outfall EN-230 (which was buried) near bend in Dickinson Avenue
Fluoride
EN-360 Outfall below wastewater treatment plant Optical brightener; ammonia (low)
Much of the downtown area is drained by a storm sewer that runs below Main Street and discharges to the Missisquoi River from outfall EN-210, located approximately 200 feet north of the West Enosburg Road (Hwy 108) bridge. During the June 2009 assessment, samples were also collected at several manholes along this storm sewer line.
In September, 2009, we tested dry weather flows at the outfalls listed in Table 4 for E. coli and total phosphorus concentration. With the Town’s assistance, we also sampled dry weather flows at access points (manholes and catch basins) up-pipe from these outfalls to try to isolate contaminant sources between structures. In general, we tested for the same contaminants that we had detected in the June assessment. Where possible, we collected samples from inflowing stormlines rather than manhole and catch basin sumps. The results of these storm sewer investigations are provided in Appendix A, in the attached maps and schematics.
Unfortunately, tracing contaminants within the storm sewers was not as successful as expected. In three cases (EN-40, EN-100, and EN-160) concentrations of ammonia and/or detergents at the outfall were well below what we found in June, so isolating contaminant sources within the storm sewer was difficult. Why levels of ammonia and detergents declined between the June assessment and the September follow-up investigations is not known, although it is possible that infiltration of contaminated groundwater into the storm sewer was greater in June due to higher groundwater levels in June than in September.
Center for Clean and Clear / Missisquoi Basin IDDE / March 20, 2011 7
Investigations of the six locations with suspected contaminated discharges are described individually as follows.
EN-040
EN-040 is a concrete drop inlet located on the north side of Missisquoi Street east of the cemetery. A sample collected on June 9, 2009 in a small stream draining to this structure had elevated ammonia (1.0 mg/L) and fluoride (0.6 mg/L), but no optical brightener or detergent.
Samples collected on September 3, 2009 had low E. coli (60 MPN/100 mL) and total phosphorus (0.11 mg/L).
A sample collected on September 7, 2009 had non-detectable ammonia and fluoride concentrations.
Because repeated sampling of this structure did not indicate any contamination, no further action was taken. We advised the Town of Enosburg Falls to recheck the ammonia concentration at the structure periodically. It is possible that the ammonia detected on June 9, 2009 is naturally occurring and that the fluoride resulted from landscape irrigation or outdoor washing.
EN-100
Outfall EN-100 is on north side of bike path (rail trail) off Bismark Street (Figure 1). When this outfall was first sampled on June 22, 2009, the detergent concentration was high (1.7 mg/L) and optical brightener was present.
A sample collected at the outfall on September 3, 2009 had a low E. coli level (100 MPN/100 mL) and low total phosphorus concentration (0.029 mg/L). On September 24, 2009 flow was observed in the second catch basin (EN-102) up the stormline from the outfall, continuing to the outfall. There was no flow at Main Street. No ammonia or detergents were detected at the outfall. However, optical brightener was definitely present at the outfall and at the first catch basin up the line (EN-101). Optical brightener was not found at catch basin EN-102 Therefore, we suspected a sanitary wastewater or washwater connection between the first and second catch basin up the line from the outfall.
The section of stormline between EN-101 and EN-102 was inspected using a closed circuit television camera on June 23, 2010 (Appendix B, “Bismark to Main, PVC Pipe”). In this section, the sanitary sewer runs in close proximity to the storm sewer. A small diameter, unidentified pipe was observed discharging to the stormline approximately 4 feet into the pipe. A second flowing pipe was found 100 feet into the pipe. One or both of these pipes may be foundation drains. Because the source of the pipes is unknown, we recommended to the Town of Enosburg that they dig up the pipe and test them independently and close them off if not legitimate. In addition to these flowing pipes, another possible explanation for the detergent and optical brightener is infiltration from a leak in the sanitary sewer system.
Center for Clean and Clear / Missisquoi Basin IDDE / March 20, 2011 8
EN-160
Outfall EN-160 discharges below grade into a hole on the north side of the bridge on Pearl Street east of the Mobil gas station. This outfall appears connected to catch basins at the gas station. When this outfall was first sampled on June 22, 2009, the detergent concentration was elevated (0.4 mg/L) and optical brightener was present.
A sample collected at the outfall on September 3, 2009 had relatively low E. coli (160 MPN/100 mL) and low total phosphorus (0.012 mg/L).
A sample collected on September 24, 2009 had ammonia and detergent concentrations below the detection levels.
Based on the lack of a demonstrated problem in repeated sampling, we conclude that the June 22, 2009 detections of detergent and optical brightener likely resulted from runoff from the gas station. Motor oil can cause a false positive detection for both optical brightener and detergents.
EN-210
EN-210 is the outfall from the central municipal drainage system, discharging from Main Street to the Missisquoi River approximately 200 feet north of the Hwy 108 Bridge (Figure 2). When this outfall was first sampled on June 22, 2009, the ammonia concentration was slightly elevated (0.5 mg/L).
A sample collected at the outfall on September 3, 2009 had a high E. coli level (>4,000 MPN/100 mL) and low total phosphorus concentration (0.023 mg/L). Because of this result, on September 17, 2009 samples were collected for E. coli analysis at several junctures in the storm sewer. The E. coli level was 6,500 MPN/100 mL at the outfall, which is consistent with sanitary wastewater contamination. At the intersection of Main Street and Pearl Street, flow in the Main Street line had 2,000 E. coli/100 mL and a trickle of flow from the Pearl Street line was not sampled. Up Main Street at the intersection of Dickinson Street, there was no flow from the Dickinson Street line, but flow down the Main Street line had 10,000 E. coli /100 mL. Further up Main Street at the intersection of School Street, flow from the Main Street line had 12,000 E. coli/100 mL while flow from the School Street line had 2,200 E. coli/100 mL. Up School Street at the intersection with Stebbins Street, the only inflow to the manhole (EN-300) was from the Stebbins Street line, which had an exceedingly high count of >48,000 E. coli/100 mL, although there is some question as to whether this sample was collected properly. Up Main Street at the intersection with Depot Street, the only inflow was from the Depot Street line, which had almost no E. coli (20 MPN/100 mL). Based on these data, it appears that sanitary wastewater enters the storm sewer on Main Street between School Street and Depot Street and also somewhere in the system above the Stebbins Street and School Street intersection.
On June 22 and 23, 2010, a closed circuit, track mounted television camera was used to attempt to find illicit connections to stormlines having high E. coli levels. Wayne Graham of the Vermont Rural Water Association operated the camera. Overall, there were too many sand deposits and bricks and other obstructions in the stormlines to make effective use of the camera, which became stuck often. Due to
Center for Clean and Clear / Missisquoi Basin IDDE / March 20, 2011 9
these impasses, the pipe length inspected with the camera was substantially incomplete. The results of the camera inspection work are provided in Appendix B.
Most connections to the storm sewer appeared capped (not including pipes from catch basins if these were offset from the main storm sewer). In some cases it was impossible to tell whether an old service line had been properly capped because of the angle of the pipe connection. In at least three places, flow was observed entering the storm sewer. Overall, the results of the camera inspection were informative but inconclusive, because 1) access to the majority of the system was limited by sand and obstructions; 2) it was not possible to determine whether certain connections were properly capped; and 3) where inflow was observed, it was not possible to determine whether the specific inflow was contaminated. The fact that ammonia, detergents, and fluoride concentrations were generally low also complicated finding specific contaminant sources.
EN-280
Manhole EN-280 is the first accessible structure up the stormline from outfall EN-230, which was buried. When this manhole was sampled on June 22, 2009, the fluoride concentration was elevated (0.5 mg/L), but there were no indications of wastewater or other types of contamination. Therefore we suspected a diluted tapwater leak. However, on two subsequent occasions, September 17 and 24, 2009, the manhole was dry. It is possible that this is a function of groundwater levels. Because the only potential problem in this system was an intermittent discharge of tapwater, we recommended that the Town engage Vermont Rural Water to perform leak detection if they were concerned about this possibility.
EN-360
Outfall EN-360 is located behind the wastewater treatment plant (Figure 3). When this outfall was first sampled on June 22, 2009, a low ammonia concentration was detected (0.25 mg/L) and optical brightener was present, although the fluorescence was weak.
A sample collected at the outfall on September 3, 2009 had no detectable E. coli (<20 MPN/100 mL) and a low total phosphorus concentration (0.012 mg/L).
A sample collected on September 24, 2009 had no detectable ammonia but the optical brightener test was positive.
In response to these results, Stone worked with wastewater treatment plant operator Brian Ovitt to deploy optical brightener monitoring pads in catch basins and manholes in this storm sewer system on November 12, 2009. A catch basin located in the front yard of the wastewater treatment plant and two catch basins on St. Albans Street between the entrance to the treatment plant and Church Street had positive optical brightener tests, although the florescence was weak. This result suggests a minor wastewater source in the vicinity of the Church Street and St. Albans Street intersection. This question could not be resolved in the timeframe of the project.
Center for Clean and Clear / Missisquoi Basin IDDE / March 20, 2011 10
3.2. Highgate Center Results of the illicit discharge detection work in Highgate Center were summarized in a letter dated November 3, 2009 to David Jescavage, Highgate Center Town Administrator (Appendix C). There are two closed drainage systems in Highgate Center, each consisting of several catch basins discharging to an outfall that was inaccessible or that could not be located. Four catch basins were assessed on July 22, 2009, including the first catch basin up from the outfall in both drainage systems. Specific conductance in samples collected from each catch basin was low, ranging from 251 to 329 µS/cm. No ammonia, detergents, or optical brighteners were detected in any of the catch basins tested with the exception of a low concentration of detergents at catch basin HC-020. We suspect the apparent detergents detection at HC-020 resulted from interference by high turbidity (colloidal clays) rather than presence of synthetic detergent. Because the detergents test result was low and likely not valid and there were no other indications of contamination at this catch basin, no further investigation was considered necessary. We concluded that no contaminated dry-weather flows were detected in stormwater structures in Highgate Center.
3.3. Montgomery Center Results of the illicit discharge detection work in Montgomery Center were summarized in a letter dated November 3, 2009 to Mark Brouillette of the Montgomery Water Department (Appendix D). On July 6, 2009, we assessed all five stormwater outfalls in Montgomery Center during dry-weather conditions. Two outfalls were dry. Water quality tests were conducted at the three flowing outfalls and at a catch basin on Main Street (identified as MG-030). No ammonia, detergents, or optical brighteners were detected at the outfalls. Specific conductance in samples collected from each outfall was low, ranging from 262 to 364 µS/cm. We did detect both ammonia and detergents at catch basin MG-030, although the detergents test result was of questionable accuracy (a green color developed instead of the intended methylene blue color, likely due to the presence of an interfering chemical). Catch basin MG-030 discharges at outfall MG-010.
Due to the apparent detections of ammonia and detergents at catch basin MG-030 on July 6, we collected follow-up samples at outfall MG-010 for analysis of E. coli and total phosphorus. Very low concentrations of E. coli (30 MPN/100 mL) and total phosphorus (0.016 mg/L) were found in a grab sample collected on August 20, 2009. Further, no dry-weather flow was observed at catch basin MG-030 on August 20 or on two later dates, September 3 and 17, 2009.
In summary, we detected no contaminated dry-weather flows in stormwater structures in Montgomery Center, except for a one-time occurrence of ammonia and possibly detergents in catch basin MG-030 on Main Street. We suspect the contamination observed in catch basin MG-030 was related to washwater runoff or direct dumping to the basin. The November 3, 2009 letter to Mr. Broulliette recommended that the Montgomery Water Department inspect this catch basin periodically to check for detergent suds, odors, or other signs of contamination, and, if found, to advise neighboring residents and business owners not to allow washwater and other contaminated flows to enter the town’s stormwater drainage system.
Center for Clean and Clear / Missisquoi Basin IDDE / March 20, 2011 11

3.4. North Troy Results of the illicit discharge detection work in North Troy were summarized in letters dated November 11, 2009 and January 8, 2010 to Marcel Mayhew of the North Troy Water Treatment Plant (Appendix E). On June 24, 2009, we assessed 10 stormwater structures in North Troy during dry-weather conditions. Five stormwater outfalls were dry when visited. Water quality tests were conducted at the five flowing structures, which included three outfalls (identified as NT-010, NT-060, and NT-080), a stream culvert (NT-050), and a catch basin (NT-100). We sampled flow at catch basin NT-100 because we could not locate the outfall for this storm sewer (we expect it is buried); catch basin NT-100 is the last accessible structure on this stormline, closest to discharge point.
We did not observe obvious signs of contamination, such as suds, staining, and odors, at any of the structures we assessed on June 24. Eight of the ten structures assessed were either dry or had no detectable contamination. Specific conductance in samples collected at each flowing structure were low to moderate, ranging from 240 to 690 µS/cm. Optical brightener detections indicated the presence of washwater or sanitary wastewater contamination in dry-weather flows at two outfall pipes: an outfall below Nason Terrace (NT-010) and an outfall off Railroad Street near the School Street intersection (NT-060). Because ammonia and detergent concentrations were below detection, we suspected that the apparent wastewater or washwater discharges were substantially diluted by uncontaminated water. Due to the detection of optical brighteners at outfalls NT-010 and NT-060, we collected samples for E. coli and total phosphorus analysis and attempted to trace the sources of the contamination up the stormlines.
NT-010
Outfall NT-010 (Figure 4) had a low total phosphorus concentration (0.087 mg/L) and an elevated E. coli level (720 MPN/100 mL) in grab samples collected on August 20, 2009. On the three dates we investigated the NT-010 system (6/24/09, 8/20/09, and 9/18/09), most of the flow was contributed by a stream that runs along the backside of properties on Pleasant Street. This stream flows through a culvert into a catch basin (NT-010A) on Nason Terrace, into which a storm sewer on North Pleasant Street also drains. When observed on August 20 and September 18, the storm sewer pipe was trickling, while the next catch basin (NT-010B) up the stormline was dry. The combined flow then passes under Nason Terrace to the outfall. To determine whether the contamination present at the outfall originated in the stream or in the North Pleasant Street storm sewer, we intended to sample both flows at the Nason Terrace catch basin, but, unfortunately, the catch basin grate was stuck fast.
On December 16, 2009, we attempted to find sources of washwater or sanitary wastewater entering the NT-010 system using a smoke blower and theater smoke. Wayne Graham of the Vermont Rural Water Association installed the blower over the catch basin immediately up from the outfall pipe (NT-010A) and we observed building vents for signs of smoke, which would indicate connection between the storm sewer and the building sewer. No smoke was observed issuing from any building vent. Based on Mr. Mayhew’s description, there are two or three houses that could possibly have an inappropriate connection to this system. We attempted to inspect interior plumbing; however no one was home at the
Center for Clean and Clear / Missisquoi Basin IDDE / March 20, 2011 12
houses in this area. We therefore recommended that Mr. Mayhew inspect building sewer connections at #137 Nason Terrace, #364 Pleasant Street, and any other potentially connected buildings when possible and require correction of any improper connections.
NT-060
Outfall NT-060 (Figure 5) had a low concentration of total phosphorus (0.045 mg/L) and E. coli (140 MPN/100 mL) in grab samples collected on August 20, 2009. On August 20, optical brightener monitoring pads were set in every accessible structure in the storm sewer discharging at outfall NT-060. Optical brighteners were detected up the stormline on School Street and Main Street up to and including the catch basin identified as NT-060G, near #129 Main Street. Up the stormline beyond this point no optical brightener was detected. We revisited catch basin NT-060G on September 18, 2009 and noted a septic odor, but could not collect a water sample because this is an irregular structure with a narrow diameter drop inlet pipe.
On December 16, 2009 we attempted to find sources of washwater or sanitary wastewater entering the NT-060 system by smoke testing. No smoke was observed issuing from any building vent. Smoke was observed seeping through the cracked foundation of an abandoned house, which suggests a connected floor drain; however, this house has not been occupied for many years, so it is not the source of the contamination. The church building does not have laundry facilities, ruling out this building as the source of contamination. Because smoke testing was not definitive, we entered houses to inspect plumbing connections, where residents were at home. We inspected three houses near the NT-060G catch basin and found an inappropriate connection from a laundry machine to the storm sewer in one of them, #49 Robinson Road. At this home, we also found an open sanitary line in the basement. Since this inspection, Mr. Mayhew obtained a small grant for the elderly homeowner through Gilman Housing to enable the plumbing correction, which he believes has been completed.
3.5. Richford An initial discharge assessment in Richford in July and August 2009 indicated that there were five locations with potentially contaminated dry weather flows, among 21 discharge points, 17 of which were flowing when assessed. Results of the illicit discharge detection work in Richford were summarized in letters to town officials dated October 7, 2009 and January 14, 2010 (Appendix F). Investigations of the five locations with suspected contaminated discharges are described individually as follows.
RF-010X and RF-010Z
Several pipes and groundwater seeps emerge from the riverbank below the parking lot between the Sunoco gas station and the TD Bank building on Main Street (Figure 6). Roughly in the middle of the bank is a 12-inch diameter concrete outfall pipe (RF-010Y) from the storm sewer on Main Street. Connection of the Main Street catch basins to outfall RF-010Y was confirmed by dye testing. Dry weather flow from this outfall is not contaminated. However, there are groundwater seeps and two other pipes (RF-010X and RF-010Z) that appear to pass contaminated dry weather flows. A fourth pipe
Center for Clean and Clear / Missisquoi Basin IDDE / March 20, 2011 13
protruding from the bank, a 4-inch diameter iron pipe discovered toward the end of the project, was not tested. With the exception of RF-010Y, none of the pipes is connected to a surface inlet.
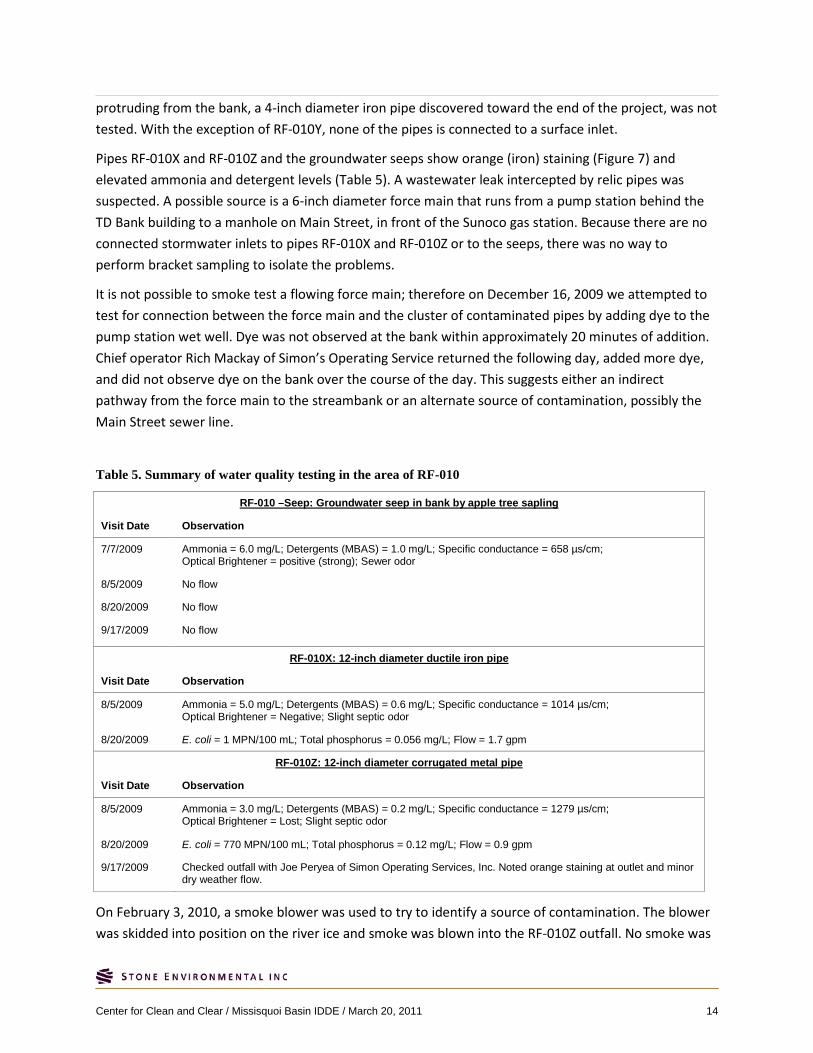
Pipes RF-010X and RF-010Z and the groundwater seeps show orange (iron) staining (Figure 7) and elevated ammonia and detergent levels (Table 5). A wastewater leak intercepted by relic pipes was suspected. A possible source is a 6-inch diameter force main that runs from a pump station behind the TD Bank building to a manhole on Main Street, in front of the Sunoco gas station. Because there are no connected stormwater inlets to pipes RF-010X and RF-010Z or to the seeps, there was no way to perform bracket sampling to isolate the problems.
It is not possible to smoke test a flowing force main; therefore on December 16, 2009 we attempted to test for connection between the force main and the cluster of contaminated pipes by adding dye to the pump station wet well. Dye was not observed at the bank within approximately 20 minutes of addition. Chief operator Rich Mackay of Simon’s Operating Service returned the following day, added more dye, and did not observe dye on the bank over the course of the day. This suggests either an indirect pathway from the force main to the streambank or an alternate source of contamination, possibly the Main Street sewer line.
Table 5. Summary of water quality testing in the area of RF-010
RF-010 –Seep: Groundwater seep in bank by apple tree sapling
Visit Date Observation
7/7/2009 Ammonia = 6.0 mg/L; Detergents (MBAS) = 1.0 mg/L; Specific conductance = 658 µs/cm; Optical Brightener = positive (strong); Sewer odor
8/5/2009 No flow
8/20/2009 No flow
9/17/2009 No flow
RF-010X: 12-inch diameter ductile iron pipe
Visit Date Observation
8/5/2009 Ammonia = 5.0 mg/L; Detergents (MBAS) = 0.6 mg/L; Specific conductance = 1014 µs/cm; Optical Brightener = Negative; Slight septic odor
8/20/2009 E. coli = 1 MPN/100 mL; Total phosphorus = 0.056 mg/L; Flow = 1.7 gpm
RF-010Z: 12-inch diameter corrugated metal pipe
Visit Date Observation
8/5/2009 Ammonia = 3.0 mg/L; Detergents (MBAS) = 0.2 mg/L; Specific conductance = 1279 µs/cm; Optical Brightener = Lost; Slight septic odor
8/20/2009 E. coli = 770 MPN/100 mL; Total phosphorus = 0.12 mg/L; Flow = 0.9 gpm
9/17/2009 Checked outfall with Joe Peryea of Simon Operating Services, Inc. Noted orange staining at outlet and minor dry weather flow.
On February 3, 2010, a smoke blower was used to try to identify a source of contamination. The blower was skidded into position on the river ice and smoke was blown into the RF-010Z outfall. No smoke was
Center for Clean and Clear / Missisquoi Basin IDDE / March 20, 2011 14
observed, confirming that outfall RF-010Z is a relic pipe buried in the earth as expected. Smoke was also blown into the sanitary manhole on Main Street in front of the Sunoco gas station to check for leaks in the gravity sewer. The only problem identified as a result of this testing was a floor drain in the town hall with a dry trap, which had been venting sewer gases into the building.
Dye testing the force main and smoke testing pipe RF-010Z did not identify a contaminant source. It was not possible to deploy the closed circuit television camera in the force main nor was it possible to use the camera in any of the three suspect pipes (RF-010X and the unnamed pipe were too narrow and pipe RF-010Z was corrugated). Attempts to identify a source of contamination were then discontinued because we lacked any further investigation methods.
RF-045 and RF-050
Pipes RF-045 and RF-050 discharge to the Missisquoi River from a low bank south of the wastewater pumping station (Figure 8). These pipes are accessible via a dirt track extending from the end of Willow Street. RF-050 is a 12-inch diameter corrugated metal stormwater outfall draining a section of Route 105 south of Main Street. RF-045 is a 24-inch diameter pipe located approximately 10 feet downstream from RF-050. RF-045 has a crushed end and no apparent connection to any stormwater inlet.
On August 5, 20009, ammonia was detected at outfall RF-050, but not at the next accessible structure up the pipe, a manhole in a backyard off Troy Avenue. Therefore, we expected that contamination was entering the stormline in the vicinity of the sewer line crossing.
Samples collected at RF-050 on August 20, 2009 had a high concentration of E. coli (>2,400 MPN/100 mL) but moderately low total phosphorus concentration (0.056 mg/L) (Table 6). The high level of E. coli confirmed that the dry weather flow was contaminated.
Table 6. Summary of water quality testing at RF-050
Visit Date Observation
8/5/2009 Orange (iron) staining at outfall. Ammonia = 1.0 mg/L; Detergents (MBAS) = 0.1 mg/L; Specific conductance = 938 µs/cm; Optical brightener = Lost
Also tested the first up-pipe structure, a manhole in a yard off Troy Avenue: Ammonia = 0.0 mg/L; Detergents (MBAS) = 0.0 mg/L; Specific conductance = 929 µs/cm
8/20/2009 E. coli = > 2,400 MPN/100 mL; Total phosphorus = 0.055 mg/L; Flow = 3.4 gpm
9/17/2009 Checked outfall with Joe Peryea of Simon Operating Services, Inc. Noted orange staining and foam accumulation at outlet
RF-045 and RF-050 were investigated on two occasions after the initial assessment. On December 16, 2009, Dave Braun, Wayne Graham of Vermont Rural Water Association, and Rich Mackay of Simon Operating Service (a contractor responsible for operation of the wastewater treatment plant) smoke tested the sanitary sewer line in the vicinity of RF-045 and RF-050, at the manhole labeled SMH#9-A on town sewer maps (Figure 9). Both RF-045 and RF-050 were flowing during dry (winter) conditions. Almost immediately smoke issued from outfall RF-045 in great quantity (Figure 10). This indicates a
Center for Clean and Clear / Missisquoi Basin IDDE / March 20, 2011 15
more or less direct connection between the sanitary sewer and outfall RF-045. After approximately 10 minutes, smoke began issuing from pipe RF-050 (Figure 11), suggesting an indirect connection between the sanitary sewer and this pipe. Further inspection of sanitary manhole SMH#9-A revealed an outlet pipe high on the structure’s wall. This appears to be a sewer overflow. The inlet end of the pipe appears sealed with concrete; however, a Y-connection on the pipe does not appear plugged. We sealed this Y-connection temporarily and restarted the smoke test to see if this stopped the flow of smoke from RF-045 or RF-050, but this did not appear to make any difference. The Y-connection in this manhole may be an undocumented sanitary sewer overflow, but its presence explains neither the contaminated dry weather flows nor the smoke observed at outfalls RF-045 and RF-050.
On February 3, 2010, Dave Braun, Wayne Graham, and Rich Mackay made a second attempt to identify the source of contaminated dry weather flows at RF-045 and RF-050. A camera was deployed through the SMH#9-A sanitary sewer manhole; however it was quickly blocked by sand deposits in the sewer line.
RF-140
RF-140 is a cluster of three 4-inch diameter PVC pipes protruding from the bank below the South Main Quick Stop gas station. The pipes outlet to a road ditch. On July 7, field scientists noted dry weather flows and a strong gasoline odor emanating from these pipes. According to the town roads superintendent John Nutting, the pipes likely drain the area surrounding the underground fuel tanks, which were replaced within the last few years. On subsequent inspections (8/5/09 and 9/18/09) no dry weather flows or odors beyond what one would expect at a gas station were observed. Because the tanks were reportedly replaced and there is no ongoing release evident, no further action was recommended for this location.
RF-230
RF-230 is a 30-inch diameter corrugated steel outfall pipe located across railroad tracks behind the Blue Seal Feeds factory (Figure 12). It discharges to a small stream. The municipal storm sewer on Province Street is connected to a network of catch basins, roof leaders, and culverts on the Blue Seal property, all of which discharge at RF-230.
RF-230 was assessed on four dates (Table 7). Water quality tests indicated a problem at the outfall that was not present in the municipal storm sewer; therefore we suspected a source on the Blue Seal property. Ammonia and detergents were elevated and samples collected on August 20, 2009 had high E. coli (> 2,400 MPN/100 mL) and total phosphorus (3.9 mg/L) concentrations. On September 17, 2009, Dave Braun and John Nutting, representing the Town of Richford, met with Blue Seal personnel and traced (dye tested) the source of the dry weather flow at RF-230 to floor drains within the Blue Seal facility.
Center for Clean and Clear / Missisquoi Basin IDDE / March 20, 2011 16
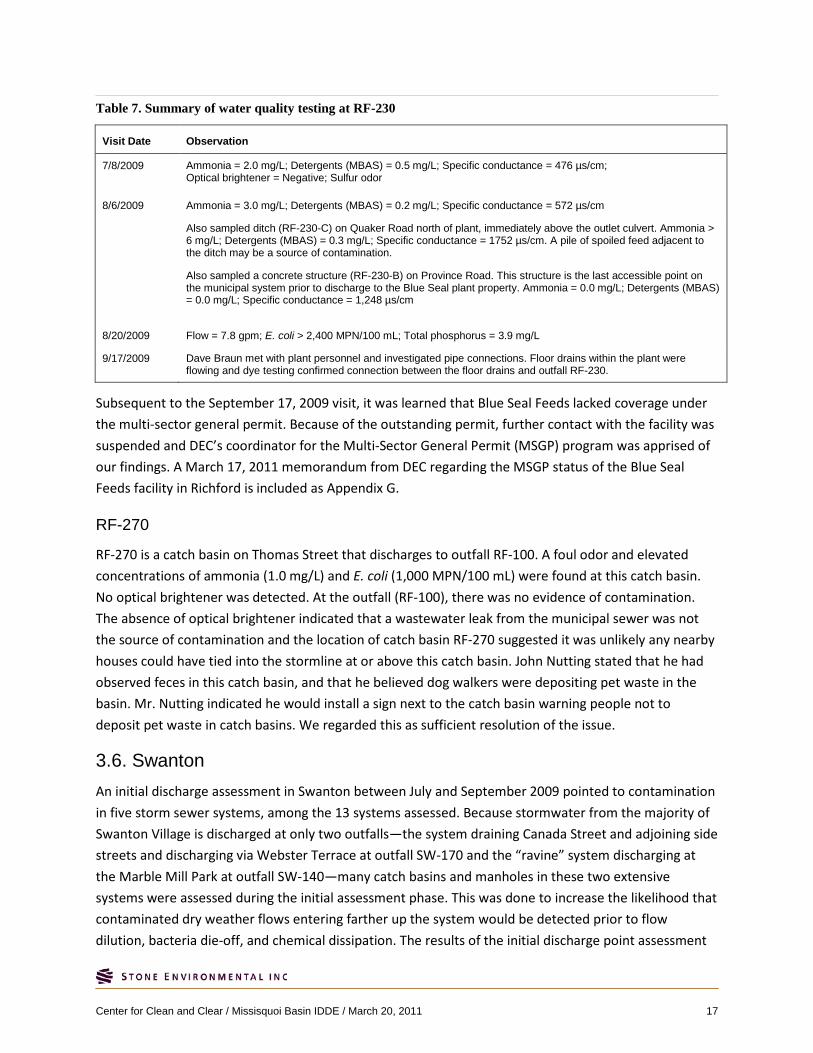
Table 7. Summary of water quality testing at RF-230
Visit Date Observation
7/8/2009 Ammonia = 2.0 mg/L; Detergents (MBAS) = 0.5 mg/L; Specific conductance = 476 µs/cm; Optical brightener = Negative; Sulfur odor
8/6/2009 Ammonia = 3.0 mg/L; Detergents (MBAS) = 0.2 mg/L; Specific conductance = 572 µs/cm
Also sampled ditch (RF-230-C) on Quaker Road north of plant, immediately above the outlet culvert. Ammonia > 6 mg/L; Detergents (MBAS) = 0.3 mg/L; Specific conductance = 1752 µs/cm. A pile of spoiled feed adjacent to the ditch may be a source of contamination.
Also sampled a concrete structure (RF-230-B) on Province Road. This structure is the last accessible point on the municipal system prior to discharge to the Blue Seal plant property. Ammonia = 0.0 mg/L; Detergents (MBAS) = 0.0 mg/L; Specific conductance = 1,248 µs/cm
8/20/2009 Flow = 7.8 gpm; E. coli > 2,400 MPN/100 mL; Total phosphorus = 3.9 mg/L
9/17/2009 Dave Braun met with plant personnel and investigated pipe connections. Floor drains within the plant were flowing and dye testing confirmed connection between the floor drains and outfall RF-230.
Subsequent to the September 17, 2009 visit, it was learned that Blue Seal Feeds lacked coverage under the multi-sector general permit. Because of the outstanding permit, further contact with the facility was suspended and DEC’s coordinator for the Multi-Sector General Permit (MSGP) program was apprised of our findings. A March 17, 2011 memorandum from DEC regarding the MSGP status of the Blue Seal Feeds facility in Richford is included as Appendix G.
RF-270
RF-270 is a catch basin on Thomas Street that discharges to outfall RF-100. A foul odor and elevated concentrations of ammonia (1.0 mg/L) and E. coli (1,000 MPN/100 mL) were found at this catch basin. No optical brightener was detected. At the outfall (RF-100), there was no evidence of contamination. The absence of optical brightener indicated that a wastewater leak from the municipal sewer was not the source of contamination and the location of catch basin RF-270 suggested it was unlikely any nearby houses could have tied into the stormline at or above this catch basin. John Nutting stated that he had observed feces in this catch basin, and that he believed dog walkers were depositing pet waste in the basin. Mr. Nutting indicated he would install a sign next to the catch basin warning people not to deposit pet waste in catch basins. We regarded this as sufficient resolution of the issue.
3.6. Swanton An initial discharge assessment in Swanton between July and September 2009 pointed to contamination in five storm sewer systems, among the 13 systems assessed. Because stormwater from the majority of Swanton Village is discharged at only two outfalls—the system draining Canada Street and adjoining side streets and discharging via Webster Terrace at outfall SW-170 and the “ravine” system discharging at the Marble Mill Park at outfall SW-140—many catch basins and manholes in these two extensive systems were assessed during the initial assessment phase. This was done to increase the likelihood that contaminated dry weather flows entering farther up the system would be detected prior to flow dilution, bacteria die-off, and chemical dissipation. The results of the initial discharge point assessment
Center for Clean and Clear / Missisquoi Basin IDDE / March 20, 2011 17
in the Village of Swanton were presented to Mike Menard, Director of Public Works, in a letter dated November 3, 2009 (Appendix H). Investigations of the five storm sewers with suspected contaminated discharges are described individually as follows.
SW-140 (Ravine System)
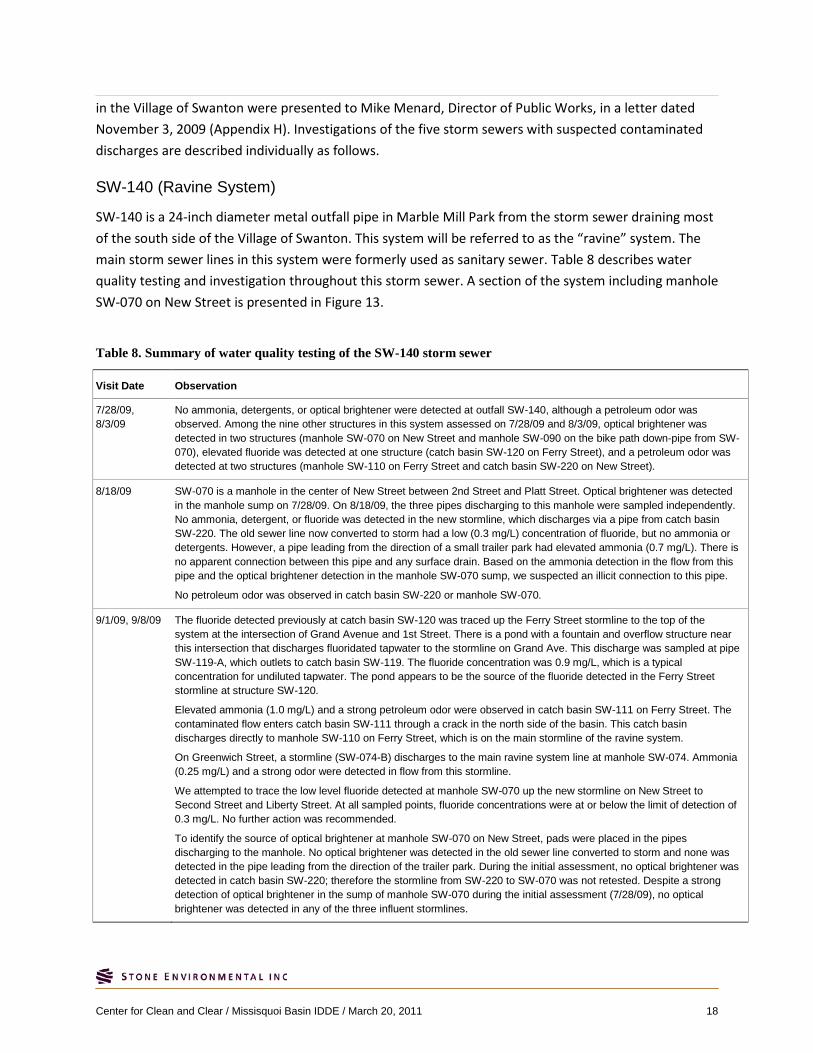
SW-140 is a 24-inch diameter metal outfall pipe in Marble Mill Park from the storm sewer draining most of the south side of the Village of Swanton. This system will be referred to as the “ravine” system. The main storm sewer lines in this system were formerly used as sanitary sewer. Table 8 describes water quality testing and investigation throughout this storm sewer. A section of the system including manhole SW-070 on New Street is presented in Figure 13.
Table 8. Summary of water quality testing of the SW-140 storm sewer
Visit Date Observation
7/28/09, 8/3/09
No ammonia, detergents, or optical brightener were detected at outfall SW-140, although a petroleum odor was observed. Among the nine other structures in this system assessed on 7/28/09 and 8/3/09, optical brightener was detected in two structures (manhole SW-070 on New Street and manhole SW-090 on the bike path down-pipe from SW-070), elevated fluoride was detected at one structure (catch basin SW-120 on Ferry Street), and a petroleum odor was detected at two structures (manhole SW-110 on Ferry Street and catch basin SW-220 on New Street).
8/18/09 SW-070 is a manhole in the center of New Street between 2nd Street and Platt Street. Optical brightener was detected in the manhole sump on 7/28/09. On 8/18/09, the three pipes discharging to this manhole were sampled independently. No ammonia, detergent, or fluoride was detected in the new stormline, which discharges via a pipe from catch basin SW-220. The old sewer line now converted to storm had a low (0.3 mg/L) concentration of fluoride, but no ammonia or detergents. However, a pipe leading from the direction of a small trailer park had elevated ammonia (0.7 mg/L). There is no apparent connection between this pipe and any surface drain. Based on the ammonia detection in the flow from this pipe and the optical brightener detection in the manhole SW-070 sump, we suspected an illicit connection to this pipe.
No petroleum odor was observed in catch basin SW-220 or manhole SW-070.
9/1/09, 9/8/09 The fluoride detected previously at catch basin SW-120 was traced up the Ferry Street stormline to the top of the system at the intersection of Grand Avenue and 1st Street. There is a pond with a fountain and overflow structure near this intersection that discharges fluoridated tapwater to the stormline on Grand Ave. This discharge was sampled at pipe SW-119-A, which outlets to catch basin SW-119. The fluoride concentration was 0.9 mg/L, which is a typical concentration for undiluted tapwater. The pond appears to be the source of the fluoride detected in the Ferry Street stormline at structure SW-120.
Elevated ammonia (1.0 mg/L) and a strong petroleum odor were observed in catch basin SW-111 on Ferry Street. The contaminated flow enters catch basin SW-111 through a crack in the north side of the basin. This catch basin discharges directly to manhole SW-110 on Ferry Street, which is on the main stormline of the ravine system.
On Greenwich Street, a stormline (SW-074-B) discharges to the main ravine system line at manhole SW-074. Ammonia (0.25 mg/L) and a strong odor were detected in flow from this stormline.
We attempted to trace the low level fluoride detected at manhole SW-070 up the new stormline on New Street to Second Street and Liberty Street. At all sampled points, fluoride concentrations were at or below the limit of detection of 0.3 mg/L. No further action was recommended.
To identify the source of optical brightener at manhole SW-070 on New Street, pads were placed in the pipes discharging to the manhole. No optical brightener was detected in the old sewer line converted to storm and none was detected in the pipe leading from the direction of the trailer park. During the initial assessment, no optical brightener was detected in catch basin SW-220; therefore the stormline from SW-220 to SW-070 was not retested. Despite a strong detection of optical brightener in the sump of manhole SW-070 during the initial assessment (7/28/09), no optical brightener was detected in any of the three influent stormlines.
Center for Clean and Clear / Missisquoi Basin IDDE / March 20, 2011 18
Visit Date Observation
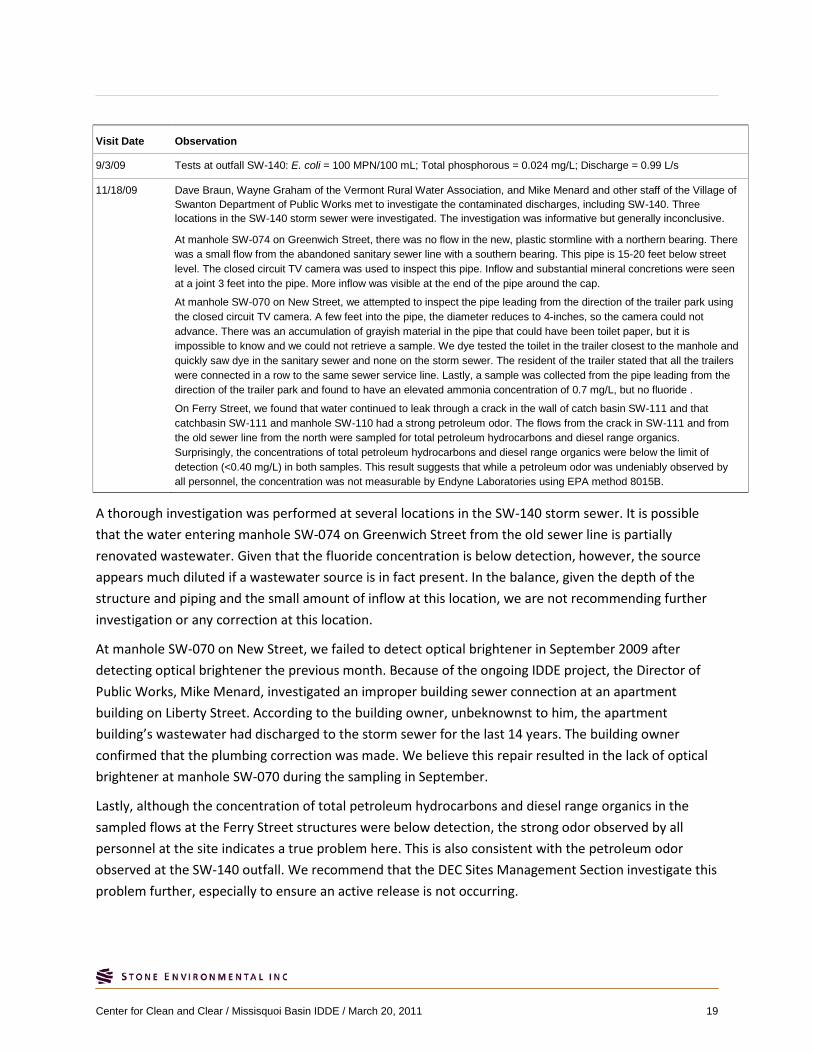
9/3/09 Tests at outfall SW-140: E. coli = 100 MPN/100 mL; Total phosphorous = 0.024 mg/L; Discharge = 0.99 L/s
11/18/09 Dave Braun, Wayne Graham of the Vermont Rural Water Association, and Mike Menard and other staff of the Village of Swanton Department of Public Works met to investigate the contaminated discharges, including SW-140. Three locations in the SW-140 storm sewer were investigated. The investigation was informative but generally inconclusive.
At manhole SW-074 on Greenwich Street, there was no flow in the new, plastic stormline with a northern bearing. There was a small flow from the abandoned sanitary sewer line with a southern bearing. This pipe is 15-20 feet below street level. The closed circuit TV camera was used to inspect this pipe. Inflow and substantial mineral concretions were seen at a joint 3 feet into the pipe. More inflow was visible at the end of the pipe around the cap.
At manhole SW-070 on New Street, we attempted to inspect the pipe leading from the direction of the trailer park using the closed circuit TV camera. A few feet into the pipe, the diameter reduces to 4-inches, so the camera could not advance. There was an accumulation of grayish material in the pipe that could have been toilet paper, but it is impossible to know and we could not retrieve a sample. We dye tested the toilet in the trailer closest to the manhole and quickly saw dye in the sanitary sewer and none on the storm sewer. The resident of the trailer stated that all the trailers were connected in a row to the same sewer service line. Lastly, a sample was collected from the pipe leading from the direction of the trailer park and found to have an elevated ammonia concentration of 0.7 mg/L, but no fluoride .
On Ferry Street, we found that water continued to leak through a crack in the wall of catch basin SW-111 and that catchbasin SW-111 and manhole SW-110 had a strong petroleum odor. The flows from the crack in SW-111 and from the old sewer line from the north were sampled for total petroleum hydrocarbons and diesel range organics. Surprisingly, the concentrations of total petroleum hydrocarbons and diesel range organics were below the limit of detection (<0.40 mg/L) in both samples. This result suggests that while a petroleum odor was undeniably observed by all personnel, the concentration was not measurable by Endyne Laboratories using EPA method 8015B.
A thorough investigation was performed at several locations in the SW-140 storm sewer. It is possible that the water entering manhole SW-074 on Greenwich Street from the old sewer line is partially renovated wastewater. Given that the fluoride concentration is below detection, however, the source appears much diluted if a wastewater source is in fact present. In the balance, given the depth of the structure and piping and the small amount of inflow at this location, we are not recommending further investigation or any correction at this location.
At manhole SW-070 on New Street, we failed to detect optical brightener in September 2009 after detecting optical brightener the previous month. Because of the ongoing IDDE project, the Director of Public Works, Mike Menard, investigated an improper building sewer connection at an apartment building on Liberty Street. According to the building owner, unbeknownst to him, the apartment building’s wastewater had discharged to the storm sewer for the last 14 years. The building owner confirmed that the plumbing correction was made. We believe this repair resulted in the lack of optical brightener at manhole SW-070 during the sampling in September.
Lastly, although the concentration of total petroleum hydrocarbons and diesel range organics in the sampled flows at the Ferry Street structures were below detection, the strong odor observed by all personnel at the site indicates a true problem here. This is also consistent with the petroleum odor observed at the SW-140 outfall. We recommend that the DEC Sites Management Section investigate this problem further, especially to ensure an active release is not occurring.
Center for Clean and Clear / Missisquoi Basin IDDE / March 20, 2011 19
SW-150
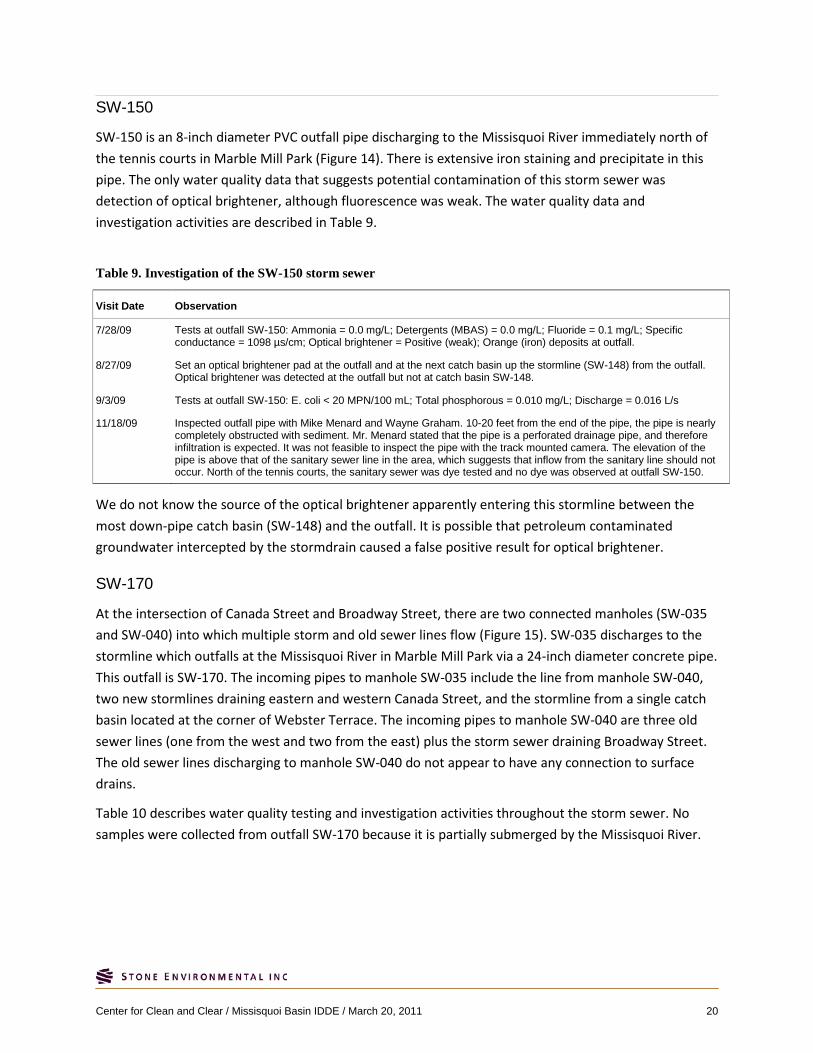
SW-150 is an 8-inch diameter PVC outfall pipe discharging to the Missisquoi River immediately north of the tennis courts in Marble Mill Park (Figure 14). There is extensive iron staining and precipitate in this pipe. The only water quality data that suggests potential contamination of this storm sewer was detection of optical brightener, although fluorescence was weak. The water quality data and investigation activities are described in Table 9.
Table 9. Investigation of the SW-150 storm sewer
Visit Date Observation
7/28/09 Tests at outfall SW-150: Ammonia = 0.0 mg/L; Detergents (MBAS) = 0.0 mg/L; Fluoride = 0.1 mg/L; Specific conductance = 1098 µs/cm; Optical brightener = Positive (weak); Orange (iron) deposits at outfall.
8/27/09 Set an optical brightener pad at the outfall and at the next catch basin up the stormline (SW-148) from the outfall. Optical brightener was detected at the outfall but not at catch basin SW-148.
9/3/09 Tests at outfall SW-150: E. coli < 20 MPN/100 mL; Total phosphorous = 0.010 mg/L; Discharge = 0.016 L/s
11/18/09 Inspected outfall pipe with Mike Menard and Wayne Graham. 10-20 feet from the end of the pipe, the pipe is nearly completely obstructed with sediment. Mr. Menard stated that the pipe is a perforated drainage pipe, and therefore infiltration is expected. It was not feasible to inspect the pipe with the track mounted camera. The elevation of the pipe is above that of the sanitary sewer line in the area, which suggests that inflow from the sanitary line should not occur. North of the tennis courts, the sanitary sewer was dye tested and no dye was observed at outfall SW-150.
We do not know the source of the optical brightener apparently entering this stormline between the most down-pipe catch basin (SW-148) and the outfall. It is possible that petroleum contaminated groundwater intercepted by the stormdrain caused a false positive result for optical brightener.
SW-170
At the intersection of Canada Street and Broadway Street, there are two connected manholes (SW-035 and SW-040) into which multiple storm and old sewer lines flow (Figure 15). SW-035 discharges to the stormline which outfalls at the Missisquoi River in Marble Mill Park via a 24-inch diameter concrete pipe. This outfall is SW-170. The incoming pipes to manhole SW-035 include the line from manhole SW-040, two new stormlines draining eastern and western Canada Street, and the stormline from a single catch basin located at the corner of Webster Terrace. The incoming pipes to manhole SW-040 are three old sewer lines (one from the west and two from the east) plus the storm sewer draining Broadway Street. The old sewer lines discharging to manhole SW-040 do not appear to have any connection to surface drains.
Table 10 describes water quality testing and investigation activities throughout the storm sewer. No samples were collected from outfall SW-170 because it is partially submerged by the Missisquoi River.
Center for Clean and Clear / Missisquoi Basin IDDE / March 20, 2011 20
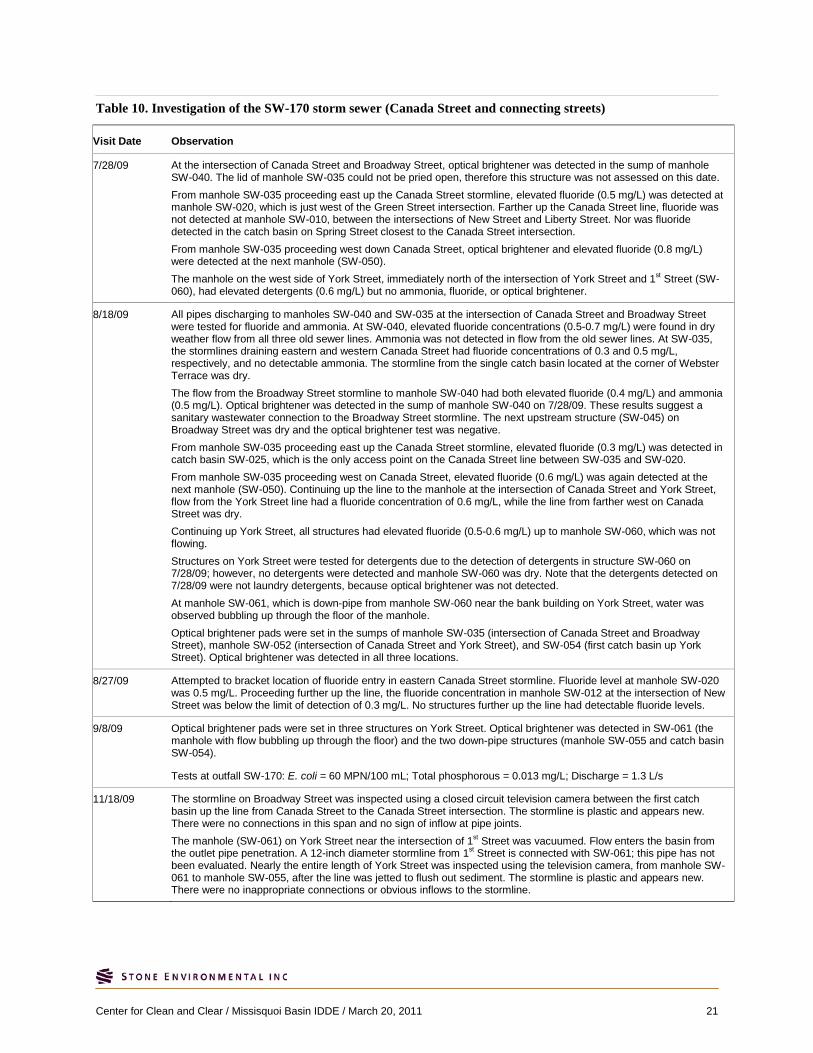
Table 10. Investigation of the SW-170 storm sewer (Canada Street and connecting streets)
Visit Date Observation
7/28/09 At the intersection of Canada Street and Broadway Street, optical brightener was detected in the sump of manhole SW-040. The lid of manhole SW-035 could not be pried open, therefore this structure was not assessed on this date. From manhole SW-035 proceeding east up the Canada Street stormline, elevated fluoride (0.5 mg/L) was detected at manhole SW-020, which is just west of the Green Street intersection. Farther up the Canada Street line, fluoride was not detected at manhole SW-010, between the intersections of New Street and Liberty Street. Nor was fluoride detected in the catch basin on Spring Street closest to the Canada Street intersection. From manhole SW-035 proceeding west down Canada Street, optical brightener and elevated fluoride (0.8 mg/L) were detected at the next manhole (SW-050). The manhole on the west side of York Street, immediately north of the intersection of York Street and 1st Street (SW-060), had elevated detergents (0.6 mg/L) but no ammonia, fluoride, or optical brightener.
8/18/09 All pipes discharging to manholes SW-040 and SW-035 at the intersection of Canada Street and Broadway Street were tested for fluoride and ammonia. At SW-040, elevated fluoride concentrations (0.5-0.7 mg/L) were found in dry weather flow from all three old sewer lines. Ammonia was not detected in flow from the old sewer lines. At SW-035, the stormlines draining eastern and western Canada Street had fluoride concentrations of 0.3 and 0.5 mg/L, respectively, and no detectable ammonia. The stormline from the single catch basin located at the corner of Webster Terrace was dry. The flow from the Broadway Street stormline to manhole SW-040 had both elevated fluoride (0.4 mg/L) and ammonia (0.5 mg/L). Optical brightener was detected in the sump of manhole SW-040 on 7/28/09. These results suggest a sanitary wastewater connection to the Broadway Street stormline. The next upstream structure (SW-045) on Broadway Street was dry and the optical brightener test was negative. From manhole SW-035 proceeding east up the Canada Street stormline, elevated fluoride (0.3 mg/L) was detected in catch basin SW-025, which is the only access point on the Canada Street line between SW-035 and SW-020. From manhole SW-035 proceeding west on Canada Street, elevated fluoride (0.6 mg/L) was again detected at the next manhole (SW-050). Continuing up the line to the manhole at the intersection of Canada Street and York Street, flow from the York Street line had a fluoride concentration of 0.6 mg/L, while the line from farther west on Canada Street was dry. Continuing up York Street, all structures had elevated fluoride (0.5-0.6 mg/L) up to manhole SW-060, which was not flowing. Structures on York Street were tested for detergents due to the detection of detergents in structure SW-060 on 7/28/09; however, no detergents were detected and manhole SW-060 was dry. Note that the detergents detected on 7/28/09 were not laundry detergents, because optical brightener was not detected. At manhole SW-061, which is down-pipe from manhole SW-060 near the bank building on York Street, water was observed bubbling up through the floor of the manhole. Optical brightener pads were set in the sumps of manhole SW-035 (intersection of Canada Street and Broadway Street), manhole SW-052 (intersection of Canada Street and York Street), and SW-054 (first catch basin up York Street). Optical brightener was detected in all three locations.
8/27/09 Attempted to bracket location of fluoride entry in eastern Canada Street stormline. Fluoride level at manhole SW-020 was 0.5 mg/L. Proceeding further up the line, the fluoride concentration in manhole SW-012 at the intersection of New Street was below the limit of detection of 0.3 mg/L. No structures further up the line had detectable fluoride levels.
9/8/09 Optical brightener pads were set in three structures on York Street. Optical brightener was detected in SW-061 (the manhole with flow bubbling up through the floor) and the two down-pipe structures (manhole SW-055 and catch basin SW-054).
Tests at outfall SW-170: E. coli = 60 MPN/100 mL; Total phosphorous = 0.013 mg/L; Discharge = 1.3 L/s
11/18/09 The stormline on Broadway Street was inspected using a closed circuit television camera between the first catch basin up the line from Canada Street to the Canada Street intersection. The stormline is plastic and appears new. There were no connections in this span and no sign of inflow at pipe joints. The manhole (SW-061) on York Street near the intersection of 1st Street was vacuumed. Flow enters the basin from the outlet pipe penetration. A 12-inch diameter stormline from 1st Street is connected with SW-061; this pipe has not been evaluated. Nearly the entire length of York Street was inspected using the television camera, from manhole SW-061 to manhole SW-055, after the line was jetted to flush out sediment. The stormline is plastic and appears new. There were no inappropriate connections or obvious inflows to the stormline.
Center for Clean and Clear / Missisquoi Basin IDDE / March 20, 2011 21
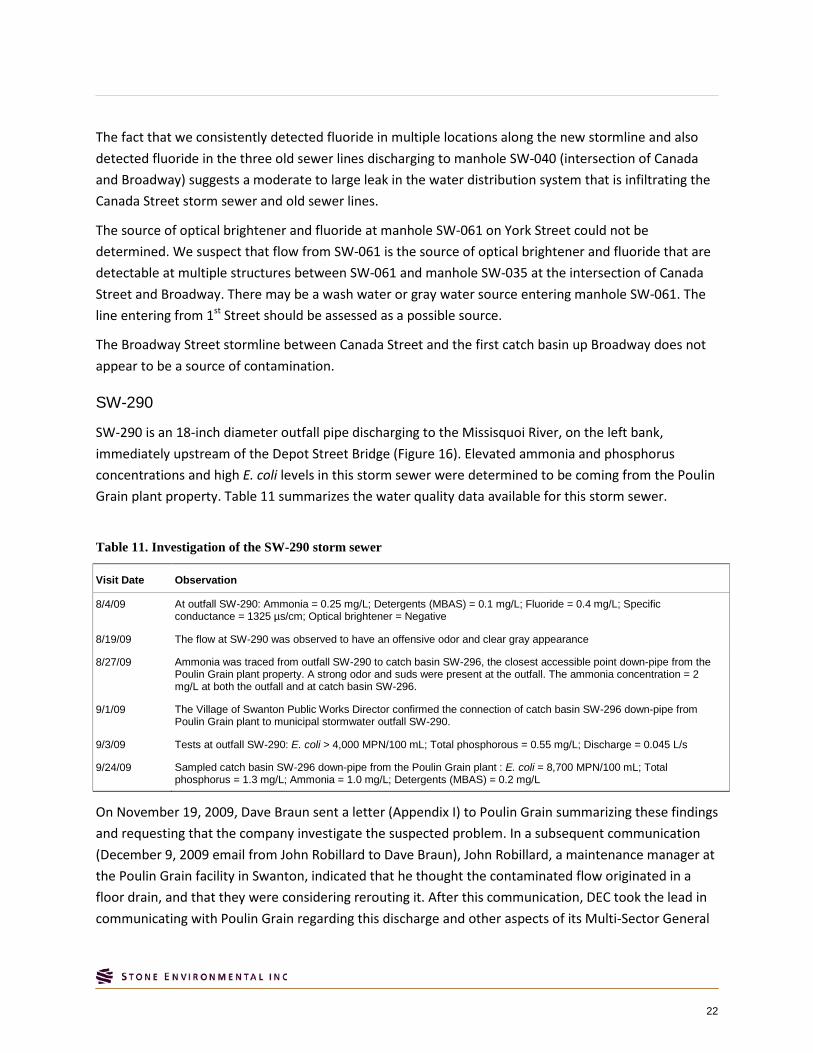
The fact that we consistently detected fluoride in multiple locations along the new stormline and also detected fluoride in the three old sewer lines discharging to manhole SW-040 (intersection of Canada and Broadway) suggests a moderate to large leak in the water distribution system that is infiltrating the Canada Street storm sewer and old sewer lines.
The source of optical brightener and fluoride at manhole SW-061 on York Street could not be determined. We suspect that flow from SW-061 is the source of optical brightener and fluoride that are detectable at multiple structures between SW-061 and manhole SW-035 at the intersection of Canada Street and Broadway. There may be a wash water or gray water source entering manhole SW-061. The line entering from 1st Street should be assessed as a possible source.
The Broadway Street stormline between Canada Street and the first catch basin up Broadway does not appear to be a source of contamination.
SW-290
SW-290 is an 18-inch diameter outfall pipe discharging to the Missisquoi River, on the left bank, immediately upstream of the Depot Street Bridge (Figure 16). Elevated ammonia and phosphorus concentrations and high E. coli levels in this storm sewer were determined to be coming from the Poulin Grain plant property. Table 11 summarizes the water quality data available for this storm sewer.
Table 11. Investigation of the SW-290 storm sewer
Visit Date Observation
8/4/09 At outfall SW-290: Ammonia = 0.25 mg/L; Detergents (MBAS) = 0.1 mg/L; Fluoride = 0.4 mg/L; Specific conductance = 1325 µs/cm; Optical brightener = Negative
8/19/09 The flow at SW-290 was observed to have an offensive odor and clear gray appearance
8/27/09 Ammonia was traced from outfall SW-290 to catch basin SW-296, the closest accessible point down-pipe from the Poulin Grain plant property. A strong odor and suds were present at the outfall. The ammonia concentration = 2 mg/L at both the outfall and at catch basin SW-296.
9/1/09 The Village of Swanton Public Works Director confirmed the connection of catch basin SW-296 down-pipe from Poulin Grain plant to municipal stormwater outfall SW-290.
9/3/09 Tests at outfall SW-290: E. coli > 4,000 MPN/100 mL; Total phosphorous = 0.55 mg/L; Discharge = 0.045 L/s
9/24/09 Sampled catch basin SW-296 down-pipe from the Poulin Grain plant : E. coli = 8,700 MPN/100 mL; Total phosphorus = 1.3 mg/L; Ammonia = 1.0 mg/L; Detergents (MBAS) = 0.2 mg/L
On November 19, 2009, Dave Braun sent a letter (Appendix I) to Poulin Grain summarizing these findings and requesting that the company investigate the suspected problem. In a subsequent communication (December 9, 2009 email from John Robillard to Dave Braun), John Robillard, a maintenance manager at the Poulin Grain facility in Swanton, indicated that he thought the contaminated flow originated in a floor drain, and that they were considering rerouting it. After this communication, DEC took the lead in communicating with Poulin Grain regarding this discharge and other aspects of its Multi-Sector General
22
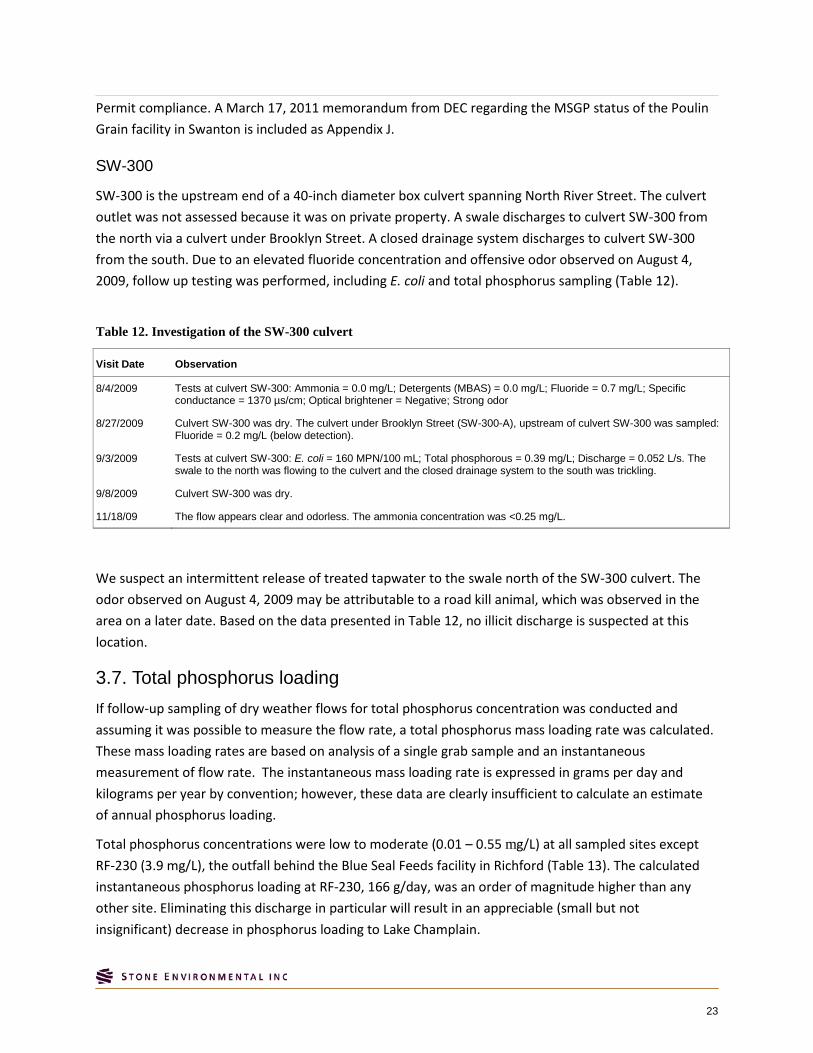
Permit compliance. A March 17, 2011 memorandum from DEC regarding the MSGP status of the Poulin Grain facility in Swanton is included as Appendix J.
SW-300
SW-300 is the upstream end of a 40-inch diameter box culvert spanning North River Street. The culvert outlet was not assessed because it was on private property. A swale discharges to culvert SW-300 from the north via a culvert under Brooklyn Street. A closed drainage system discharges to culvert SW-300 from the south. Due to an elevated fluoride concentration and offensive odor observed on August 4, 2009, follow up testing was performed, including E. coli and total phosphorus sampling (Table 12).
Table 12. Investigation of the SW-300 culvert
Visit Date Observation
8/4/2009 Tests at culvert SW-300: Ammonia = 0.0 mg/L; Detergents (MBAS) = 0.0 mg/L; Fluoride = 0.7 mg/L; Specific conductance = 1370 µs/cm; Optical brightener = Negative; Strong odor
8/27/2009 Culvert SW-300 was dry. The culvert under Brooklyn Street (SW-300-A), upstream of culvert SW-300 was sampled: Fluoride = 0.2 mg/L (below detection).
9/3/2009 Tests at culvert SW-300: E. coli = 160 MPN/100 mL; Total phosphorous = 0.39 mg/L; Discharge = 0.052 L/s. The swale to the north was flowing to the culvert and the closed drainage system to the south was trickling.
9/8/2009 Culvert SW-300 was dry.
11/18/09 The flow appears clear and odorless. The ammonia concentration was <0.25 mg/L.
We suspect an intermittent release of treated tapwater to the swale north of the SW-300 culvert. The odor observed on August 4, 2009 may be attributable to a road kill animal, which was observed in the area on a later date. Based on the data presented in Table 12, no illicit discharge is suspected at this location.
3.7. Total phosphorus loading If follow-up sampling of dry weather flows for total phosphorus concentration was conducted and assuming it was possible to measure the flow rate, a total phosphorus mass loading rate was calculated. These mass loading rates are based on analysis of a single grab sample and an instantaneous measurement of flow rate. The instantaneous mass loading rate is expressed in grams per day and kilograms per year by convention; however, these data are clearly insufficient to calculate an estimate of annual phosphorus loading.
Total phosphorus concentrations were low to moderate (0.01 – 0.55 mg/L) at all sampled sites except RF-230 (3.9 mg/L), the outfall behind the Blue Seal Feeds facility in Richford (Table 13). The calculated instantaneous phosphorus loading at RF-230, 166 g/day, was an order of magnitude higher than any other site. Eliminating this discharge in particular will result in an appreciable (small but not insignificant) decrease in phosphorus loading to Lake Champlain.
23
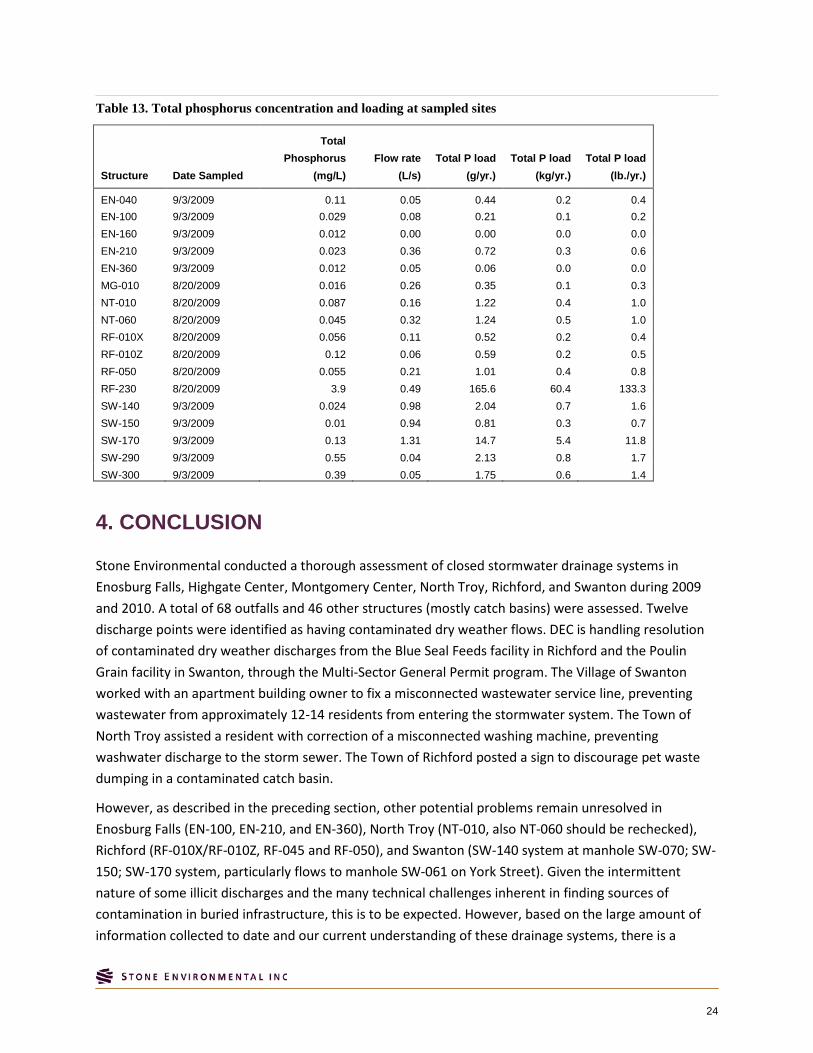
Table 13. Total phosphorus concentration and loading at sampled sites
Structure Date Sampled
Total Phosphorus
(mg/L) Flow rate
(L/s) Total P load
(g/yr.) Total P load
(kg/yr.) Total P load
(lb./yr.)
EN-040 9/3/2009 0.11 0.05 0.44 0.2 0.4 EN-100 9/3/2009 0.029 0.08 0.21 0.1 0.2 EN-160 9/3/2009 0.012 0.00 0.00 0.0 0.0 EN-210 9/3/2009 0.023 0.36 0.72 0.3 0.6 EN-360 9/3/2009 0.012 0.05 0.06 0.0 0.0 MG-010 8/20/2009 0.016 0.26 0.35 0.1 0.3 NT-010 8/20/2009 0.087 0.16 1.22 0.4 1.0 NT-060 8/20/2009 0.045 0.32 1.24 0.5 1.0 RF-010X 8/20/2009 0.056 0.11 0.52 0.2 0.4 RF-010Z 8/20/2009 0.12 0.06 0.59 0.2 0.5 RF-050 8/20/2009 0.055 0.21 1.01 0.4 0.8 RF-230 8/20/2009 3.9 0.49 165.6 60.4 133.3 SW-140 9/3/2009 0.024 0.98 2.04 0.7 1.6 SW-150 9/3/2009 0.01 0.94 0.81 0.3 0.7 SW-170 9/3/2009 0.13 1.31 14.7 5.4 11.8 SW-290 9/3/2009 0.55 0.04 2.13 0.8 1.7 SW-300 9/3/2009 0.39 0.05 1.75 0.6 1.4
4. CONCLUSION
Stone Environmental conducted a thorough assessment of closed stormwater drainage systems in Enosburg Falls, Highgate Center, Montgomery Center, North Troy, Richford, and Swanton during 2009 and 2010. A total of 68 outfalls and 46 other structures (mostly catch basins) were assessed. Twelve discharge points were identified as having contaminated dry weather flows. DEC is handling resolution of contaminated dry weather discharges from the Blue Seal Feeds facility in Richford and the Poulin Grain facility in Swanton, through the Multi-Sector General Permit program. The Village of Swanton worked with an apartment building owner to fix a misconnected wastewater service line, preventing wastewater from approximately 12-14 residents from entering the stormwater system. The Town of North Troy assisted a resident with correction of a misconnected washing machine, preventing washwater discharge to the storm sewer. The Town of Richford posted a sign to discourage pet waste dumping in a contaminated catch basin.
However, as described in the preceding section, other potential problems remain unresolved in Enosburg Falls (EN-100, EN-210, and EN-360), North Troy (NT-010, also NT-060 should be rechecked), Richford (RF-010X/RF-010Z, RF-045 and RF-050), and Swanton (SW-140 system at manhole SW-070; SW-150; SW-170 system, particularly flows to manhole SW-061 on York Street). Given the intermittent nature of some illicit discharges and the many technical challenges inherent in finding sources of contamination in buried infrastructure, this is to be expected. However, based on the large amount of information collected to date and our current understanding of these drainage systems, there is a
24
reasonable expectation that some or all of the remaining problems could be resolved through further analysis and investigation. Therefore, we recommend a targeted program to resample and further investigate the unresolved cases.
5. REFERENCES
American Public Health Association, Standard Methods for the Examination of Water and Wastewater, 20th edition, Washington D.C., 1999.
Hach Company. Hach Method #8029. Loveland, CO.
Stone Environmental, Inc., SEI SOP 5.23.3: Maintenance and Calibration of the pH/Con 10 Meter. February 24, 2003.
Stone Environmental, Inc., SEI SOP 6.38.0: Optical Brightener Testing, September 11, 2008.
25

6. FIGURES
26
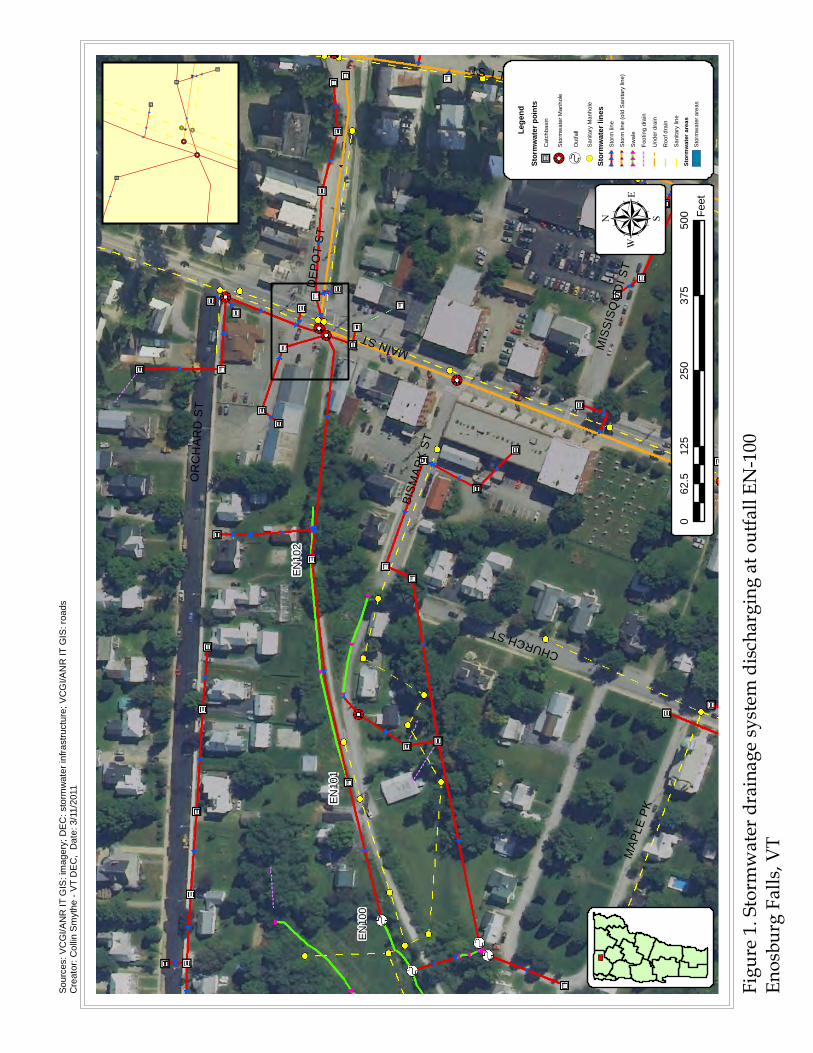
EN30
2
EN10
2
EN10
1
EN10
0
MAIN ST
OR
CH
AR
D S
T
BISM
ARK
ST
MAP
LE P
K
CHURCH ST
DEP
OT
ST
MIS
SIS
QU
OI S
T
ARCHAMBAULT ST
Lege
ndSt
ormw
ater p
oints
" ?BC
atch
basi
n
!! 2S
torm
wat
er M
anho
le
! hO
utfa
ll
!(S
anita
ry M
anho
le
Stor
mwate
r line
sS
torm
line
Sto
rm li
ne (o
ld S
anita
ry li
ne)
Sw
ale
Foot
ing
drai
n
Und
er d
rain
Roo
f dra
in
San
itary
line
Stor
mwate
r area
sS
torm
wat
er a
reas
012
525
037
550
062
.5Fe
et
" ?B" ?B
" ?B
!! 2!! 2
!! 2!! 2
" ?B
" ?B
" ?B
Figure
1. Sto
rmwa
ter dr
ainag
e syst
em di
scharg
ing at
outfa
ll EN-
100En
osburg
Falls,
VT
µ
Sour
ces:
VC
GI/A
NR
IT G
IS: i
mag
ery;
DE
C: s
torm
wat
er in
frast
ruct
ure;
VC
GI/A
NR
IT G
IS: r
oads
Cre
ator
: Col
lin S
myt
he -
VT
DE
C,
Dat
e: 3
/11/
2011
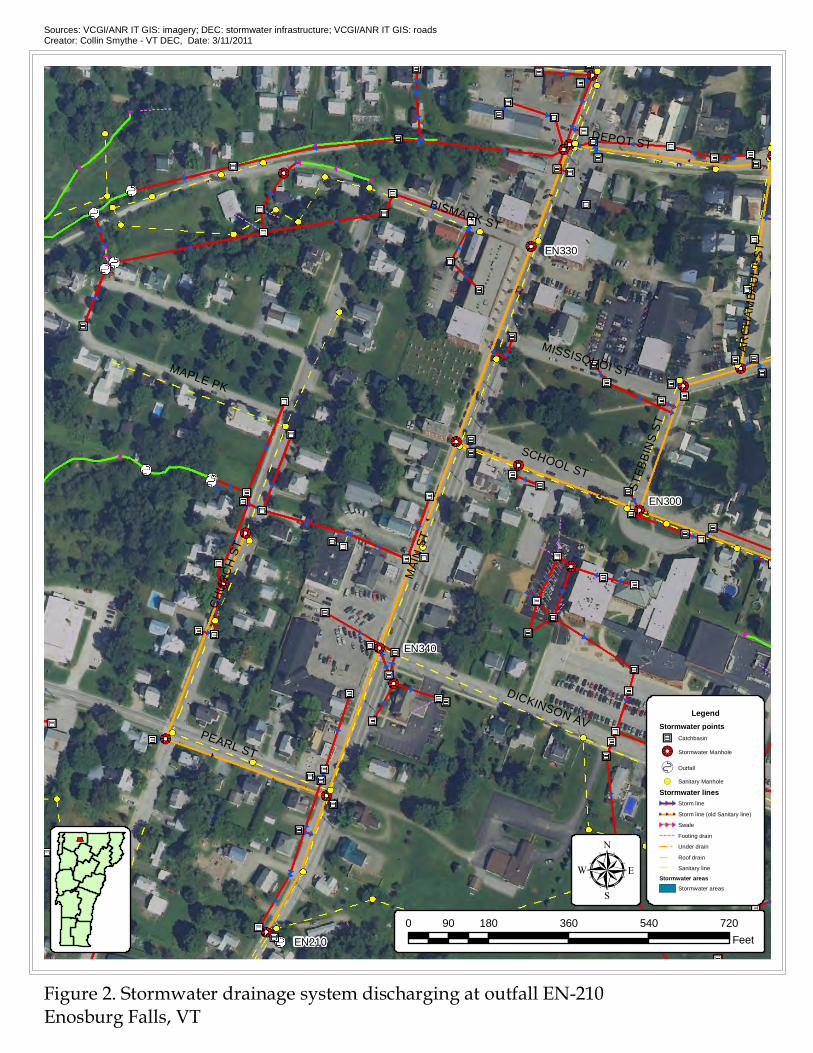
EN340
EN210
EN330
EN300
MAI
N S
T
CH
UR
CH
ST
PEARL ST
BISMARK ST
DICKINSON AV
SCHOOL ST
MAPLE PK
DEPOT ST
MISSISQUOI ST
STEB
BIN
S ST
ARC
HA
MBA
ULT
ST
LegendStormwater points"?B Catchbasin
!!2 Stormwater Manhole
!h Outfall
!( Sanitary Manhole
Stormwater linesStorm line
Storm line (old Sanitary line)
Swale
Footing drain
Under drain
Roof drain
Sanitary line
Stormwater areasStormwater areas
0 180 360 540 72090Feet
Figure 2. Stormwater drainage system discharging at outfall EN-210Enosburg Falls, VT
µ
Sources: VCGI/ANR IT GIS: imagery; DEC: stormwater infrastructure; VCGI/ANR IT GIS: roadsCreator: Collin Smythe - VT DEC, Date: 3/11/2011
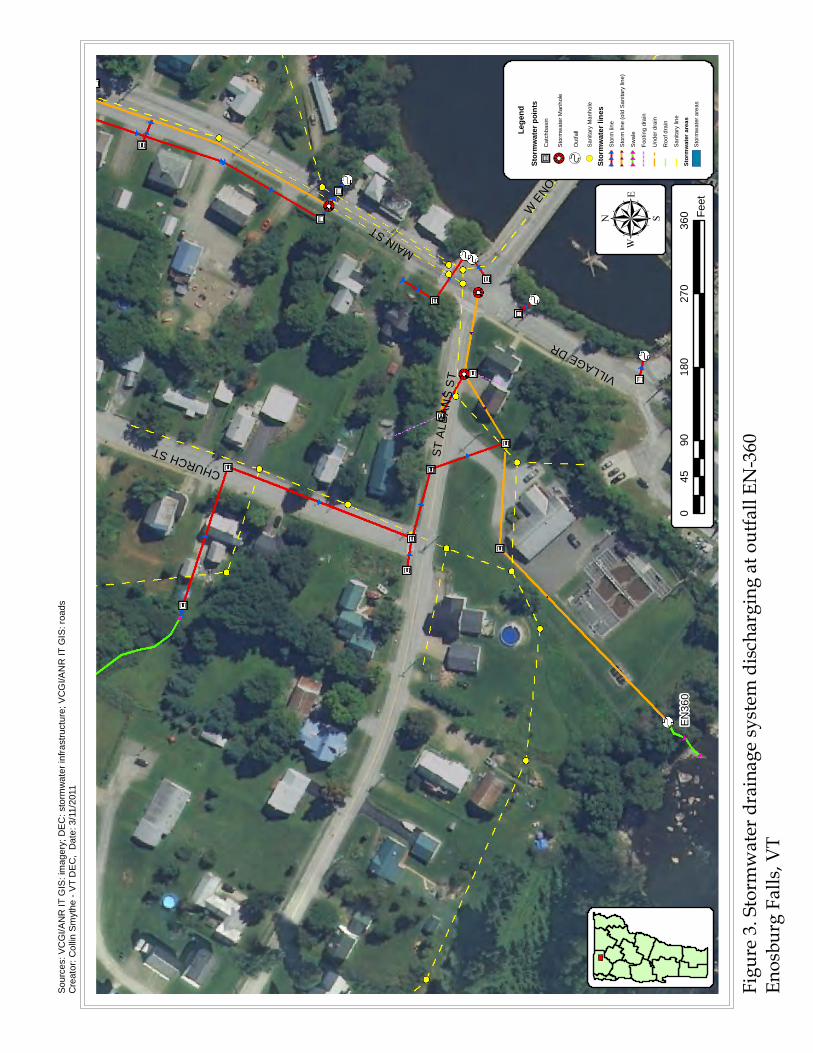
EN36
0
MAIN ST
ST A
LBAN
S S
T
CHURCH ST
VILLAGE DR
W E
NOSBURG RDLe
gend
Stor
mwate
r poin
ts" ?B
Cat
chba
sin
!! 2S
torm
wat
er M
anho
le
! hO
utfa
ll
!(S
anita
ry M
anho
le
Stor
mwate
r line
sS
torm
line
Sto
rm li
ne (o
ld S
anita
ry li
ne)
Sw
ale
Foot
ing
drai
n
Und
er d
rain
Roo
f dra
in
San
itary
line
Stor
mwate
r area
sS
torm
wat
er a
reas
090
180
270
360
45Fe
et
Figure
3. Sto
rmwa
ter dr
ainag
e syst
em di
scharg
ing at
outfa
ll EN-
360En
osburg
Falls,
VT
µ
Sour
ces:
VC
GI/A
NR
IT G
IS: i
mag
ery;
DE
C: s
torm
wat
er in
frast
ruct
ure;
VC
GI/A
NR
IT G
IS: r
oads
Cre
ator
: Col
lin S
myt
he -
VT
DE
C,
Dat
e: 3
/11/
2011
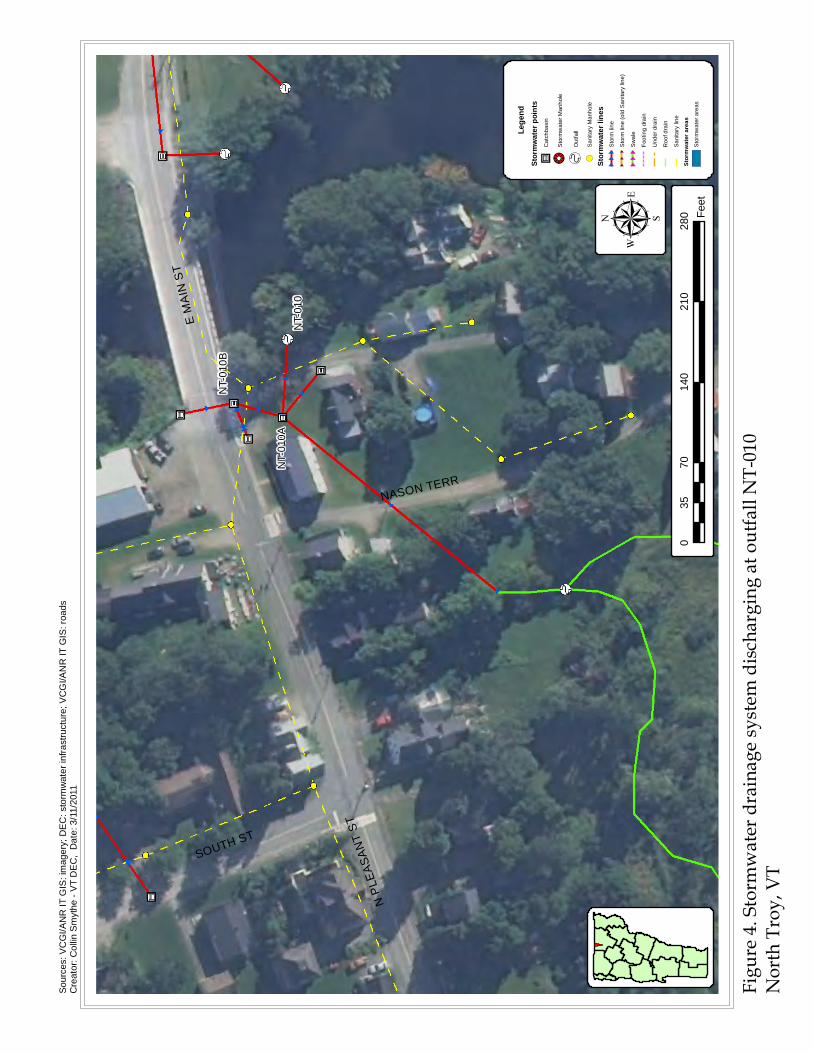
NT-
010
NT-
010B
NT-
010A
E M
AIN
ST
N P
LEAS
ANT
ST
NASON TERR
SOUTH ST
Lege
ndSt
ormw
ater p
oints
" ?BC
atch
basi
n
!! 2S
torm
wat
er M
anho
le
! hO
utfa
ll
!(S
anita
ry M
anho
le
Stor
mwate
r line
sS
torm
line
Sto
rm li
ne (o
ld S
anita
ry li
ne)
Sw
ale
Foot
ing
drai
n
Und
er d
rain
Roo
f dra
in
San
itary
line
Stor
mwate
r area
sS
torm
wat
er a
reas
070
140
210
280
35Fe
et
Figure
4. Sto
rmwa
ter dr
ainag
e syst
em di
scharg
ing at
outfa
ll NT-0
10No
rth Tr
oy, V
T
µ
Sour
ces:
VC
GI/A
NR
IT G
IS: i
mag
ery;
DE
C: s
torm
wat
er in
frast
ruct
ure;
VC
GI/A
NR
IT G
IS: r
oads
Cre
ator
: Col
lin S
myt
he -
VT
DE
C,
Dat
e: 3
/11/
2011
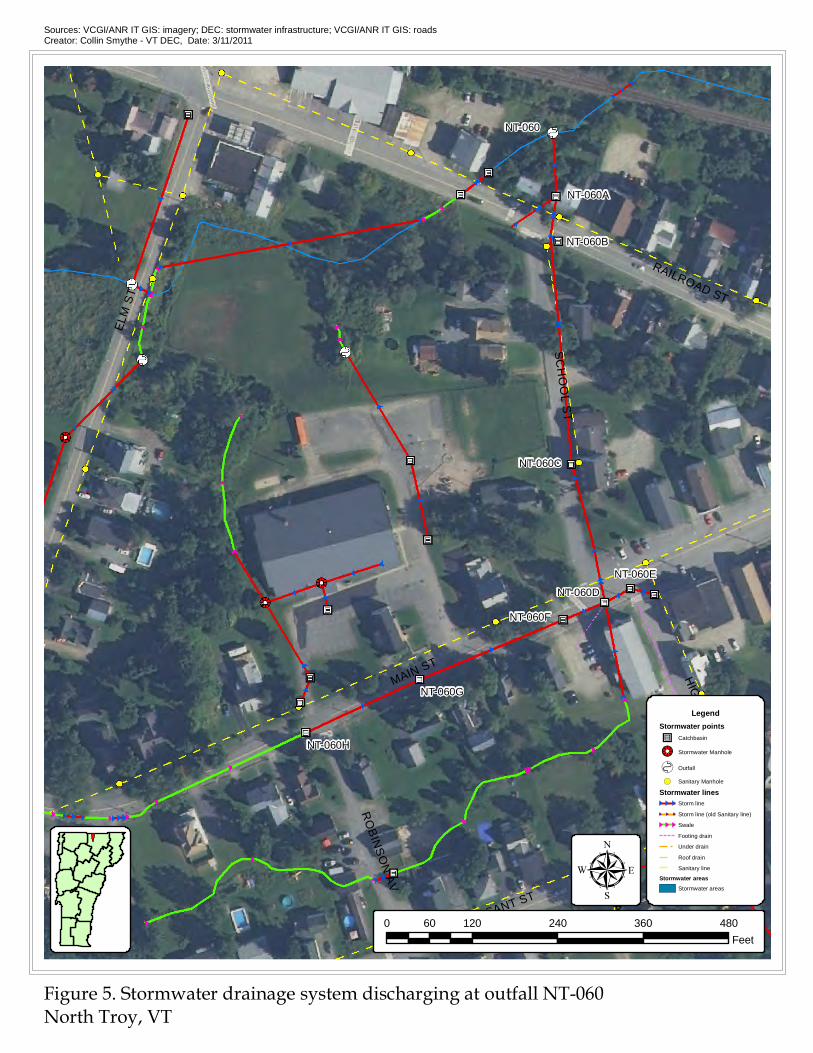
NT-100
NT-060
NT-060E
NT-060H
NT-060F
NT-060D
NT-060C
NT-060B
NT-060A
NT-060GMAIN ST
ELM
ST
RAILROAD ST
SC
HO
OL S
T
HIG
H ST
N PLEASANT ST
RO
BINSO
N AV BLAIR
RD
LegendStormwater points"?B Catchbasin
!!2 Stormwater Manhole
!h Outfall
!( Sanitary Manhole
Stormwater linesStorm line
Storm line (old Sanitary line)
Swale
Footing drain
Under drain
Roof drain
Sanitary line
Stormwater areasStormwater areas
0 120 240 360 48060Feet
Figure 5. Stormwater drainage system discharging at outfall NT-060North Troy, VT
µ
Sources: VCGI/ANR IT GIS: imagery; DEC: stormwater infrastructure; VCGI/ANR IT GIS: roadsCreator: Collin Smythe - VT DEC, Date: 3/11/2011
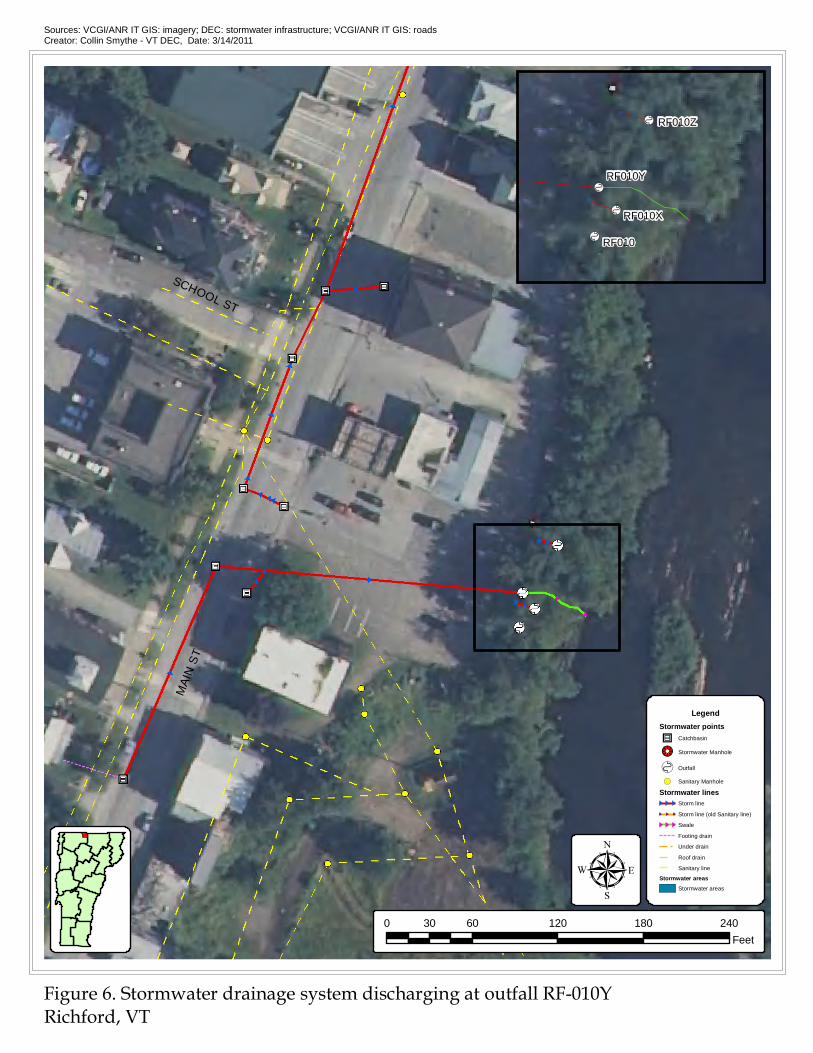
MAI
N S
T
SCHOOL ST
LegendStormwater points"?B Catchbasin
!!2 Stormwater Manhole
!h Outfall
!( Sanitary Manhole
Stormwater linesStorm line
Storm line (old Sanitary line)
Swale
Footing drain
Under drain
Roof drain
Sanitary line
Stormwater areasStormwater areas
0 60 120 180 24030Feet
!h
!h
!h
!h RF010Z
RF010X
RF010
RF010Y
Figure 6. Stormwater drainage system discharging at outfall RF-010YRichford, VT
µ
Sources: VCGI/ANR IT GIS: imagery; DEC: stormwater infrastructure; VCGI/ANR IT GIS: roadsCreator: Collin Smythe - VT DEC, Date: 3/14/2011
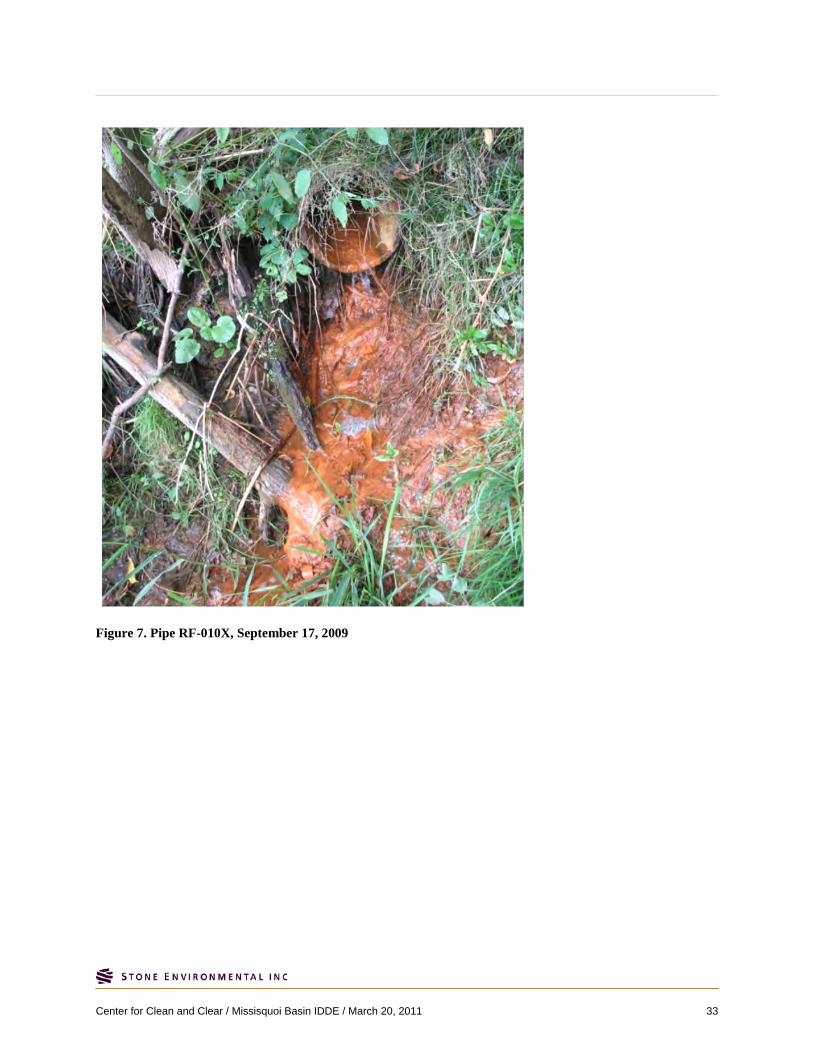
Figure 7. Pipe RF-010X, September 17, 2009
Center for Clean and Clear / Missisquoi Basin IDDE / March 20, 2011 33
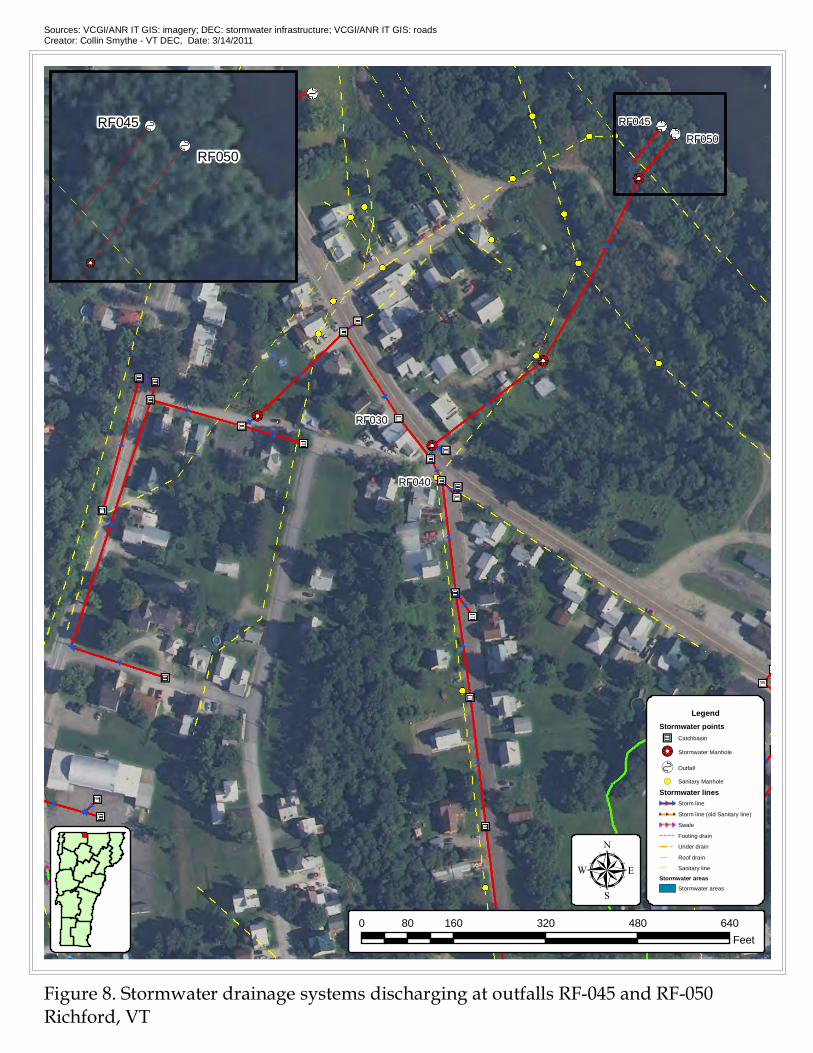
RF045RF050
RF040
RF030
LegendStormwater points"?B Catchbasin
!!2 Stormwater Manhole
!h Outfall
!( Sanitary Manhole
Stormwater linesStorm line
Storm line (old Sanitary line)
Swale
Footing drain
Under drain
Roof drain
Sanitary line
Stormwater areasStormwater areas
0 160 320 480 64080Feet
!h
!!2
!h
RF045
RF050
Figure 8. Stormwater drainage systems discharging at outfalls RF-045 and RF-050Richford, VT
µ
Sources: VCGI/ANR IT GIS: imagery; DEC: stormwater infrastructure; VCGI/ANR IT GIS: roadsCreator: Collin Smythe - VT DEC, Date: 3/14/2011
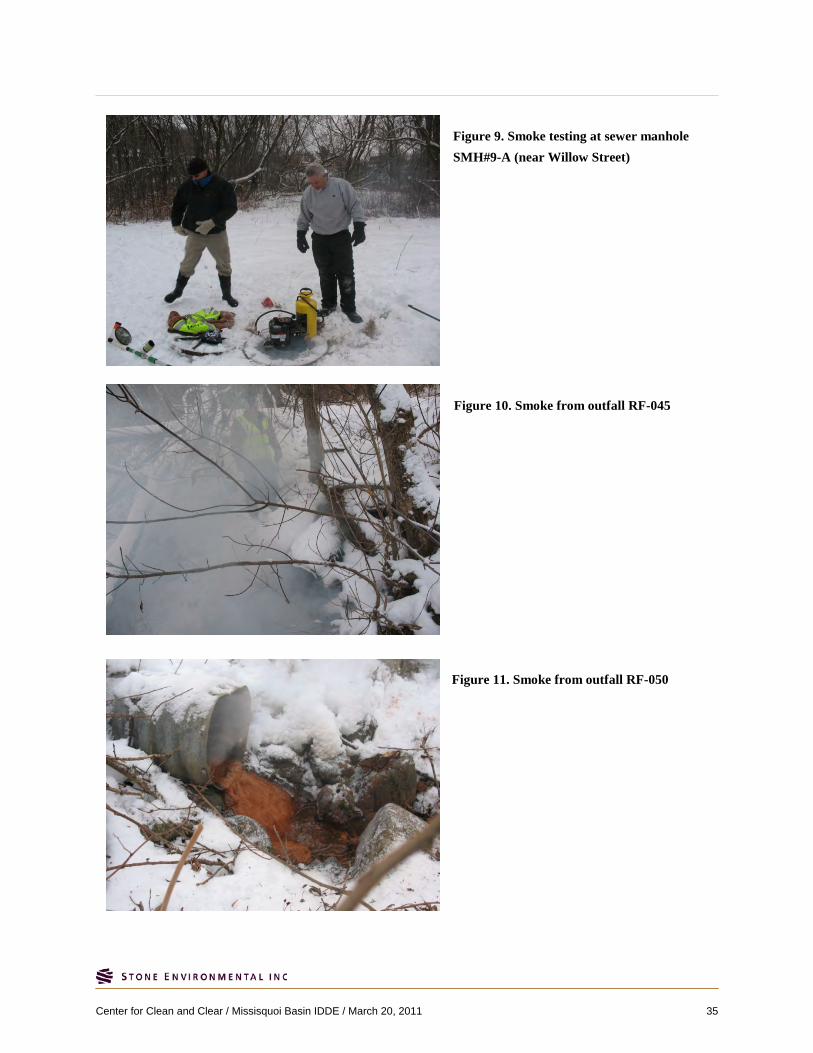
Figure 10. Smoke from outfall RF-045
Figure 11. Smoke from outfall RF-050
Figure 9. Smoke testing at sewer manhole SMH#9-A (near Willow Street)
Center for Clean and Clear / Missisquoi Basin IDDE / March 20, 2011 35
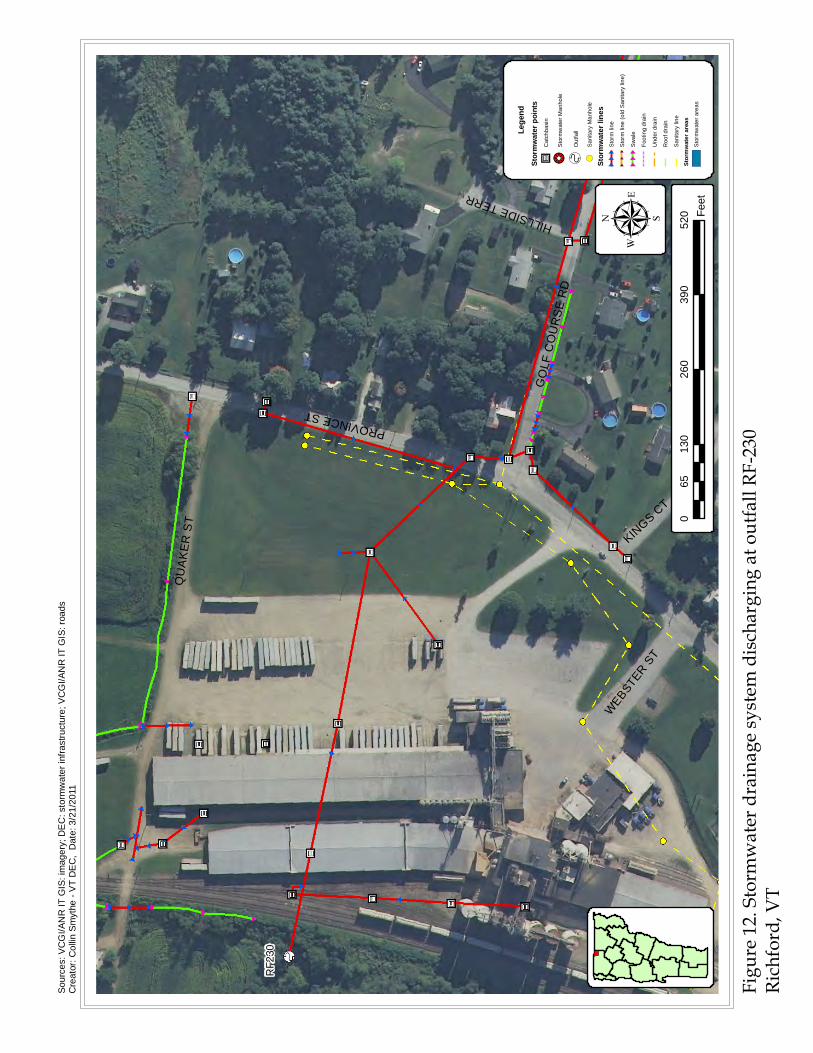
QU
AK
ER
ST
PROVINCE ST
GO
LF C
OU
RS
E R
D
WEBSTE
R ST
KINGS C
T
HILLSIDE TERR
RF2
30
Lege
ndSt
ormw
ater p
oints
" ?BC
atch
basi
n
!! 2S
torm
wat
er M
anho
le
! hO
utfa
ll
!(S
anita
ry M
anho
le
Stor
mwate
r line
sS
torm
line
Sto
rm li
ne (o
ld S
anita
ry li
ne)
Sw
ale
Foot
ing
drai
n
Und
er d
rain
Roo
f dra
in
San
itary
line
Stor
mwate
r area
sS
torm
wat
er a
reas
013
026
039
052
065
Feet
Figure
12. St
ormwa
ter dr
ainag
e syst
em di
scharg
ing at
outfa
ll RF-2
30Ric
hford,
VT
µ
Sour
ces:
VC
GI/A
NR
IT G
IS: i
mag
ery;
DE
C: s
torm
wat
er in
frast
ruct
ure;
VC
GI/A
NR
IT G
IS: r
oads
Cre
ator
: Col
lin S
myt
he -
VT
DE
C,
Dat
e: 3
/21/
2011
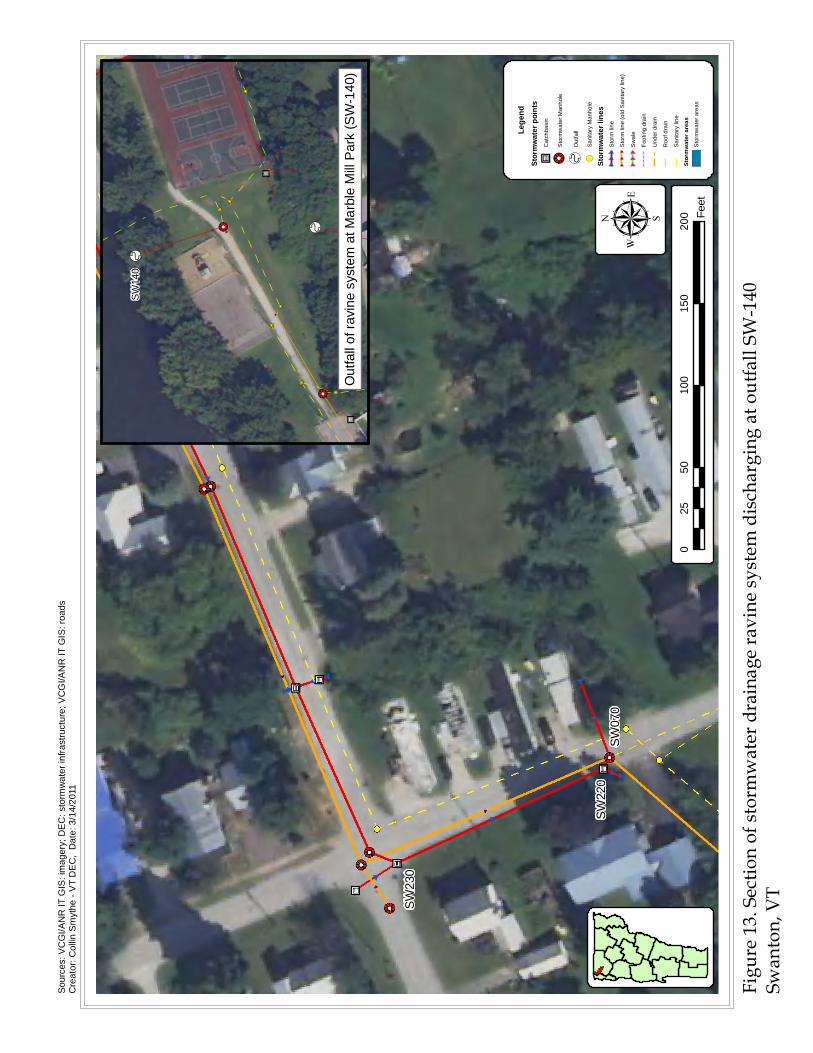
SW22
0SW
070
SW23
0
Lege
ndSt
ormw
ater p
oints
" ?BC
atch
basi
n
!! 2S
torm
wat
er M
anho
le
! hO
utfa
ll
!(S
anita
ry M
anho
le
Stor
mwate
r line
sS
torm
line
Sto
rm li
ne (o
ld S
anita
ry li
ne)
Sw
ale
Foot
ing
drai
n
Und
er d
rain
Roo
f dra
in
San
itary
line
Stor
mwate
r area
sS
torm
wat
er a
reas
050
100
150
200
25Fe
et
" ?B
!! 2!! 2! h
!! 2
!! 2
!! 2" ?B
!! 2
!! 2!! 2
!! 2
! hSW
140
Figure
13. Se
ction
of sto
rmwa
ter dr
ainag
e rav
ine sy
stem
discha
rging
at ou
tfall S
W-140
Swan
ton, V
T
µ
Sour
ces:
VC
GI/A
NR
IT G
IS: i
mag
ery;
DE
C: s
torm
wat
er in
frast
ruct
ure;
VC
GI/A
NR
IT G
IS: r
oads
Cre
ator
: Col
lin S
myt
he -
VT
DE
C,
Dat
e: 3
/14/
2011
Out
fall
of ra
vine
sys
tem
at M
arbl
e M
ill Pa
rk (S
W-1
40)
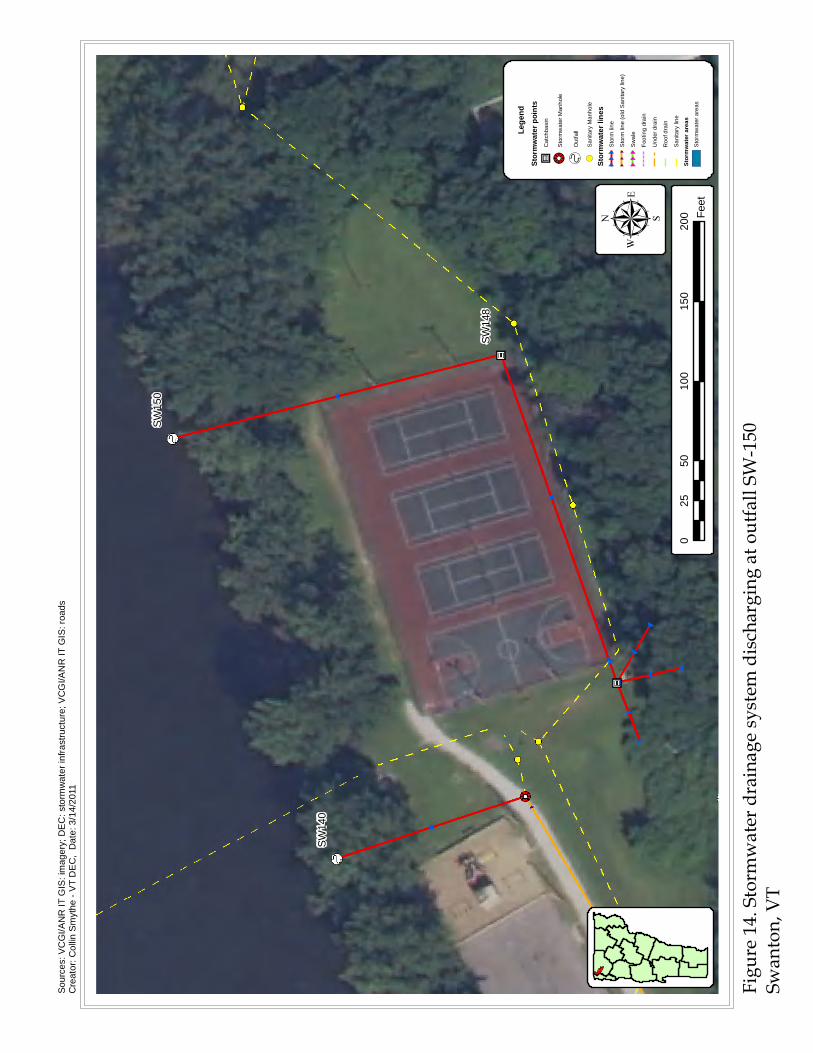
SW15
0
SW14
0
SW14
8
Lege
ndSt
ormw
ater p
oints
" ?BC
atch
basi
n
!! 2S
torm
wat
er M
anho
le
! hO
utfa
ll
!(S
anita
ry M
anho
le
Stor
mwate
r line
sS
torm
line
Sto
rm li
ne (o
ld S
anita
ry li
ne)
Sw
ale
Foot
ing
drai
n
Und
er d
rain
Roo
f dra
in
San
itary
line
Stor
mwate
r area
sS
torm
wat
er a
reas
050
100
150
200
25Fe
et
Figure
14. St
ormwa
ter dr
ainag
e syst
em di
scharg
ing at
outfa
ll SW-
150Sw
anton
, VT
µ
Sour
ces:
VC
GI/A
NR
IT G
IS: i
mag
ery;
DE
C: s
torm
wat
er in
frast
ruct
ure;
VC
GI/A
NR
IT G
IS: r
oads
Cre
ator
: Col
lin S
myt
he -
VT
DE
C,
Dat
e: 3
/14/
2011
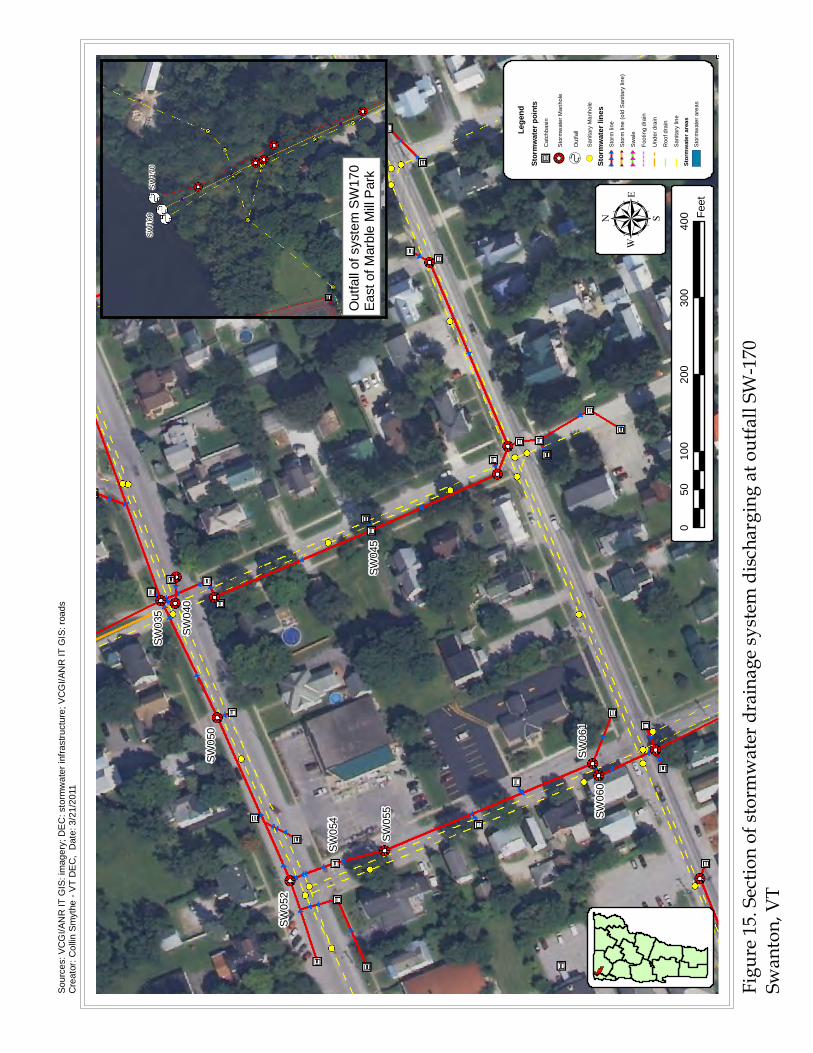
SW03
5
SW04
0
SW05
0
SW05
5
SW06
1
SW05
2
SW05
4
SW04
5
SW06
0
Lege
ndSt
ormw
ater p
oints
" ?BC
atch
basi
n
!! 2S
torm
wat
er M
anho
le
! hO
utfa
ll
!(S
anita
ry M
anho
le
Stor
mwate
r line
sS
torm
line
Sto
rm li
ne (o
ld S
anita
ry li
ne)
Sw
ale
Foot
ing
drai
n
Und
er d
rain
Roo
f dra
in
San
itary
line
Stor
mwate
r area
sS
torm
wat
er a
reas
010
020
030
040
050
Feet
SW
160
SW
170
Figure
15. Se
ction
of sto
rmwa
ter dr
ainag
e syst
em di
scharg
ing at
outfa
ll SW-
170Sw
anton
, VT
µ
Sour
ces:
VC
GI/A
NR
IT G
IS: i
mag
ery;
DE
C: s
torm
wat
er in
frast
ruct
ure;
VC
GI/A
NR
IT G
IS: r
oads
Cre
ator
: Col
lin S
myt
he -
VT
DE
C,
Dat
e: 3
/21/
2011
Out
fall
of s
yste
m S
W17
0 Ea
st o
f Mar
ble
Mill
Par
k
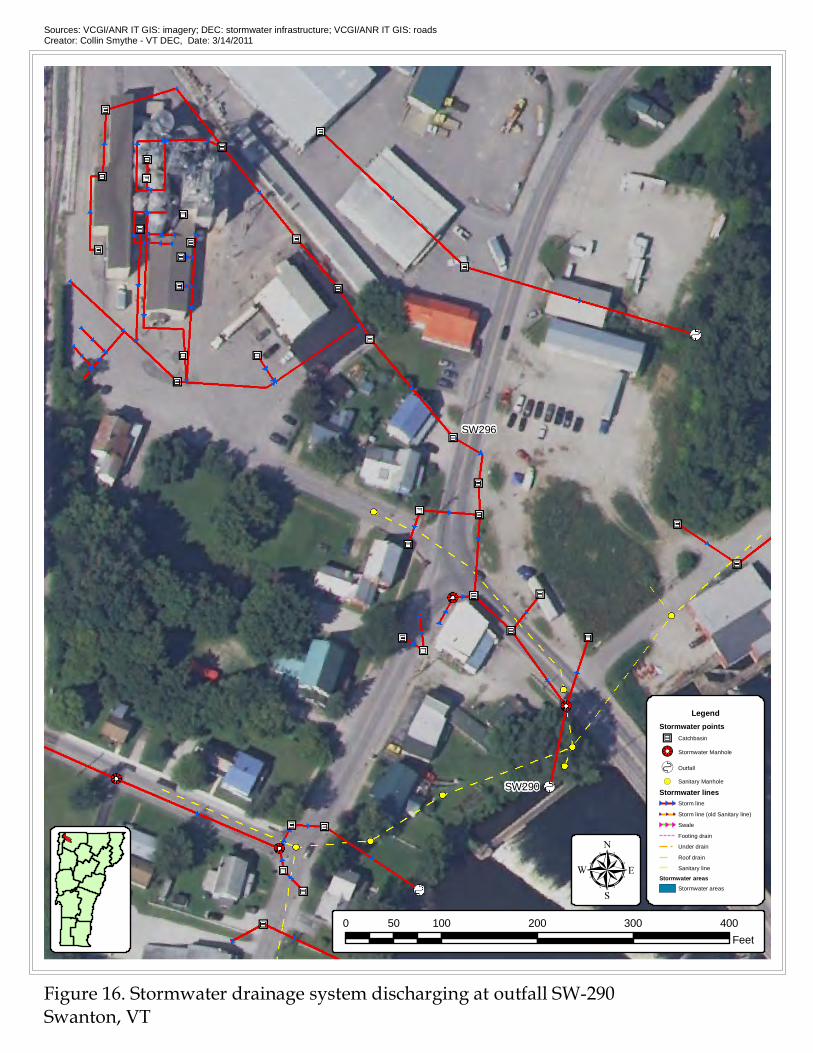
SW296
SW290
LegendStormwater points"?B Catchbasin
!!2 Stormwater Manhole
!h Outfall
!( Sanitary Manhole
Stormwater linesStorm line
Storm line (old Sanitary line)
Swale
Footing drain
Under drain
Roof drain
Sanitary line
Stormwater areasStormwater areas
0 100 200 300 40050Feet
Figure 16. Stormwater drainage system discharging at outfall SW-290Swanton, VT
µ
Sources: VCGI/ANR IT GIS: imagery; DEC: stormwater infrastructure; VCGI/ANR IT GIS: roadsCreator: Collin Smythe - VT DEC, Date: 3/14/2011