hampton roads idde workshop roads... · • illicit cooling tower water • copper piping •...
TRANSCRIPT

Hampton Roads IDDE Workshop June 13, 2016
HRPDC

How You Know An IDDE Investigator?

Agenda: AM
3
• IDDE 101
• IDDE & Water Quality
• Desktop Analysis & Prioritizing
• Indicator Methods
• Hampton Roads Discussion
• Fixing/Source Tracking

Agenda: PM
4
Break-Out 1
• Field Investigations
• Hands-On Use of Testing Kits
Break-Out 2
• Expert Panel Protocols – Crediting Discharge Elimination
• Hands-on Exercises & Discussion

What is an Illicit Discharge?
5
A dry weather discharge to the storm sewer system that contains pollutants except: i. discharges pursuant to a NPDES permit and ii. discharges resulting from fire fighting activities
(40 CFR 122.26)

6
IDDE Guidance Manual Joint EPA-funded project between
CWP and University of Alabama 8 Program Components Desktop Methods Field and Lab Protocols Model Ordinance Technical Appendices Download at www.cwp.org or
http://cfpub.epa.gov/npdes/

What are common illicit discharges?
7
Sewage: • Broken or leaking sanitary
sewer line • Sewer cross-connections • Connection of floor
drains to storm sewer • Sanitary sewer overflows • Pump station failure • Straight-pipe sewer
discharge • Failing septic systems
Miscellaneous • Concrete washout water • Illegal dumping
practices: motor oil, paint
• Restaurant grease Wash Water • Laundry wash water • Commercial car washing • Floor drains connected
to stormwater pipes

Sources of Illicit Discharges
8
• Illegal dumping practices (95%) • Broken sanitary sewer line (81%) • Cross-connections (71%) • Connection of floor drains to storm sewer (62%) • Sanitary sewer overflows (52%) • Inflow / infiltration (48%) • Straight pipe sewer discharge (38%) • Failing septic systems (33%) • Improper RV waste disposal (33%) • Pump station failure (14%)

Discharge Frequency
9
• Continuous discharges
• Intermittent discharges
• Transitory discharges

Continuous Discharges
10
Occur all or most of the time Broken sewage pipes Direct connections (sometimes)
Worst pollutant source Easiest to find Best way to find them:
comprehensive outfall surveys and tracking to source

Sanitary Sewer Cross Connections
Image credit: Amick and Burgess (2000)
11

Sewer Pipe Leakage
12

Intermittent Discharges
14
Occur over a shorter period of time (e.g., a few hours per day or a few days per year)
Likely to come back May “miss them” of you don’t look for
clues and patrol regularly Best way to find them: Look for signs of
past flow; look at different hours/days; use hotlines or citizen reporting

Laundry Washwater • Laundry water directly or indirectly connected to
storm drain system
15

Commercial Car Washing • Wash water drains to the stormdrain system
Raleigh, NC 16

Floor Drains • Directly connected to stormdrain system
Photo credit: Regional Water Quality Control Board 17

Mop Water Dumping
18

Transitory Discharges
19
Occur once or infrequently Examples Include: Spills One-Time Dumping
Best way to deal with them: education, prevention, safety plans, hotlines

Paint wash
20
• Washing out brushes and buckets on the ground or into storm drains

Chemical and oil leaks/dumping
21

Concrete washout
22
• Washing out concrete truck without proper containment

23
The right way!
Concrete washout

Relationship To Good Housekeeping
• Sites where routine operations can generate indirect discharges
• Discharges are generally intermittent or transitory
• Generating sites can be identified and discharges can be prevented

Land Use Generating Site Example Discharges
Residential Apartments, multi-family, single family homes
Septic, dumping, swimming pools, car washing
Commercial Car dealers, commercial laundry, marinas, restaurants
Outdoor washing, food waste disposal, vehicle maintenance and repair, power washing, dumpster juice
Industrial Auto recyclers, metal plating, paper and wood, printing
Rinse, process, wash, and cooling water disposal; spills and leaks; leaking underground storage tanks
Institutional Churches, hospitals, schools / universities
Vehicle maintenance and repair; power washing, outdoor storage, loading/unloading (washdowns / spills)
Municipal Public works yards, airports, ports, landfills, municipal fleet storage areas
Outdoor fluid storage, vehicle maintenance and repair, power washing, dumping / spills
Regulatory Context

Phase II • Storm sewer map • Ordinance or other legal mechanism to prevent
discharges • Written procedures • Program plan & annual reporting

Written Procedures • Field screening • Schedule • Methodologies
• Tracking • Public reporting
Table 3. Illicit Discharge Tracking Sheet Date Illicit Discharge Observed & Reported:
Report Initiated by: Phone, drop-in, contact information, etc.
Location of Discharge: If known – lat/long, stream address or outfall #, nearby landmark, etc.
Description of Discharge: E.g. – dumping, wash water suds, oil, etc.
Actions to be Taken: Who What, When and How…(what should be done)
Results & Follow-Up of Investigation: Outcome of Actions taken and any necessary follow-up (what was done)
Date Investigation Resolved or Closed:

Phase II MS4 Minimum Measure #3 Schedule (Table 1)
IDDE Procedures
12 months from coverage
Outfall Map 48 months, keep updated
What MS4s HAVE To Do

Phase 1 • Notes allowable discharges unless significant
pollutant source • 189,000 lf of sanitary sewer inspections (annual) • Reduce floatables, oils, fluids, hazardous waste,
grass clippings, etc. • “Dry” weather screening • Eliminate discharges within 30 days or other plan • Spill response • Industrial & high risk runoff – inspections every 5
years

Field Guide & Procedures
• Common Pollution Problems
• Illicit Discharge Characteristics o Odor o Color o Turbidity o Floatables
• Written Procedures • WILL be adapted to HR
Area

MS4 Pollutant Credits, Expert Panel (2014)
• Enhanced Program • Individual Discharge
Removal & Documentation

Program Self-Assessment

Hampton Roads IDDE Workshop
IDDE & Water Quality
June 13, 2016 HRPDC

Discharge Flow Types
• Pathogenic & toxic discharges • Sanitary wastewater • Commercial & Industrial discharges
• Nuisance & aquatic life threatening discharges • Landscaped irrigation runoff • Construction site dewatering • Automobile washing • Laundry wastes
• Unpolluted discharges • Infiltrating groundwater • Natural springs • Domestic water line leaks

Mode of Entry
Direct entry o Sewage, industrial, commercial
cross-connection o Straight pipe
Indirect entry o Groundwater seepage o Spills o Dumping o Outdoor washing activities o “Nuisance” or non-target water

Discharge Frequency
• Continuous discharges o Occur most or all of the time
• Intermittent discharges o Occur over a shorter period of time (e.g., a few hours per day or a few
days per year)
• Transitory discharges o Occur rarely, usually in response to a singular event such as an industrial
spill, ruptured tank, sewer break, transport accident or illegal dumping episode

Wastewater Color Odor Effects on Water Gray Sewage Lowers oxygen / kills life; contributes
pathogenic bacteria
“Sewage Fungus” – a filamentous bacterium,
appears after 2-3 days of continuous sewage discharge
“Floatables” – TP, suds

Western Run Dry Weather Load from Flowing Outfalls
as Percent of Instream Load
0.0%
20.0%
40.0%
60.0%
80.0%
100.0%
120.0%
Total Nitrogen (lb/yr) Total Phosphorus(lb/yr)
Volume (MG/yr)
All outfalls
Potential Illicit Discharges (exceedany criteria) Load - Confirmed SewageDischarge

Illicit discharges in pipes <36” in diameter (Lilly & Sturm, 2010)
• 45% of all potential illicit flows
• 100% of small pipes with dry weather flow exceeded 1 or more criteria
• Volume: 49-146 MG/yr • TP: 26-78 lb/yr • TN: 726-2,179 lb/yr • Avg. E. coli concentration:
16,714 CFU/100ml
8”

Case Study – Salisbury, MD
April 19, 2011
Petroleum smell
Ammonia: 0.27 mg/l
E. coli: 13,200 CFU/100 ml

IDDE Cost-effectiveness Case Study – Salisbury, MD
Total Nitrogen
Total Phosphorus
Illicit Discharge Daily Load 9.9 lbs 0.3 lbs
Illicit Discharge Annual Load
3,614 lbs 110 lbs
Actual cost to repair $1,000
Cost / pound reduced (annual)
$0.28 $9.09

TN load: 120-359 lb/yr
TP load: 43-128 lb/yr
= 143 ½-acre bioretentions
to treat TP (49 to treat TN); cost of 590-1,700 K

Washwater Floatable Odor Effects on water
Suds Sweet, fruity, detergent, chlorine
Destroys the external mucus layers that protect fish from bacteria and parasites; causes severe damage to the gills.; kills fish eggs; decreases surface tension of water and increases the potential for contaminants to be absorbed.
Puget Sound study – “A single uncontrolled residential car wash activity might be inconsequential, however, when extrapolated over an entire urban area for a year, the pollutant loading becomes significant.”

Maple Ave ID Investigations Takoma Park, MD
Maple Ave - 550 acres

Maple Ave Outfall
• Suds discharges known to occur frequently
• Smells like detergent • Any patterns on times
of day or days of the week when these are seen?
• Enter the Moultrie game camera…

Maple Ave Outfall Suds Discharges
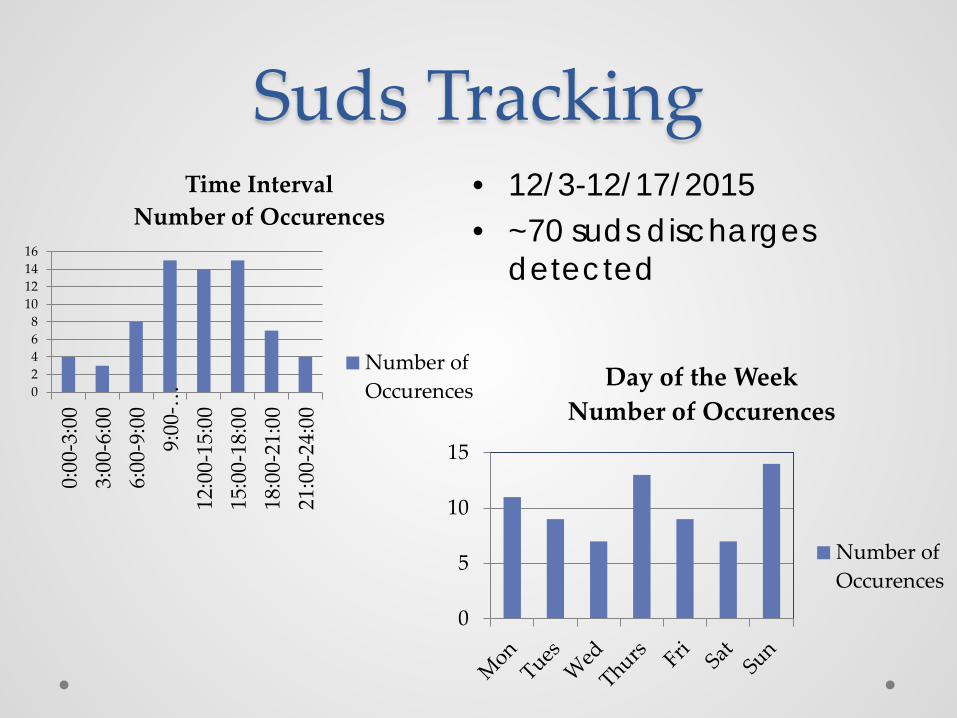
Suds Tracking • 12/3-12/17/2015 • ~70 suds discharges
detected
0
5
10
15
Day of the Week Number of Occurences
Number ofOccurences
02468
10121416
0:00
-3:0
03:
00-6
:00
6:00
-9:0
09:
00-…
12:0
0-15
:00
15:0
0-18
:00
18:0
0-21
:00
21:0
0-24
:00
Time Interval Number of Occurences
Number ofOccurences

> 86 sites visited > 38% of sites had a discharge > All discharges (n=33) exceeded ammonia threshold of 0.2 mg/l, 58% > 5.0 mg/L > All samples (n=9) exceeded water quality standards for zinc and copper
Other Pollutants: Air Conditioner Condensate…??

Sources of Contamination in HVAC Discharges
• Microbial biocides • Illicit cooling tower water • Copper piping • Refrigerant leaks
- 5-30% ammonium chloride - Kills bacteria that cause Legionnaires - Toxic to aquatic organisms and should not be released into the environment

Conclusion • Illicit discharges have varying toxicity, modes of
entry and frequency patterns. • These factors determine their overall impact to
water quality. • Continuous discharges typically have the most
impact, even with small volumes. • Intermittent discharges can also have a big impact
on water quality but can be much harder to track down.

Q/A

Desktop Analysis &
Prioritization
June 13, 2016 HRPDC

Desktop Analysis of Illicit Discharge Potential (IDP)
oA method of developing a targeted
approach to identify priority areas subject to a higher rate of illicit discharges, while using a GIS-based program
oAnswers the question ... “Where should we focus our resources?”

1. Delineate subwatersheds 2. Compile mapping and data 3. Compute discharge screening factors 4. Characterize IDP across subwatersheds 5. Generate maps to support field
investigation
GIS-based Analysis:

1. Delineate Subwatersheds

2. Available Data

“Wish List” of GIS Data (Screening Factors)
• Past Discharge Complaints • Poor Dry Weather Water
Quality • Density of Generating Sites • Density of Industrial NPDES
Permits • Stormwater Outfall Density • Age of Subwatershed
Development • Water Monitoring Data
• Former Combined Sewers
• Older Industrial Operations
• Aging or Failing Sewers • Density of Older Septic
Systems • Past Sewer
Conversions
Collaborate to prioritize and develop a robust GIS dataset

3. Calculate Discharge Screening Factors
Watershed Name Commercial (Acres) %
Industrial (Acres) %
Total Wsd Acres in MS4
Cocalico Creek 1.97 0.07 7.21 0.24 2943.48
Conestoga River 37.42 1.46 3.77 0.15 2563.17
Maiden Creek 438.50 1.61 1129.77 4.15 27204.73
Manatawny Creek 104.04 0.68 341.26 2.24 15203.89
Perkiomen Creek 64.99 1.26 28.82 0.56 5162.45
Sacony Creek 5.38 0.28 5.26 0.28 1910.62
Schuylkill 3700.19 3.97 4193.85 4.50 93148.72
Swamp Creek 286.04 3.88 610.16 8.28 7369.76
Tulpehocken Creek 1379.10 3.86 592.46 1.66 35701.74

4. Prioritize Subwatersheds Using IDP Screening Factors
Subwatershed Past
discharge complaints
Poor dry weather
WQ
Density of SW outfalls
Average age of dev.
Raw IDP score
Normalized IDP score
Subwatershed A 8 (2) 30% (2) 14 (2) 40 (2) 8 2
Subwatershed B 3 (1) 15% (1) 10 (2) 10 (1) 5 1.25
Subwatershed C 13 (3) 60% (3) 16 (2) 75 (3) 11 2.75
Subwatershed D 1 (1) 25% (1) 9 (1) 15 (2) 5 1.25
Subwatershed E 5 (1) 15% (1) 21 (3) 20 (1) 6 1.5 Basis for Assigning Scores… 1 2 3
Past discharge complaints/reports (total # logged) < 5 5 - 10 > 10
Dry weather water quality (# times bacteria stds exceeded) < 25% 25 - 50% > 50%
Storm water outfall density (# outfalls / stream mile) < 10 10 - 20 20
Average age of development (years) < 25 25 - 50 > 50

Key: Low IDP risk
Medium IDP risk
High IDP risk Clustered Illicit Discharge Problems
5. Results Shown by Subwatershed Severe Illicit Discharge Problems
Minimal Illicit Discharge Problems

EXAMPLE Stafford County, VA
(slides courtesy of Paul Santay)

Aerial Photo: Intersection of Jefferson Davis Highway & Foreston Woods Drive. Austin Run (VA Impaired Water) from west-to-east

GIS layer (ZONING DISTRICT) added: R1 & R3 – Residential; B2 – Commercial; M1 &M2 – Industrial

GIS layer (OUTFALLS & BMP) added: Green Dot – Outfalls (ACoE); Yellow Dot (BMPs)

Aerial Photo: GIS layer (HOTSPOT) added

Aerial Photo: Only include OUTFALLS within 500 ft.

Prioritization Courtesy: Keri Lindberg, Maine Healthy Beaches

Prioritization Courtesy: Keri Lindberg, Maine Healthy Beaches

Prioritization Courtesy: Keri Lindberg, Maine Healthy Beaches

Prioritization Courtesy: Keri Lindberg, Maine Healthy Beaches

Desktop Assessment Benefits
20
• GIS or other database system to track outfalls
• Understand severity of IDDE problems
• Creating basic mapping for IDDE field work
• Prioritize field efforts to find and fix illicit discharges

Q/A

Hampton Roads IDDE Workshop
Indicator Methods
June 13, 2016 HRPDC

Outfall Damage Deposits/Stains Abnormal Vegetation Poor Pool Quality Pipe Benthic Growth
Visual Indicators of Pollution at Outfall Pipes

Indicators Source Indicator Wastewater Gray, sewage odor, sewage fungus, floatables Washwater Suds, detergent or sweet smell Sediment Orange/brown color Tap water Chlorine smell (maybe) Paint Color, turbidity Concrete washout Turbidity Industrial Color, odors

Foam “Natural” foam
• Formed when organic matter decomposes
• Can be caused by turbulence (e.g. Waterfalls)
• Does not “last” • Brownish / tannish edges
“Un-natural” Foam
• Has “staying” power • Whiter • May have an odor
Jury is out – a water sample is needed for a definitive answer
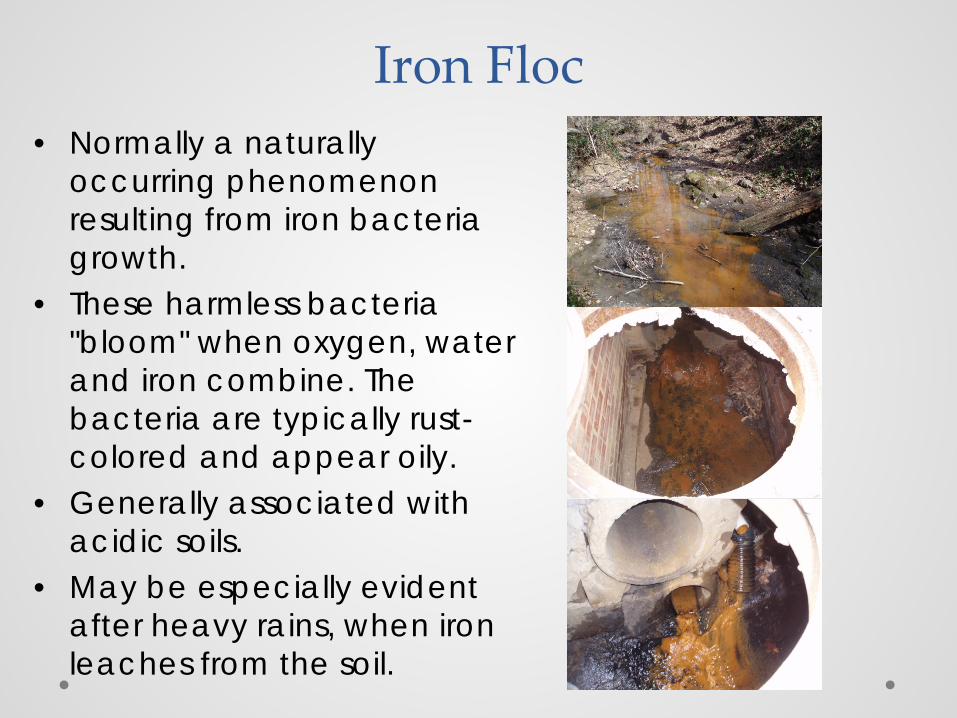
Iron Floc • Normally a naturally
occurring phenomenon resulting from iron bacteria growth.
• These harmless bacteria "bloom" when oxygen, water and iron combine. The bacteria are typically rust-colored and appear oily.
• Generally associated with acidic soils.
• May be especially evident after heavy rains, when iron leaches from the soil.

Sheens • Sheens can occur from
naturally occurring bacteria – these break into pieces when touched with a stick or other object
• Petroleum-based sheens break apart and then come back together when disturbed

Chemical Indicator monitoring • Purpose:
• Identify problem outfalls not apparent from physical indicators / visual assessments alone
• Verify suspect or problem outfalls for confirmation of the presence of an illicit discharge
• Determine potential flow type • Provide more information on intermittent
discharges

Indicators to Identify Sources of Contamination Ideal indicator to identify major flow sources has the following characteristics: o Significant difference in concentrations
between possible pollutant sources; o Small variations in concentrations within each
likely pollutant source category; o Conservative behavior (i.e., no significant
concentration change due to physical, chemical or biological processes);
o Ease of measurement with adequate detection limits, good sensitivity and repeatability.

Simple and Inexpensive Analytical Methods
• Can be used in the field, but usually much easier, safer, and more efficient in lab
• Comparative colorimetric methods (apparent color, detergents after extraction)
• Simple probes (pH, conductivity, ion selective potassium)
• Spectrophotometric (fluoride, ammonia, boron)

Equipment Considerations
• Accuracy (proximity to true value) • Precision (repeatability or reproducibility) • Range (min and max) • Single parameter vs multi-parameter • Waste • Portability • Safety • Cost – up-front, per sample, standards/buffer
solutions/sterile dilution bottles, carrying cases


IDDE Flow Chart (Brown et al, 2004)

Flow Chart Should Modified for Your Community

Single Parameter Screening
• Detergents o Best single parameter to detect illicit discharge o Analysis best conducted in controlled lab setting
• Ammonia o Concentrations >1mg/L is positive indicator of
sewage o Analysis in field using portable
spectrophotometer or colorimeter

Industrial Indicators Benchmark Concentration Notes
Ammonia (mg/L)
>50 Existing “Flow Chart” Parameter Concentrations higher than the benchmark can identify
a few industrial discharges
Potassium (mg/L)
> 20 Existing “Flow Chart” Parameter Excellent indicator of a broad range of industrial
discharges
Color (Units)
> 500 Supplemental parameter that identifies a few specific industrial discharges
Conductivity (µS/cm)
> 2,000 Identifies a few industrial discharges May be useful to distinguish between industrial sources
Hardness (mg/L as CaCO3)
<10 > 2,000
Identifies a few industrial discharges May be useful to distinguish between industrial sources
pH (Units)
< 5
Only captures a few industrial discharges High pH values may also indicate an industrial
discharge but residential wash waters can have a high pH as well
Turbidity (NTU)
> 1,000 Supplemental parameter that identifies a few specific industrial discharges

Chemical Fingerprint Library
• Shallow Groundwater • Spring Water • Tap water • Irrigation • Sewage • Septic Tank Discharge • Common Industrial Discharges • Commercial Car Wash • Commercial Laundry

Richmond Chemical Fingerprint Library
Q/A

Hampton EnvironmEntal SErvicES
Illicit Discharge Detection & Elimination
Tracking and Enforcement Procedures
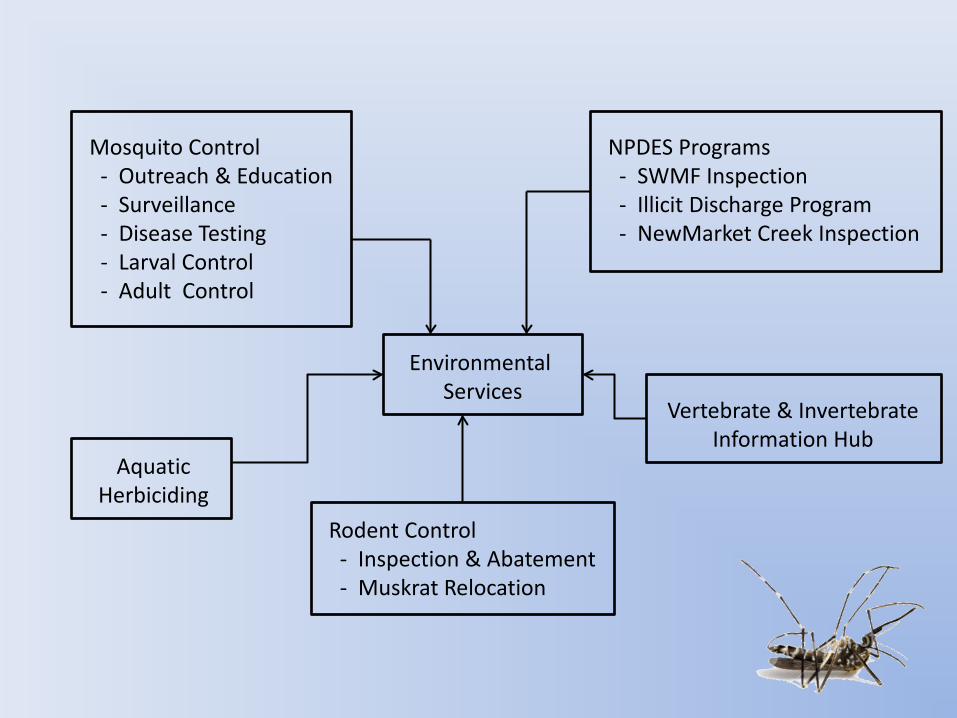
Environmental Services
Mosquito Control - Outreach & Education - Surveillance - Disease Testing - Larval Control - Adult Control
Aquatic Herbiciding
Rodent Control - Inspection & Abatement - Muskrat Relocation
NPDES Programs - SWMF Inspection - Illicit Discharge Program - NewMarket Creek Inspection
Vertebrate & Invertebrate Information Hub

60 Potential Discharge Sites Tested
per Fiscal Year
311 Call Center
Desktop Assessment * Gas Stations * Auto-Body Repair Shops * Car Wash Practices * Industrial / Commercial Business Complexes * Ongoing Construction Projects
Inter-Departmental Investigations * Wastewater Department * Fire Department
Field Screening * Routine Investigations * Stormwater Employee Calls
VPDES Permitted Sites Through DEQ
Illicit Discharge Detection & Elimination

Testing Procedures
• Use of Photometer 9500 – Ammonia – Bromine – Chlorine LR – Copper – Phosphate LR – Phenols
• Detergents • pH and Temperature Meter • Refractometer • E. Coli

Tracking Procedures
Flow found in outfall during Dry Weather Conditions
Thresholds not reached Thresholds reached
Re-visit up to two additional Times during the permit cycle. Ideally, at a different time and day of the week.
Drainage Investigation: Typically done by at least two inspectors Use of GIS mapping to follow flow through stormdrains to Discharge location.
Illicit Discharge indicators Found during
Wet Weather Conditions

Enforcement Procedures
• Introduction and Purpose of Visit
• Compliance is main goal
• Paperwork is given explaining violation
• Meet with Stormwater and Legal Team to discuss if fines are to be given.
• Notice of Violation letter sent via Certified Mail to formally address violation and/or levy fines.

Example #1

Example #2

Example #3

Key Notes to Enforcement
• Keep data at all times – Photographs (Date and Time Stamps) – Paperwork, Business Cards,
Contacts – Certified Letters
• Communication – Operations Team (Inspectors & Management) – Legal Team – Other Departments – Property or Business Owner

Thank You

Hampton Roads IDDE Workshop
Overview of Expert Panel Protocols
June 13, 2016 HRPDC

Presentation Credit
Chesapeake Stormwater Network http://chesapeakestormwater.net/events/nutrient-
discharges-from-grey-infrastructure/

Expert Panel Timeline • Began in Summer 2012 • Deliberated for two
years • Findings released June
2014 • Final approval by
EPA/Bay Program 11/10/2014

Nutrient Discharges • Refers to the complex range of non-stormwater
flows that deliver nutrients into receiving waters during dry and wet weather – cause by spills leaks, and overflows
• Created by pollutant generating activties / sources • Associated with grey infrastructure • Transported by stormwater runoff and groundwater
migration

Discovered Nutrient Discharges from Grey Infrastructure
Schueler et al (2014)
• 20-40% of dry weather loading • 1-2% of wet weather loading • Option1 Credit for Advanced Nutrient
Discovery programs – NO LONGER AN OPTION
• Option 2 Credit for Elimination of Individual Nutrient Discharges (IND; beginning in 2016)

Discovered Nutrient Discharges from Grey Infrastructure


Q/A

Field Investigations & Safety June 13, 2016
HRPDC

“Dry Weather” Outfall Screening
• Looking at and testing
flow from pipes, not in-stream
• At least 48 hours after
precipitation (runoff-producing rain event)
• During period of low groundwater
2

Frozen flows
Safety
Road salt
Temperature effects on equipment
High groundwater table
Summer
Winter Spring
Excess vegetation – hard to find outfalls
A/C condensate
3
Time of Year Considerations

Fall Vegetation died
back
Not too cold; good time for field work
Road salt and groundwater influences at a minimum
Time of Year Considerations
4

If you find an illicit discharge:
• Take photos and notes • Collect a sample – if safe • Mark the outfall or
manhole • Try to track down source
of discharge
5
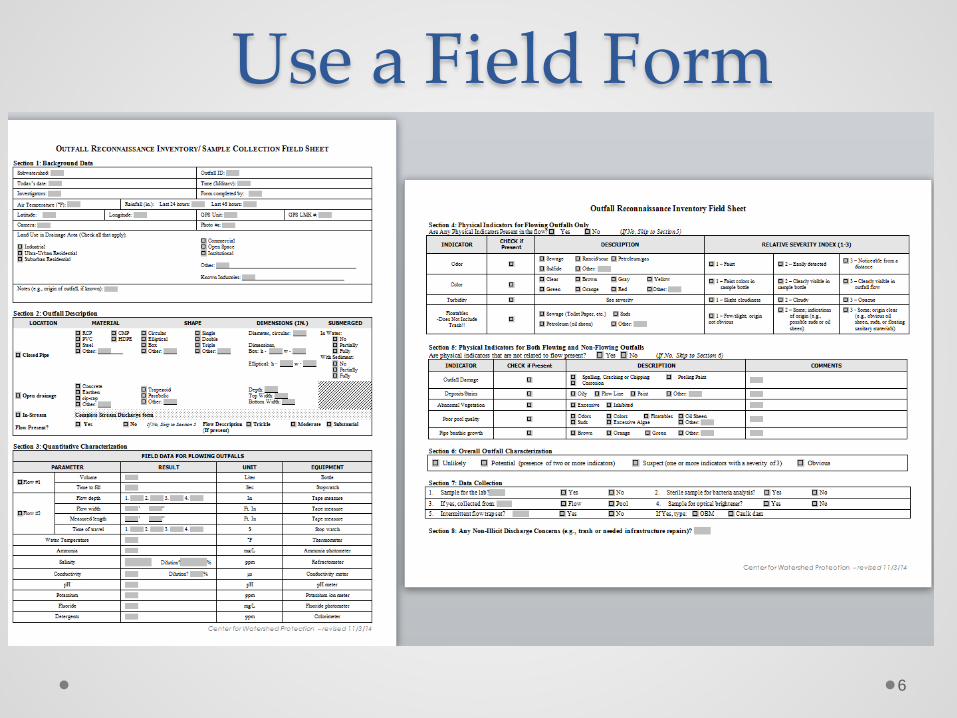
Use a Field Form
6

Take Notes About: • Specific location (GPS) • Odor/smell • Color • Clarity/murkiness • Floatables • Anything you find about
where it’s coming from
Source: Fort Worth DEM Photo credit: Snohomish County, WA
7

Record Basic Characteristics
• Dimensions • Material • Vegetation • Receiving channel
conditions

Physical Indicators (for flowing outfalls)
• Is there flow? • Odor • Color • Transparency • Floatables
Source: Fort Worth DEM

• Outfall Damage • Deposits/Stains • Abnormal Vegetation • Poor Pool Quality • Pipe Benthic Growth
Other Information

Quick and Dirty Outfall Inspection Exercise


Taking a Sample • DO NOT take sample if
discharge has strong smell or is hard to reach
• Only take sample if it seems safe
• Use sample bottle or bags that can seal well
• Wear gloves • Avoid touching inside lip of
container • Record site id, date, location
and sample collectors on bottle and on form
• Keep sample on ice if testing for bacteria
NOT SAFE!
18

Holding Samples Parameter Holding Time Notes
Bacteria 6 hours Cool, 4ºC
Ammonia Process immediately Can preserve with sulfuric acid and hold for 28 days
Fluoride 28 days (HDPE plastic container only)
Cool, 4ºC
Anionic Surfactants 2 days Cool, 4ºC
Potassium 6 months Frozen
Total nitrogen / Total phosphorus
24 hours 30 days
Cool, 4ºC Frozen below -20ºC
pH Process immediately
Temperature Process immediately

Bags or Bottles? Considerations: What parameter are you collecting for (bacteria - sterile, nutrients - autoclaved bottle)? Does the sample need to be frozen? Are you on foot or in a car?
• Easy to carry when empty
• No prep needed
• Sterile • Can leak if
not closed properly
• Not true!
• Don’t break • Need to be clean • Bulky to carry
around in backpacks
• Can re-use
• Sterile bottle
20

Partially submerged outfalls
• Mixing with stream water (dilution or masking of a potential problem)
• Collect from pool or move to an up-pipe manhole to collect a sample
21

Trickle Flows • Can be difficult to collect
samples • Plumbers putty can be used
to direct flow to a “spout” • Use smaller volume
containers for collecting flow measurement
• Concern for sterile samples

Sampling From Manhole Necessary when dealing with
submerged outfalls or tracking illicit discharges
Can be difficult to collect, esp. if just a trickle
Concern is collecting flow measurement and sterile samples
23

Sampling From Bridge
Nasco sampler can fit with different size Whirlpack
bags

Simple, Low-Cost Equipment
• Comparative colorimetric methods (apparent color, detergents)
• Simple probes (pH, conductivity)
• Spectrophotometric (fluoride, ammonia, potassium)
• Refractometer (salinity)
25

Bacteria Testing
Petrifilm plates by 3M
Quanti-Tray by IDEXX
26

Optical Brightener Traps Optical brighteners are present in laundry washwater, intermittently present in wastewater
Optical Brightener Traps: • Detects detergents that
are intermittently present • Anchor absorbent pads in
storm drains (2-7 days) • Dry & view under black
light

Field vs. Lab Analysis
• Real time • Can follow-
up right away
• Waste disposal
• Lots to lug around
• Controlled conditions (fewer mistakes)
• More accuracy • Materials
readily available
28

In-House vs. Outsourcing
29
Questions to ask: How quickly are sampling results needed? How much staff time and training is needed to
support in-house analysis? Do you have a safe environment to analyze
samples and dispose of waste? Sinks, ventilation, eyewash station
What is comparative cost for sample analysis in each option?
Do you have access to space/resources in a lab in your community?
Wastewater treatment plant or drinking water lab

Field Safety Do • Wear waders, with good grip – streams can be
slippery • Wear rubber gloves when collecting samples • Wear goggles when handling reagents • Wear steel toed boots and use a pick (not your
fingers) when pulling manholes • Wear a safety vest • Carry a flashlight, a cell phone and keep
emergency numbers handy • Use safety cones and an appropriate number of
staff to safely work in the road • Carry a (stocked and up-to-date) first aid kit

Field Safety Don’t • Pull a manhole with your back toward the street • Enter a manhole or outfall without confined space
entry training • Dispose of reagents or other chemicals in the stream • Conduct any sampling if the discharge is very
severe – call emergency services

Waste Disposal
• Ammonia waste – flush with cold water in sink
• Fluoride waste – flush with cold water in sink
• Bacteria plates – soak in bleach solution, put in trash

Lab Safety Do • Wear latex gloves when processing samples • Wear goggles when handling reagents • Wear closed-toe shoes and pull hair back • Dispose of materials properly, according to MSDS
sheets and local regulations • Soak bacteria plates in bleach after counting • Use a hood, if / when necessary – consult MSDS sheet • Stay organized when running multiple tests – keep
separate data sheets, stopwatches, etc. • Store materials in appropriate containers when not in
use • Wash and dry all equipment when you are done

Lab Safety
Don’t • Wear loose hanging clothing • Eat in the lab (esp. while conducting tests) – ew!
Do • Know where the eye wash station, fire extinguisher
and other safety equipment are before beginning lab work
• Wash your hands before leaving the lab

Source Tracking June 13, 2016
HRPDC

Methods to Track Down Sources Common Methods Other Methods
• Tracking Up Storm Drain Network
• Drainage Area Investigation
• Video Surveys • Dye Testing • Smoke Testing
• Trained Sewage Sniffing Dogs
• Sewer pipe flow metering
• Continuous tracers in sewers

Track Up Storm Drain Network
• During dry weather only • Isolate flow at manholes • Look for physical
indicators • Sample in manholes &
test for chemical indicators

Isolating Flow in Storm Drain • Start at outfall &
move up pipe network
• Goal: Isolate flow to between 2 manholes
From Brown et al (2004)

Trunk
Branches
Splitting the Trunk 1.Identify major branches to the
trunk (largest diameter pipe in the network)
2.Identify manholes where branches connect to trunk, plus one immediately upstream.
3.Working up the network, investigate
4.manholes on each contributing branch and trunk
5.Narrow the discharge to a specific section of trunk or contributing branch
6.Move up until a specific pipe segment is isolated

For Intermittent Flows
Catch the flow: • Dam flow with
sandbags (if not tidal) • Install when no rain is
predicted • Leave in for 48 hours or
less (Source: Jewell, 2001)

Drainage Area Investigation
• Drive or walk around looking at potential discharge source sites
• Only works if flow is distinct (e.g., color, odor, or high indicator reading)
• Not very helpful for finding sewage leaks

Video Surveys • Closed caption television
(CCTV) – robot camera • Use for sanitary sewer or storm
pipes • Live image to see cracks,
leaks, breaks, and blockages • Best for continuous discharges

Dye Testing • Add to plumbing fixtures to see
if/where dye comes into storm sewers (cross-connection)
• Use when discharge has been isolated to very small drainage area (<10 properties)
• Must gain access to private property; inform residents & agencies
• Requires extra staff to find dye

IDDE Canine Unit • Dogs trained to detect smell of
sewage (presence/absence)
• Outfall screening and tracking up storm drain network
• Faster than us humans • Environmental Canine Services
LLC (based in Maine)
Fixing Key Elements of Success: • Well defined legal
authority • Strong enforcement • Follow-up measures
Four Questions: • Who is responsible? • Methods to fix? • How long should it
take? • How is removal or
correction confirmed?

Who is responsible? The property owner or municipality/utility? … Generally, if illicit discharge from: Internal plumbing connection property
owner Service lateral cross-connection property
owner Infrastructure failure w/in sanitary sewer or
MS4 municipality/utility Transitory discharge property owner

Methods to Fix? • Varies depending on type and location.
Develop a pre-approved list of certified/licensed contractors.
Use in-house
contractors/staff to repair as part of routine maintenance activities.

How long should it take? Varies depending on type and location –
though local ordinance may provide time frame for removing discharge and repairing.
Generally – If illicit discharge is significant health or
environmental threat fix immediately After notification by municipality Stop discharge w/in 7 days Repair w/in 30 days

Q/A