immigration “won” trump the election
TRANSCRIPT

1
Abstract
The election of Donald Trump raised many questions about the impact of immigration on
American politics. This article asks whether Trump’s appeals to nativism were particularly
effective in places undergoing rapid growth in foreign-born, Hispanic, and/or Asian populations.
I use techniques accounting for selection into treatment to examine the relationship between
demographic changes at the county level and voting patterns in the 2016 presidential election.
Analyzing individual-level survey data and controlling for voting patterns in 2012, I find that
voters living in counties with a rapid percentage point increase in the Hispanic population since
2000 were more likely to vote for Trump in the general and primary elections. I find similar
results when analyzing county-level election results, but these effects do not replicate when
analyzing only the swing states. This provides reason to be cautious about claims that
immigration “won” Trump the election.
Keywords: Immigration; demographic threat; 2016 presidential election; Donald Trump;
populism.
2
1. Introduction
During the lead-up to the 2016 presidential election, Donald Trump ran one of the most
anti-immigrant campaigns in recent memory. In contemporary political history, restrictionist
attitudes toward immigration, particularly with regard to undocumented immigration, have been
an important position of many, though not all, in the Republican party (Wroe 2008). However, as
this unconventional candidate was wont to do, Trump amplified the rhetoric around immigrants
as well as racial, ethnic, and religious minorities in ways that even discomforted some
Republicans. The current president claimed that Mexico is sending criminals and rapists to the
U.S., proposed a ban on all Muslims entering the country, and promised to build a wall across
the U.S.-Mexico border that the Mexican government would pay for, among many other
controversial statements (Diamond 2015; Imbert 2015; Ye Hee Lee 2015). Some predicted that
comments such as these, among other types of offensive comments, would contribute to
derailing the Trump campaign (Kruse and Gee 2016). Given Trump’s surprise victory in the
2016 election, it worth investigating the role that immigration played in this outcome.
This paper addresses trends in immigration and Hispanic/Asian population growth since
2000 and quantifies what impacts these trends may have had on the 2016 presidential election.
There is ample evidence that concerns about immigration and racial/ethnic demographic change
are important to understanding support for Trump (Major, Blodorn, and Major Blascovich 2018;
Mutz 2018; Sides 2017; Sides, Tesler, and Vavreck 2018). However, analysts have often pointed
out that localities with higher foreign-born populations were actually less likely to vote for
Trump (Flowers 2016). Various factors likely account for this relationship, including the impact
of immigrants and their children, many of whom are racial minorities, on the electorate
(Holbrook and Park 2018; Krogstad and Lopez 2016; Pew Research Center 2012; Sides 2017).
3
Immigrants also tend to live in larger metropolitan areas, areas that were unlikely to vote for
Trump (Florida 2015; Scala and Johnson 2017). For Whites specifically, the relationship
between Trump support and living in a diverse place is complex, and may depend on certain
individual characteristics such as party identification, as well as which out-groups Whites live
near, the level of geography analyzed, the level of segregation, local economic context, selection
bias, and how these relate to the contrasting predictions of group threat and intergroup contact
(Allport 1954; Blalock 1967; Reny, Collingwood, and Valenzuela 2017; Knowles and Tropp
2018; Rothwell 2016; Rothwell and Diego-Rosell 2016; Newman, Shah, and Collingwood
2018).
However, others have focused not on the size of the local immigrant-origin population,
but instead the rapid demographic change occurring in many places. In a 2017 op-ed in the New
York Times entitled “How Immigration Foiled Hillary,” Thomas Edsall addresses the impact of
demographic change in new immigrant destinations on the 2016 presidential election. Edsall
draws on work from Newman (2013) to argue that the turn towards Trump may be particularly
strong in places that are less diverse but that have recently been diversifying. Others have drawn
a similar connection (Adamy and Overberg 2016), and even Hillary Clinton recently “warned”
about high levels of immigration benefiting the far right in Europe (Wintour 2018). Additionally,
various studies from different contexts and levels of analysis have found a positive relationship
between rapid immigration and voting for conservative and far right candidates (Arzheimer
2009; Becker and Fetzer 2017; Enos 2017; Swank and Betz 2003; Thompson 2017). Enos (2017)
looks at the 2016 U.S. presidential election at the individual level for Anglo Democrats as well
as at the county level. The author finds a positive relationship between Hispanic population
growth and Trump voting as well as the shift from Romney to Trump, respectively, but the
4
analyses are very limited in their use of control variables. Collingwood, Reny, and Valenzuela
(2017) look specifically at the relationship between Latinx/foreign-born population growth and
vote switching for Trump, by those who either didn’t vote Republican or didn’t vote in 2012,
among the white working class. The authors find mixed results depending on party
identification.1 Additionally, various recent studies from the U.S. have demonstrated a link
between rapid demographic change and anti-immigrant attitudes (Hopkins 2010; Newman 2013),
as well as expressed support for Trump (Newman, Shah, and Collingwood 2018), both under
certain conditions in particular.
I provide a unique contribution to the literature on immigration and electoral outcomes by
addressing demographic change and Trump voting through a more causal framework.
Specifically, I employ techniques intended to account for selection effects that may influence
both where immigrants, Hispanics, and Asians tend to move as well as the likelihood of a
backlash against these groups. This provides a robust test of the effect of immigration or the
increase in Hispanic/Asian population shares on local voting patterns. I find no evidence of an
electoral backlash caused by foreign-born or Asian population growth. However, using
individual-level survey data from the Cooperative Congressional Election Survey (CCES), I find
that people living in a county with a large percentage point increase in the Hispanic population
since 2000 were more likely to vote for Trump in the general and primary elections (caucuses
included). The general election effect is specifically found among non-Hispanic Whites and
Asians, with the magnitude of the effect for Asians being particularly large. Among non-
Hispanic Whites, the effect is concentrated among those having attained less than a 4-year
degree and, perhaps somewhat paradoxically, those on the higher end of the family income
spectrum. I also find that non-Hispanic whites living in counties with lower shares of Hispanics

5
in their county as of 2000 were considerably more likely to vote for Trump if that county
subsequently experienced rapid Hispanic population growth. I also find a positive effect of
Hispanic growth on Trump voting when analyzing county-level election results from Election
Atlas, but find no such effect in the swing states. Lastly, I find no evidence that the Republicans
may have captured such an effect previously. I therefore recommend caution when evaluating
any argument that suggests that local increases in immigration “won” Trump the election.
2. Literature Review
2.1. Immigrant Threat Narrative
Politicians and political activists in the United States have long drawn on immigrant
threat narratives as a strategy to gain popular support as well as to aid in the enactment of
restrictive policies toward immigrants and immigration. The American Party spearheaded the
“Know Nothing” movement in the 1850s, highlighting the alleged threat of Catholics and
immigrants (Levine 2001). Arguments that Chinese immigration was an “unarmed invasion”
helped lead to the Chinese Exclusion Act of 1882 (Lee 2002, p. 36). The Immigration Act of
1924, which severely limited immigration from certain countries, came in the context of “the
restrictionists’ claim that immigration threatened to overwhelm the American nation” and that
“the great Nordic race was in danger of extinction” (Ngai 1999, p. 75).
In its contemporary iteration in the United States, the immigrant threat narrative has most
obviously been directed at the Latinx population. Massey and Pren (2012) trace this process back
to the termination of the Bracero Program in 1964 and its phase-out from 1965-1967. This guest
worker program offered a legal method for Mexicans to work in the United States. When this
pathway was closed and additional immigration restriction was implemented, undocumented
immigration rose and narratives about a border invasion took off. Chavez (2001, 2008)
6
documents this framing in the media and finds an increase in negative portrayals of the Latinx
community on national magazine covers through the 70s, 80s, and 90s. In their own analysis,
Massey and Pren (2012, p. 4) demonstrate that, in the post-Bracero period, there was a large
increase in “instances in which the words ‘undocumented,’ ‘illegal,’ or ‘unauthorized’ were
paired with ‘Mexico’ or ‘Mexican immigrants’ and the words ‘crisis,’ ‘flood,’ or ‘invasion,’”
across four major newspapers. As Massey and Pren (2012) document, politicians also
participated in this narrative. For instance, Governor Pete Wilson of California framed Mexican
immigration to California as an “invasion” and Ronald Reagan connected undocumented
immigration with national security concerns. Though both major political parties have been
guilty of fear mongering regarding the border, the contemporary Republican Party has certainly
taken up this mantle more aggressively, and Trump has helped to center the most extreme
version of this narrative in the American consciousness.
2.2. What Type of Threat?
Much of the scholarly debate on attitudes toward immigration concerns whether anti-
immigrant attitudes are driven by cultural or economic factors. Cultural factors refer to those in
which immigrants are perceived by the native population to be irreconcilably different in
language, religion, and other markers, many of which are perceived as being closely related to
race/ethnicity. Economic factors can take numerous forms, depending on where one falls in the
economic hierarchy of the United States. Less educated natives may believe that “low skill”
immigrants lower their wages. Others may be concerned with the alleged fiscal consequences of
immigration on government coffers. Still other research has highlighted native concerns related
to the impact of immigration on the economy as a whole. This is not to say that these concerns

7
are realistic in all instances (see The National Academies Press (2017) for an overview), but
simply that they may exist among various populations.
In their review of the literature from the U.S., Canada, and Western Europe over 20
years, Hainmueller and Hopkins (2014, p. 225) argue that the evidence largely supports that idea
that “immigration attitudes are shaped by sociotropic concerns about its cultural impacts-and to a
lesser extent its economic impacts-on the nation as a whole.” For example, a host of studies have
found that racial/ethnic bias, perception of cultural threat, and placing a premium on cultural
homogeneity are correlated with more anti-immigrant attitudes, while personal economic
circumstances are less important if important at all (Chandler and Tsai 2001; Citrin et al. 1997;
Sides and Citrin 2007). Experimental research finds similar results. For example, Sniderman,
Hagendoorn, and Prior (2004, p. 35) find that “considerations of national identity dominate those
of economic disadvantage in evoking exclusionary reactions to immigrant minorities.” Overall,
the evidence for the relationship between cultural threat and immigration attitudes is quite strong.
This is not to say that there is no evidence that personal economic circumstances are
important (Citrin and Sides 2008; Palmer 1996), but simply that the evidence is relatively weak
in the overall literature. Mayda (2006) finds support for the idea that labor market competition
concerns drive immigration attitudes. The author shows that “skilled individuals are more likely
to be pro-immigration in countries where the skill composition of natives relative to immigrants
is high” (Mayda 2006, p. 510). However, asking about preferences for low and high skill
immigration tells a different story. For instance, Hainmueller and Hiscox (2010) find that both
high and low skilled natives prefer high skilled immigrants and the strength of this preference
does not vary by native skill level. Similarly, Hainmueller, Hiscox, and Margalit (2015) find that
the positive relationship between education and support for high and low skilled immigration

8
shows no meaningful variation by skill intensity and reliance on foreign-born labor for a given
industry. Ultimately, there is no clear evidence in these studies that natives are more concerned
about immigrants that may be more likely to compete with them on the job market.
Concerns about the fiscal burden of immigrants find mixed support in the literature
(Facchini and Mayda 2009; Hainmueller and Hiscox 2010; Hanson, Scheve, and Slaughter 2007;
Tingley 2013), but broader economic concerns do seem to be correlated with attitudes toward
immigration. For example, Lapinski et al. (1997) mention an increase in anti-immigration
attitudes during a recession (Harwood 1986) and Wilkes, Guppy, and Farris (2008) find that poor
national economic conditions correlate with restrictionist attitudes. However, this again provides
no evidence that natives’ personal economic circumstances are driving attitudes, and may simply
indicate that the scapegoating of immigrants increases during difficult economic times (Citrin et
al. 1997). The fact that Wilkes, Guppy, and Farris (2008) find that the impact of national
economic conditions on immigration attitudes is similar across skill and occupation groups
perhaps provides support for this idea.
2.3. The Effect of Immigrant Flows on Electoral Outcomes
Newman and Velez (2014) do well to describe the process by which many scholars have
turned to demographic change as opposed to demographic group size as a key explanatory
variable for various forms of immigration backlash, drawing much from prior work by Hopkins
(2010). Rooted in the work of Key (1949) and Blalock (1967), various scholars have put forth
that minority group size can generate power threat in the majority population, but the empirical
evidence has been mixed on this as it relates to the size of Hispanic and Asian populations
(Dixon and Rosenbaum 2004; Fox 2004; Taylor 1998; Tolbert and Grummel 2003; Abrajano and
Hajnal 2015). While a baseline level of local diversity may be viewed as acceptable, particularly

9
when accounting for self-selection (Gould 2000), rapid changes in local diversity may upset the
status quo and lead individuals to re-evaluate their orientation toward the community (Hopkins
2009). Moreover, people often notice change more than the absolute state, to which they may
have become accustomed to and use as a point of reference (Kahneman and Tversky 1979;
Helson 1964).
Given the points laid out above, many scholars began to view demographic change as
important in various respects, such as the likelihood of adoption of restrictive immigration
policies (Marquez and Schraufnagel 2013; Newman et al. 2012), local voting around taxes and
public spending (Hopkins 2009), and attitudes toward immigrants and immigration (Hopkins
2010; Newman 2013). If negative attitudes toward immigrants are triggered by demographic
change under certain conditions, voters may express such sentiments by casting their ballots for a
political party or candidate that echoes these sentiments. Indeed, various empirical studies across
different contexts and levels of analysis have found evidence that inflows of immigration2 are
associated with (and perhaps provoke) increases in conservative or far-right voting (Arzheimer
2009; Becker and Fetzer 2017; Enos 2017; Swank and Betz 2003; Thompson 2017). Notably,
some of the results in this literature are conditional on various factors. For example, Dustmann,
Vasilieva, and Piil (2016) find that conservative voting increased in Denmark as a function of
refugee inflows everywhere except the most urban municipalities, highlighting the importance of
geographic context. Edo et al. (2018, p. 1) find a relationship between immigration and far right
voting in France, but determine that this effect is “driven by low educated immigrants from non-
Western countries,” highlighting the importance of class and nationality. An additional caveat is
that the effects in these studies vary in size and some find little evidence that immigration flows
were, ultimately, particularly impactful (Becker and Fetzer 2017). Despite this, and despite the
10
fact that not all studies show any effect on conservative voting at all (Arzheimer and Carter
2006), there is a substantial body of evidence confirming the hypothesis that conservative voting
is tied to immigration threat and the effect sizes are often quite substantial.
The question of whether immigration causes conservative or far right voting is another
matter. Most innovatively, various authors have used natural experiment, difference in
difference, instrumental variable, propensity score matching, and/or synthetic control group
approaches to answer this question (Becker and Fetzer 2017; Dustmann, Vasilieva, and Piil
2016; Edo et al. 2018; Mendez and Cutillas 2014; Thompson 2017). The instrumental variable
studies have used prior settlement patterns as instruments to account for the fact that these
patterns tend to predict future settlements. In a recent and innovative study in the United States,
Thompson (2017) uses the Mariel boatlift as a natural experiment to monitor the impact of an
inflow of Cubans on voting patterns in Miami-Dade County compared to a synthetic control
group of counties and finds an increase in voting for Republican candidates that is persistent
across several presidential elections. The difficulty that Thompson and other authors are
attempting to overcome is that the places where immigrants choose to live may vary
systematically in ways that are related to the likelihood of a political backlash. I attempt to solve
this problem by using techniques that account for selection into particular geographical areas by
weighting according to the likelihood of having been a high migration or Hispanic/Asian growth
setting in the 2000 to 2010-2014 period.
One additional study is worth noting in particular. Newman, Shah, and Collingwood
(2018) use inflammatory comments by Donald Trump early in his campaign as a natural
experiment to test the effect of activation of anti-Latinx sentiments and determine whether this
activation is more effective in areas with rapidly growing Latinx populations. The authors find
11
that living in such an area was predictive of support for Trump after, but not before, said
comments. This fits well with other research on demographic change and political activation. For
instance, Hopkins (2010) finds that anti-immigrant sentiment is more highly correlated with
immigrant growth during times when immigration is more nationally salient due to its level of
coverage in the media. In other words, politicians and the media can help make salient the link
between immigration growth and anti-immigrant sentiment and/or conservative voting, and there
is evidence that Trump’s anti-Latinx rhetoric accomplished this in particular. The current study
examines whether or not this immigrant inflow, as well as Hispanic and Asian growth, had an
impact on the 2016 presidential election.
3. Data
To answer the questions posed in this study, I use multiple data sources. First, I analyze
individual-level survey data from the Cooperative Congressional Election Survey (CCES) from
2016 (Ansolabehere and Schaffner 2017). This provides a large sample size (51,690) of U.S.
citizen adults for which there is post-election voting information for 2016 with weights
calculated after vote validation. Next, I analyze county-level election results for the 2016 and
2012 presidential elections from David Leip’s Election Atlas (Leip 2019). I merge the above data
sets with the 2000 Census and the 2006-2010 and 2010-2014 American Community Surveys,
which provide the treatment variables reflecting demographic change across counties, as well as
other control variables, either directly from these sources or constructed from them (U.S. Census
Bureau 2019a, 2019b, 2019d). Newman and Velez (2014) provide evidence that demographic
change at the county level is highly noticeable to residents, justifying the use of this geographic
unit when analyzing the relationship between demographic changes and voting outcomes. The
sample sizes of both of these datasets is reduced due to the exclusion of Alaska, whose voting

12
results from Election Atlas are not reported by its closest county equivalent (boroughs). The
sample sizes are reduced further due to a small amount of missing data on some variables.
4. Methodology
To analyze the key questions of this study, I examine the relationship between a county
having a high growth in foreign-born, Hispanic, and Asian share of the population from 2000 to
2010-2014 and voting for Trump using both individual-level survey data and county-level
election results. I use two types of selection techniques, inverse-probability-weighted regression
adjustment (IPWRA) and augmented inverse-probability-weighting (AIPW) (Huber and Drukker
2015). The goal here is to weight counties according to their probability of having experienced a
high rate of growth in the share of the population that is foreign-born/Hispanic/Asian since 2000,
with the treatment group having actually experienced this large demographic change and the
control group having experienced much more modest growth in their foreign-
born/Hispanic/Asian population share, or even no growth or negative growth in some cases. This
accounts for the possibility that high and low growth counties may differ systematically from
each other in various ways, and “selecting” into high or low growth may be correlated with
voting patterns. By accounting for this selection into treatment, these techniques attempt to
isolate the causal effect of immigrant, Hispanic, and Asian growth from other factors that may be
correlated both with this growth and the outcomes in this study. Each method accomplishes this
in different ways (StataCorp 2013b), and using both methods in this study will provide a
robustness check on the results.
For the analysis of individual-level survey data, I test two definitions of “high growth”
for immigrant, Hispanic, and Asian populations, versions of both of which have been utilized in
the relevant literature. The first defines the change in the share of the population as percentage
13
growth, the other as percentage point growth. For example, the first method would define a
change from 5% foreign-born to 10% foreign-born as an increase of 100%, while the other
would define it as an increase of 5 percentage points. The former approach has the disadvantage
of biasing places with low starting populations of immigrants, Hispanics, and Asians (confirmed
through bivariate correlations), but this may be advantageous considering the evidence that these
places may be particularly vulnerable to backlash against demographic change (Newman 2013).
Moreover, I control for the percent immigrant/Hispanic/Asian in 2000 as appropriate to mitigate
this issue. Alternatively, the percentage point method does not bias these places in the same way,
but has its own drawback that depends on the starting point of the immigrant, Hispanic, or Asian
population. As an example, in this method, a change of 10% to 20% foreign-born is treated the
same as a change from 50% to 60% foreign-born, while the former seems more impactful from a
backlash perspective. Regardless, the results below will demonstrate which method is most likely
to reveal immigrant/demographic backlash in terms of voting outcomes.
4.1. Key Variables
For the analysis of individual-level survey data, I employ a binary outcome indicating
whether someone voted for Trump or not. The group who did not vote for Trump includes those
who voted for another candidate or did not vote at all. For the analyses of the county-level
election results, the outcome is the percentage of a particular county that voted for Trump. I also
analyze vote percentage for Mitt Romney in 2012 at the county level.
The primary treatment variables are binary variables representing counties with high rates
of growth in their foreign-born, Hispanic, and Asian population shares. I use a binary treatment
variable in all models to match the binary treatment in the analyses accounting for selection. I
generally define “high growth” counties as counties in the top quartile of growth from 2000 to
14
2010-2014 for Trump voting, and from 2000 to 2006-2010 for Romney voting. As stated above,
I employ two ways of approaching this variable and test the relevance of each way on the
individual-level survey data.
4.2. Controls
For every model, I employ controls that may be correlated with the treatment and
outcome. For the analysis of individual-level survey data, I control for education, family income,
employment status, race/ethnicity, Hispanic identification, immigrant generation, gender, birth
year, union membership, parental/guardian status (children under 18), marital status, state of
residence, and length of current residence so as to account for selection in and out of places of
residence that may be correlated with key variables in this study. As additional contextual
variables, I control for the population density (in quartiles) and labor force participation (age
16+) in a respondent’s county, as well percent foreign-born, Hispanic, or Asian in 2000,
depending on the treatment variable. I also control for population movements in and out of these
counties that might be important: U.S.-born, non-Hispanic, or non-Asian population change from
2000 to 2010-2014, respectively, depending on the treatment variable. Lastly, I control for who
the respondent voted for in 2012, as well as the percentage of their county that voted for Romney
in 2012. The former includes an “other” category for those who did not vote in 2012, were too
young to vote in 2012, voted for someone besides Romney or Obama, or it is uncertain who they
voted for. A small number of respondents who were too young to vote in 2012 claim to have
voted for Obama or Romney. I code them as having voted for these candidates as a way to
capture their preference, even if they could not actually vote.
I utilize similar controls for the analysis of county-level election results. Firstly, I control
for the percent foreign-born, Hispanic, Asian for different years depending on the model. If I am

15
examining the effect of high Hispanic growth, for instance, I control for foreign-born and Asian
populations in 2010-2014 (or 2006-2010 in the 2012 election models) and control for Hispanic
population in 2000. The idea here is that the percent Hispanic in 2000 captures that population at
the beginning of the growth period, which may be related to subsequent growth, and the
treatment variable captures the increase over time.
I also control for percent non-Hispanic Black, the percent with at least a bachelor’s
degree (age 25+), the population density (in quartiles), median household income (in quartiles),
median household income growth since 2000, percent in the labor force (age 16+), percent never
married (age 15+), percent aged 65 or older, percent female, and state of residence. Again, I
control for the population growth/decline of U.S.-born, non-Hispanic, and non-Asian populations
to account for selection in and out of particular counties, as appropriate. Lastly, I control for the
percent of the population that voted for Romney in 2012 as a gauge of voting preferences in the
recent past. For the analysis of the 2012 election, all relevant controls are from 2006-2010
instead of 2010-2014, and voting patterns are captured by the percent that voted for George Bush
in 2000. The purpose here is to control for voting preferences at the beginning of the period used
to construct the treatment variables so as to determine if Republicans may have captured
electoral gains from immigration backlash prior to Trump.
4.3. Predicting Selection into Treatment
To predict selection into treatment for the AIPW and IPWRA analyses, I use variables
correlated with high growth in the share of the population that is foreign-born, Hispanic, and/or
Asian since 2000. First, I include the percent foreign-born, Hispanic, and Asian in 2000, as
appropriate depending on the treatment. Given that much of the growth in the immigrant
population has taken place outside of the traditional big city gateways (Massey 2008), including

16
population density (in quartiles) and logged population in 2000 as a predictor makes sense as
well. Immigrants tend to be attracted to places with more economic opportunities (Borjas 2014),
so I include logged median household income in 2000 and median household income growth
since 2000 as predictors of the treatment. As much of the foreign-born, Hispanic, and Asian
growth is concentrated in particular states, I include state of residence as a predictor of selection
into treatment as well.
4.4. Additional Analyses
Lastly, it is worth noting that I perform several additional analyses, both using the
individual-level survey data and county-level election results. For the former, I examine effects
of the treatment on subgroups based on voting from 2012, race/ethnicity and Hispanic identity,
education, family income, and county-level demographics in 2000. I also examine voting choices
in the Republican primary. For the analysis of county-level election results, I perform additional
analyses restricting the sample to the swing states due to the particular importance of this
subsample on the election results. It is worth noting that this sample is different from the full
sample of counties in ways that may impact the likelihood of a demographic backlash, such as
having higher median population density and household income, as well as lower median
Romney voting in 2012. I also examine Republican primary results in 2016 as well as the 2012
general election (controlling for results from the 2000 election) to determine if Republicans may
have captured the effects of immigrant backlash prior to the ascent of Trump, as stated above.
For all analyses of the Republican primaries, I include states that hold caucuses (though
obviously not conventions), but not states whose primaries/caucuses were ultimately
meaningless, those that held them after Trump had effectively won the nomination (California,
Montana, Nebraska, New Jersey, New Mexico, Oregon, South Dakota, Washington, and West
17
Virginia). By controlling for state of residence, I account for any specific features of state
primaries or caucuses that may be important.
5. Descriptive Statistics
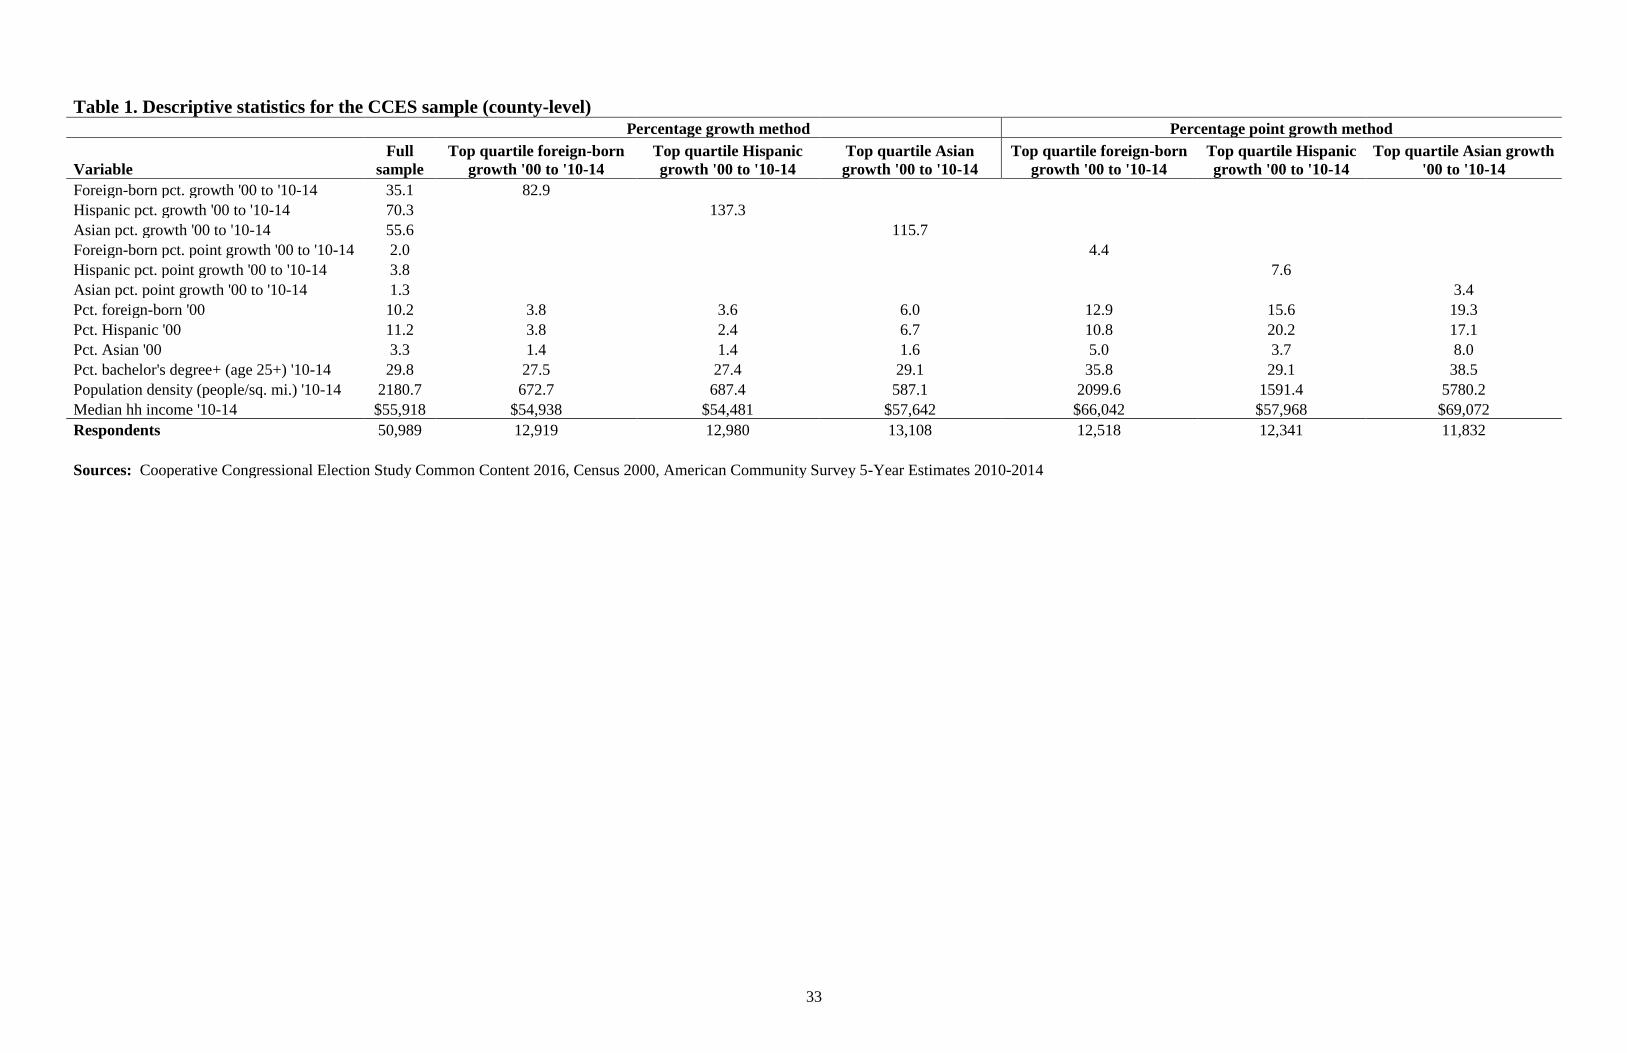
Table 1 displays the descriptive statistics for the sample of counties in the CCES, as well
as subsamples of counties in the top quartile of foreign-born, Hispanic, and Asian share growth,
both by the percentage growth and percentage point growth methods. This table uses variables
merged into the CCES from the 2000 Census, and the 2010-2014 American Community Survey.
I also display the number of respondents in each of these samples. As stated above, the number
of respondents for the full sample is smaller than what was given in the data section due to the
exclusion of Alaska and small amounts of missing data for some of the predictors.
Table 1 here
Firstly, it is worth noting the obvious, that the “rapidly changing” counties have higher
growth of their respective groups on average, both in percentage terms and percentage point
terms, compared to the full sample. Though not displayed, it is also worth noting that many
counties in the high growth categories have quite a bit higher growth than the average in their
respective groups. Examining the counties in the top quartile of percentage point growth, these
counties already had relatively large foreign-born, Hispanic, and Asian populations in 2000.
Related to this, subsamples divided by pre-existing demographics will be important to this study.
The counties with high percentage point growth in the Asian population are particularly dense,
well off financially, and more highly educated. Counties with high percentage point growth in
the foreign-born population are doing relatively well in terms of median household income and
education as well. Lastly, it is notable that the rapidly changing counties based on the percentage

18
method had low foreign-born, Hispanic, and Asian populations in 2000 and are quite a bit less
dense than the average county in the sample.
6. Results
6.1. Logistic Regressions
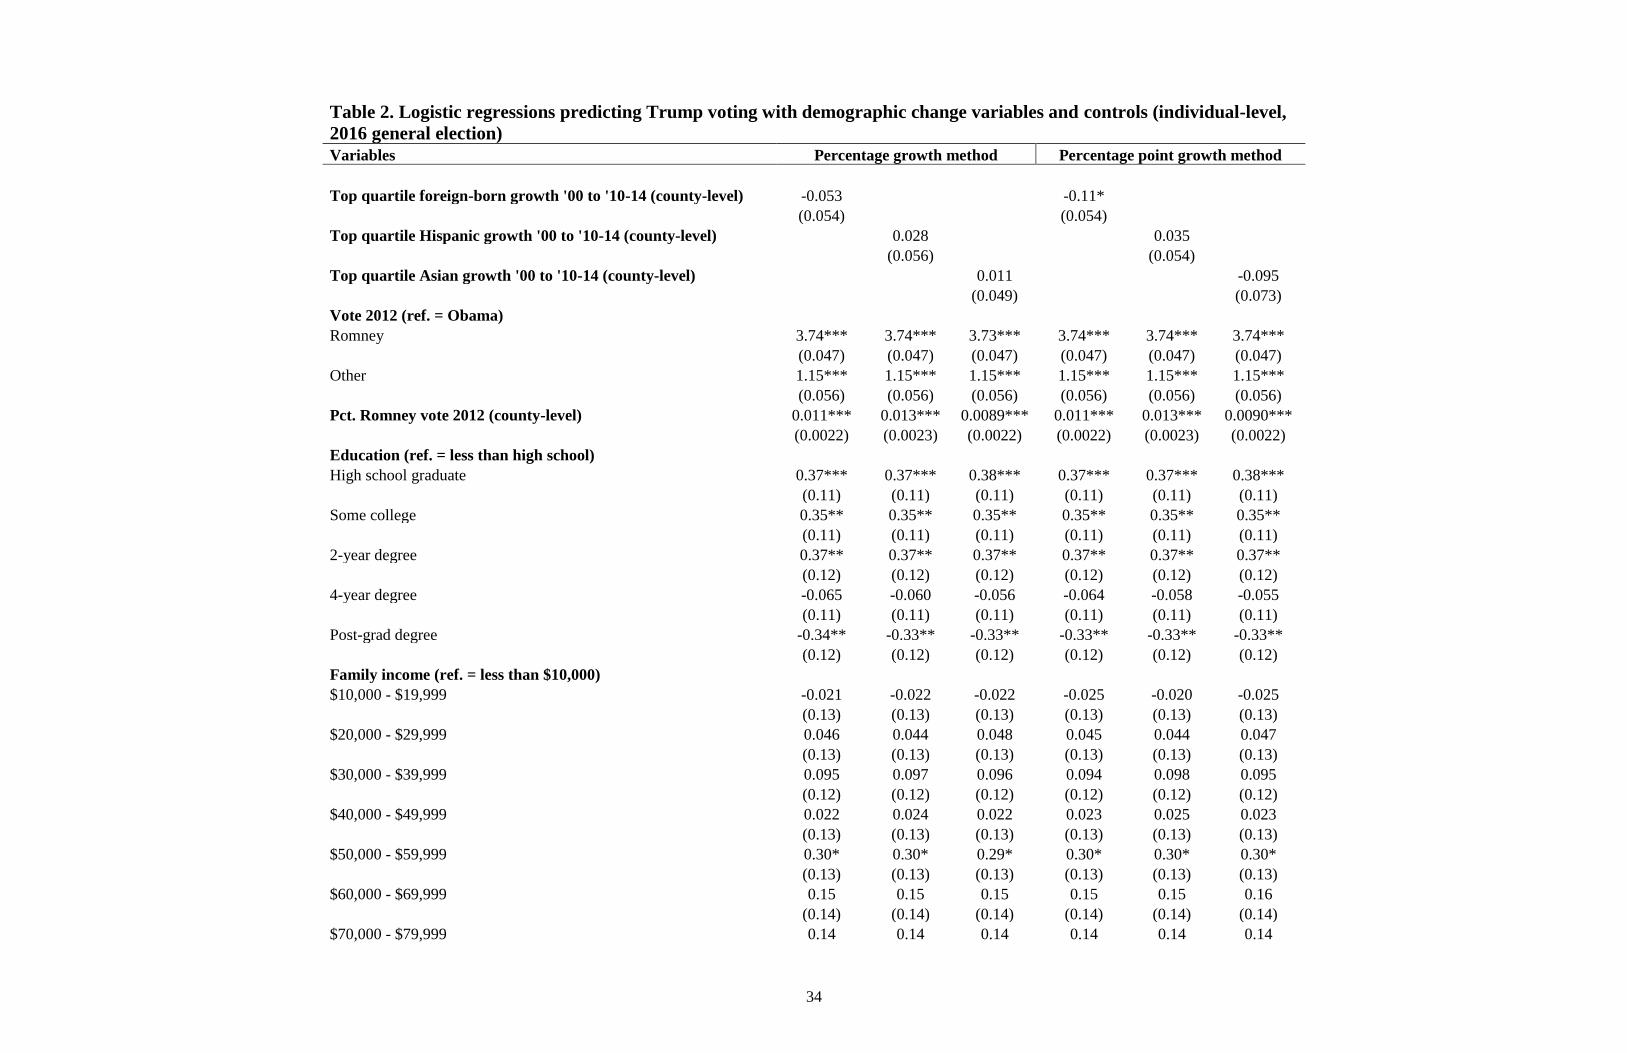
Beginning with an analysis of the individual-level survey data from the CCES, Table 2
shows the logistic regressions demonstrating the relationship between the likelihood of voting for
Trump and living in a high foreign-born, Hispanic, or Asian share growth county, using both the
percentage growth and percentage point growth methods. The sample sizes for two groups differ
slightly due to the fact that counties with zero foreign-born/Asian people in 2000 are inherently
excluded from the percentage growth method analysis, but not the percentage point growth
method analysis. I exclude the state of residence control in the presentation of these models. The
treatments are considered in separate models due to a high level of multicollinearity, based on
high variance inflation factors. There is not a high level of multicollinearity with any other
variables. All CCES analyses below are run using weights provided by the CCES. All analyses
in this study include robust standard errors. I report robust standard errors as well as statistical
significance at the 5%, 1%, and .1% levels.
Table 2 here
Examining the control variables, I find various relationships that are statistically
significant across all six models. As expected, those who voted for Romney in 2012 were more
likely to vote for Trump than those who voted for Obama, but those with an “other” voting
history were as well. Even accounting for these effects, those living in a county with a higher
percent of Romney voting in 2012 were also more likely to vote for Trump. Those with a high
school degree, some college, or a two-year degree were more likely to vote for Trump than those
19
with less than a high school degree, while those with a 4-year degree were about as likely and
those with a graduate degree were less likely, all else held constant. There appears to be less
variation by family income, though those in the $50,000 - $59,000 bracket were more likely to
vote for Trump compared to those in the lowest income bracket. All else held constant, the
unemployed, retirees, and homemakers were less likely to vote for Trump compared to those
with full-time jobs. Blacks, Asians, Middle Easterners, and those reporting mixed race were less
likely to vote for Trump compared to Whites. The CCES allows Hispanic identification as part of
the racial/ethnic question and as a separate question specifically about Hispanic identification. I
include both measures here and find that Hispanics were less likely to vote for Trump.
Interestingly, controlling for all other factors, foreign-born citizens were no more or less likely to
vote for Trump than second or third generation individuals, and were more likely to vote for
Trump than those in the fourth generation or higher. Women and younger people were less likely
to vote for Trump, as were those without children and those who were divorced, single, or in a
domestic partnership, as compared to those who were married at the time. Current or former
union members appear no more or less likely to vote for Trump as compared to those who have
never been in a union. After controlling for all other factors, the population density of one’s
county appears to have no relevance for Trump voting, while living in a place with a higher labor
force participation predicts a lower likelihood of voting for Trump. Lastly, residents with a
longer tenure in their current address were more likely to vote for Trump.
In relation to the key questions of this study, I find no evidence from logistic regressions
that people living in places with rapid growth in immigrant, Hispanic, or Asian population are
more likely to vote for Trump. This holds for both of the constructions of demographic change,
those based on the percent growth in the share of the population as well as the percentage point

20
growth in the share of the population. I do find that people living in counties with rapid foreign-
born growth (according to the percentage point growth method) were slightly less likely to vote
for Trump, but the analysis via techniques accounting for selection below will address this more
rigorously.
6.2. Techniques Accounting for Selection
The analyses below account for selection into treatment when examining the relationship
between the treatment (rapid demographic change) and the outcome (Trump voting in the 2016
general election). I use linear probability models (LPM) to model the outcome here because of
the difficulty of convergence of logit or probit models. Though this can be a controversial
approach for various reasons, Wooldridge (2010, p. 563) points out that “If the main purpose of
estimating a binary response model is to estimate the partial effects of the explanatory variables,
averaged across the distribution of x, then the LPM often does a very good job...The fact that
some predicted probabilities are outside the unit interval need not be a serious concern.”
Additionally, the use of robust standard errors addresses the potential for heteroskedasticity.
Table 3 presents the results for these analyses, first AIPW, then IPWRA. I only treat results as
robust and statistically significant if they are statistically significant at the 5% level (at least) for
both the AIPW and IPWRA analyses. As is required by the AIPW and IWRA commands in
Stata, I exclude cases that violate the overlap assumption (StataCorp 2013a).
Table 3 here
Table 3 demonstrates that there are no statistically significant results when using the
percentage growth method for the treatment variable. Alternatively, using the percentage point
growth method, I find that, on average, people living in counties in the top quartile of Hispanic
growth between 2000 and 2010-2014 (between 5.5 and 18.4 percentage points of growth) were
21
more likely to vote for Trump in the 2016 general election. Voters are estimated to be 3.1 or 4.8
percentage points more likely to vote for Trump, depending on which technique is used. Growth
in the foreign-born and Asian populations seems to have no effect on Trump voting, echoing
previous research showing that demographic backlash is particularly strong when it comes to
Hispanic growth.
Tables 4 and 5 dig further into these results, looking at the relationship between high
Hispanic growth in percentage point terms and Trump voting for various subsamples in the
general election, as well as separately for all respondents who voted in Republican primaries or
caucuses:
Table 4 here
Table 5 here
Table 4 shows that, for the general election, the effect of high Hispanic growth is
concentrated among those who voted for Romney in the 2012 election. It is perhaps surprising
that Hispanic growth would influence Romney voters in this way, voters who are already highly
likely to vote for Trump in the first place, rather than swinging Obama voters or capturing those
in the “other” category. That said, the results for Romney voters have fairly small magnitudes
relative to some of the other subcategories I will explore. I find that the effects are present among
non-Hispanic Whites and Asians, though not among non-Hispanic Blacks. The result for Asians
is perhaps the most intriguing because of the large magnitude of the effect, 11.2 or 9.7
percentage points depending on the model, adding to recent research on non-Hispanic minority
reactions to Hispanic population growth, or at least exposure to information about said growth
(Abascal 2015; Craig and Richeson 2018). As noted in Table 4, the treatment variable is slightly
different for the Asian subgroup, with the “treated” including those living in counties with at
22
least four percentage points of Hispanic growth, due to the fact that there is only a small sample
size of Asians both living in the top quartile of Hispanic percentage point growth and voting for
Trump. Unfortunately, the relatively small sample size of Asians makes it difficult to divide the
sample any further to probe these results more deeply. Lastly, I find that people living in high
Hispanic percentage point growth counties were more likely to vote for Trump in the Republican
primaries, thus providing evidence that this advantage stood for Trump across his campaign.
Table 5 further divides the sample of non-Hispanic Whites for the general election. I find
that non-Hispanic Whites without at least a 4-year degree were more likely to vote for Trump in
high Hispanic growth counties, as were those in a relatively high family income bracket ($80,000
or greater). Alternatively, high Hispanic growth does not appear to have a robust influence on the
more highly educated or lower family income group (less than $50,000) to vote for Trump.
These results may seem counterintuitive, but fit some of the research described above that
suggests that the relationship between education and immigration attitudes may be more
culturally than economically driven, and that those at the higher end of the income spectrum may
fear fiscal impacts of the rapid growth of a relatively “low skilled” population such as Hispanics.
Classism related to anti-Hispanic sentiment for this wealthier group may be at play here as well.
Lastly, echoing work from Newman (2013), I find that the effect of Hispanic growth is
particularly powerful in places with lower Hispanic populations to start with, those in the bottom
half of percent Hispanic as of 2000 (less than or equal to 5.6 percent Hispanic). Within these
counties, non-Hispanic Whites were 12.3 percentage points more likely to vote for Trump
according the AIPW technique and 12.8 percentage points more likely according to the IPWRA
technique, if the county experienced high Hispanic growth since 2000. Alternatively, non-
Hispanic Whites living in counties in the top half of percent Hispanic as of 2000 were not

23
impacted at all by Hispanic growth in terms of voting patterns. This provides strong evidence
that Trump’s appeals were particularly effective in places undergoing rapid Hispanic population
growth for perhaps the first time.
I now turn to the county-level election results compiled by Election Atlas to examine the
potential impact of rapid demographic change on actual election outcomes. I again use linear
models to model the outcomes, this time continuous variables representing the percent voting for
Trump and Romney, respectively. Given the above results from the CCES, I apply the
percentage point method to all of these analyses. Table 6 shows results for AIPW and IPWRA
analyses for the 2016 general and primary elections, as well as the 2012 general election.
Additionally, I analyze a subsample of swing states for both the 2012 and 2016 general elections.
Table 6 here
For the AIPW and IPWRA analyses for the full sample of counties, there is a statistically
significant effect of .548 and .417 percentage points, respectively, for the 2016 general election.
This provides evidence of an impact of rapid Hispanic growth on the election results. However,
it is crucial to remember that many of these counties are less important because they are not in
swing states. As noted above, swing state counties have different characteristics than the full
sample, including higher median household income, higher median population density, and
lower median Romney voting in 2012. Analyzing the counties in swing states, I find no impact
of Hispanic growth on Trump vote percentage, providing evidence that rapid Hispanic growth
did not have a meaningful impact on the 2016 general election.
Ideally, I would also want to analyze a subsample of counties in the swing states that
have relatively higher citizen voting age populations (CVAP), given that these are more
impactful for election results. This is difficult for the county-level data because of sample size
24
constraints, but I examine this in the individual-level CCES data. These results are displayed in
Table A in the appendix. When excluding the bottom quartile of counties in the swing states in
terms of CVAP (U.S. Census Bureau 2019c), I find similar results for all voters and for non-
Hispanic whites specifically, namely that high Hispanic percentage point growth has no
statistically significant relationship with Trump voting.
Returning to the county-level analysis in Table 6, I also find no statistically significant
results for the primaries. In addition, controlling for the results in the 2000 election, there is no
effect of rapid Hispanic percentage point growth on the 2012 election in the full sample, and the
effect in the swing states appears to be negative. In other words, counties in swing states that saw
rapid Hispanic growth from 2000 to 2006-2010 were less likely to vote for Romney in 2012,
reminding us that one effect of Hispanic population growth may simply be to add Democratic
voters to the local population. There are also no statistically significant effects for rapid foreign-
born or Asian growth in the 2016 general or primary elections, or the 2012 election. Overall, I
find little evidence that county-level growth of immigrants, Hispanics, or Asians had a
meaningful benefit for Trump or Romney.
7. Conclusion
In the pre-analysis sections, this article provided various pieces of evidence to support the
hypothesis that rapid immigration and/or racial/ethnic demographic change could have helped
Donald Trump win the 2016 presidential election. The Republican Party in general, and Trump
in particular, have drawn on an immigrant threat narrative in an attempt to take advantage of
anxieties around demographic change. In various contexts, there is evidence that such rapid
demographic change has led to an increase in voting for conservatives and the far right
(Arzheimer 2009; Becker and Fetzer 2017; Swank and Betz 2003; Thompson 2017; Enos 2017).
25
In the U.S., rapid demographic change has been tied to an increase in anti-immigrant attitudes
(Hopkins 2010; Newman 2013) and a mobilization of support for Trump (Newman, Shah, and
Collingwood 2018), particularly under certain conditions described above. Concerns about
immigration have demonstrated importance in predicting support for Trump as well (Major,
Blodorn, and Major Blascovich 2018; Mutz 2018; Sides 2017; Sides, Tesler, and Vavreck 2018).
In testing the related hypotheses of this study, I find no effect for rapid growth of the
foreign-born or Asian population in the analyses accounting for selection into treatment, using
both the percentage growth and percentage point growth methods. However, in analyzing survey
data from the 2016 election, I find robust evidence that those living in counties with a large
percentage point growth in Hispanic population since 2000 were more likely to vote for Trump
in 2016, both in the general election and primaries (including caucuses). This is especially
notable given that I control for voting patterns in the 2012 election. This provides evidence that
Hispanic growth triggered backlash that pushed voters toward Trump. Given the results from the
primaries, Hispanic population growth seems to have pushed voters toward Trump even relative
to other Republicans, perhaps reflecting Trump’s unique extremism on the issue of immigration.
I also find that the general election effect appears among non-Hispanic whites and Asians,
though not non-Hispanic Blacks. The effect for Asians is particularly large. For non-Hispanic
whites, the effects are particularly concentrated among those with lower education or higher
income. Though these results appear to be contradictory, the literature on the determinants of
immigration attitudes provides space for this, as those with lower education may be threatened
culturally and those with higher incomes may be threatened by the alleged negative fiscal impact
of immigrant-origin groups who tend to come from lower socioeconomic backgrounds, such as
many Hispanics. Lastly, I find large effects among non-Hispanic Whites who live in places that

26
might be viewed as “new destinations” for Hispanics, counties in the bottom half of percent
Hispanic in 2000. This echoes work from Newman (2013), providing evidence that anti-Hispanic
backlash may be particularly strong in places that had not previously experienced the diversity
brought by inflows of Hispanics. This is an important finding in the literature on
immigrant/Latinx backlash and electoral outcomes.
However, in rigorously testing the above hypotheses on county-level election results, I
find little evidence that rapid changes in the share of immigrant, Hispanic, or Asian populations
have had a meaningful impact on recent presidential elections. I first test this hypothesis on the
full sample of counties for the 2016 election, and find a positive effect for high Hispanic growth
on Trump voting. However, looking at the crucial subsample of the swing states, I find no
statistically significant effect of Hispanic population growth. Excluding low CVAP swing state
counties in the CCES, I find similar results on average and for non-Hispanic whites. Therefore, it
is not clear that Hispanic growth actually had an impact on the 2016 election, including the
primaries, where I also find no statistically significant effects. I also examine the 2012 election
while controlling for results in the 2000 election to determine if the Republicans may have
captured backlash effects prior to the rise of Trump. I find that this is not the case in the full
sample of counties and that, if anything, swing state counties with high Hispanic growth from
2000 to 2006-2010 were less likely to vote for Romney. A growing Hispanic population
translating into more Democratic voters may be at play in these analyses.
Ultimately, the results do provide evidence for the impact of Hispanic growth on voting
outcomes, both in the full samples and in particular subsamples. The lack of statistically
significant results for foreign-born and Asian growth provides further evidence for the centrality
of Hispanics in today’s backlash against immigrants. However, that this ultimately had an impact
27
on the 2016 election is difficult to argue, and it is also unlikely that, on balance, Republicans
captured this effect previously. This should provide caution for those claiming that immigration
“won” Trump the election. Moreover, it is clear that Trump’s xenophobic appeals were effective,
or at least not disqualifying, in many places not experiencing this type of rapid demographic
change. That said, as demographic changes continue to occur across the country, particularly in
places that may have had little history of immigration, it will be worthwhile to continue to
consider the effects of these changes on politics at both the local and national levels.
8. Endnotes
1The authors do not examine the relationship between foreign-born population growth and
switching to Trump for varying definitions of “working class” Whites, but do for Latinx
population growth and find differing results.
2 It should be noted that the studies mentioned here have operationalized inflows of immigration
in a variety of different ways. It should also be noted that some of these articles are working
papers.
9. References
Abascal, Maria. 2015. “Us and Them: Black-White Relations in the Wake of Hispanic
Population Growth.” American Sociological Review 80 (4): 789–813.
Abrajano, Marisa, and Zoltan Hajnal. 2015. White Backlash: Immigration, Race, and American
Politics. Princeton: Princeton University Press.
Adamy, Janet, and Paul Overberg. 2016. “Places Most Unsettled by Rapid Demographic Change
Are Drawn to Donald Trump.” The Wall Street Journal. November 1, 2016.
https://www.wsj.com/articles/places-most-unsettled-by-rapid-demographic-change-go-
for-donald-trump-1478010940.
Allport, Gordon Willard. 1954. The Nature of Prejudice. Boston: Addison-Wesley Pub. Co.
Ansolabehere, Stephen, and Brian Schaffner. 2017. “Cooperative Congressional Election Study
Common Content, 2016.” 2017.
https://dataverse.harvard.edu/dataset.xhtml?persistentId=doi%3A10.7910/DVN/GDF6Z0
.
Arzheimer, Kai. 2009. “Contextual Factors and the Extreme Right Vote in Western Europe,
1980–2002.” American Journal of Political Science 53 (2): 259–275.

28
Arzheimer, Kai, and Elisabeth Carter. 2006. “Political Opportunity Structures and Right-Wing
Extremist Party Success.” European Journal of Political Research 45 (3): 419–443.
Becker, Sascha O., and Thiemo Fetzer. 2017. “Does Migration Cause Extreme Voting?”
Working Paper. Rome, Italy: Centre for Economic and International Studies.
http://www.ceistorvergata.it/public/CEIS/file/seminari/2017/Becker(1).pdf.
Blalock, H.M. 1967. Toward a Theory of Minority-Group Relations. New York: Wiley.
Borjas, George J. 2014. Immigration Economics. Cambridge: Harvard University Press.
Chandler, Charles R., and Yung-mei Tsai. 2001. “Social Factors Influencing Immigration
Attitudes: An Analysis of Data from the General Social Survey.” The Social Science
Journal 38 (2): 177–188.
Chavez, Leo R. 2001. Covering Immigration: Popular Images and the Politics of the Nation.
Berkeley: University of California Press.
———. 2008. The Latino Threat: Constructing Immigrants, Citizens, and the Nation. Palo Alto:
Stanford University Press.
Citrin, Jack, Donald P. Green, Christopher Muste, and Cara Wong. 1997. “Public Opinion
Toward Immigration Reform: The Role of Economic Motivations.” The Journal of
Politics 59 (3): 858–881.
Citrin, Jack, and John Sides. 2008. “Immigration and the Imagined Community in Europe and
the United States.” Political Studies 56 (1): 33–56.
Reny, Tyler T., Loren Collingwood, and Ali Valenzuela. 2017. “Flipping for Trump:
Immigration, Not Economics, Explains Shifts in White Working Class Votes.”
Unpublished Paper.
https://www.collingwoodresearch.com/uploads/8/3/6/0/8360930/flipping-trump-
immigration.pdf.
Craig, Maureen A., and Jennifer A. Richeson. 2018. “Hispanic Population Growth Engenders
Conservative Shift Among Non-Hispanic Racial Minorities.” Social Psychological and
Personality Science 9 (4): 383–392.
Diamond, Jeremy. 2015. “Donald Trump: Ban All Muslim Travel to U.S.” CNN. December 8,
2015. https://www.cnn.com/2015/12/07/politics/donald-trump-muslim-ban-
immigration/index.html.
Dixon, Jeffrey C., and Michael S. Rosenbaum. 2004. “Nice to Know You? Testing Contact,
Cultural, and Group Threat Theories of Anti-Black and Anti-Hispanic Stereotypes.”
Social Science Quarterly 85 (2): 257–280.
Dustmann, Christian, Kristine Vasilieva, and Anna Piil. 2016. “Refugee Migration and Electoral
Outcomes.” Study Paper. London: Centre for Research and Analysis of Migration.
http://www.cream-migration.org/publ_uploads/CDP_19_16.pdf.
Edo, Anthony, Yvonne Giesing, Jonathan Öztunc, and Panu Poutvaara. 2018. “Immigration and
Electoral Support for the Far Left and the Far Right.” Working Paper. Munich: Ifo
Institute for Economic Research.
https://www.econstor.eu/bitstream/10419/176937/1/cesifo1_wp6918.pdf.
Edsall, Thomas B. 2017. “How Immigration Foiled Hillary.” The New York Times. October 5,
2017. https://www.nytimes.com/2017/10/05/opinion/clinton-trump-immigration.html.
Enos, Ryan D. 2017. The Space Between Us: Social Geography and Politics. Cambridge:
Cambridge University Press.

29
Facchini, Giovanni, and Anna Maria Mayda. 2009. “Does the Welfare State Affect Individual
Attitudes Toward Immigrants? Evidence Across Countries.” The Review of Economics
and Statistics 91 (2): 295–314.
Florida, Richard. 2015. “America’s Leading Immigrant Cities.” September 22, 2015.
https://www.citylab.com/equity/2015/09/americas-leading-immigrant-cities/406438/.
Flowers, Andrew. 2016. “Where Trump Got His Edge.” FiveThirtyEight. November 11, 2016.
https://fivethirtyeight.com/features/where-trump-got-his-edge/.
Fox, Cybelle. 2004. “The Changing Color of Welfare? How Whites’ Attitudes Toward Latinos
Influence Support for Welfare.” American Journal of Sociology 110 (3): 580–625.
Gould, Ingrid Ellen. 2000. Sharing America’s Neighborhoods: The Prospects for Stable Racial
Integration. Cambridge: Harvard University Press.
Hainmueller, Jens, and Michael J. Hiscox. 2010. “Attitudes Toward Highly Skilled and Low-
Skilled Immigration: Evidence from a Survey Experiment.” American Political Science
Review 104 (01): 61–84.
Hainmueller, Jens, Michael J. Hiscox, and Yotam Margalit. 2015. “Do Concerns About Labor
Market Competition Shape Attitudes Toward Immigration? New Evidence.” Journal of
International Economics 97 (1): 193–207.
Hainmueller, Jens, and Daniel J. Hopkins. 2014. “Public Attitudes Toward Immigration.” Annual
Review of Political Science 17: 225–49.
Hanson, Gordon H., Kenneth Scheve, and Matthew J. Slaughter. 2007. “Public Finance and
Individual Preferences Over Globalization Strategies.” Economics & Politics 19 (1): 1–
33.
Harwood, Edwin. 1986. “American Public Opinion and US Immigration Policy.” The Annals of
the American Academy of Political and Social Science 487 (1): 201–212.
Helson, Harry. 1964. Adaptation-Level Theory. New York: Harper.
Holbrook, Thomas M., and Shin Young Park. 2018. “The Immigrant Voter.” Conference Paper.
Chicago: Midwest Political Science Association.
Hopkins, Daniel J. 2009. “The Diversity Discount: When Increasing Ethnic and Racial Diversity
Prevents Tax Increases.” The Journal of Politics 71 (1): 160–177.
———. 2010. “Politicized Places: Explaining Where and When Immigrants Provoke Local
Opposition.” American Political Science Review 104 (01): 40–60.
Huber, Chuck, and David Drukker. 2015. “Introduction to Treatment Effects in Stata: Part 1.”
The Stata Blog (blog). July 7, 2015. https://blog.stata.com/2015/07/07/introduction-to-
treatment-effects-in-stata-part-1/.
Imbert, Fred. 2015. “Donald Trump: Mexico Going to Pay for Wall.” CNBC. October 28, 2015.
https://www.cnbc.com/2015/10/28/donald-trump-mexico-going-to-pay-for-wall.html.
Kahneman, Daniel, and Amos Tversky. 1979. “Prospect Theory: An Analysis of Decisions
Under Risk.” Econometrica 47 (2): 263–92.
Key, Valdimer Orlando. 1949. Southern Politics in State and Nation. New York: Knopf.
Knowles, Eric D., and Linda R. Tropp. 2018. “The Racial and Economic Context of Trump
Support: Evidence for Threat, Identity, and Contact Effects in the 2016 Presidential
Election.” Social Psychological and Personality Science 9 (3): 275–84.
Krogstad, Jens Manuel, and Mark Hugo Lopez. 2016. “Hillary Clinton Won Latino Vote but Fell
Below 2012 Support for Obama.” Pew Research Center. November 29, 2016.
http://www.pewresearch.org/fact-tank/2016/11/29/hillary-clinton-wins-latino-vote-but-
falls-below-2012-support-for-obama/.
30
Kruse, Michael, and Taylor Gee. 2016. “The 37 Fatal Gaffes That Didn’t Kill Donald Trump.”
Politico. September 25, 2016. https://www.politico.com/magazine/story/2016/09/trump-
biggest-fatal-gaffes-mistakes-offensive-214289.
Lapinski, John S., Pia Peltola, Greg Shaw, and Alan Yang. 1997. “Trends: Immigrants and
Immigration.” The Public Opinion Quarterly 61 (2): 356–383.
Lee, Erika. 2002. “The Chinese Exclusion Example: Race, Immigration, and American
Gatekeeping, 1882-1924.” Journal of American Ethnic History 21 (3): 36–62.
Leip, David. 2019. “Dave Leip’s Atlas of U.S. Presidential Elections.” 2019.
http://uselectionatlas.org.
Levine, Bruce. 2001. “Conservatism, Nativism, and Slavery: Thomas R. Whitney and the
Origins of the Know-Nothing Party.” The Journal of American History 88 (2): 455–488.
Major, Brenda, Alison Blodorn, and Gregory Major Blascovich. 2018. “The Threat of Increasing
Diversity: Why Many White Americans Support Trump in the 2016 Presidential
Election.” Group Processes & Intergroup Relations 21 (6): 931–40.
Marquez, Timothy, and Scot Schraufnagel. 2013. “Hispanic Population Growth and State
Immigration Policy: An Analysis of Restriction (2008–12).” Publius: The Journal of
Federalism 43 (3): 347–367.
Massey, Douglas S. 2008. New Faces in New Places: The Changing Geography of American
Immigration. New York: Russell Sage Foundation.
Massey, Douglas S., and Karen A. Pren. 2012. “Unintended Consequences of U.S. Immigration
Policy: Explaining the Post-1965 Surge from Latin America.” Population and
Development Review 38 (1): 1–29.
Mayda, Anna Maria. 2006. “Who Is Against Immigration? A Cross-Country Investigation of
Individual Attitudes Toward Immigrants.” The Review of Economics and Statistics 88
(3): 510–530.
Mendez, Ildefonso, and Isabel M. Cutillas. 2014. “Has Immigration Affected Spanish
Presidential Elections Results?” Journal of Population Economics 27 (1): 135–171.
Mutz, Diana C. 2018. “Status Threat, Not Economic Hardship, Explains the 2016 Presidential
Vote.” Proceedings of the National Academy of Sciences.
http://www.pnas.org/content/pnas/early/2018/04/18/1718155115.full.pdf.
Newman, Benjamin J. 2013. “Acculturating Contexts and Anglo Opposition to Immigration in
the United States.” American Journal of Political Science 57 (2): 374–390.
Newman, Benjamin J., Christopher D. Johnston, April A. Strickland, and Jack Citrin. 2012.
“Immigration Crackdown in the American Workplace: Explaining Variation in E-Verify
Policy Adoption Across the U.S. States.” State Politics & Policy Quarterly 12 (2): 160–
182.
Newman, Benjamin J., Sono Shah, and Loren Collingwood. 2018. “Race, Place, and Building a
Base: Latino Population Growth and the Nascent Trump Campaign for President.” Public
Opinion Quarterly 82 (1): 122–34.
Newman, Benjamin J., and Yamil Velez. 2014. “Group Size Versus Change? Assessing
Americans’ Perception of Local Immigration.” Political Research Quarterly 67 (2): 293–
303.
Ngai, Mae M. 1999. “The Architecture of Race in American Immigration Law: A Reexamination
of the Immigration Act of 1924.” The Journal of American History 86 (1): 67–92.
Palmer, Douglas L. 1996. “Determinants of Canadian Attitudes Toward Immigration: More Than
Just Racism?” Canadian Journal of Behavioural Science 28 (3): 180.
31
Pew Research Center. 2012. “The Rise of Asian Americans.” Pew Research Center. June 19,
2012. http://www.pewsocialtrends.org/2012/06/19/the-rise-of-asian-americans/.
Rothwell, Jonathan. 2016. “Explaining Nationalist Political Views: The Case of Donald Trump.”
Draft Working Paper. Gallup. August 1, 2016. http://polpsyca.netfirms.com/wp-
content/uploads/2016/10/Rothwell_Trump.pdf.
Rothwell, Jonathan, and Pablo Diego-Rosell. 2016. “Explaining Nationalist Political Views: The
Case of Donald Trump.” Draft Working Paper. Gallup. November 2, 2016.
https://poseidon01.ssrn.com/delivery.php?ID=2601161230820750920721170681130740
890140100170320550050180700030970300661010080951241030170540130440150411
220840690290691000850110740410110580800001220721150070110670340600711101
141260310660940080921221190001201240640920640870310050250051190021251271
27&EXT=pdf.
Scala, Dante J., and Kenneth M. Johnson. 2017. “Political Polarization along the Rural-Urban
Continuum? The Geography of the Presidential Vote, 2000–2016.” The Annals of the
American Academy of Political and Social Science 672 (1): 162–184.
Sides, John. 2017. “Race, Religion, and Immigration in 2016: How the Debate over American
Identity Shaped the Election and What It Means for a Trump Presidency.” Washington,
D.C.: Democracy Fund Voter Study Group.
Sides, John, and Jack Citrin. 2007. “European Opinion About Immigration: The Role of
Identities, Interests and Information.” British Journal of Political Science 37 (3): 477–
504.
Sides, John, Michael Tesler, and Lynn Vavreck. 2018. Identity Crisis: The 2016 Presidential
Campaign and the Battle for the Meaning of America. Princeton: Princeton University
Press.
Sniderman, Paul M., Louk Hagendoorn, and Markus Prior. 2004. “Predisposing Factors and
Situational Triggers: Exclusionary Reactions to Immigrant Minorities.” American
Political Science Review 98 (1): 35–49.
StataCorp. 2013a. “Stata 13 Base Reference Manual.” 2013.
https://www.stata.com/manuals13/teteffectsoverlap.pdf.
———. 2013b. “Stata Treatment-Effects Reference Manual: Potential Outcomes/Counterfactual
Outcomes.” 2013. https://www.stata.com/manuals13/te.pdf.
Swank, Duane, and Hans-Georg Betz. 2003. “Globalization, the Welfare State and Right-Wing
Populism in Western Europe.” Socio-Economic Review 1 (2): 215–245.
Taylor, Marylee C. 1998. “How White Attitudes Vary with the Racial Composition of Local
Populations: Numbers Count.” American Sociological Review, 512–535.
The National Academies Press. 2017. “The Economic and Fiscal Consequences of Immigration.”
Washington, DC: The National Academies Press.
Thompson, Daniel. 2017. “Does Immigration Cause Electoral Backlash? Evidence from the
Mariel Boatlift.” Working Paper. Palo Alto: Stanford University.
http://danmthompson.com/papers/Thompson_Boatlift.pdf.
Tingley, Dustin. 2013. “Public Finance and Immigration Preferences: A Lost Connection?”
Polity 45 (1): 4–33.
Tolbert, Caroline J., and John A. Grummel. 2003. “Revisiting the Racial Threat Hypothesis:
White Voter Support for California’s Proposition 209.” State Politics & Policy Quarterly
3 (2): 183–202.
32
U.S. Census Bureau. 2019a. “American Community Survey 5-Year Estimates 2006-2010.
Prepared by Social Explorer.” 2019. https://www.socialexplorer.com.
———. 2019b. “American Community Survey 5-Year Estimates 2010-2014. Prepared by Social
Explorer.” 2019. https://www.socialexplorer.com.
———. 2019c. “Citizen Voting Age Population Special Tabulation (American Community
Survey 5-Year Estimates 2012-2016). Prepared by Social Explorer.” 2019.
https://www.socialexplorer.com.
———. 2019d. “U.S. Decennial Census 2000. Prepared by Social Explorer.” 2019.
https://www.socialexplorer.com.
Wilkes, Rima, Neil Guppy, and Lily Farris. 2008. “‘No Thanks, We’re Full’: Individual
Characteristics, National Context, and Changing Attitudes Toward Immigration.”
International Migration Review 42 (2): 302–329.
Wintour, Patrick. 2018. “Hillary Clinton: Europe Must Curb Immigration to Stop Rightwing
Populists.” The Guardian. November 22, 2018.
https://www.theguardian.com/world/2018/nov/22/hillary-clinton-europe-must-curb-
immigration-stop-populists-trump-brexit.
Wooldridge, Jeffrey M. 2010. Econometric Analysis of Cross Section and Panel Data. MIT
Press.
Wroe, A. 2008. The Republican Party and Immigration Politics: From Proposition 187 to
George W. Bush. New York: Palgrave Macmillan.
Ye Hee Lee, Michelle. 2015. “Donald Trump’s False Comments Connecting Mexican
Immigrants and Crime.” The Washington Post. July 8, 2015.
https://www.washingtonpost.com/news/fact-checker/wp/2015/07/08/donald-trumps-false-
comments-connecting-mexican-immigrants-and-
crime/?noredirect=on&utm_term=.77fed20c8f3d.
10. Appendix
Table A here
33
Table 1. Descriptive statistics for the CCES sample (county-level)
Percentage growth method Percentage point growth method
Variable
Full
sample
Top quartile foreign-born
growth '00 to '10-14
Top quartile Hispanic
growth '00 to '10-14
Top quartile Asian
growth '00 to '10-14
Top quartile foreign-born
growth '00 to '10-14
Top quartile Hispanic
growth '00 to '10-14
Top quartile Asian growth
'00 to '10-14
Foreign-born pct. growth '00 to '10-14 35.1 82.9 Hispanic pct. growth '00 to '10-14 70.3 137.3 Asian pct. growth '00 to '10-14 55.6 115.7 Foreign-born pct. point growth '00 to '10-14 2.0 4.4 Hispanic pct. point growth '00 to '10-14 3.8 7.6 Asian pct. point growth '00 to '10-14 1.3 3.4
Pct. foreign-born '00 10.2 3.8 3.6 6.0 12.9 15.6 19.3
Pct. Hispanic '00 11.2 3.8 2.4 6.7 10.8 20.2 17.1
Pct. Asian '00 3.3 1.4 1.4 1.6 5.0 3.7 8.0
Pct. bachelor's degree+ (age 25+) '10-14 29.8 27.5 27.4 29.1 35.8 29.1 38.5
Population density (people/sq. mi.) '10-14 2180.7 672.7 687.4 587.1 2099.6 1591.4 5780.2
Median hh income '10-14 $55,918 $54,938 $54,481 $57,642 $66,042 $57,968 $69,072
Respondents 50,989 12,919 12,980 13,108 12,518 12,341 11,832
Sources: Cooperative Congressional Election Study Common Content 2016, Census 2000, American Community Survey 5-Year Estimates 2010-2014
34
Table 2. Logistic regressions predicting Trump voting with demographic change variables and controls (individual-level,
2016 general election)
Variables Percentage growth method Percentage point growth method
Top quartile foreign-born growth '00 to '10-14 (county-level) -0.053 -0.11*
(0.054) (0.054) Top quartile Hispanic growth '00 to '10-14 (county-level) 0.028 0.035
(0.056) (0.054) Top quartile Asian growth '00 to '10-14 (county-level) 0.011 -0.095
(0.049) (0.073)
Vote 2012 (ref. = Obama) Romney 3.74*** 3.74*** 3.73*** 3.74*** 3.74*** 3.74***
(0.047) (0.047) (0.047) (0.047) (0.047) (0.047)
Other 1.15*** 1.15*** 1.15*** 1.15*** 1.15*** 1.15***
(0.056) (0.056) (0.056) (0.056) (0.056) (0.056)
Pct. Romney vote 2012 (county-level) 0.011*** 0.013*** 0.0089*** 0.011*** 0.013*** 0.0090***
(0.0022) (0.0023) (0.0022) (0.0022) (0.0023) (0.0022)
Education (ref. = less than high school) High school graduate 0.37*** 0.37*** 0.38*** 0.37*** 0.37*** 0.38***
(0.11) (0.11) (0.11) (0.11) (0.11) (0.11)
Some college 0.35** 0.35** 0.35** 0.35** 0.35** 0.35**
(0.11) (0.11) (0.11) (0.11) (0.11) (0.11)
2-year degree 0.37** 0.37** 0.37** 0.37** 0.37** 0.37**
(0.12) (0.12) (0.12) (0.12) (0.12) (0.12)
4-year degree -0.065 -0.060 -0.056 -0.064 -0.058 -0.055
(0.11) (0.11) (0.11) (0.11) (0.11) (0.11)
Post-grad degree -0.34** -0.33** -0.33** -0.33** -0.33** -0.33**
(0.12) (0.12) (0.12) (0.12) (0.12) (0.12)
Family income (ref. = less than $10,000) $10,000 - $19,999 -0.021 -0.022 -0.022 -0.025 -0.020 -0.025
(0.13) (0.13) (0.13) (0.13) (0.13) (0.13)
$20,000 - $29,999 0.046 0.044 0.048 0.045 0.044 0.047
(0.13) (0.13) (0.13) (0.13) (0.13) (0.13)
$30,000 - $39,999 0.095 0.097 0.096 0.094 0.098 0.095
(0.12) (0.12) (0.12) (0.12) (0.12) (0.12)
$40,000 - $49,999 0.022 0.024 0.022 0.023 0.025 0.023
(0.13) (0.13) (0.13) (0.13) (0.13) (0.13)
$50,000 - $59,999 0.30* 0.30* 0.29* 0.30* 0.30* 0.30*
(0.13) (0.13) (0.13) (0.13) (0.13) (0.13)
$60,000 - $69,999 0.15 0.15 0.15 0.15 0.15 0.16
(0.14) (0.14) (0.14) (0.14) (0.14) (0.14)
$70,000 - $79,999 0.14 0.14 0.14 0.14 0.14 0.14

35
(0.14) (0.14) (0.14) (0.14) (0.14) (0.14)
$80,000 - $99,999 0.23 0.23 0.23 0.23 0.23 0.23
(0.13) (0.13) (0.13) (0.13) (0.13) (0.13)
$100,000 - $119,999 0.18 0.19 0.18 0.18 0.19 0.18
(0.14) (0.14) (0.14) (0.14) (0.14) (0.14)
$120,000 - $149,999 0.13 0.14 0.14 0.13 0.14 0.14
(0.15) (0.15) (0.15) (0.15) (0.15) (0.15)
$150,000 or greater -0.023 -0.011 -0.0099 -0.016 -0.011 -0.0065
(0.14) (0.14) (0.14) (0.14) (0.14) (0.14)
Prefer not to say 0.19 0.19 0.19 0.19 0.19 0.19
(0.13) (0.13) (0.13) (0.13) (0.13) (0.13)
Employment status (ref. = full-time) Part-time 0.018 0.017 0.017 0.018 0.017 0.017
(0.074) (0.074) (0.074) (0.074) (0.074) (0.074)
Temporarily laid off 0.26 0.26 0.27 0.27 0.26 0.27
(0.28) (0.28) (0.28) (0.28) (0.28) (0.28)
Unemployed -0.21* -0.21* -0.21* -0.21* -0.21* -0.21*
(0.10) (0.10) (0.10) (0.10) (0.10) (0.10)
Retired -0.15** -0.15** -0.15** -0.15** -0.16** -0.15**
(0.058) (0.059) (0.058) (0.058) (0.059) (0.058)
Permanently disabled -0.026 -0.026 -0.030 -0.023 -0.026 -0.030
(0.095) (0.095) (0.095) (0.095) (0.095) (0.095)
Homemaker -0.23** -0.23** -0.23** -0.23** -0.23** -0.23**
(0.076) (0.076) (0.076) (0.076) (0.076) (0.075)
Student -0.21 -0.21 -0.21 -0.21 -0.21 -0.21
(0.13) (0.13) (0.13) (0.13) (0.13) (0.13)
Other -0.24 -0.25 -0.25 -0.25 -0.25 -0.25
(0.14) (0.14) (0.14) (0.14) (0.14) (0.14)
Race/ethnicity (ref. = White) Black -1.52*** -1.52*** -1.53*** -1.52*** -1.52*** -1.53***
(0.12) (0.12) (0.12) (0.12) (0.12) (0.12)
Hispanic -0.45** -0.48** -0.42* -0.45** -0.48** -0.42*
(0.17) (0.17) (0.17) (0.17) (0.17) (0.17)
Asian -0.63*** -0.62*** -0.60*** -0.63*** -0.62*** -0.60***
(0.15) (0.15) (0.15) (0.15) (0.15) (0.15)
Native American 0.047 0.042 0.038 0.043 0.044 0.039
(0.24) (0.24) (0.24) (0.24) (0.24) (0.24)
Mixed -0.54*** -0.54*** -0.53*** -0.54*** -0.54*** -0.53***
(0.13) (0.13) (0.13) (0.13) (0.13) (0.13)
Other 0.19 0.20 0.20 0.20 0.20 0.20
(0.17) (0.17) (0.17) (0.17) (0.17) (0.17)
Middle Eastern -0.97** -0.95** -0.95** -0.97** -0.96** -0.94**
(0.33) (0.32) (0.32) (0.33) (0.32) (0.32)

36
Hispanic identification (ref. = Hispanic) Non-Hispanic 0.37* 0.40** 0.37* 0.37* 0.40** 0.37*
(0.15) (0.15) (0.15) (0.15) (0.15) (0.15)
Immigrant generation (ref. = foreign-born citizen) Second generation (at least 1 foreign-born parent) -0.13 -0.13 -0.14 -0.12 -0.13 -0.15
(0.11) (0.11) (0.11) (0.11) (0.11) (0.11)
Third generation (at least 1 foreign-born grandparent) -0.12 -0.12 -0.15 -0.12 -0.12 -0.15
(0.099) (0.099) (0.098) (0.099) (0.099) (0.098)
Fourth generation+ -0.19* -0.19* -0.22* -0.19* -0.19* -0.22*
(0.096) (0.096) (0.095) (0.096) (0.096) (0.095)
Female -0.27*** -0.27*** -0.27*** -0.27*** -0.27*** -0.27***
(0.041) (0.041) (0.041) (0.041) (0.041) (0.041)
Birth year -0.011*** -0.011*** -0.011*** -0.011*** -0.011*** -0.011***
(0.0021) (0.0021) (0.0021) (0.0021) (0.0021) (0.0021)
Union membership (ref. = never) Current 0.077 0.078 0.082 0.078 0.078 0.081
(0.082) (0.082) (0.081) (0.082) (0.082) (0.081)
Former 0.045 0.048 0.042 0.047 0.048 0.043
(0.052) (0.052) (0.052) (0.052) (0.052) (0.052)
Child under age 18 0.15** 0.15** 0.15** 0.15** 0.15** 0.15**
(0.054) (0.054) (0.054) (0.054) (0.055) (0.054)
Marital status (ref. = married) Separated -0.16 -0.16 -0.16 -0.16 -0.16 -0.15
(0.13) (0.13) (0.13) (0.13) (0.13) (0.13)
Divorced -0.16** -0.16** -0.16** -0.17** -0.16** -0.16**
(0.060) (0.060) (0.060) (0.060) (0.060) (0.060)
Widowed -0.060 -0.058 -0.059 -0.060 -0.057 -0.057
(0.084) (0.084) (0.084) (0.084) (0.084) (0.084)
Single -0.30*** -0.30*** -0.30*** -0.30*** -0.30*** -0.30***
(0.063) (0.063) (0.063) (0.063) (0.063) (0.063)
Domestic partnership -0.24* -0.24* -0.24* -0.23* -0.24* -0.24*
(0.11) (0.11) (0.11) (0.11) (0.11) (0.11)
Population density at county-level (ref. = least dense quartile) 25-50% -0.035 -0.019 -0.039 -0.040 -0.018 -0.039
(0.063) (0.063) (0.063) (0.063) (0.063) (0.063)
50-75% -0.12 -0.094 -0.087 -0.11 -0.095 -0.077
(0.076) (0.076) (0.077) (0.076) (0.076) (0.077)
Most dense quartile -0.087 -0.0055 0.048 -0.071 -0.0046 0.050
(0.094) (0.090) (0.095) (0.095) (0.090) (0.095)
Pct. in labor force '10-14 (age 16+, county-level) -0.015** -0.013** -0.011* -0.014** -0.013** -0.011*
(0.0049) (0.0048) (0.0049) (0.0049) (0.0048) (0.0048)
Time at current residence (ref. = less than 1 year) 1-2 years 0.16 0.16 0.16 0.16 0.16 0.16

37
(0.090) (0.090) (0.090) (0.090) (0.090) (0.090)
3-4 years 0.22* 0.23* 0.22* 0.22* 0.22* 0.22*
(0.088) (0.088) (0.088) (0.088) (0.088) (0.088)
5 or more years 0.31*** 0.32*** 0.32*** 0.31*** 0.32*** 0.32***
(0.076) (0.076) (0.076) (0.076) (0.076) (0.076)
U.S.-born population change '00 to '10-14 0.0013 0.0017
(0.0017) (0.0017) Non-Hispanic population change '00 to '10-14 -0.00016 -0.000047
(0.0017) (0.0017) Non-Asian population change '00 to '10-14 0.00093 0.0015
(0.0017) (0.0017)
Pct. foreign-born '00 0.010** 0.010**
(0.0036) (0.0036) Pct. Hispanic '00 0.011*** 0.011***
(0.0025) (0.0025) Pct. Asian '00 -0.017* -0.011
(0.0083) (0.0092)
Constant 20.2*** 20.1*** 20.0*** 20.2*** 20.1*** 19.9***
(4.18) (4.19) (4.19) (4.19) (4.19) (4.19)
Observations 50,986 50,989 50,981 50,989 50,989 50,989
Robust standard errors in parentheses *** p<0.001, ** p<0.01, * p<0.05
Sources: Cooperative Congressional Election Study Common Content 2016, Election Atlas, Census 2000, American Community Survey 5-Year
Estimates 2010-2014
Note: Controls for state of residence not displayed

38
Table 3. AIPW and IPWRA models predicting Trump voting with demographic change variables (individual-level, 2016
general election)
AIPW
Percentage growth method Percentage point growth method
Top quartile foreign-born growth '00 to '10-14 Coefficient -0.006 -0.026
Robust standard error 0.055 0.084
Top quartile Hispanic growth '00 to '10-14 Coefficient -0.092 0.048***
Robust standard error 0.047 0.009
Top quartile Asian growth '00 to '10-14 Coefficient -0.006 0.114
Robust standard error 0.008 0.075
IPWRA
Percentage growth method Percentage point growth method
Top quartile foreign-born growth '00 to '10-14 Coefficient -0.016 -0.002
Robust standard error 0.015 0.007
Top quartile Hispanic growth '00 to '10-14 Coefficient -0.01 0.031***
Robust standard error 0.01 0.008
Top quartile Asian growth '00 to '10-14 Coefficient -0.004 0.013
Robust standard error 0.007 0.013
*** p<0.001, ** p<0.01, * p<0.05
Sources: Cooperative Congressional Election Study Common Content 2016, Election Atlas, Census 2000, American Community Survey 5-Year
Estimates 2010-2014

39
Table 4. AIPW and IPWRA models predicting Trump voting with high Hispanic percentage point growth (individual-level, 2016 general and primary elections)
AIPW
General election
Republican
primary
Obama 2012 voters
Romney 2012
voters Other 2012 voters
Non-Hispanic
White
Non-Hispanic
Black Asian All
Top quartile Hispanic growth '00 to '10-14 Coefficient 0.019 0.027** 0.007 0.044** 0.08 0.112** 0.033*
Robust standard error 0.012 0.009 0.016 0.015 0.119 0.038 0.015
IPWRA
General election
Republican
primary
Obama 2012 voters
Romney 2012
voters Other 2012 voters
Non-Hispanic
White
Non-Hispanic
Black Asian All
Top quartile Hispanic growth '00 to '10-14 Coefficient 0.048*** 0.022** -0.012 0.043*** -0.047*** 0.097** 0.03*
Robust standard error 0.009 0.008 0.015 0.01 0.008 0.032 0.014
*** p<0.001, ** p<0.01, * p<0.05
Sources: Cooperative Congressional Election Study Common Content 2016, Election Atlas, Census 2000, American Community Survey 5-Year Estimates 2010-2014
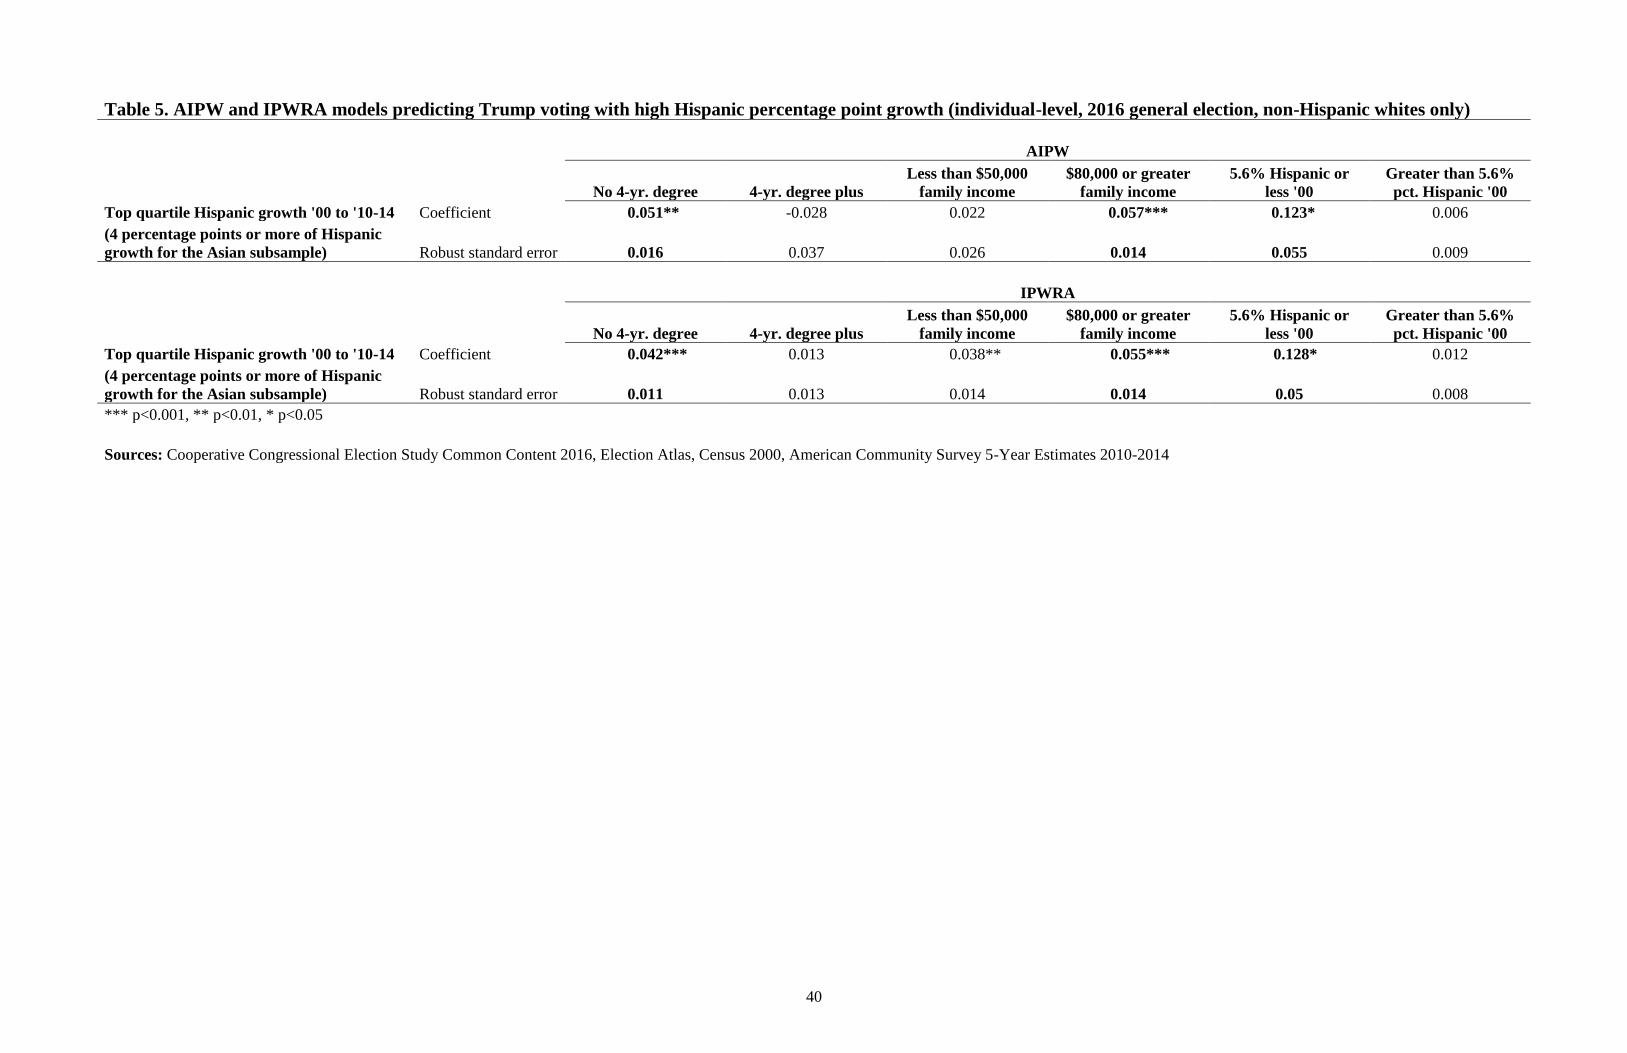
40
Table 5. AIPW and IPWRA models predicting Trump voting with high Hispanic percentage point growth (individual-level, 2016 general election, non-Hispanic whites only)
AIPW
No 4-yr. degree 4-yr. degree plus
Less than $50,000
family income
$80,000 or greater
family income
5.6% Hispanic or
less '00
Greater than 5.6%
pct. Hispanic '00
Top quartile Hispanic growth '00 to '10-14 Coefficient 0.051** -0.028 0.022 0.057*** 0.123* 0.006
(4 percentage points or more of Hispanic
growth for the Asian subsample) Robust standard error 0.016 0.037 0.026 0.014 0.055 0.009
IPWRA
No 4-yr. degree 4-yr. degree plus
Less than $50,000
family income
$80,000 or greater
family income
5.6% Hispanic or
less '00
Greater than 5.6%
pct. Hispanic '00
Top quartile Hispanic growth '00 to '10-14 Coefficient 0.042*** 0.013 0.038** 0.055*** 0.128* 0.012
(4 percentage points or more of Hispanic
growth for the Asian subsample) Robust standard error 0.011 0.013 0.014 0.014 0.05 0.008
*** p<0.001, ** p<0.01, * p<0.05
Sources: Cooperative Congressional Election Study Common Content 2016, Election Atlas, Census 2000, American Community Survey 5-Year Estimates 2010-2014
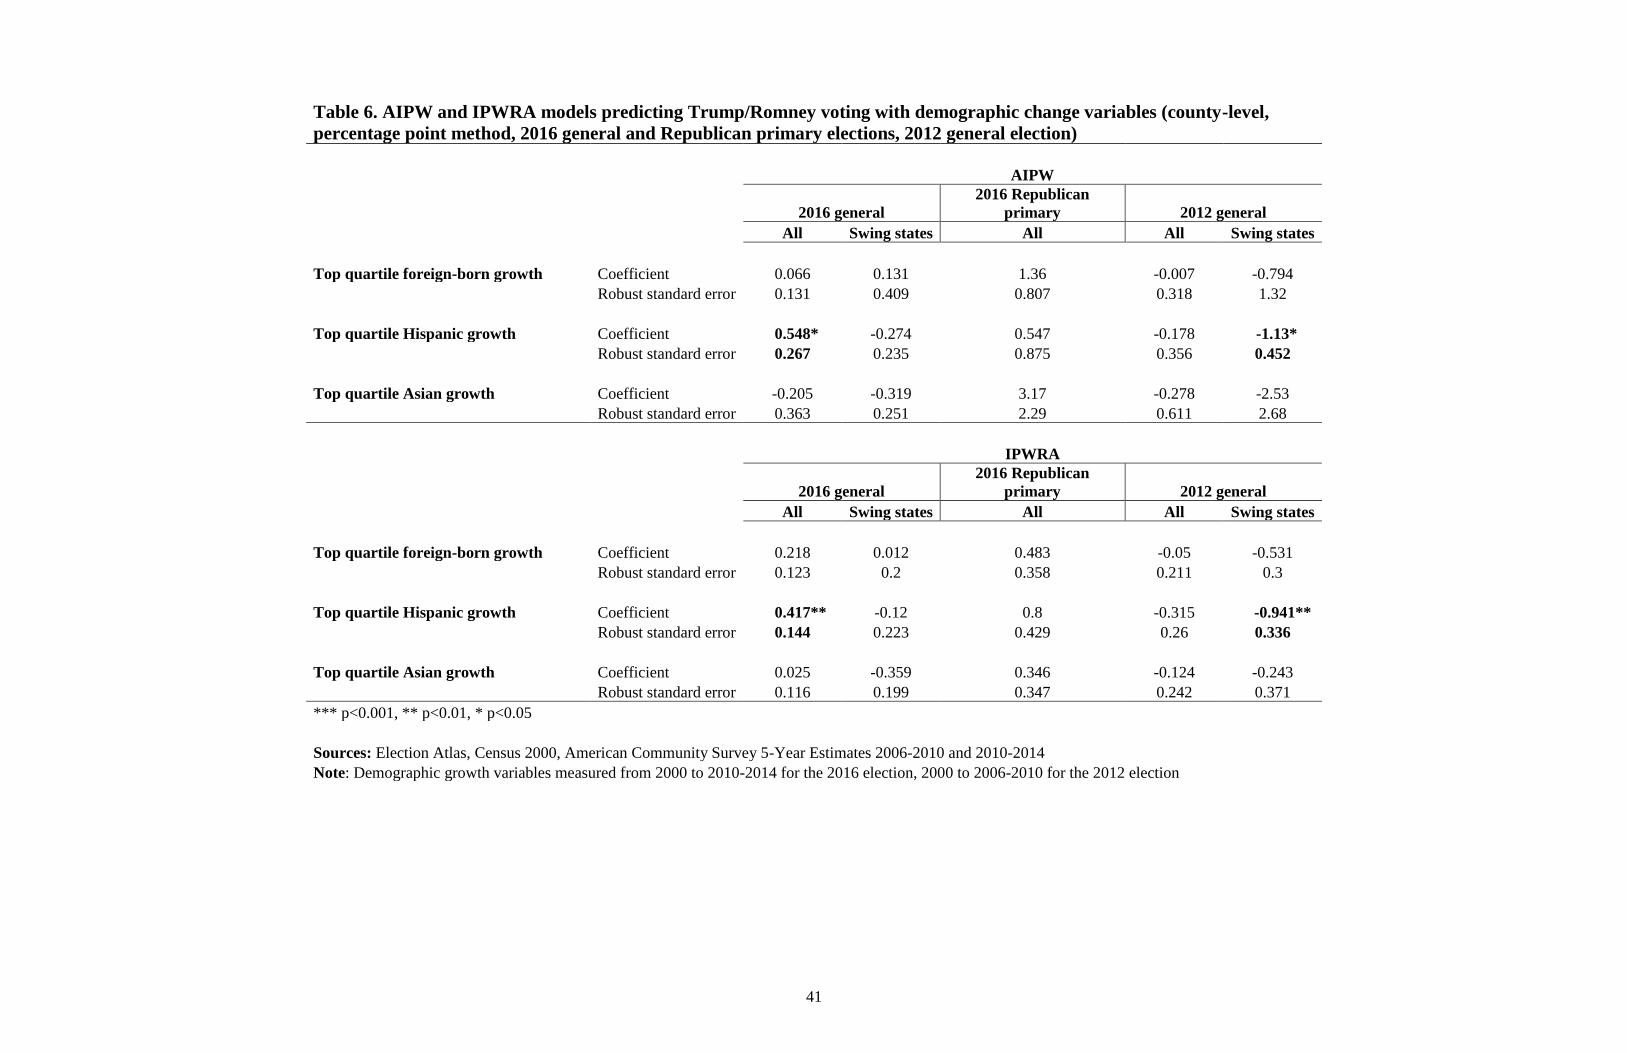
41
Table 6. AIPW and IPWRA models predicting Trump/Romney voting with demographic change variables (county-level,
percentage point method, 2016 general and Republican primary elections, 2012 general election)
AIPW
2016 general
2016 Republican
primary 2012 general
All Swing states All All Swing states
Top quartile foreign-born growth Coefficient 0.066 0.131 1.36 -0.007 -0.794
Robust standard error 0.131 0.409 0.807 0.318 1.32
Top quartile Hispanic growth Coefficient 0.548* -0.274 0.547 -0.178 -1.13*
Robust standard error 0.267 0.235 0.875 0.356 0.452
Top quartile Asian growth Coefficient -0.205 -0.319 3.17 -0.278 -2.53
Robust standard error 0.363 0.251 2.29 0.611 2.68
IPWRA
2016 general
2016 Republican
primary 2012 general
All Swing states All All Swing states
Top quartile foreign-born growth Coefficient 0.218 0.012 0.483 -0.05 -0.531
Robust standard error 0.123 0.2 0.358 0.211 0.3
Top quartile Hispanic growth Coefficient 0.417** -0.12 0.8 -0.315 -0.941**
Robust standard error 0.144 0.223 0.429 0.26 0.336
Top quartile Asian growth Coefficient 0.025 -0.359 0.346 -0.124 -0.243
Robust standard error 0.116 0.199 0.347 0.242 0.371
*** p<0.001, ** p<0.01, * p<0.05
Sources: Election Atlas, Census 2000, American Community Survey 5-Year Estimates 2006-2010 and 2010-2014 Note: Demographic growth variables measured from 2000 to 2010-2014 for the 2016 election, 2000 to 2006-2010 for the 2012 election
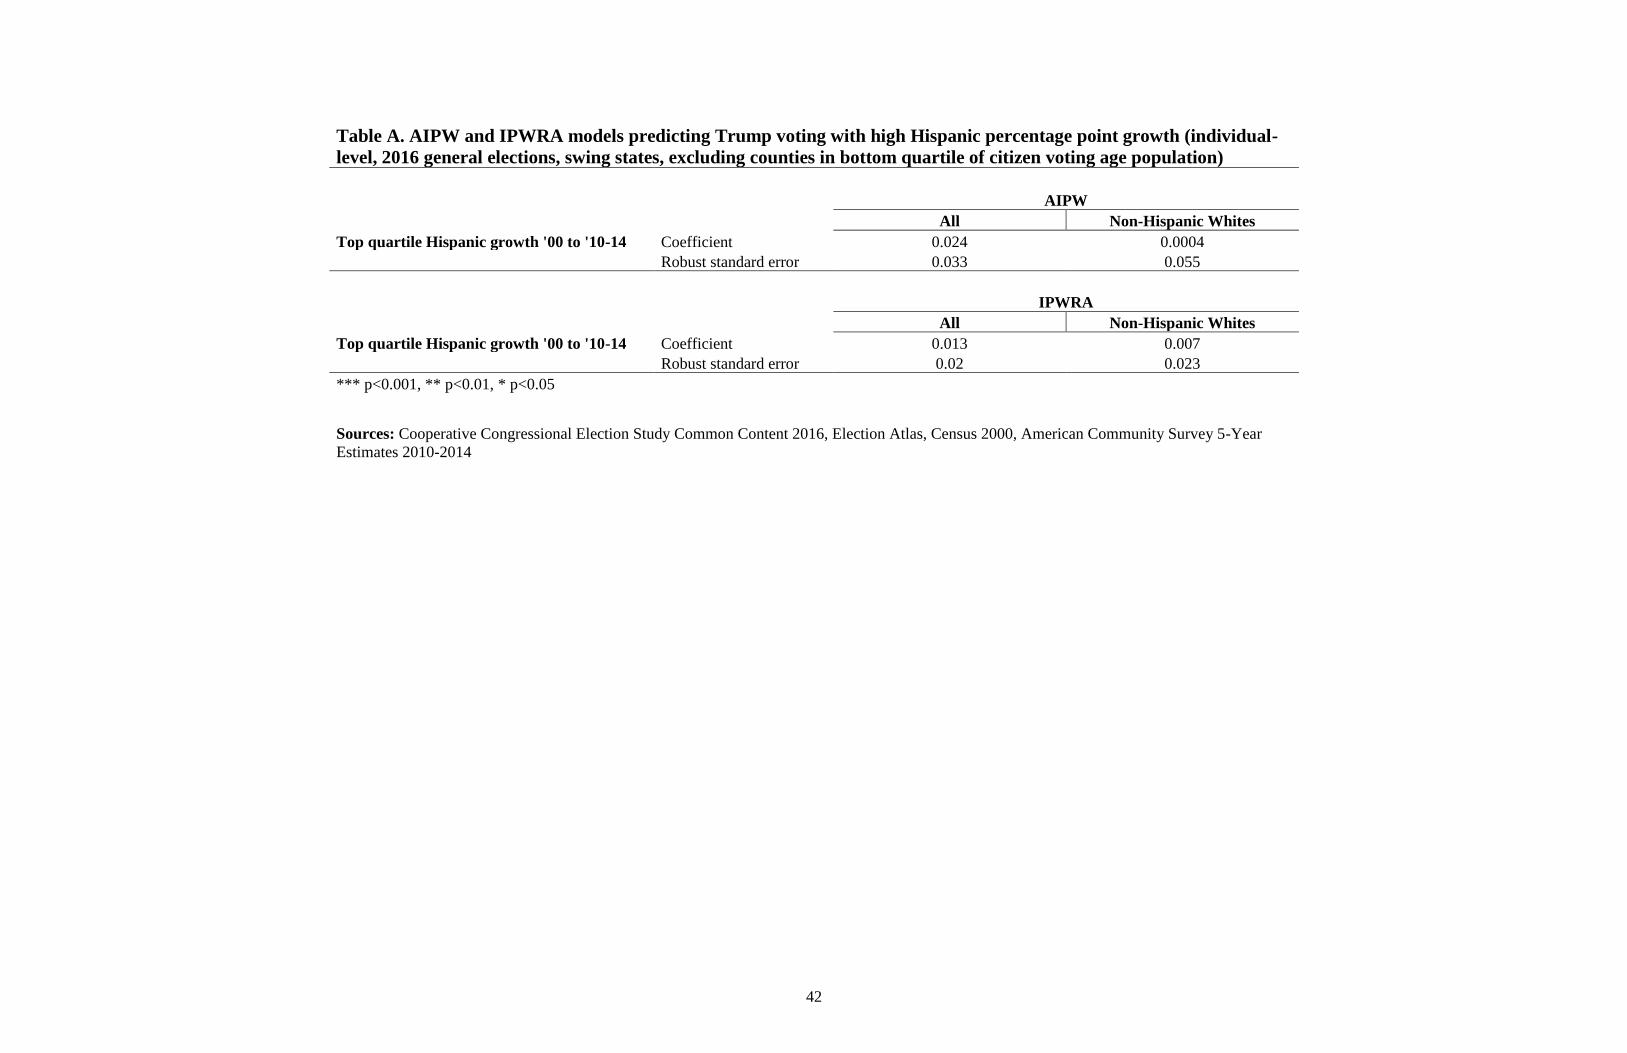
42
Table A. AIPW and IPWRA models predicting Trump voting with high Hispanic percentage point growth (individual-
level, 2016 general elections, swing states, excluding counties in bottom quartile of citizen voting age population)
AIPW
All Non-Hispanic Whites
Top quartile Hispanic growth '00 to '10-14 Coefficient 0.024 0.0004
Robust standard error 0.033 0.055
IPWRA
All Non-Hispanic Whites
Top quartile Hispanic growth '00 to '10-14 Coefficient 0.013 0.007
Robust standard error 0.02 0.023
*** p<0.001, ** p<0.01, * p<0.05
Sources: Cooperative Congressional Election Study Common Content 2016, Election Atlas, Census 2000, American Community Survey 5-Year
Estimates 2010-2014