impacts of exploratory social-emotional impacts of three ... start... · lizabeth and frank newman...
TRANSCRIPT
Exploratory Impacts of Three Social-Emotional Curricula on Three-Year-Olds in the Head Start CARES Demonstration
Executive Summary
OPRE Report 2014-78December 2014
Impacts of Social-Emotional Curricula on Three-Year-OldsExploratory Findings from the Head Start CARES Demonstration

THIS PAGE INTENTIONALLY LEFT BLANK
Impacts of Social-Emotional Curricula on Three-Year-Olds: Exploratory Findings from the Head Start CARES Demonstration
OPRE Report 2014-78 December 2014
Authors: JoAnn Hsueh (MDRC), Amy E. Lowenstein (MDRC), Pamela Morris (New York University/MDRC),
Shira K. Mattera (MDRC), Michael Bangser (MDRC)
Submitted to:
Wendy DeCourcey, Project Officer Christine K. Fortunato, Project Specialist Office of Planning, Research and Evaluation
Administration for Children and Families U.S. Department of Health and Human Services
Project Director: Pamela Morris MDRC
16 East 34th Street New York, NY 10016
Contract Number: HHSP23320072909YC
This report is in the public domain. Permission to reproduce is not necessary.
Suggested citation: Hsueh, JoAnn, Amy E. Lowenstein, Pamela Morris, Shira K. Mattera, and Michael Bangser (2014). Impacts of Social-Emotional Curricula on Three-Year-Olds:
Exploratory Findings from the Head Start CARES Demonstration. OPRE Report 2014-78. Washington, DC: Office of Planning, Research and Evaluation, Administration for Children and
Families, U.S. Department of Health and Human Services.
Disclaimer: The views expressed in this publication do not necessarily reflect the views or policies of the Office of Planning, Research and Evaluation, the Administration for Children and
Families, or the U.S. Department of Health and Human Services.
This report and other reports sponsored by the Office of Planning, Research and Evaluation are available at http://www.acf.hhs.gov/programs/opre.

MDRC is conducting the Head Start CARES project and the dissemination of its findings under a contract with the Office of Planning, Research and Evaluation in the Administration for Children and Families in the U.S. Department of Health and Human Services (HHS), funded by HHS under a competitive award, Contract No. HHSP23320072909YC. The project officer is Wendy DeCourcey. Dissemination of MDRC publications is supported by the following funders that help finance MDRC’s public policy outreach and expanding efforts to communicate the results and implica-tions of our work to policymakers, practitioners, and others: The Annie E. Casey Foundation, The Harry and Jeanette Weinberg Foundation, Inc., The Kresge Foundation, Laura and John Arnold Foundation, Sandler Foundation, and The Starr Foundation. In addition, earnings from the MDRC Endowment help sustain our dissemination efforts. Contributors to the MDRC Endowment include Alcoa Foundation, The Ambrose Monell Foundation, Anheuser-Busch Foundation, Bristol-Myers Squibb Foundation, Charles Stewart Mott Foundation, Ford Foundation, The George Gund Foundation, The Grable Foundation, The Lizabeth and Frank Newman Charitable Foundation, The New York Times Company Founda-tion, Jan Nicholson, Paul H. O’Neill Charitable Foundation, John S. Reed, Sandler Foundation, and The Stupski Family Fund, as well as other individual contributors. The findings and conclusions in this report do not necessarily represent the official positions or policies of HHS or the other funders listed above. For information about MDRC and copies of our publications, see our website: www.mdrc.org.

iii
Overview
Preschool has long been viewed as a way to promote low-income children’s early learning and development. Some promising classroom-based strategies have been found to enhance preschool children’s social, emotional, and behavioral competencies. Most of this research has focused on 4-year-olds, even as a growing number of 3-year-olds attend Head Start and other preschool programs.
This report presents exploratory impact findings for 3-year-olds from the Head Start CARES demonstration, a large-scale randomized controlled trial implemented in Head Start centers for one academic year across the country. The goal was to test the effects of three distinct classroom-based program “enhancements” for improving children’s social-emotional competencies. The Incredible Years Teacher Training Program supports children’s ability to regulate their behavior by helping teachers maintain an organized classroom. Preschool PATHS uses structured lessons to help children learn about emotions and gain social problem-solving skills. Tools of the Mind—Play, a one-year program adapted from the original two-year Tools of the Mind program, promotes chil-dren’s self-regulatory skills through structured make-believe play.
Head Start centers were randomly assigned to receive one of the enhancements or to a control group that did not receive any of them. The study was designed primarily to test the effects of the enhance-ments on 4-year-olds, but it also provides an opportunity to explore their impacts on a limited number of outcomes for 3-year-olds who were in the classrooms that included both 3- and 4-year-olds.
Key Findings The analysis tested whether the social-emotional enhancements as a group improved 3-year-olds’ social and emotional competencies, as well as the impacts of each enhancement separately, based on their distinct theories of change.
• As a group, the enhancements improved teachers’ social-emotional instruction and improved teacher reports of 3-year-olds’ social behaviors and closeness with their teach-ers. However, they had no effect on other aspects of teacher practice, classroom climate, or children’s behavior problems, interpersonal skills, or learning behaviors.
• The positive impacts of the enhancements as a group seem to be driven primarily by The Incredible Years. When considered separately, The Incredible Years improved teacher reports of 3-year-olds’ social behaviors and closeness with their teachers, though it did not produce the expected impacts on teachers’ use of classroom management practices or on classroom climate.
• As a group, the enhancements did not affect 3-year-olds’ pre-academic skills, as reported by teachers. The Incredible Years improved teacher reports of 3-year-olds’ general knowledge, language and literacy, and mathematical thinking skills. However, the findings are uncertain be-cause The Incredible Years also improved 4-year-olds’ pre-academic skills as reported by teach-ers, but not as measured by direct assessments.
These findings suggest that evidence-based approaches can improve 3-year-olds’ social-emotional competence in mixed-age preschool classrooms. While the findings are promising, further research is needed to confirm the results and to better understand how these benefits are generated.

THIS PAGE INTENTIONALLY LEFT BLANK

v
Contents
Overview iii List of Exhibits vii Acknowledgments ix Executive Summary ES-1 Background and Introduction 1
Overview of Head Start CARES 4
How the Head Start CARES Enhancements Might Affect 3-Year-Olds 9
The Current Analysis: An Opportunity to Explore the Impacts of the Head Start CARES Enhancements on 3-Year-Olds 12
Design of Head Start CARES 15
Impacts of the Head Start CARES Enhancements on Class-Level Outcomes in Mixed-Age Classrooms 24
Impacts of the Head Start CARES Enhancements on 3-Year-Old Children’s Social-Emotional and Pre-Academic Outcomes 36
Discussion 47
Appendix A Sample Selection, Recruitment, and Random Assignment in Head Start CARES 51 B Baseline Equivalence of Teachers, Classrooms, and Children Across
Program and Control Groups 57 C Sensitivity Analyses: Child-Level Impacts Controlling for Baseline Differences 71 D Measures Used in Head Start CARES Impact Analysis of 3-Year-Olds 79 E Model Specifications 89 F Attrition and Turnover Analyses 93 G Glossary 101 References 105 Earlier Publications on Head Start CARES 111

THIS PAGE INTENTIONALLY LEFT BLANK

vii
List of Exhibits
Table
ES.1 Summary of Impacts on Outcomes for Mixed-Age Classrooms and 3-Year-Old Children, Enhancements Pooled ES-9
ES.2 Summary of Impacts on Outcomes for Mixed-Age Classrooms and 3-Year-Old Children, by Enhancement ES-11
1 Baseline Classroom and Teacher Characteristics in Mixed-Age Classrooms 17
2 Child Baseline Characteristics and Pre-Test Measures: 3-Year-Olds 21
3 Class-Level Impacts in Mixed-Age Classrooms: Observations of Teacher Practice, Enhancements Pooled 26
4 Class-Level Impacts in Mixed-Age Classrooms: Observations of Classroom Climate, Enhancements Pooled 28
5 Class-Level Impacts in Mixed-Age Classrooms: Observations of Teacher Practice, by Enhancement 30
6 Class-Level Impacts in Mixed-Age Classrooms: Observations of Classroom Climate, by Enhancement 33
7 Child-Level Impacts on 3-Year-Olds: Social-Emotional Outcomes, Enhancements Pooled 38
8 Child-Level Impacts on 3-Year-Olds: Social-Emotional Outcomes, by Enhancement 41
9 Child-Level Impacts on 3-Year-Olds: Pre-Academic Skills, Enhancements Pooled 45
10 Child-Level Impacts on 3-Year-Olds: Pre-Academic Skills, by Enhancement 46
B.1 Baseline Equivalence of Teachers of Mixed-Age Classrooms in Program and Control Groups, Enhancements Pooled 61
B.2 Baseline Equivalence of Teachers of Mixed-Age Classrooms in Program and Control Groups, by Enhancement 62
B.3 Baseline Equivalence of Mixed-Age Classrooms in Program and Control Groups, Enhancements Pooled 64
B.4 Baseline Equivalence of Mixed-Age Classrooms in Program and Control Groups, by Enhancement 65
B.5 Baseline Equivalence of Child Characteristics and Pre-Test Measures for 3-Year-Olds in Program and Control Groups, Enhancements Pooled 66
viii
B.6 Baseline Equivalence of Child Characteristics and Pre-Test Measures for 3-Year-Olds in Program and Control Groups, by Enhancement 68
C.1 Child-Level Impacts on 3-Year-Olds: Social-Emotional Outcomes, Controlling for Child Gender, Enhancements Pooled 74
C.2 Child-Level Impacts on 3-Year-Olds: Social-Emotional Outcomes, Controlling for Child Gender, by Enhancement 75
C.3 Child-Level Impacts on 3-Year-Olds: Pre-Academic Skills, Controlling for Child Gender, Enhancements Pooled 77
C.4 Child-Level Impacts on 3-Year-Olds: Pre-Academic Skills, Controlling for Child Gender, by Enhancement 78
D.1 Items and Factor Loadings for the Teacher-Reported Behavior Problems Index Subscales in the Sample of 3-Year-Olds 84
F.1 Child Baseline Characteristics and Pre-Test Measures in the Sample of 3-Year-Olds: Differences Between Children Who Left the Program and Children Who Stayed in the Program 96
F.2 Baseline Teacher Characteristics in Mixed-Age Classrooms: Differences Between Teachers Who Left the Program and Teachers Who Stayed in the Program 98
Figure
ES.1 Head Start CARES Theory of Change ES-5
1 Head Start CARES Theory of Change 7
A.1 Randomization Design 55
Box
ES.1 The Head Start CARES Enhancements ES-4
1 What Is Social-Emotional Development? 5
2 Understanding and Contextualizing Effect Sizes 10
3 Measures of Teacher Practice and Classroom Climate 19
4 Measures of Children’s Behavior Regulation, Social Behavior, Learning Behaviors, and Relationship with the Teacher 37
5 Measures of Children’s Pre-Academic Skills 44

ix
Acknowledgments
The Head Start CARES (Classroom-based Approaches and Resources for Emotion and Social skill promotion) demonstration was sponsored by the Office of Head Start and the Office of Planning, Research and Evaluation (OPRE) in the Administration for Children and Families, U.S. Department of Health and Human Services. We are thankful to the following people at OPRE: Ann Rivera and Lauren Supplee for their careful and thoughtful feedback and guidance, and Naomi Goldstein, Mary Bruce Webb, and Christine Fortunato for reviewing the early drafts of the report.
We are extremely grateful to the many program directors and staff at the 104 Head Start centers who agreed to take part in the full Head Start CARES study, which laid the groundwork for this report. We also thank the coaches who were the “feet on the ground” for supporting implementation and encouraging teachers. In addition, we are grateful for the dedicated consul-tation of the developers of the enhancements — Lisa St. George and Carolyn Webster-Stratton (The Incredible Years); Celene Domitrovich, Mark Greenberg, and Rebecca Cortes (Preschool PATHS); and Elena Bodrova, Deborah Leong, and Amy Hornbeck (Tools of the Mind—Play) — as well as the hard work of their many trainers who trained teachers and coaches nationwide.
The Head Start CARES study could not have been completed without a hard-working team devoted to collecting the large amount of data we needed from all around the country. We appreciate the work of our dedicated research partners, including Linda Kuhn and Tony Lavender and their staff at Survey Research Management, who collected the data used in this report, as well as the MDRC and MEF Associates staff and consultants who participated in the site visits.
This work was a true collaboration with distinguished experts in the field of early child-hood education, who committed their time and energy to ensuring that this project was carefully and thoroughly designed. We would like to thank Karen Bierman, Howard Bloom, Mary Louise Hemmeter, Stephanie Jones, and Cybele Raver, whose guidance, advice, and deep dedication were essential to this study. We also thank a broad assemblage of Technical Working Group members who supported the project with their expertise and contributions.
The report is a culmination of the joint energy and effort of a large team who supported the site recruitment, data collection, data management, and technical assistance work on this project. At MDRC, Sharon Rowser played a critical role in overseeing the site recruitment and operations effort. Gordon Berlin, Barbara Goldman, Virginia Knox, John Hutchins, Marie-Andrée Somers, and Mike Fishman provided thoughtful input and reviewed the report drafts. We also thank Magdalena Mello for her careful work as a resource manager at all phases of the project; Jo Anna Hunter for acting as our liaison with Survey Research Management; Ximena
x
Portilla and Matthew Kim for supporting and informing the design and sampling work; Electra Small for overseeing data processing; Nina Castells for overseeing data analysis; Ezra Cohn, Seata Shyon, Patrizia Mancini, Molly Alter, Isabelle Bollendorf, and William Pe for their work processing data and conducting the analysis for the report; Natalia Rojas for her survey and design work; Parham Horn for coordinating the production of the report; Alice Tufel for editing the report; and Stephanie Cowell and Carolyn Thomas for preparing the report for publication.
Perhaps most important, we thank the children and families who participated in our study and allowed us access into their lives for a few years. Our research would not have been possible without them.
The Authors

ES-1
Executive Summary
In recent years, interest has increased in preschool programs that promote low-income chil-dren’s early learning and development. Although research in this area has focused mostly on 4-year-olds, a growing number of 3-year-olds attend publicly funded preschool. In fact, in Head Start — a federally funded early childhood education program — the percentage of 3-year-olds rose from 24 percent in 1980 to 40 percent in 2013.1
Increased attention has also been focused on identifying promising strategies to enhance young children’s social, emotional, and behavioral development. A number of mostly small-scale studies demonstrate that classroom-based approaches can improve these outcomes for 4-year-old children.2 However, a notable gap in the evidence base is whether the benefits of these social-emotional strategies can extend to younger children in the classroom.
This report presents exploratory impact findings for 3-year-old children from the Head Start CARES (Classroom-based Approaches and Resources for Emotion and Social skill pro-motion) demonstration. The Head Start CARES demonstration was a large-scale randomized controlled trial implemented in Head Start centers across the country. The demonstration tested the effects of three classroom-based approaches that each had a distinct theory, developed by the Head Start CARES research team,3 of how to improve children’s social-emotional compe-tencies. Called “enhancements” because they were intended to complement and to enrich exist-ing Head Start classroom practices, the three approaches are The Incredible Years Teacher Training Program, or “The Incredible Years”;4 Preschool PATHS (Promoting Alternative Thinking Strategies), or “PATHS”; and a one-year version of Tools of the Mind focused on play, or “Tools of the Mind—Play.”5 The demonstration was conceived and sponsored by the Office of Head Start and the Office of Planning, Research and Evaluation in the Administration for Children and Families, U.S. Department of Health and Human Services. MDRC, a nonprof-
1Tarullo, Aikens, Moiduddin, and West (2010); Child Trends (2014). 2Reid, Webster-Stratton, and Hammond (2003); Domitrovich, Cortes, and Greenberg (2007); Barnett et al.
(2008). 3The Head Start CARES team developed the theory of change for each approach based on the training and
curricular materials and research papers from each one. 4The Teacher Training Program is one of three Incredible Years programs; the other two are the child-
focused Dinosaur School and the parent-focused Parent Program. 5Tools of the Mind—Play, a one-year program that promotes children’s learning through structured
“make-believe” play, is adapted from the original two-year “Tools of the Mind” program. In Tools of the Mind—Play, teachers were trained for only one year in the model (instead of two years, as is typical in the Tools of the Mind program) and it was implemented as an enhancement to the existing curricula in the Head Start CARES program sites.
ES-2
it, nonpartisan education and social policy research organization, conducted the demonstration in collaboration with MEF Associates and several academic partners.
Head Start CARES: Earlier Findings and a Preview of Findings for 3-Year-Olds Two prior reports on Head Start CARES looked at all classrooms in the demonstration, which included classrooms with 4-year-olds only and “mixed-age” classrooms with both 3-year-olds and 4-year-olds. This work confirmed that, on average, the enhancements were satisfactorily implemented in the full set of classrooms in the study, leading the research team to conclude that Head Start CARES provided a fair test of large-scale implementation of the three enhance-ments.6 Furthermore, impact findings for the full sample of Head Start CARES classrooms indi-cate that two of the three enhancements — The Incredible Years and PATHS — improved 4-year-old children’s social-emotional outcomes, with impacts of small to moderate size.7
The findings presented in this report suggest that the benefits of social-emotional en-hancements can extend to 3-year-olds in mixed-age Head Start classes that include both 3- and 4-year-old children. When considered as a group, the enhancements produced improvements in teachers’ reports of 3-year-olds’ social behaviors and closeness with their teachers. These over-all impacts appear to have been driven primarily by The Incredible Years, which is consistent with the hypothesis that The Incredible Years may be more accessible to 3-year-olds than are PATHS and Tools of the Mind—Play.
However, as discussed in more detail below, these questions were not the main focus of the study, and the conclusions that can be drawn from this analysis are limited because of the sample sizes, data sources, and measures available for the analysis. In addition, the pattern of impacts on 3-year-olds’ social-emotional outcomes does not clearly align with the impacts on teacher practice and classroom climate in the classrooms serving these children. This finding raises questions about the findings that warrant further exploration, including what additional mechanisms might account for the impacts of the enhancements on 3-year-olds’ social and emotional competencies.
6Mattera, Lloyd, Fishman, and Bangser (2013). 7Morris et al. (2014). While the full sample described in Morris et al. (2014) included all the Head Start
CARES classrooms, it focused only on the 4-year-olds in those classrooms when discussing the analysis of child outcomes.
ES-3
The Head Start CARES Demonstration Head Start CARES used a rigorous random assignment research design in which Head Start centers were randomly assigned to receive one of the three social-emotional enhancements or to a control group in which the curricula used in the Head Start program were carried out as usual without any of the enhancements. The enhancements were implemented between the fall of 2010 and the spring of 2011.
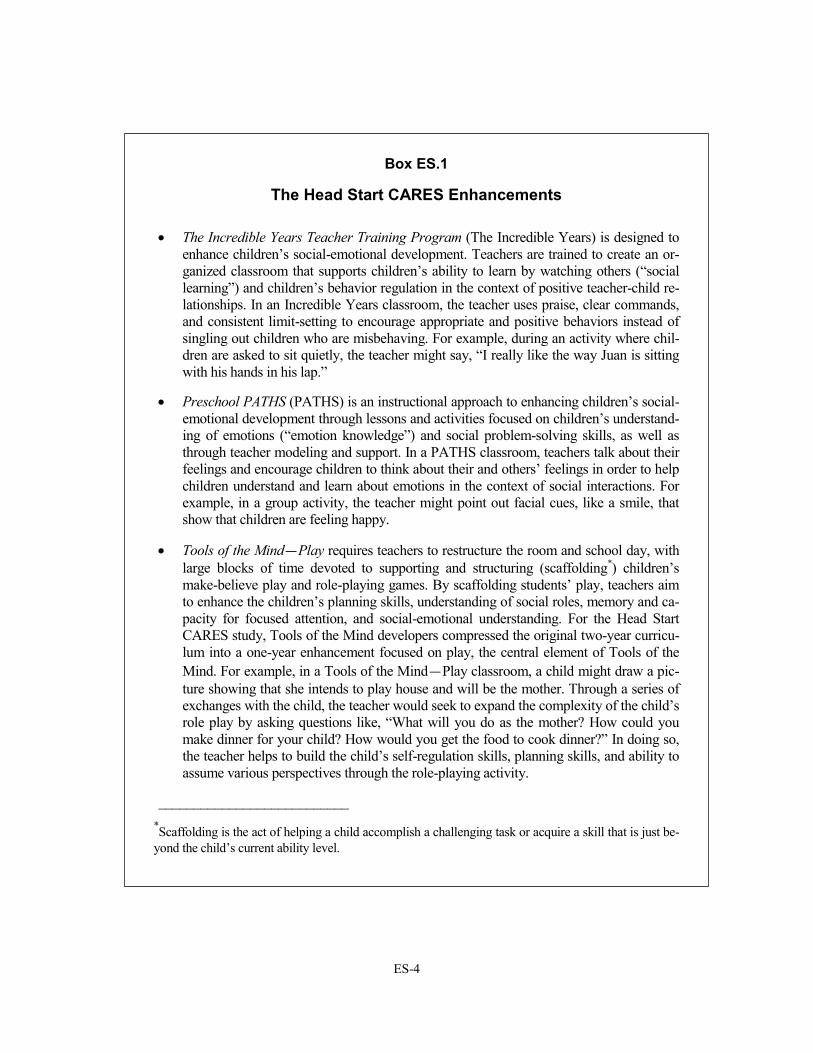
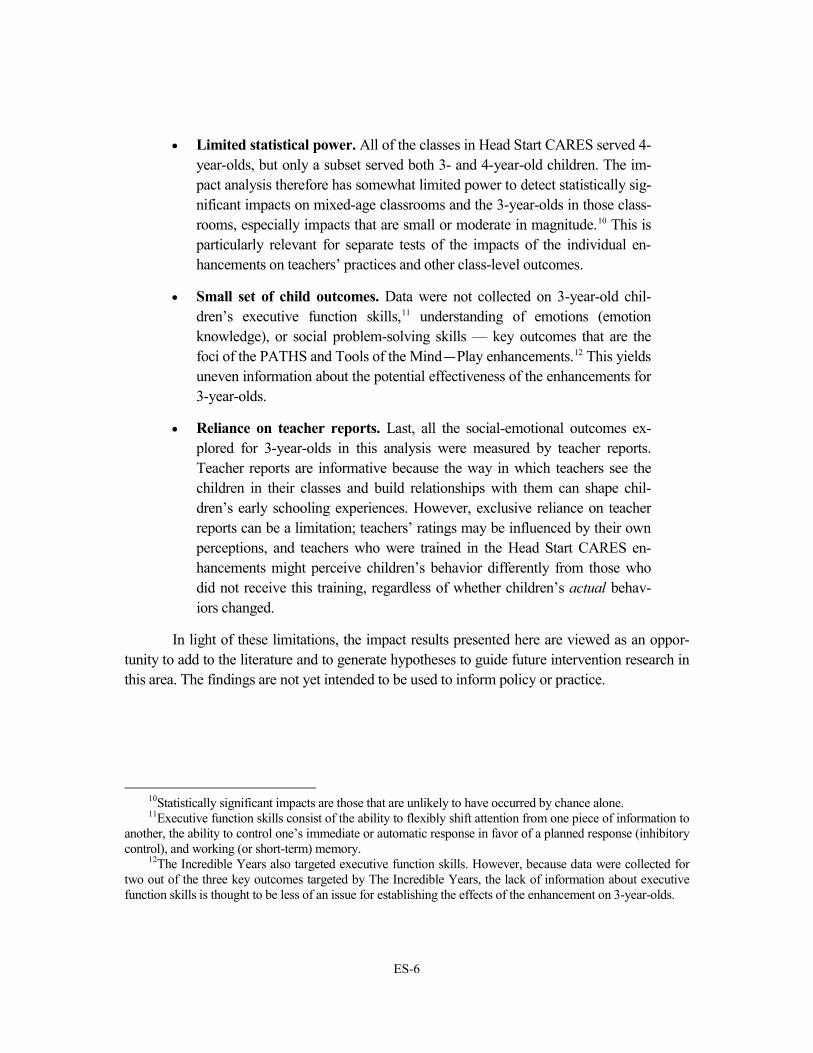
The Head Start CARES enhancements are described in more detail in Box ES.1. They were designed for 4-year-olds, and, accordingly, the theory of change underlying these en-hancements is most relevant for this age group.8 As shown in Figure ES.1, the enhancements share a common goal of improving children’s social, emotional, and behavioral competencies. The overarching hypothesis is that the enhancements influence children through changes in teacher practice and, in turn, classroom climate. However, each enhancement is thought to have a different mediating pathway by which it improves young children’s social-emotional out-comes. Enhancement-driven improvements in children’s social, emotional, and behavioral competencies might, in turn, lead to improvements in children’s cognitive and pre-academic skills.9 However, the enhancements did not directly target those skills.
The Current Analysis: An Opportunity to Explore the Impacts of the Head Start CARES Enhancements on 3-Year-Olds Head Start CARES provides a unique opportunity to explore the impacts of social-emotional enhancements on 3-year-olds in mixed-age classrooms. Yet, there are limitations to this analysis that have implications for the conclusions that can be drawn:
• Lack of clear theory and evidence base. At the outset of the study, it was not clear whether and how 3-year-olds might benefit from the enhancements. Much of the prior theory and intervention research in this area have focused primarily on 4-year-olds, with few insights into how 3-year-olds could be af-fected. Given this uncertainty, Head Start CARES was not explicitly de-signed to test the impacts of the enhancements on 3-year-olds. As discussed below, the design of the impact analysis — including the sample sizes and data sources that were available — has several implications for what can be learned from it.
8As noted earlier, the theory of change was developed by the Head Start CARES evaluation team. 9Pre-academic skills are the early language, literacy, and math skills that underlie learning in elementary
school. For example, in preschool, children learn to identify letters and the sounds that letters make, to provide a foundation for reading in kindergarten.
ES-4
Box ES.1
The Head Start CARES Enhancements
• The Incredible Years Teacher Training Program (The Incredible Years) is designed to enhance children’s social-emotional development. Teachers are trained to create an or-ganized classroom that supports children’s ability to learn by watching others (“social learning”) and children’s behavior regulation in the context of positive teacher-child re-lationships. In an Incredible Years classroom, the teacher uses praise, clear commands, and consistent limit-setting to encourage appropriate and positive behaviors instead of singling out children who are misbehaving. For example, during an activity where chil-dren are asked to sit quietly, the teacher might say, “I really like the way Juan is sitting with his hands in his lap.”
• Preschool PATHS (PATHS) is an instructional approach to enhancing children’s social-emotional development through lessons and activities focused on children’s understand-ing of emotions (“emotion knowledge”) and social problem-solving skills, as well as through teacher modeling and support. In a PATHS classroom, teachers talk about their feelings and encourage children to think about their and others’ feelings in order to help children understand and learn about emotions in the context of social interactions. For example, in a group activity, the teacher might point out facial cues, like a smile, that show that children are feeling happy.
• Tools of the Mind—Play requires teachers to restructure the room and school day, with large blocks of time devoted to supporting and structuring (scaffolding*) children’s make-believe play and role-playing games. By scaffolding students’ play, teachers aim to enhance the children’s planning skills, understanding of social roles, memory and ca-pacity for focused attention, and social-emotional understanding. For the Head Start CARES study, Tools of the Mind developers compressed the original two-year curricu-lum into a one-year enhancement focused on play, the central element of Tools of the Mind. For example, in a Tools of the Mind—Play classroom, a child might draw a pic-ture showing that she intends to play house and will be the mother. Through a series of exchanges with the child, the teacher would seek to expand the complexity of the child’s role play by asking questions like, “What will you do as the mother? How could you make dinner for your child? How would you get the food to cook dinner?” In doing so, the teacher helps to build the child’s self-regulation skills, planning skills, and ability to assume various perspectives through the role-playing activity.
___________________________ *Scaffolding is the act of helping a child accomplish a challenging task or acquire a skill that is just be-yond the child’s current ability level.

ES-5
Incredible Years
Classroom Manageme
nt
Intervention
Executive function
Behavior regulation
Emotion knowledge
Preschool PATHS
Tools of the Mind-Play
Social problem-solving
Head Start CARES Demonstration
Figure ES.1
Head Start CARES Theory of Change
Teacher practices to
support social-
emotional development
Classroom quality
Improvements in Child’s Social-Emotional Skills
Changes in Teacher Practices
Improvements in Classroom Interactions
Implementation
Coaching
Training of coaches
and teachers
Classroom implementation
(teacher delivery of
program model components)
Contextual factorsSocial behaviors
Learning behaviors
Improvements in Child’s Social-Emotional Behaviors
Incredible Years
Teacher Training
ES-6
• Limited statistical power. All of the classes in Head Start CARES served 4-year-olds, but only a subset served both 3- and 4-year-old children. The im-pact analysis therefore has somewhat limited power to detect statistically sig-nificant impacts on mixed-age classrooms and the 3-year-olds in those class-rooms, especially impacts that are small or moderate in magnitude.10 This is particularly relevant for separate tests of the impacts of the individual en-hancements on teachers’ practices and other class-level outcomes.
• Small set of child outcomes. Data were not collected on 3-year-old chil-dren’s executive function skills,11 understanding of emotions (emotion knowledge), or social problem-solving skills — key outcomes that are the foci of the PATHS and Tools of the Mind—Play enhancements.12 This yields uneven information about the potential effectiveness of the enhancements for 3-year-olds.
• Reliance on teacher reports. Last, all the social-emotional outcomes ex-plored for 3-year-olds in this analysis were measured by teacher reports. Teacher reports are informative because the way in which teachers see the children in their classes and build relationships with them can shape chil-dren’s early schooling experiences. However, exclusive reliance on teacher reports can be a limitation; teachers’ ratings may be influenced by their own perceptions, and teachers who were trained in the Head Start CARES en-hancements might perceive children’s behavior differently from those who did not receive this training, regardless of whether children’s actual behav-iors changed.
In light of these limitations, the impact results presented here are viewed as an oppor-tunity to add to the literature and to generate hypotheses to guide future intervention research in this area. The findings are not yet intended to be used to inform policy or practice.
10Statistically significant impacts are those that are unlikely to have occurred by chance alone. 11Executive function skills consist of the ability to flexibly shift attention from one piece of information to
another, the ability to control one’s immediate or automatic response in favor of a planned response (inhibitory control), and working (or short-term) memory.
12The Incredible Years also targeted executive function skills. However, because data were collected for two out of the three key outcomes targeted by The Incredible Years, the lack of information about executive function skills is thought to be less of an issue for establishing the effects of the enhancement on 3-year-olds.

ES-7
Characteristics of Grantees, Centers, Classrooms, and Children in the Current Sample This impact analysis uses a subset of grantees, centers, classrooms, and children from the full sample in the Head Start CARES study.13 The sample for the larger Head Start CARES study was designed to reflect the racial, ethnic, and cultural diversity of Head Start children across the country, but was not selected to be statistically representative of all Head Start grantees in the United States. The 3-year-old children included in this analysis were served in 155 mixed-age classrooms located in 56 Head Start centers within 9 of the 17 grantees in the full Head Start CARES sample. These nine grantees were located in five states spread across three regions of the country (Midwest/Plains, West, and South) and varied on such characteristics as size, racial or ethnic composition of the children served, and number of participating centers.
A typical Head Start CARES mixed-age classroom had a minimum of one lead teacher and one assistant teacher. The Head Start CARES classrooms that served 3-year-olds were simi-lar to classrooms in a nationally representative sample of Head Start centers on levels of emo-tional support, but had somewhat higher levels of classroom organization and instructional sup-port, as measured by the Classroom Assessment Scoring System (CLASS), a widely used measure of classroom climate.14 Head Start CARES teachers in classrooms that served 3-year-olds, however, looked similar to the general population of Head Start teachers on characteristics like educational attainment and years of teaching experience.15 In the current sample of mixed-age classrooms, an average of three classrooms per center participated in the Head Start CARES demonstration.
Impacts of Head Start CARES Enhancements on Teacher Practice, Classroom Climate, and 3-Year-Olds’ Social-Emotional and Pre-Academic Outcomes In the absence of strong a priori hypotheses about how each enhancement would affect 3-year-olds and because greater statistical power can be leveraged with pooled research questions (that is, the statistical significance of smaller effect sizes can be detected with more certainty when tested with a larger sample), the analysis first tested for impacts with the data combined across
13A grantee is the local public or private nonprofit agency that has been designated a Head Start agency. 14In the sample of mixed-age Head Start CARES classrooms, average CLASS scores were 5.32 for Emo-
tional Support, 4.84 for Classroom Organization, and 2.70 for Instructional Support. By comparison, in the nationally representative Head Start Family and Child Experiences Survey (FACES) sample, which included classrooms that served 4-year-olds only and mixed-age classrooms that served both 3- and 4-year-olds, average CLASS scores were 5.30 for Emotional Support, 4.70 for Classroom Organization, and 2.30 for Instructional Support (Moiduddin et al., 2012).
15U.S. Department of Health and Human Services, Administration for Children and Families (2012).

ES-8
all three enhancements rather than for each enhancement individually. This analysis was con-ducted to assess whether the delivery of any social-emotional enhancement in mixed-age class-rooms might improve 3-year-olds’ social and emotional competencies. The results indicate the following:
• When tested as a group, the enhancements increased levels of teachers’ social-emotional instruction but did not affect other aspects of teacher practice or classroom climate in mixed-age classrooms.
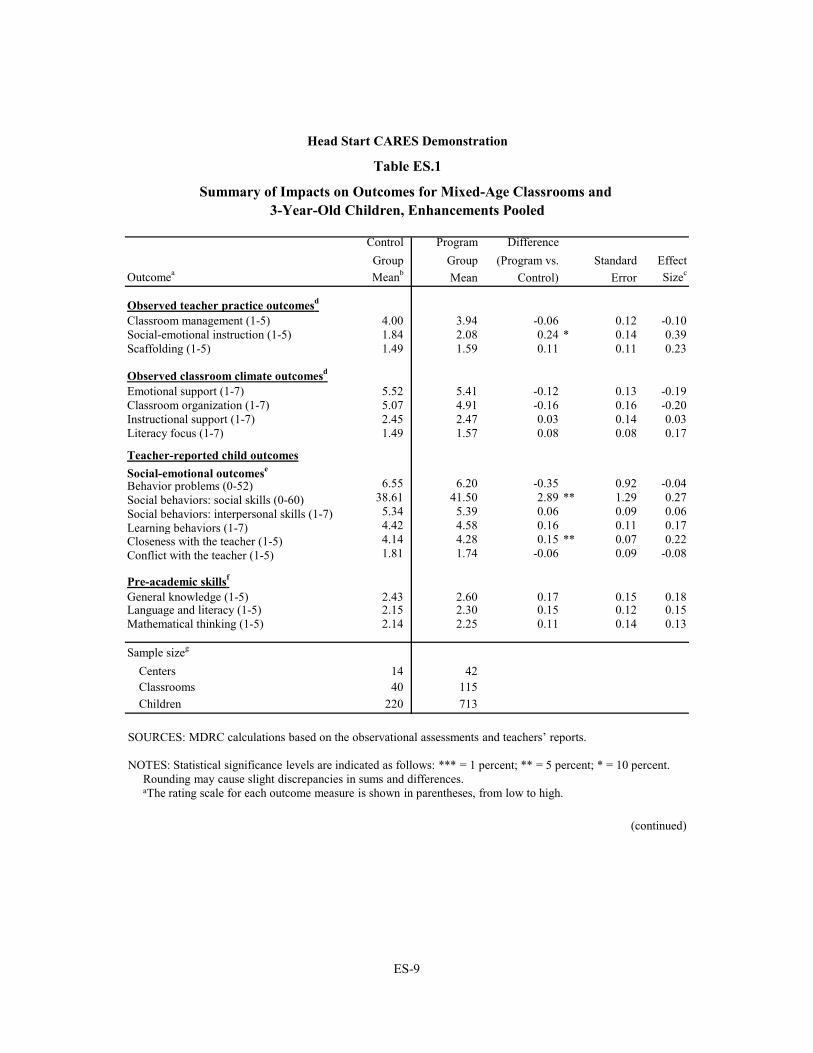
As shown in Table ES.1, teachers in enhancement classrooms showed statistically sig-nificantly higher levels of social-emotional instruction than their control group counterparts. However, these impacts did not translate into statistically significant impacts on other aspects of teacher practice, such as classroom management and scaffolding, or classroom climate.
• When considered as a group, the enhancements improved teacher re-ports of 3-year-olds’ social behaviors and closeness with their teachers.
However, as shown in Table ES.1, no statistically significant impacts were found on teacher reports of 3-year-old children’s behavior problems, interpersonal skills, learning behav-iors, or conflict with their teacher when data were pooled across the enhancements.
To isolate the impacts of the individual enhancements, separate analyses tested the im-pacts of each enhancement on teacher practice, classroom climate, and teacher reports of 3-year-olds’ social-emotional outcomes. The results, shown in Table ES.2, indicate the following:
• The Incredible Years did not produce the expected statistically signifi-cant impacts on teachers’ use of classroom and behavior management strategies in mixed-age classrooms. The Incredible Years did, however, improve teacher reports of 3-year-olds’ social behaviors and closeness with teachers.
The absence of statistically significant impacts on teachers’ use of classroom and be-havior management strategies is surprising, since these are central foci of The Incredible Years training, and The Incredible Years significantly improved teachers’ classroom management practices in the full Head Start CARES sample.16 Despite the absence of statistically significant impacts on Incredible Years teachers’ classroom management practices in mixed-age class-rooms, Incredible Years teachers still reported statistically significantly higher levels of 3-year-
16Morris et al. (2014). The analysis did not test for whether there are statistically significantly different im-
pacts between the full (4-year-old and mixed-age) and mixed-age-only samples of classrooms. Moreover, be-cause the mixed-age classrooms differ from the full sample of classrooms on a number of characteristics, it is not clear what might be driving any differences in the impact estimates.
ES-9
Control Program DifferenceGroup Group (Program vs. Standard Effect
Outcomea Meanb Mean Control) Error Sizec
Observed teacher practice outcomesd
Classroom management (1-5) 4.00 3.94 -0.06 0.12 -0.10Social-emotional instruction (1-5) 1.84 2.08 0.24 * 0.14 0.39Scaffolding (1-5) 1.49 1.59 0.11 0.11 0.23
Observed classroom climate outcomesd
Emotional support (1-7) 5.52 5.41 -0.12 0.13 -0.19Classroom organization (1-7) 5.07 4.91 -0.16 0.16 -0.20Instructional support (1-7) 2.45 2.47 0.03 0.14 0.03Literacy focus (1-7) 1.49 1.57 0.08 0.08 0.17
Teacher-reported child outcomesSocial-emotional outcomese
Behavior problems (0-52) 6.55 6.20 -0.35 0.92 -0.04Social behaviors: social skills (0-60) 38.61 41.50 2.89 ** 1.29 0.27Social behaviors: interpersonal skills (1-7) 5.34 5.39 0.06 0.09 0.06Learning behaviors (1-7) 4.42 4.58 0.16 0.11 0.17
4.14 4.28 0.15 ** 0.07 0.221.81 1.74 -0.06 0.09 -0.08
Pre-academic skillsf
General knowledge (1-5) 2.43 2.60 0.17 0.15 0.18Language and literacy (1-5) 2.15 2.30 0.15 0.12 0.15Mathematical thinking (1-5) 2.14 2.25 0.11 0.14 0.13
Sample sizeg
Centers 14 42Classrooms 40 115Children 220 713
Head Start CARES Demonstration
Table ES.1
Summary of Impacts on Outcomes for Mixed-Age Classrooms and 3-Year-Old Children, Enhancements Pooled
(continued)
Closeness with the teacher (1-5)Conflict with the teacher (1-5)
SOURCES: MDRC calculations based on the observational assessments and teachers’ reports.
NOTES: Statistical significance levels are indicated as follows: *** = 1 percent; ** = 5 percent; * = 10 percent.Rounding may cause slight discrepancies in sums and differences.aThe rating scale for each outcome measure is shown in parentheses, from low to high.

ES-10
olds’ social behaviors in mixed-age classrooms, including cooperation, assertion, and self-control (not shown in table), as well as closeness with their teachers. These impacts were mod-erate to large in magnitude. However, no statistically significant effects were found on class-room climate or teacher reports of 3-year-olds’ behavior problems, interpersonal skills, learning behaviors, or conflict with their teachers.
• As expected, PATHS and Tools of the Mind—Play improved teachers’ social-emotional instruction and scaffolding of children’s play, respec-tively, in mixed-age classrooms. But there is little evidence to suggest that either enhancement improved teacher reports of 3-year-olds’ social-emotional outcomes.
As shown in Table ES.2, teachers in PATHS mixed-age classrooms engaged in statisti-cally significantly higher levels of social-emotional instruction compared with their control group counterparts. This included teaching children about emotions, supporting children’s ex-pression and regulation of emotions, and facilitating children’s social problem-solving and un-derstanding of their peers’ emotions (not shown in table) — all of which is consistent with PATHS training. Teachers in Tools of the Mind—Play classrooms also showed higher levels of overall scaffolding of children’s play. These impacts are consistent with the central focus of Tools of the Mind—Play. However, these improvements in teacher practice did not lead to changes in overall classroom climate for either enhancement, nor did they translate into a con-sistent pattern of impacts on 3-year-olds’ teacher-reported social-emotional outcomes.
Table ES.1 (continued)bThe control group means reported in this table are covariate-adjusted and were estimated using models in
which data for all three enhancements were pooled. Separate indicators for each of the enhancements were not included as covariates in the models. Some discrepancies in control group means may appear across tables due to differences in model estimation for the pooled and by-enhancement impacts.
cEffect size is calculated by dividing the impact of the program (the difference between the means for the program group and the control group) by the standard deviation for the control group.
dAll observed teacher practice outcomes were measured using the Adapted Teaching Style Rating Scale (Raver et al., 2012). All observed classroom climate outcomes were measured using the Classroom Assessment Scoring System (Pianta, La Paro, and Hamre, 2008).
eThe behavior problems outcome was measured using the Behavior Problems Index (Zill, 1990); social behaviors: social skills were measured using the Social Skills Rating Scale (Gresham and Elliot, 1990); social behaviors: interpersonal skills were measured using the Interpersonal Skills subscale of the Cooper-Farran Behavioral Rating Scales (Cooper and Farran, 1991); learning behaviors were measured using the Work-Related Skills subscale of the Cooper-Farran Behavioral Rating Scales; and closeness with the teacher and conflict with the teacher were measured using the Student-Teacher Relationship Scale (Pianta, 2001).
fPre-academic skills were measured using the Academic Rating Scale (National Center for Education Statistics, n.d.)
gFor all variables in the table, data are available for at least 96 percent of the sample.

Control Program Difference Program Difference Program DifferenceGroup Group (IY vs. Effect Group (PATHS vs. Effect Group (Tools vs. Effect
Outcomea Meanb Mean Control) SE Sizec Mean Control) SE Sizec Mean Control) SE Sizec
Observed teacher practice outcomesd
Classroom management (1-5) 4.00 4.11 0.11 0.15 0.20 3.89 -0.11 0.15 -0.21 3.82 -0.18 0.15 -0.32
Social-emotional instruction (1-5) 1.85 1.97 0.12 0.15 0.20 2.42 0.58 *** 0.16 0.94 1.85 0.00 0.16 0.00
Scaffolding (1-5) 1.48 1.43 -0.06 0.13 -0.12 1.60 0.11 0.14 0.24 1.76 0.28 * 0.14 0.59
Observed classroom climateoutcomesd
Emotional support (1-7) 5.53 5.47 -0.06 0.16 -0.09 5.45 -0.07 0.16 -0.12 5.30 -0.23 0.17 -0.37Classroom organization
(1-7) 5.07 5.08 0.01 0.19 0.01 4.88 -0.19 0.19 -0.24 4.76 -0.30 0.20 -0.38Instructional support (1-7) 2.45 2.39 -0.06 0.17 -0.08 2.70 0.25 0.18 0.31 2.36 -0.09 0.18 -0.12Literacy focus (1-7) 1.49 1.51 0.02 0.10 0.04 1.55 0.06 0.10 0.12 1.66 0.17 0.10 0.34
Teacher-reported child outcomesSocial-emotional outcomese
Behavior problems (0-52) 6.54 5.89 -0.65 1.12 -0.08 5.96 -0.59 1.13 -0.07 6.74 0.19 1.13 0.02Social behaviors: social
skills (0-60) 38.63 44.41 5.78 *** 1.45 0.55 40.94 2.31 1.46 0.22 39.16 0.53 1.46 0.05Social behaviors:
interpersonal skills (1-7) 5.34 5.46 0.12 0.11 0.13 5.34 0.00 0.12 0.00 5.38 0.04 0.11 0.05
Head Start CARES Demonstration
Table ES.2
Summary of Impacts on Outcomes for Mixed-Age Classrooms and 3-Year-Old Children, by Enhancement
The Incredible Years (IY) Preschool PATHS Tools of the Mind – Play
(continued)
ES-11

ES-12
Control Program Difference Program Difference Program DifferenceGroup Group (IY vs. Effect Group (PATHS vs. Effect Group (Tools vs. Effect
Outcomea Meanb Mean Control) SE Sizeb Mean Control) SE Sizeb Mean Control) SE Sizeb
Learning behaviors (1-7) 4.42 4.64 0.22 0.14 0.23 4.60 0.18 0.14 0.19 4.51 0.09 0.14 0.09
teacher (1-5) 4.14 4.41 0.27 *** 0.08 0.40 4.25 0.11 0.08 0.16 4.20 0.06 0.08 0.09
(1-5) 1.81 1.65 -0.15 0.11 -0.19 1.81 0.00 0.11 0.00 1.77 -0.04 0.11 -0.05
Pre-academic skillsf
General knowledge (1-5) 2.44 3.02 0.58 *** 0.16 0.62 2.49 0.06 0.16 0.06 2.30 -0.14 0.16 -0.15Language and literacy 2.15 2.47 0.32 ** 0.14 0.33 2.26 0.11 0.14 0.11 2.15 0.00 0.14 0.00
(1-5)Mathematical thinking 2.14 2.55 0.40 ** 0.15 0.49 2.18 0.04 0.15 0.05 2.01 -0.14 0.15 -0.16
(1-5)
Sample sizeg
Centers 14 14 14 14Classrooms 40 41 37 37Children 220 246 226 241
(continued)
Table ES.2 (continued)
Conflict with the teacher
Closeness with the
The Incredible Years (IY) Preschool PATHS Tools of the Mind – Play
SOURCES: MDRC calculations based on the observational assessments and teachers’ reports.
NOTES: Statistical significance levels are indicated as follows: *** = 1 percent; ** = 5 percent; * = 10 percent.Rounding may cause slight discrepancies in sums and differences.SE represents standard error. aThe rating scale for each outcome measure is shown in parentheses, from low to high.bThe control group means reported in this table are covariate-adjusted and were estimated using models in which data for all three enhancements were
pooled and a treatment indicator for each enhancement was included. Some discrepancies in control group means may appear across tables due to differences in model estimation for the pooled and by-enhancement impacts.
cEffect size is calculated by dividing the impact of the program (the difference between the means for the program group and the control group) by the standard deviation for the control group.
ES-13
Last, analyses explored whether enhancement-driven improvements in 3-year-olds’ so-cial-emotional competencies led to improvements in their pre-academic skills, first for the set of enhancements as a group (Table ES.1) and then separately for each enhancement (Table ES.2).
• When considered together, the enhancements did not affect teacher re-ports of 3-year-olds’ pre-academic skills. Although teachers reported statistically significantly stronger pre-academic skills for 3-year-olds in Incredible Years classrooms than for their counterparts in control group classrooms, these findings are somewhat uncertain.
As shown in Table ES.2, The Incredible Years’ impact estimates were consistent across teacher reports of three pre-academic skill domains — general knowledge, language and litera-cy, and mathematical thinking. It is important to consider the results of the full Head Start CARES impact analysis for 4-year-olds when interpreting these impacts on 3-year-olds because information about 4-year-olds’ pre-academic skills was collected from both teacher reports and direct assessments. Incredible Years teachers also reported statistically significant improve-ments in 4-year-olds’ pre-academic skills, but no statistically significant impacts were found on direct assessments of these skills.17 The lack of convergence in findings across these two data sources and the potential for bias in teacher reports suggest that the impacts on 3-year-olds’ teacher-reported pre-academic skills should be interpreted with caution.
Discussion In sum, the findings suggest that it is possible for the benefits of social-emotional preschool in-terventions to extend to 3-year-olds, even if the interventions are primarily designed for 4-year-old children. When considered together, the Head Start CARES enhancements produced posi-
17Morris et al. (2014).
Table ES.2 (continued)dAll observed teacher practice outcomes were measured using the Adapted Teaching Style Rating Scale
(Raver et al., 2012). All observed classroom climate outcomes were measured using the Classroom Assessment Scoring System (Pianta, La Paro, and Hamre, 2008).
eThe behavior problems outcome was measured using the Behavior Problems Index (Zill, 1990); social behaviors: social skills were measured using the Social Skills Rating Scale (Gresham and Elliot, 1990); social behaviors: interpersonal skills were measured using the Interpersonal Skills subscale of the Cooper-Farran Behavioral Rating Scale (Cooper and Farran, 1991); learning behaviors were measured using the Work-Related Skills subscale of the Cooper-Farran Behavioral Rating Scale; and closeness with the teacher and conflict with the teacher were measured using the Student-Teacher Relationship Scale (Pianta, 2001).
fPre-academic skills were measured using the Academic Rating Scale (National Center for Education Statistics, n.d.).
gFor all variables in the table, data are available for at least 96 percent of the sample.
ES-14
tive, statistically significant impacts on teacher reports of 3-year-olds’ social behaviors and closeness with their teachers. The exploration of impacts by enhancement further suggests that these impacts were primarily driven by The Incredible Years, and to a lesser extent by the other enhancements. The findings for social-emotional outcomes are generally consistent with the pattern of impacts on teacher-reported outcomes that were identified for 4-year-olds in earlier analyses from Head Start CARES. Furthermore, the impact results for 3-year-olds are consistent with the hypothesis that the behavioral focus of the Incredible Years enhancement may have been more accessible to 3-year-olds than the other two enhancements, which are more cogni-tively demanding. However, the expected statistically significant improvements in teacher prac-tice were not found in Incredible Years classrooms, making the mechanisms that might account for these effects less clear.
These findings raise a number of questions for the field. First, can future studies repli-cate the findings presented here with other data sources, such as independent assessments of children’s behaviors? And, do the findings hold up in other contexts and classroom configura-tions? It will be important to learn whether future studies can confirm the findings discussed in this report before making decisions about appropriate policy and practice.
Second, assuming that the results found here are replicated in future trials, what mecha-nisms might account for the impacts of the enhancements, and The Incredible Years in particu-lar, on 3-year-olds? It may be, for example, that mixed-age classrooms enhance children’s so-cialization through peer learning and promote child development by bringing children together who have different skill levels and capabilities. These dynamics might provide a strong platform for promoting young children’s social and emotional development when coupled with a class-room-based intervention.
Third, do the PATHS or Tools of the Mind—Play enhancements improve social and emotional competencies for 3-year-olds that were not measured here? Measures of emotion knowledge, social problem-solving, and executive function — key outcomes targeted by the PATHS and Tools of the Mind—Play enhancements — were not available in this analysis. In-deed, earlier findings from Head Start CARES demonstrated that PATHS had small to moder-ate impacts on direct assessments of 4-year-old children’s knowledge of emotions and social problem-solving skills — two of its primary hypothesized outcomes. Therefore, it will be im-portant to investigate impacts on these outcomes for 3-year-olds before drawing conclusions about the effectiveness of the programs for younger children.
Despite some shortcomings in the analysis and measures, these results based on a rigor-ous random assignment research design point to new potential directions for future research and the development of preschool interventions to enhance young children’s social-emotional com-
ES-15
petencies. Since a substantial number of 3-year-olds attend preschool programs, the findings suggest that social-emotional interventions may be a strategy that deserves further investigation. Moreover, finding that 3-year-olds can benefit from such curricula suggests that there may be opportunities to augment these benefits for children who remain in preschool at age 4. Thus, future efforts might seek to develop and test social-emotional preschool program enhancements that include a second year of intervention.
ES-16
References for the Executive Summary
Barnett, Steven W., Kwanghee Jung, Donald J. Yarosz, Jessica Thomas, Amy Hornbeck, Robert Stechuk, and Susan Burns. 2008. “Educational Effects of the Tools of the Mind Curriculum: A Randomized Trial.” Early Childhood Research Quarterly 23: 299-313.
Child Trends. 2014. Head Start: Indicators on Children and Youth. Child Trends Data Bank. Bethesda, MD: Child Trends. Web site: www.childtrends.org/wp-content/uploads/2013/02/97_Head_Start.pdf.
Cooper, David H., and Dale Clark Farran.1991. The Cooper-Farran Behavioral Rating Scales. Brandon, VT: Clinical Psychology Publishing Co.
Domitrovich, Celene E., Rebecca C. Cortes, and Mark T. Greenberg. 2007. “Improving Young Children’s Social and Emotional Competence: A Randomized Trial of the Preschool ‘PATHS’ Curriculum.” The Journal of Primary Prevention 28, 2: 67-91.
Gresham, Frank, and Stephen N. Elliott. 1990. Social Skills Rating System Manual. Minneapolis, MN: NCS Pearson, Inc.
Mattera, Shira, Chrishana M. Lloyd, Mike Fishman, and Michael Bangser. 2013. A First Look at the Head Start CARES Demonstration: Large-Scale Implementation of Programs to Improve Chil-dren’s Social-Emotional Competence. OPRE Report 2013-47. Washington, DC: Office of Planning, Research and Evaluation, Administration for Children and Families, U.S. Depart-ment of Health and Human Services.
Moiduddin, Emily, Nikki Aikens, Louisa Tarullo, Jerry West, and Yange Xue. 2012. Child Out-comes and Classroom Quality in FACES 2009. OPRE Report 2012-37a. Washington, DC: Of-fice of Planning, Research and Evaluation, Administration for Children and Families, U.S. De-partment of Health and Human Services.
Morris, Pamela, Shira K. Mattera, Nina Castells, Michael Bangser, Karen Bierman, and Cybele Raver. 2014. Impact Findings from the Head Start CARES Demonstration: National Evalua-tion of Three Approaches to Improving Preschoolers’ Social and Emotional Competence. OPRE Report 2014-44. Washington, DC: Office of Planning, Research and Evaluation, Ad-ministration for Children and Families, U.S. Department of Health and Human Services.
National Center for Education Statistics. n.d. Academic Rating Scale. Washington, DC: National Center for Education Statistics. Website: http://nces.ed.gov/ECLS/kinderinstruments.asp.
Pianta, Robert C. 2001. Student-Teacher Relationship Scale — Short Form. Lutz, FL: Psychological Assessment Resources, Inc.
Pianta, Robert C., Karen M. La Paro, and Bridget K. Hamre. 2008. Classroom Assessment Scoring System Manual: Pre-K. Baltimore, MD: Paul H. Brookes Publishing Co.
Raver, C. Cybele, Celene E. Domitrovich, Mark T. Greenberg, Pamela A. Morris, and Shira Kolnik Mattera. 2012. “Adapted Teaching Style Rating Scale.” Unpublished. New York: MDRC.
ES-17
Reid, M. Jamila, Carolyn Webster-Stratton, and Mary Hammond. 2003. “Follow-Up of Children Who Received the Incredible Years Intervention for Oppositional-Defiant Disorder: Mainte-nance and Prediction of 2-Year Outcome.” Behavior Therapy 34: 471-491.
Tarullo, Louisa, Nikki Aikens, Emily Moiduddin, and Jerry West. 2010. A Second Year in Head Start: Characteristics and Outcomes of Children Who Entered the Program at Age Three. ACF/OPRE Report. Washington, DC: U.S. Department of Health and Human Services, Ad-ministration for Children and Families, Office of Planning, Research and Evaluation.
U.S. Department of Health and Human Services, Administration for Children and Families. 2012. Office of Head Start Program Information Report, 2011-2012. Washington, DC: U.S. Depart-ment of Health and Human Services, Administration for Children and Families.
Zill, Nicholas. 1990. Behavior Problems Index Based on Parent Report. Washington, DC: Child Trends.

THIS PAGE INTENTIONALLY LEFT BLANK

1
Background and Introduction In recent years, there has been great public interest in investing in preschool education to sup-port low-income children’s early learning and skills. The research in this area has focused primarily on 4-year-olds, even though 3-year-olds have increasingly attended preschool and represent a substantial proportion of the children in these classrooms. In fact, in Head Start — a federally funded early childhood education program in the United States — the percentage of 3-year-olds increased from 24 percent in 1980 to 40 percent in 2013.1
As interest in preschool education has grown, questions about how to support young children’s social, emotional, and behavioral development have garnered attention. This attention is motivated by three compelling sets of empirical evidence. First, children who grow up in poverty are at risk for early social, emotional, and behavioral difficulties.2 Second, these early social-emotional difficulties put children at risk of developing mental health problems and aca-demic difficulties throughout their lives.3 Finally, a number of mostly small-scale studies demonstrate that classroom-based approaches focused on social-emotional development can improve 4-year-old children’s social, emotional, and behavioral competencies.4 A notable gap in this evidence base, however, is whether the benefits of these strategies can extend to children younger than age 4.
These considerations highlight the need to identify effective strategies that can be deliv-ered on a large scale to promote 3-year-old children’s social, emotional, and behavioral compe-tencies. In particular, since 3-year-old children sometimes attend preschool alongside their 4-year-old peers, it is important to learn how strategies intended for 4-year-olds affect 3-year-olds’ developmental outcomes. Furthermore, since many 3-year-olds remain in preschool programs for more than one year, evidence regarding the extent to which they benefit from social-emotional interventions could point to opportunities to augment benefits for children who remain in preschool at age 4.
This report adds to the sparse literature by presenting exploratory impact findings for 3-year-old children from the Head Start CARES (Classroom-based Approaches and Resources for Emotion and Social skill promotion) demonstration. The Head Start CARES demonstration was a large-scale randomized controlled trial implemented in Head Start centers across the country to test the effects of three classroom-based approaches to improving the social and emotional
1Tarullo, Aikens, Moiduddin, and West (2010); Child Trends (2014). 2Aber, Jones, and Cohen (2000); Costello, Keeler, and Angold (2001); Morales and Guerra (2006). 3Arnold et al. (2006); Biederman et al. (2001); Broidy et al. (2003); Ladd and Burgess (1999); Ladd,
Birch, and Buhs (1999); McClelland, Morrison, and Holmes (2000); Raver, Garner, and Smith-Donald (2007). 4Reid, Webster-Stratton, and Hammond (2003); Domitrovich, Cortes, and Greenberg (2007); Barnett et al.
(2008).
2
competencies of 4-year-old children. Each approach, or program “enhancement” (so-called be-cause they were intended to enrich and complement classroom practices that already existed) has a distinct theory, developed by the Head Start CARES team,5 about how to strengthen chil-dren’s social-emotional development. The three evidence-based social-emotional enhancements are The Incredible Years Teacher Training Program (The Incredible Years),6 Preschool PATHS (PATHS),7 and a one-year version of Tools of the Mind focused on play, called Tools of the Mind—Play.8 The demonstration was conceived and sponsored by the Office of Head Start and the Office of Planning, Research and Evaluation in the Administration for Children and Fami-lies in the U.S. Department of Health and Human Services. MDRC, a nonprofit, nonpartisan education and social policy research organization, conducted the demonstration in collaboration with MEF Associates and several academic partners.
Earlier Implementation and Impact Findings from Head Start CARES
Two prior reports have focused on all classrooms in the Head Start CARES demonstra-tion, which included classrooms that served only 4-year-olds and classrooms that served both 3-year-olds and 4-year-olds (called “mixed-age classrooms” in this report). This work confirmed that, on average, the enhancements were satisfactorily implemented in the full set of classrooms in the study, which led the research team to conclude that Head Start CARES provided a fair test of the three enhancements.9 An analysis of the full sample of classrooms showed that each enhancement led to changes in teacher practice in the specific areas that it was designed to in-fluence. Furthermore, two of the enhancements had consistent positive impacts on 4-year-old children’s social-emotional outcomes.10 The Incredible Years had small to moderate effects on children’s knowledge of emotions (“emotion knowledge”), social problem-solving skills, and social behaviors, although these were not the primary hypothesized outcomes for that enhance-ment, as determined by the Head Start CARES team. PATHS had small to moderate impacts on
5The Head Start CARES team developed the theory of change for each enhancement based on the training
and curricular materials and research papers from each one. 6The Teacher Training Program is one of three Incredible Years programs; the other two are the child-
focused Dinosaur School and the parent-focused Parent Program. 7PATHS is an acronym for Promoting Alternative Thinking Strategies. 8Tools of the Mind—Play, a one-year program that promotes children’s learning through structured
“make-believe” play, is adapted from the original two-year “Tools of the Mind” program. In Tools of the Mind—Play, teachers were trained for only one year in the model (instead of two years, as is typical in the Tools of the Mind program) and it was implemented as an enhancement to the existing curricula in the Head Start CARES program sites.
9Morris, Mattera, Castells, and Bangser (2014). 10Morris et al. (2014). While the full sample described in Morris et al. (2014) includes all the Head Start
CARES classrooms, the discussion of the analysis of child outcomes focuses only on the 4-year-olds in those classrooms.
3
these same outcomes, which were thought to be its primary targets. Tools of the Mind—Play had more limited impacts on children’s social-emotional outcomes, perhaps because the pro-gram was reduced to a single year and focused on play (rather than the full curriculum). None of the enhancements produced statistically significant impacts on 4-year-old children’s pre-academic skills,11 as measured by direct assessments, which could have been affected indirectly through changes in social, emotional, and behavioral outcomes.12
A Preview of Impact Findings for 3-Year-Olds in Head Start CARES
Head Start CARES was designed with 4-year-olds in mind but provides a unique op-portunity to learn more about the effects of classroom-based strategies on 3-year-olds — a group of children who were served by the grantees with mixed-age classrooms.13 In brief, the findings show that it is possible for the benefits of the enhancements to extend to 3-year-olds in mixed-age classrooms. When considered as a group, the enhancements produced positive, sta-tistically significant impacts on 3-year-olds’ social behaviors and closeness with their teachers, as indicated in teacher reports. These overall impacts appear to have been primarily driven by The Incredible Years, and to a lesser degree by the other enhancements. This finding is con-sistent with the hypothesis that The Incredible Years’ behavioral focus may be more accessible to 3-year-olds than PATHS and Tools of the Mind—Play, both of which are more cognitively demanding.
However, as discussed further in this report, these questions were not the main focus of the study, and there are limitations to the conclusions that can be drawn from this exploratory analysis. The pattern of statistically significant impacts on 3-year-olds’ social-emotional out-comes does not clearly align with the statistically significant impacts on teacher practice and classroom climate in the mixed-age classrooms serving these children. This inconsistency un-derscores the need for further exploration of the findings and the mechanisms that might ac-count for the impacts on 3-year-olds’ social and emotional competencies.
The analysis also has somewhat limited power to detect statistically significant impacts, particularly on teacher practice and other class-level outcomes. This is because only the Head Start CARES mixed-age classrooms, which serve both 3- and 4-year-olds, are included in the analysis. In addition, all the available information about 3-year-olds’ social and emotional out-comes was measured using teacher reports. No data from the direct assessments included in the earlier analysis of 4-year-olds were available for 3-year-olds. Furthermore, data on outcomes
11Pre-academic skills are the early language, literacy, and math skills that underlie learning in elementary school. For example, in preschool, children learn to identify letters and the sounds that letters make, to provide a foundation for reading in kindergarten.
12Statistically significant impacts are those that are unlikely to have occurred by chance alone. 13A grantee is the local public or private nonprofit agency that has been designated a Head Start agency.
4
that are the primary foci of PATHS and Tools of the Mind—Play were not collected for 3-year-olds, which means that there is uneven information about the potential effects of the enhance-ments. As such, the findings presented here provide only suggestive evidence to guide future research in this area and are not yet intended to be used to inform policy or practice.
Organization of the Report
The next sections of the report begin with a more detailed description of the Head Start CARES demonstration, as well as the classroom-based enhancements that were tested, their theories of change as developed by the Head Start CARES team, and how the enhancements might affect 3-year-olds. This is followed by the research questions addressed in this report and a description of the Head Start CARES evaluation design. The impacts of the Head Start CARES enhancements on teacher practice, classroom climate, and outcomes for 3-year-olds in mixed-age classrooms are then presented. The final section provides a brief discussion of the impact results and their implications.
Overview of Head Start CARES Head Start CARES used a rigorous random assignment research design, in which Head Start centers were randomly assigned to receive one of three different enhancements or to a control group in which the curricula in the Head Start program were delivered as usual without any special enhancements. Between the fall of 2010 and the spring of 2011, the enhancements were implemented in Head Start classrooms that either served 4-year-olds exclusively or a mix of 3- and 4-year-olds.
The conceptualization and design of Head Start CARES is rooted in a substantial body of developmental research that points to children’s early social and emotional skills as the foun-dation for their competent social interactions with teachers and peers, as well as their success in school and later life. (See Box 1.) These skills have been the subject of several program en-hancements that were implemented and tested in a range of preschool settings.14 The studies yielded a number of promising classroom-based approaches to strengthening young children’s social, emotional, and behavioral competencies. But the evidence base currently consists mostly of smaller-scale studies conducted with samples of predominantly 4-year-old children, in which the developers actively oversaw the implementation of the programs and led the evaluations. As such, this earlier work provides limited information about the potential effectiveness of such approaches when implemented and tested on a national scale in a larger and more diverse set of classrooms or when targeted to a younger group of children.
14Bierman et al. (2008); Consortium on School-Based Promotion of Social Competence (1994); Morris et al. (2010); Raver et al. (2008).
5
The Head Start CARES Enhancements and Their Theories of Change
Drawing upon different theories about how children’s social and emotional skills de-velop and the prior intervention research in this area, three “types” of social-emotional en-hancements were selected to be tested in Head Start CARES. As noted earlier, these enhance-
Box 1
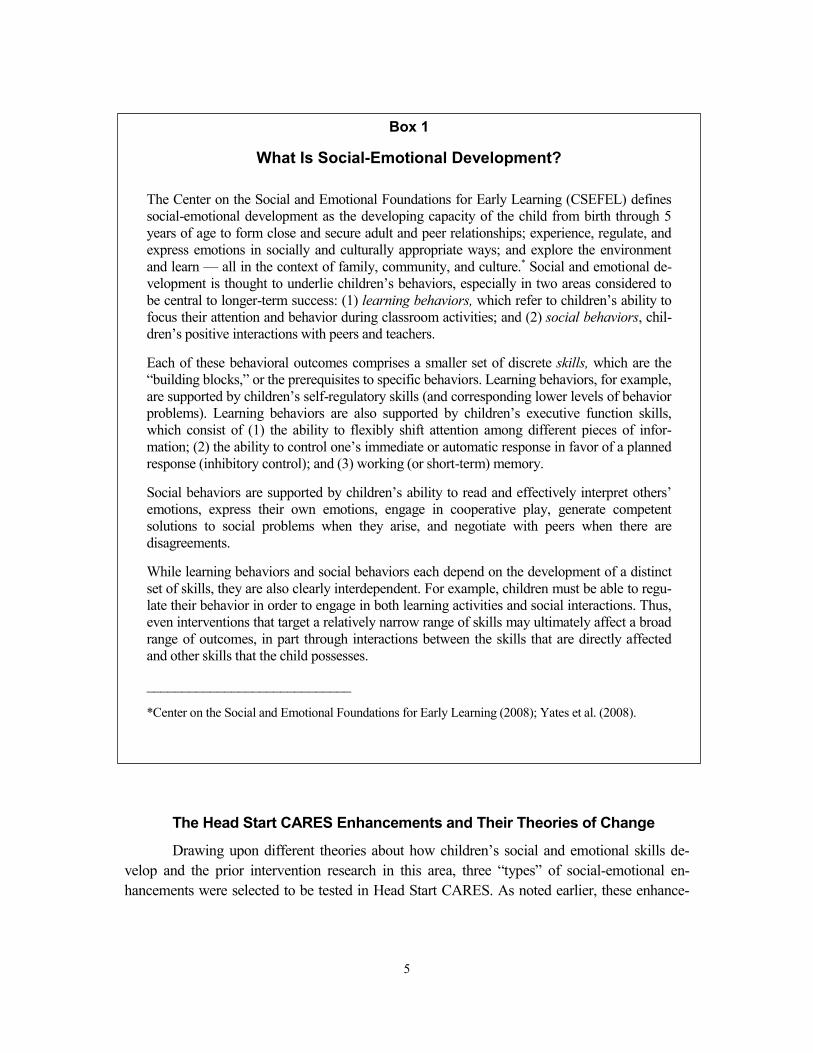
What Is Social-Emotional Development?
The Center on the Social and Emotional Foundations for Early Learning (CSEFEL) defines social-emotional development as the developing capacity of the child from birth through 5 years of age to form close and secure adult and peer relationships; experience, regulate, and express emotions in socially and culturally appropriate ways; and explore the environment and learn — all in the context of family, community, and culture.* Social and emotional de-velopment is thought to underlie children’s behaviors, especially in two areas considered to be central to longer-term success: (1) learning behaviors, which refer to children’s ability to focus their attention and behavior during classroom activities; and (2) social behaviors, chil-dren’s positive interactions with peers and teachers.
Each of these behavioral outcomes comprises a smaller set of discrete skills, which are the “building blocks,” or the prerequisites to specific behaviors. Learning behaviors, for example, are supported by children’s self-regulatory skills (and corresponding lower levels of behavior problems). Learning behaviors are also supported by children’s executive function skills, which consist of (1) the ability to flexibly shift attention among different pieces of infor-mation; (2) the ability to control one’s immediate or automatic response in favor of a planned response (inhibitory control); and (3) working (or short-term) memory.
Social behaviors are supported by children’s ability to read and effectively interpret others’ emotions, express their own emotions, engage in cooperative play, generate competent solutions to social problems when they arise, and negotiate with peers when there are disagreements.
While learning behaviors and social behaviors each depend on the development of a distinct set of skills, they are also clearly interdependent. For example, children must be able to regu-late their behavior in order to engage in both learning activities and social interactions. Thus, even interventions that target a relatively narrow range of skills may ultimately affect a broad range of outcomes, in part through interactions between the skills that are directly affected and other skills that the child possesses.
_____________________________
*Center on the Social and Emotional Foundations for Early Learning (2008); Yates et al. (2008).
6
ments are The Incredible Years, PATHS, and Tools of the Mind—Play.15 Since these enhance-ments were designed for 4-year-olds, the theories of change underlying the enhancements are most relevant for this age group.
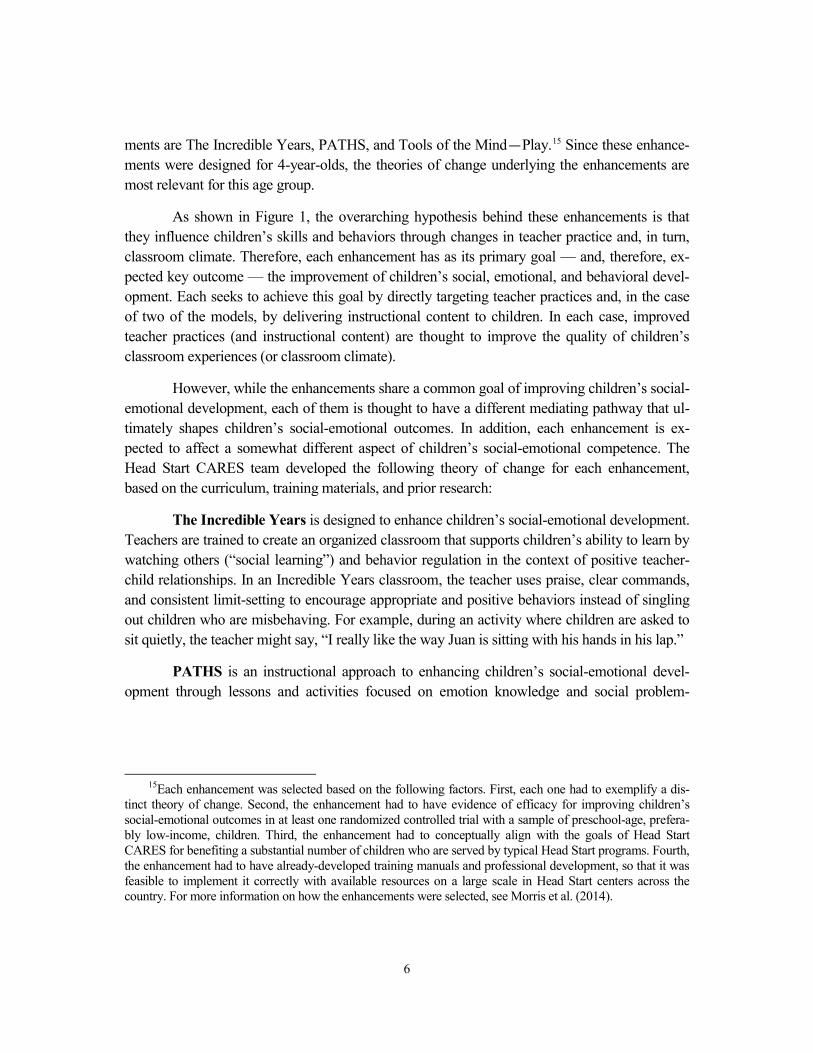
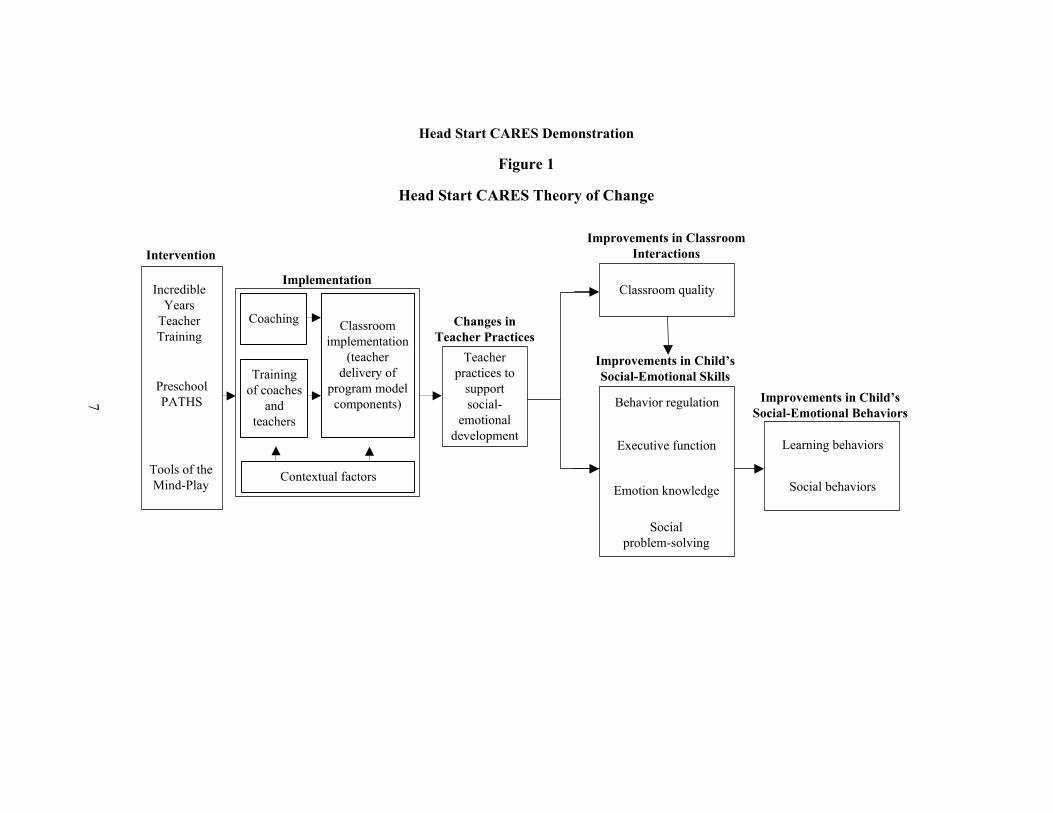
As shown in Figure 1, the overarching hypothesis behind these enhancements is that they influence children’s skills and behaviors through changes in teacher practice and, in turn, classroom climate. Therefore, each enhancement has as its primary goal — and, therefore, ex-pected key outcome — the improvement of children’s social, emotional, and behavioral devel-opment. Each seeks to achieve this goal by directly targeting teacher practices and, in the case of two of the models, by delivering instructional content to children. In each case, improved teacher practices (and instructional content) are thought to improve the quality of children’s classroom experiences (or classroom climate).
However, while the enhancements share a common goal of improving children’s social-emotional development, each of them is thought to have a different mediating pathway that ul-timately shapes children’s social-emotional outcomes. In addition, each enhancement is ex-pected to affect a somewhat different aspect of children’s social-emotional competence. The Head Start CARES team developed the following theory of change for each enhancement, based on the curriculum, training materials, and prior research:
The Incredible Years is designed to enhance children’s social-emotional development. Teachers are trained to create an organized classroom that supports children’s ability to learn by watching others (“social learning”) and behavior regulation in the context of positive teacher-child relationships. In an Incredible Years classroom, the teacher uses praise, clear commands, and consistent limit-setting to encourage appropriate and positive behaviors instead of singling out children who are misbehaving. For example, during an activity where children are asked to sit quietly, the teacher might say, “I really like the way Juan is sitting with his hands in his lap.”
PATHS is an instructional approach to enhancing children’s social-emotional devel-opment through lessons and activities focused on emotion knowledge and social problem-
15Each enhancement was selected based on the following factors. First, each one had to exemplify a dis-
tinct theory of change. Second, the enhancement had to have evidence of efficacy for improving children’s social-emotional outcomes in at least one randomized controlled trial with a sample of preschool-age, prefera-bly low-income, children. Third, the enhancement had to conceptually align with the goals of Head Start CARES for benefiting a substantial number of children who are served by typical Head Start programs. Fourth, the enhancement had to have already-developed training manuals and professional development, so that it was feasible to implement it correctly with available resources on a large scale in Head Start centers across the country. For more information on how the enhancements were selected, see Morris et al. (2014).
Incredible Years
Classroom Manageme
nt
Intervention
Executive function
Behavior regulation
Emotion knowledge
Preschool PATHS
Tools of the Mind-Play
Social problem-solving
Head Start CARES Demonstration
Figure 1
Head Start CARES Theory of Change
Teacher practices to
support social-
emotional development
Classroom quality
Improvements in Child’s Social-Emotional Skills
Changes in Teacher Practices
Improvements in Classroom Interactions
Implementation
Coaching
Training of coaches
and teachers
Classroom implementation
(teacher delivery of
program model components)
Contextual factorsSocial behaviors
Learning behaviors
Improvements in Child’s Social-Emotional Behaviors
Incredible Years
Teacher Training
7
8
solving skills,16 as well as through teacher modeling and support. In a PATHS classroom, teachers talk about their feelings and encourage children to think about their and others’ feelings in order to help children understand and learn about emotions in the context of social interac-tions. For example, in a group activity, the teacher might point out children who are happy, not-ing facial cues (such as a smile) that show how these children feel.
Tools of the Mind—Play requires teachers to restructure the room and school day, with large blocks of time devoted to supporting and structuring (or “scaffolding”) children’s make-believe (or “pretend”) play.17 By scaffolding students’ play, teachers aim to enhance the children’s planning skills, understanding of social roles, memory and capacity for focused attention, and social-emotional understanding. A central component of Tools of the Mind—Play is a daily 50-minute block of time devoted to make-believe play that is scaffolded by teachers. For example, in a Tools of the Mind—Play classroom, a child might draw a picture showing that she intends to play house and will be the mother. Through a series of exchanges with the child, the teacher would seek to help expand the complexity of the child’s role play by asking questions like, “What will you do as the mother? How could you make dinner for your child? How would you get the food to cook dinner?” In doing so, the teacher helps to build the child’s self-regulation, planning, and ability to assume various perspectives through the role-playing activity.
The enhancement-driven improvements in children’s social-emotional outcomes are important in and of themselves, given links between early social-emotional difficulties and later problems with peer relationships, mental health, and delinquency.18 In addition, some research-ers have hypothesized that improvements in social-emotional outcomes lead to positive changes in children’s cognitive and pre-academic outcomes.19 However, others have raised concerns that an increased focus on social-emotional learning might limit the instructional time spent on pre-academic skills, like reading and math. Because cognitive and pre-academic outcomes were not the direct targets of the Head Start CARES enhancements and in light of mixed evidence for whether programs aimed at social-emotional competencies improve children’s pre-academic skills, impacts on 3-year-olds’ pre-academic skills were not expected. Moreover, any effects on pre-academic skills would have occurred indirectly through changes in social, emotional, and behavioral outcomes (for example, by supporting children’s ability to stay on task at school). As
16For definitions of these and other terms, see the glossary in Appendix G. 17Scaffolding is the act of helping a child accomplish a challenging task or acquire a skill that is just be-
yond the child’s current ability level. 18Arnold et al. (2006); Biederman et al. (2001); Broidy et al. (2003); Ladd and Burgess (1999). 19Ladd, Birch, and Buhs (1999); McClelland, Morrison, and Holmes (2000); Raver, Garner, and Smith-
Donald (2007).
9
such, exploration of effects on these outcomes was considered secondary to whether there were effects on social-emotional outcomes.
How the Head Start CARES Enhancements Might Affect 3-Year-Olds The current study offers a unique opportunity to explore impacts of the Head Start CARES en-hancements on 3-year-olds. At the outset of Head Start CARES, it was unclear whether 3-year-olds would benefit from the program enhancements because prior research and the theory of change developed by the Head Start CARES research team had focused primarily on 4-year-olds. In fact, while 3-year-olds have been included in some of the studies, no study has exam-ined the effects of these enhancements on 3-year-olds exclusively.
One possibility was that the underlying theory might generalize to younger children. This suggests that 3-year-olds would benefit from exposure to the classroom-based enhance-ments. That is, the enhancements might produce changes in teacher practice, instruction, and classroom climate that would lead to improvements in 3-year-olds’ social, emotional, and be-havioral development.
In support of this hypothesis, a small number of previous studies that included both 3-year-olds and 4-year-olds showed some promising results.20 Yet, these studies did not distin-guish between impacts on 3- and 4-year-olds, making it difficult to know which age group was driving the results. For example, The Incredible Years has been tested in five published random-ized controlled trials conducted with children from low-income families in the United States. Two of these trials combined The Incredible Years with clinical classroom consultation and stress management training, and included 3-year-olds in the sample. Impacts on children’s social-emotional outcomes in these two trials were moderate to large, with effect sizes ranging from 0.27 to 0.89.21 (See Box 2 for a discussion of effect sizes and how to interpret them.) A third trial that included children who ranged from 3 to 8 years of age combined the Incredible Years curriculum with another program focused on children’s social skills and problem-solving. Positive impacts were found on children’s social-emotional school readiness, use of problem-solving strategies, and identification of positive feelings.22 An additional trial that targeted pre-
20Barnett et al. (2008); Domitrovich, Cortes, and Greenberg (2007); Morris et al. (2010); Raver et al.
(2009). 21See Morris et al. (2013); Raver et al. (2009). For the other The Incredible Years studies, see Murray,
Murr, and Rabiner (2012); Reid, Webster-Stratton, and Hammond (2003); Webster-Stratton, Reid, and Ham-mond (2001, 2004).
22Webster-Stratton, Reid, and Stoolmiller (2008).
10
Box 2
Understanding and Contextualizing Effect Sizes
An effect size is a standardized measure of the magnitude of an impact. It allows for com-parisons of the potential substantive importance of impacts on 3-year-olds across outcomes in Head Start CARES and with results from other studies that tested similar interventions or were conducted in similar policy contexts.* For example, in an earlier evaluation of the full (two-year) Tools of the Mind curriculum that included both 3- and 4-year-olds, a statistical-ly significant impact was found on a teacher-reported measure of total behavior problems with an effect size of 0.47 of a standard deviation (in absolute value).† By comparison, in Head Start CARES, Tools of the Mind—Play had a nonsignificant impact on 3-year-olds’ teacher-reported behavior problems with an effect size of 0.02 of a standard deviation. This comparison reveals that the earlier Tools of the Mind evaluation yielded an impact on chil-dren’s behavior problems that was approximately 24 times the size of the impact seen in the current analysis.
In some cases, however, little prior evidence is available to make comparative inferences about the magnitude of impact estimates. In the absence of this information, commonly used rules of thumb can be used as guidelines for characterizing the magnitude of the impact es-timates. These thresholds might differ depending on the outcomes being investigated. For example, for outcomes defined for teacher practice and classroom climate, larger impacts might be expected because teachers were the direct targets of the enhancements in Head Start CARES. For children’s social and emotional outcomes, somewhat smaller impacts might be expected because the enhancements are expected to affect the outcomes indirectly through changes in teacher practice and classroom climate. In this report, based on bench-marks gleaned from prior evaluation research in this area, impacts on teacher practice with effect sizes that were less than 0.40 of a standard deviation were considered small; those be-tween 0.40 and 0.80 were considered moderate; and those with effect sizes above 0.80 were considered large.‡ In contrast, for teacher-reported child outcomes, impacts were generally considered small if they were smaller than 0.20; those that were between 0.20 and 0.40 were considered moderate; and those above 0.40 were considered large.§ These benchmarks are consistent with those used in the Head Start CARES impact report on 4-year-olds.||
___________________
*Bloom, Hill, Black, and Lipsey (2008). †Barnett et al. (2008). The standard deviation is a measure of how widely dispersed data are around their mean. ‡For instance, in the Foundations of Learning demonstration, which evaluated impacts on preschool classroom management, the teacher practice effect sizes that were measured using CLASS were mod-erate (0.46 for teacher sensitivity) to large (‒0.90 for negative climate) (Morris et al., 2010). In CSRP (formerly known as the Chicago School Readiness Project), CLASS impacts ranged from 0.52 to 0.89 (Raver et al., 2008). In the Head Start REDI (Research-based, Developmentally Informed) study, CLASS impacts ranged from 0.39 to 0.61. These impacts on teacher practice were also sufficiently large to lead to impacts on child outcomes (Domitrovich et al., 2009; Morris et al., 2010). §Barnett et al. (2008); Domitrovich, Cortes, and Greenberg (2007); Raver et al. (2009). ||Morris et al. (2014).
11
school children who had elevated levels of behavior problems and included 3-year-olds evaluat-ed the effectiveness of an adapted version of The Incredible Years, which included a parent training component and provided children with individualized mental health consultation.23 The program succeeded in reducing children’s disruptive behaviors.
Elsewhere, PATHS has been tested in three published randomized controlled trials in-volving Head Start, either alone or with a literacy or professional development component. One of these trials included 3-year-olds and found moderate to large impacts on children’s social-emotional outcomes, with effect sizes ranging from 0.24 to 0.50 in magnitude.24
Last, Tools of the Mind (the original two-year program) had been tested in one pub-lished randomized controlled trial at the beginning of the Head Start CARES study. This trial was conducted in an urban preschool and found a large impact on children’s problem behaviors, with an effect size of 0.47.25 The sample included both 3- and 4-year-olds.
Alternatively, differences in the social-emotional competencies of 3-year-olds and 4-year-olds could lead to predictions that the Head Start CARES enhancements would result in fewer benefits for 3-year-olds. Indeed, early childhood is a period of dramatic development in children’s cognitive, language, and motor development. For example, a growing body of re-search shows that at approximately 4 years of age, children undergo marked improvements in their inhibitory control (the ability to control one’s immediate or automatic response in favor of a planned response) and working memory (the ability to hold information in one’s mind), which are key components of executive function skills.26 Significant growth also occurs between ages 3 and 4 in children’s oral language and print knowledge,27 theory of mind,28 and motor skills.29 Children’s ability to understand the content of the Head Start CARES enhancements and to par-ticipate in enhancement activities might be expected to vary depending on their skills in these areas. It may be that many 3-year-olds are not developmentally ready to benefit from the en-hancements as hypothesized by the models’ theory of change developed by the Head Start CARES team. In fact, in the early stages of the demonstration, program developers conveyed
23Williford and Shelton (2008). 24The randomized trial of PATHS that included 3-year-olds examined PATHS alone (Domitrovich, Cor-
tes, and Greenberg, 2007). 25Barnett et al. (2008). Three additional trials of Tools of the Mind were conducted over the course of the
Head Start CARES trial, although none showed positive effects of the program (Clements, Sarama, Unlu, and Layzer, 2012; Farran, Lipsey, and Wilson, 2012; Lonigan and Phillips, 2012).
26Blair and Razza (2007); Diamond (2002). 27Print knowledge includes children’s knowledge of the names of letters and the sounds they represent,
and the conventions and functions of print (Lonigan, Burgess, and Anthony, 2000). 28Theory of mind is the ability to attribute mental states (such as desires, emotions, beliefs, and intentions)
to oneself and others (Wellman, Cross, and Watson, 2001). 29Morris, Williams, Atwater, and Wilmore (1982).

12
mixed hypotheses about the extent to which 3-year-olds would benefit from the enhancements, because of concerns that younger children might struggle with parts of the curricula and require more support than older children.
Moreover, theory might predict that each of the particular enhancements chosen for Head Start CARES would have different effects on 3-year-olds. This is because the enhance-ments differ in the specific competencies they target, in the strategies used to improve those competencies, and in the cognitive complexity that each enhancement demands of young chil-dren. The focus of The Incredible Years on behavior regulation through social learning (that is, learning from watching others) may be more readily accessible to 3-year-olds than directly in-structing children to select from a repertoire of emotions and solutions to social problems, as emphasized in PATHS, or targeting of more demanding regulatory skills through mature and advanced pretend play, as emphasized by Tools of the Mind—Play.
For example, in a PATHS classroom, children are directly instructed how to identify emotions by finding the people in a picture who look happy and how to explain how they know the people are happy. The teacher then supports the children in applying these skills in their so-cial interactions. Children are expected to build emotion knowledge through direct instruction and to demonstrate social problem-solving skills, including the ability to recognize and regulate emotions, define problems, and engage in planning by considering the consequences of differ-ent solutions. These tasks and skills are likely to be more difficult for 3-year-olds than for 4-year-olds, given that emotion skills are developing rapidly during this period.30 In a Tools of the Mind—Play classroom, children are asked to plan their pretend play, either by writing a de-scription of it or drawing a picture, to engage in a conversation with the teacher about extending their play so that it is more advanced, and to enact their plan through pretend play. These tasks require planning skills, an understanding of social roles, and self-regulatory skills — including mental flexibility, memory, the ability to focus attention, and inhibitory control. All these skills grow significantly over the preschool period and, therefore, are more challenging for 3-year-olds than for 4-year-olds.31
The Current Analysis: An Opportunity to Explore the Impacts of the Head Start CARES Enhancements on 3-Year-Olds The Head Start CARES study is distinctive because it allows for the separate exploration of social-emotional program impacts on 3-year-olds within the framework of a rigorous random assignment research design. This is unlike previous evaluations of the enhancements, in which
30See, for example, Cole, Michel, and Teti (1994). 31See, for example, Diamond (2002).

13
3- and 4-year-olds were grouped together in the impact analysis. Yet, despite this opportunity, this analysis still has some limitations. Because of uncertainty about whether and how the en-hancements might affect 3-year-olds, Head Start CARES was not explicitly designed to test the impacts of the enhancements on this age group. Therefore, only some of the classrooms in-volved in the study served both 3- and 4-year-old children and, for the 3-year-olds in these classrooms, a limited set of teacher-reported measures of children’s social-emotional outcomes were collected. These factors have several implications for the design of the impact analysis for mixed-age classrooms and the 3-year-olds in them.
First, the analysis has somewhat limited power to detect impacts of the enhancements that are small or moderate in size, given that only a subset of classrooms and children are in-cluded in the analysis. This is particularly relevant when testing impacts of each enhancement separately, and when exploring outcomes for teachers and classrooms rather than for individual children. The discussion of the impacts in this report highlights the two places where this lim-ited statistical power seems noteworthy.
Second, data on key outcomes of interest for the PATHS and Tools of the Mind—Play enhancements — children’s executive function skills, emotion knowledge, and social problem-solving skills32 — were not collected for 3-year-olds in the study.33 The research team’s theory of change for 4-year-olds suggests that the three enhancements have the potential to improve children’s social-emotional development in two key domains of skills: (1) behavior regulation and executive function; and (2) emotion knowledge and social problem-solving skills. In turn, improvements in these skills could lead to improvements in learning behaviors and social be-haviors. This analysis is missing information that would help determine whether PATHS and Tools of the Mind—Play affect children’s social-emotional development.
Third, all measures of 3-year-olds’ social, emotional, and behavioral competencies were collected using teacher reports. Teacher reports are informative because the way in which teach-ers see the children in their classes and build relationships with them can shape children’s early schooling experiences. However, exclusive reliance on teacher reports can be a shortcoming: Teachers’ ratings may be influenced by their own perceptions, including those related to their involvement in the program. Even if children’s actual behaviors did not change, it is possible that teachers who were trained in the Head Start CARES enhancements had different perceptions of children’s behavior than did teachers in control group classrooms who were not trained.
32See the glossary (Appendix G) for definitions of these and other terms. 33The Incredible Years also targeted executive function skills. However, because data were collected for
two out of the three key outcomes targeted by The Incredible Years, the lack of information about executive function skills is thought to be less of an issue for establishing the effects of the enhancement on 3-year-olds.
14
Taken together, the exploration of the enhancements’ impacts on 3-year-olds presents an opportunity to add to the literature and generate hypotheses that guide future intervention research in this area. It will be important to learn whether future studies can confirm the findings presented here before making decisions about appropriate policy and practice. Fur-thermore, because the analysis cannot inform the extent to which the enhancements might benefit 3-year-olds in classrooms that serve only 3-year-olds, it will be important for future research to explore whether the results presented here generalize to other contexts and class-room configurations.
Research Questions Explored in This Report
Given the lack of strong a priori hypotheses about the likely impacts of the Head Start CARES enhancements on 3-year-old children, as well as limitations in the design of the impact analysis for this age group, the questions addressed in this analysis are considered exploratory. Each research question was addressed in two ways. First, in the absence of hypotheses about how the individual enhancements would affect 3-year-olds and because greater statistical power can be leveraged with pooled research questions, the analysis first tested for impacts when the data were combined across the three enhancements. This analysis focuses on whether any of the enhancements affects class-level and child outcomes and maximizes statistical power. Second, the analysis tested the impacts of each enhancement separately in addition to testing them in the aggregate.
As context for understanding the impacts on children, the analysis begins with an exam-ination of impacts on class-level measures of teacher practice and classroom climate. The sec-ond question explored is whether the enhancements affect 3-year-old children’s social and emo-tional development. Finally, the third research question examines whether the enhancements affect 3-year-olds’ pre-academic skills. The expectation was that any changes in these skills would result from improvements in children’s social-emotional competencies.
More specifically, this report explores the following questions:
1. What were the impacts of the Head Start CARES enhancements, when tested as a group and separately, on class-level measures of teacher practice and classroom climate, for the subset of mixed-age classrooms that included 3-year-old children?
2. Did the enhancements, when tested as a group and separately, improve social-emotional outcomes, as reported by teachers at the end of the preschool year, for 3-year-old children in enhancement classrooms compared with their peers in control group classrooms?
15
3. Even though they did not directly target 3-year-old children’s pre-academic skills, did the enhancements, when tested as a group and separately, have an effect on pre-academic skills, as assessed in teacher reports, for children in en-hancement classrooms compared with their peers in control group classrooms?
Design of Head Start CARES
Selection and Recruitment
The full sample for Head Start CARES was selected using Head Start grantees or dele-gate agencies.34 It was designed to reflect the racial, ethnic, and cultural diversity of children in Head Start centers across the country, but was not selected to be statistically representative of all Head Start grantees in the United States. The grantees participating in Head Start CARES may not be representative because they were willing to reply to the research team’s initial inquiry, to provide follow-up information, and to agree to a site visit. All of this indicates that they were amenable to participating in a demonstration aimed at learning about the effectiveness of class-room-based approaches to supporting children’s social and emotional development, although they may have lacked the resources, infrastructure, or knowledge to implement social and emo-tional curricula on their own. Furthermore, programs that were already implementing strong social and emotional curricula were excluded from the study, so the Head Start CARES sample likely does not represent the universe of grantees that may be most invested in supporting chil-dren’s development in this area.
Characteristics of Grantees, Centers, Classrooms, and Children in the Current Sample
The impact analysis described in this report uses a subset of grantees, centers, class-rooms, and children from the overall Head Start CARES sample. The 3-year-olds included in this analysis were served in mixed-age classrooms located in 56 Head Start centers within 9 of the 17 grantees in the full Head Start CARES sample. The nine grantees were located in five states in three regions of the country, with five in the Midwest/Plains, three in the West, and one in the South. Four of these grantees were operated by community action agencies,35 four were
34See Appendix A for more information about the full Head Start CARES sample selection and recruit-ment process.
35A community action agency is a public or private nonprofit organization, funded primarily by a Com-munity Services Block Grant to administer and coordinate programs on a communitywide basis. These agen-cies provide services that address the full range of family needs, from child development programs to youth and adult employment and training programs, and services for seniors. Stand-alone nonprofit entities, such as churches or nonprofit hospitals, do not have government affiliations. For more information, see the National Community Action Foundation website at www.ncaf.org.
16
operated by stand-alone nonprofit organizations, and one was operated in a large local school system. Two of the nine grantees were “small” (enrolling fewer than 800 children), four were “medium” (enrolling between 800 and 1,500 children), and three were “large” (enrolling more than 1,500 children). Seven of the nine grantees were located in metropolitan areas. One-third served largely African-American children, one-third served largely Hispanic children, and one-third served a mix of children of different racial and ethnic backgrounds. Five grantees had 4 participating centers each, three had 8 participating centers each, and one had 12 participating centers.
In the current sample, an average of three classrooms per center participated in the Head Start CARES demonstration, although there was variation around this mean, with between one and six classrooms participating per center. A typical Head Start CARES mixed-age classroom had a minimum of one lead teacher and one assistant teacher.36 Just over half of participating classrooms were full-day classrooms (55 percent), and just under half were part-day classrooms (45 percent).37 Some of the part-day classrooms operated as double sessions, with one class in the morning and a second, separate class in the afternoon.38 Only the first session in these multiple-session classrooms was included in the Head Start CARES study.
Each grantee implemented the Head Start CARES social-emotional enhancement on top of a “base curriculum.” Seven mixed-age Head Start CARES grantees used the Creative Curriculum and two grantees used High/Scope as their base curriculum.39 This is consistent with Head Start programs nationwide, in which nearly 70 percent use the Creative Curriculum or High/Scope curriculum.40
Table 1 shows classroom and teacher characteristics at baseline for the sample of mixed-age classrooms that included 3-year-olds, across the Head Start CARES enhancement and control groups. (See Box 3 for information about the measures of teacher practice and class-
36All teacher data presented in the report are for lead teachers. 37In Head Start CARES, a part-day classroom met for 3.5 hours or less in either the morning or the after-
noon. A full-day class was defined as one that met for more than 3.5 hours a day. 38Double sessions are classrooms with morning and afternoon sessions taught by the same teaching team
but with different children in attendance. 39The Creative Curriculum for Preschool is based on five fundamental principles that guide practice
and help intentionally set up preschool programs; see www.creativecurriculum.net for more information. High/Scope is a comprehensive curriculum and teaching practice that focuses on six dimensions of school readiness; see www.highscope.com for more information.
40Aikens et al. (2011).
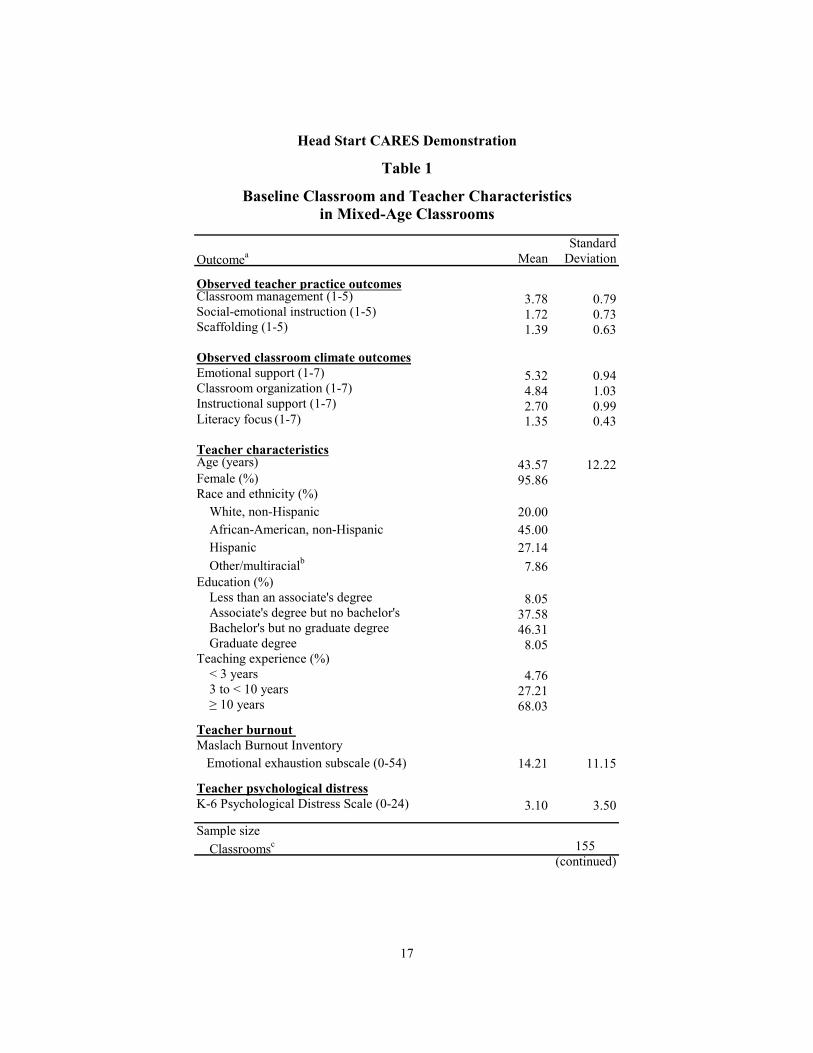
17
StandardOutcomea Mean Deviation
Observed teacher practice outcomesClassroom management (1-5) 3.78 0.79Social-emotional instruction (1-5) 1.72 0.73Scaffolding (1-5) 1.39 0.63
Observed classroom climate outcomesEmotional support (1-7) 5.32 0.94Classroom organization (1-7) 4.84 1.03Instructional support (1-7) 2.70 0.99Literacy focus (1-7) 1.35 0.43
Teacher characteristicsAge (years) 43.57 12.22Female (%) 95.86Race and ethnicity (%)
White, non-Hispanic 20.00African-American, non-Hispanic 45.00Hispanic 27.14Other/multiracialb 7.86
Education (%)Less than an associate's degree 8.05Associate's degree but no bachelor's 37.58Bachelor's but no graduate degree 46.31Graduate degree 8.05
Teaching experience (%)< 3 years 4.763 to < 10 years 27.21≥ 10 years 68.03
Teacher burnout Maslach Burnout Inventory
Emotional exhaustion subscale (0-54) 14.21 11.15
Teacher psychological distressK-6 Psychological Distress Scale (0-24) 3.10 3.50
Sample sizeClassroomsc 155
(continued)
Head Start CARES Demonstration
Table 1
Baseline Classroom and Teacher Characteristicsin Mixed-Age Classrooms
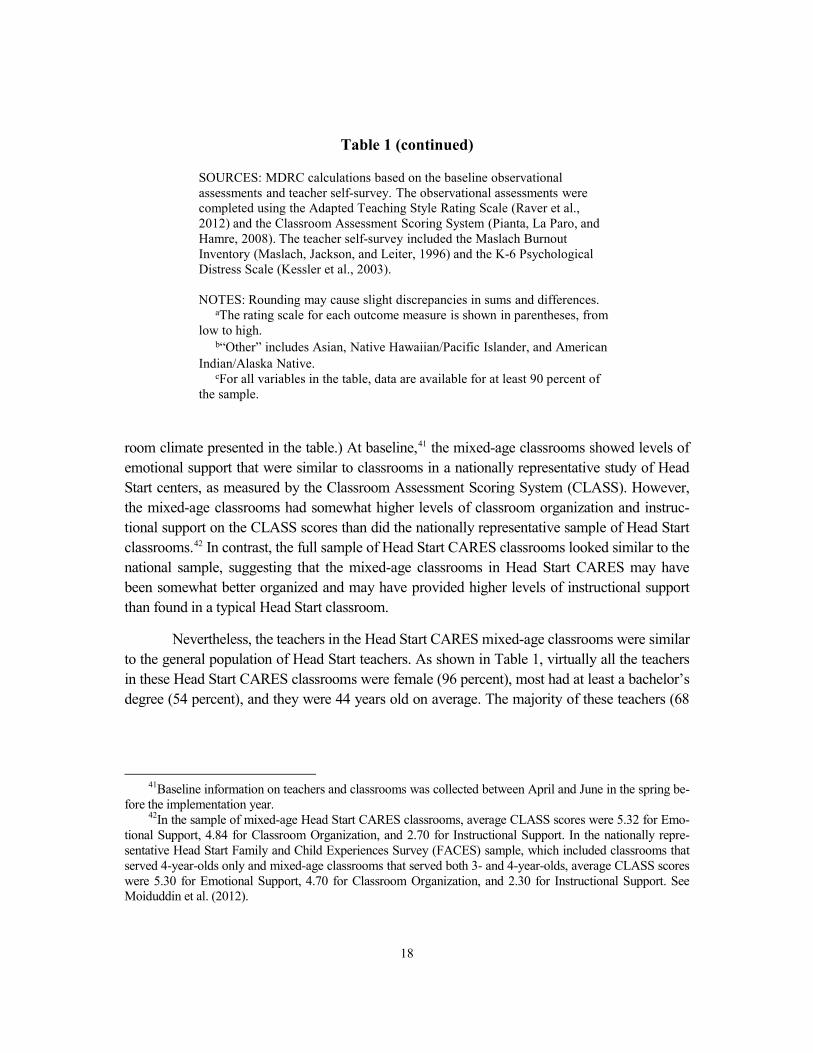
18
room climate presented in the table.) At baseline,41 the mixed-age classrooms showed levels of emotional support that were similar to classrooms in a nationally representative study of Head Start centers, as measured by the Classroom Assessment Scoring System (CLASS). However, the mixed-age classrooms had somewhat higher levels of classroom organization and instruc-tional support on the CLASS scores than did the nationally representative sample of Head Start classrooms.42 In contrast, the full sample of Head Start CARES classrooms looked similar to the national sample, suggesting that the mixed-age classrooms in Head Start CARES may have been somewhat better organized and may have provided higher levels of instructional support than found in a typical Head Start classroom.
Nevertheless, the teachers in the Head Start CARES mixed-age classrooms were similar to the general population of Head Start teachers. As shown in Table 1, virtually all the teachers in these Head Start CARES classrooms were female (96 percent), most had at least a bachelor’s degree (54 percent), and they were 44 years old on average. The majority of these teachers (68
41Baseline information on teachers and classrooms was collected between April and June in the spring be-
fore the implementation year. 42In the sample of mixed-age Head Start CARES classrooms, average CLASS scores were 5.32 for Emo-
tional Support, 4.84 for Classroom Organization, and 2.70 for Instructional Support. In the nationally repre-sentative Head Start Family and Child Experiences Survey (FACES) sample, which included classrooms that served 4-year-olds only and mixed-age classrooms that served both 3- and 4-year-olds, average CLASS scores were 5.30 for Emotional Support, 4.70 for Classroom Organization, and 2.30 for Instructional Support. See Moiduddin et al. (2012).
Table 1 (continued)
SOURCES: MDRC calculations based on the baseline observational assessments and teacher self-survey. The observational assessments were completed using the Adapted Teaching Style Rating Scale (Raver et al., 2012) and the Classroom Assessment Scoring System (Pianta, La Paro, and Hamre, 2008). The teacher self-survey included the Maslach Burnout Inventory (Maslach, Jackson, and Leiter, 1996) and the K-6 Psychological Distress Scale (Kessler et al., 2003).
NOTES: Rounding may cause slight discrepancies in sums and differences.aThe rating scale for each outcome measure is shown in parentheses, from
low to high.b“Other” includes Asian, Native Hawaiian/Pacific Islander, and American
Indian/Alaska Native.cFor all variables in the table, data are available for at least 90 percent of
the sample.
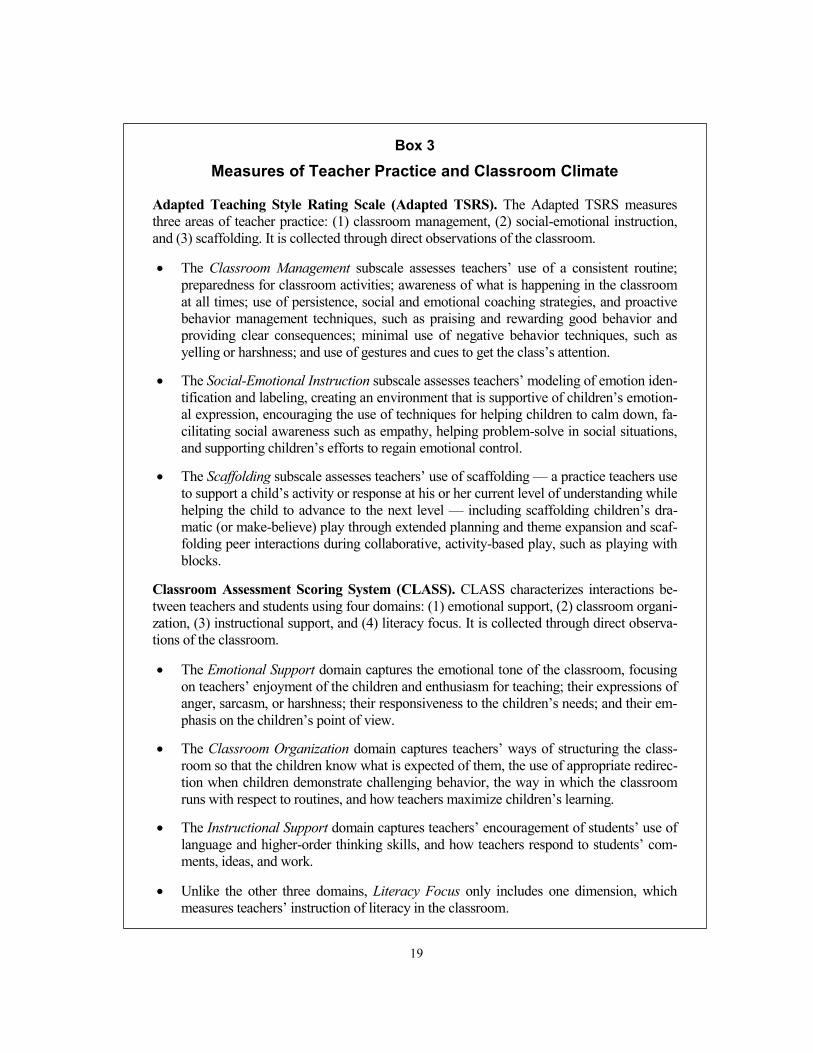
19
Box 3
Measures of Teacher Practice and Classroom Climate
Adapted Teaching Style Rating Scale (Adapted TSRS). The Adapted TSRS measures three areas of teacher practice: (1) classroom management, (2) social-emotional instruction, and (3) scaffolding. It is collected through direct observations of the classroom.
• The Classroom Management subscale assesses teachers’ use of a consistent routine; preparedness for classroom activities; awareness of what is happening in the classroom at all times; use of persistence, social and emotional coaching strategies, and proactive behavior management techniques, such as praising and rewarding good behavior and providing clear consequences; minimal use of negative behavior techniques, such as yelling or harshness; and use of gestures and cues to get the class’s attention.
• The Social-Emotional Instruction subscale assesses teachers’ modeling of emotion iden-tification and labeling, creating an environment that is supportive of children’s emotion-al expression, encouraging the use of techniques for helping children to calm down, fa-cilitating social awareness such as empathy, helping problem-solve in social situations, and supporting children’s efforts to regain emotional control.
• The Scaffolding subscale assesses teachers’ use of scaffolding — a practice teachers use to support a child’s activity or response at his or her current level of understanding while helping the child to advance to the next level — including scaffolding children’s dra-matic (or make-believe) play through extended planning and theme expansion and scaf-folding peer interactions during collaborative, activity-based play, such as playing with blocks.
Classroom Assessment Scoring System (CLASS). CLASS characterizes interactions be-tween teachers and students using four domains: (1) emotional support, (2) classroom organi-zation, (3) instructional support, and (4) literacy focus. It is collected through direct observa-tions of the classroom.
• The Emotional Support domain captures the emotional tone of the classroom, focusing on teachers’ enjoyment of the children and enthusiasm for teaching; their expressions of anger, sarcasm, or harshness; their responsiveness to the children’s needs; and their em-phasis on the children’s point of view.
• The Classroom Organization domain captures teachers’ ways of structuring the class-room so that the children know what is expected of them, the use of appropriate redirec-tion when children demonstrate challenging behavior, the way in which the classroom runs with respect to routines, and how teachers maximize children’s learning.
• The Instructional Support domain captures teachers’ encouragement of students’ use of language and higher-order thinking skills, and how teachers respond to students’ com-ments, ideas, and work.
• Unlike the other three domains, Literacy Focus only includes one dimension, which measures teachers’ instruction of literacy in the classroom.

20
percent) had taught for 10 years or more. Nationally, most Head Start lead teachers have at least a bachelor’s degree (64 percent), and the average Head Start teacher has taught for close to nine years.43
Teachers in mixed-age Head Start CARES classrooms also reported relatively low levels of emotional exhaustion and psychological distress at baseline (as shown in Table 1). On a measure of emotional exhaustion that asks about burnout, stress, and fatigue at work, teachers scored an av-erage of 14 on a scale of 0 to 54. On the K-6 Kessler Psychological Distress Scale, which measures psychological distress, teachers scored an average of 3 on a scale of 0 to 24, where a score of 13 is usually used as a cut-off to identify distress.44
The study sample included an average of six 3-year-old children per mixed-age classroom, out of an average of 12 children total. Table 2 shows child age and gender at baseline, as well as baseline measures of the child outcomes included in the impact analysis.45 (See Boxes 4 and 5 for information on measures.) Children in the sample were 3.5 years old on average. Half of them were female. At baseline, 3-year-olds scored on the low end of the measures of behavior problems and near the midpoint on most measures of learning and social behaviors. With regard to their relation-ships with their teachers, children in the sample scored on the high end of the measure of closeness with the teacher and on the low end of the measure of conflict with the teacher. Thus, overall, the 3-year-olds in the sample did not appear to be particularly at risk for less favorable social-emotional outcomes. They also scored on the low end of the measures of pre-academic skills. This is in line with expectations, given that this was likely the first early educational experience for most of these children.
Random Assignment
The Head Start CARES demonstration used a random assignment design to test the impact of each of the three enhancements on child outcomes. Centers within each grantee (or within smaller blocks of four or eight centers in larger grantees) were randomly assigned to one of four groups: (1) the Incredible Years enhancement group; (2) the PATHS enhancement group; (3) the Tools of the Mind—Play enhancement group; or (4) the control group.46 The present
43U.S. Department of Health and Human Services, Administration for Children and Families (2012). 44Kessler et al. (2003). 45Baseline information on children was collected between September and December in the fall of the year the
enhancements were implemented. 46See Appendix A for more information about the random assignment process in Head Start CARES. In some
cases, all centers within a grantee were similar enough in racial/ethnic composition and part-day/full-day pro-gramming that all centers within grantees could be randomly assigned in a single block. However, for some larger grantees, there were differences among groups of centers in racial/ethnic composition and part-day/full-day pro-gramming. Centers in these grantees were grouped into smaller four- or eight-center random assignment blocks, so that all the centers in each block were comparable across these characteristics.

21
StandardOutcomea Mean Deviation
DemographicsAge (years) 3.47 0.31Female (%) 50.65
Behavior problems (teacher report)Total score (0-52) 7.68 8.96
Externalizing (0-22) 3.24 4.44Hyperactivity (0-10) 2.30 2.58Internalizing (0-20) 2.13 3.14
Social behaviors (teacher report)Social Skills Rating Scale (0-60) 35.50 12.04
Assertion (0-20) 11.04 4.79Cooperation (0-20) 12.28 4.13Self-control (0-20) 12.16 4.41
Interpersonal skills (1-7) 5.24 1.02
Learning behaviors (teacher report)Work-related skills (1-7) 4.22 1.05
Student-teacher relationship (teacher report)4.08 0.701.85 0.91
Pre-academic skills (teacher report)General knowledge (1-5) 1.79 0.74Language and literacy (1-5) 1.63 0.65Mathematical thinking (1-5) 1.58 0.67
Sample sizeb
Children 852
Child Baseline Characteristics and Pre-Test Measures: 3-Year-Olds
Table 2Head Start CARES Demonstration
Closeness (1-5)Conflict (1-5)
SOURCES: MDRC calculations based on the teachers’ reports, including responses to the Behavior Problems Index (Zill, 1990), the Social Skills Rating Scale (Gresham and Elliot, 1990), the Cooper-Farran Behavioral Rating Scales (Cooper and Farran, 1991), the Student-Teacher Relationship Scale (Pianta, 2001), and the Academic Rating Scale (National Center for Education Statistics, n.d.).
NOTES: aThe rating scale for each outcome measure is shown in parentheses, from low to high.bFor all variables in the table, data are available for at least 95 percent of the sample.

22
analysis uses data from 56 of these centers distributed across 12 random assignment blocks with classrooms that served both 3- and 4-year-olds. The comparisons presented in Appendix Tables B.1 through B.6 show that there were very few statistically significant differences in the base-line characteristics of teachers, classrooms, and children in the program and control conditions, indicating that random assignment was successful.47
Analytic Approach
As noted earlier, there were no clear a priori hypotheses about how each of the three enhancements would affect 3-year-olds. Furthermore, statistical power was limited for the im-pact analysis involving mixed-age classrooms. In order to maximize the sample size and miti-gate the power limitations, the analysis first tested for impacts with the enhancements pooled, using all 155 classrooms. To isolate the impacts of the enhancements when tested in the aggre-gate, a second set of analyses explored the impacts of each enhancement on its own.
To estimate the impacts of the enhancements when tested as a group, analyses com-pared mean teacher- and class-level outcomes in the pooled program group (that is, teachers and classrooms from the three enhancements pooled together) with those for the control group. Sim-ilarly, analyses compared mean outcomes for the pooled sample of children in the program group with mean outcomes for children in the control group. To estimate the impacts that each enhancement had on teacher, classroom, and child outcomes, analyses compared the average outcomes for each enhancement group with the average outcomes for the control group. Multi-level modeling was used to account for the “nested” nature of the data, in which children were nested within classrooms and classrooms within centers. Fixed effects accounted for the nesting of centers within blocks. The models included a baseline measure of each outcome. As dis-cussed in Box 2, program impacts are shown in effect size units to allow for the comparison of findings in this report across outcomes that were measured on different scales, as well as com-parisons with findings from other studies.
Measures
According to the theory of change developed by the Head Start CARES research team, as discussed earlier, the three enhancements sought to improve children’s social, emotional, and behavioral development by improving teacher practice (and instructional content) and, in turn, improving classroom climate (the quality of children’s classroom experiences). To trace the pat-tern of impacts of the enhancements on these aspects of classrooms, measures of teacher prac-
47See Appendix C for results of sensitivity analyses conducted to examine whether the pattern of program
impacts on child outcomes changed when controls for differences in baseline child characteristics were includ-ed in the models.
23
tice and classroom climate were collected through direct observations of Head Start classrooms. See Box 3 for information about these measures.48
As explained earlier, the three enhancements have the potential to improve children’s skills in two key domains: (1) behavior regulation and executive function; and (2) emotion knowledge and social problem-solving skills. In turn, improvements in these skills could lead to improvements in learning behaviors and social behaviors. In addition, the enhancements could potentially lead to impacts in a fourth domain — pre-academic skills — although, as noted ear-lier, any impacts on these skills would likely occur indirectly through improvements in chil-dren’s social and emotional competencies.
For 3-year-olds in the study sample, indicators of some but not all of these outcomes were collected. All child outcomes were measured using teacher reports. (See Boxes 4 and 5 for information about the measures used.) Specifically, teacher reports of children’s behavior regu-lation, learning behaviors, and social behaviors were collected. Teacher reports of their relation-ships with individual children in the classroom were also collected. Finally, measures of chil-dren’s pre-academic skills were collected through teacher reports.49 Measures of children’s ex-ecutive function skills, emotion knowledge, and social problem-solving skills — key outcomes of interest for the PATHS and Tools of the Mind—Play enhancements — were not collected.
As noted above, teacher reports have strengths and limitations. Teacher reports can provide important information about how teachers see the children in their classes. However, teachers assigned to the Head Start CARES enhancement groups may have been likely to rate children differently from the way their control group colleagues did simply because they were involved in a social-emotional intervention. For instance, teachers trained in one of the en-hancements might have viewed children as better behaved because they knew the children in their classes had been exposed to a social-emotional intervention. On the other hand, if teach-ers were trained to be more aware of challenging behavior when it occurred, they might have rated children as less well-behaved than did control group teachers.50 Moreover, teacher ratings may have more “noise,” because teachers are not trained to rate behavior in a consistent man-ner and may be influenced by their own well-being. Therefore, in future studies, it will be im-
48See Appendix D for information on internal consistencies and the construction of these measures. 49The teacher-reported measures of 3-year-olds’ social-emotional and pre-academic outcomes were pri-
marily developed for use with 4-year-olds and were selected for use with 4-year-olds in Head Start CARES. Nevertheless, the means and distributions of items and composite scales in the 3-year-old sample showed good variation and growth over time (between baseline and follow-up). See Appendix D for information on internal consistencies, measurement work, and the construction of these measures.
50See Morris et al. (2013) for a discussion of how teacher training might “prime” teachers to see challeng-ing behaviors.
24
portant to replicate these findings with other independent sources of data, such as direct as-sessments and observations.
Data Collection and Response Rates
Baseline information about teachers and classrooms was collected between April and June in the spring before the study was implemented. Baseline information about children was collected between September and December in the year the enhancements were implemented. Preschool follow-up data were collected for teachers, classrooms, and children in the spring of the implementation year. Teachers completed self-surveys and reports on individual children between March and May.
Response rates were very high across data sources. Independent observers assessed 153 (98.71 percent) of the 155 mixed-age classrooms in the current sample at baseline and all 155 classrooms (100 percent) at follow-up. Most of the teachers (96.13 percent) completed the self-survey at baseline, and 100 percent did so at follow-up. Teachers completed reports for 96.93 percent of enrolled 3-year-olds at baseline and 100 percent of enrolled 3-year-olds at follow-up.
Impacts of the Head Start CARES Enhancements on Class-Level Outcomes in Mixed-Age Classrooms This section presents the estimated impacts of the enhancements on teacher practice and classroom climate to provide a context for interpreting the impacts of the enhancements on 3-year-olds’ social and emotional outcomes. The tables that follow show impacts on measures of teacher practice and classroom climate when the data for the enhancements are pooled, as well as impacts on measures of teacher practice and classroom climate separately for each enhancement.
Estimated Impacts on Class-Level Outcomes in the Pooled Sample
As noted previously, each enhancement targeted a different aspect of children’s social-emotional competence. However, the enhancements also had secondary foci, which resulted in some overlap across enhancements in the training that teachers received. For instance, The In-credible Years focuses largely on training teachers to support children’s positive behavior and apply limit-setting techniques; however, some time is also devoted to training teachers to sup-port children’s emotion knowledge, which is a central focus of PATHS. Similarly, although PATHS focuses primarily on social-emotional learning, it also supports classroom management skills — a target of The Incredible Years — which can help teachers who have a difficult time bringing children together for “circle time” lessons (large-group instruction activities). Finally, despite the focus on play and planning in Tools of the Mind—Play classrooms, more than one-
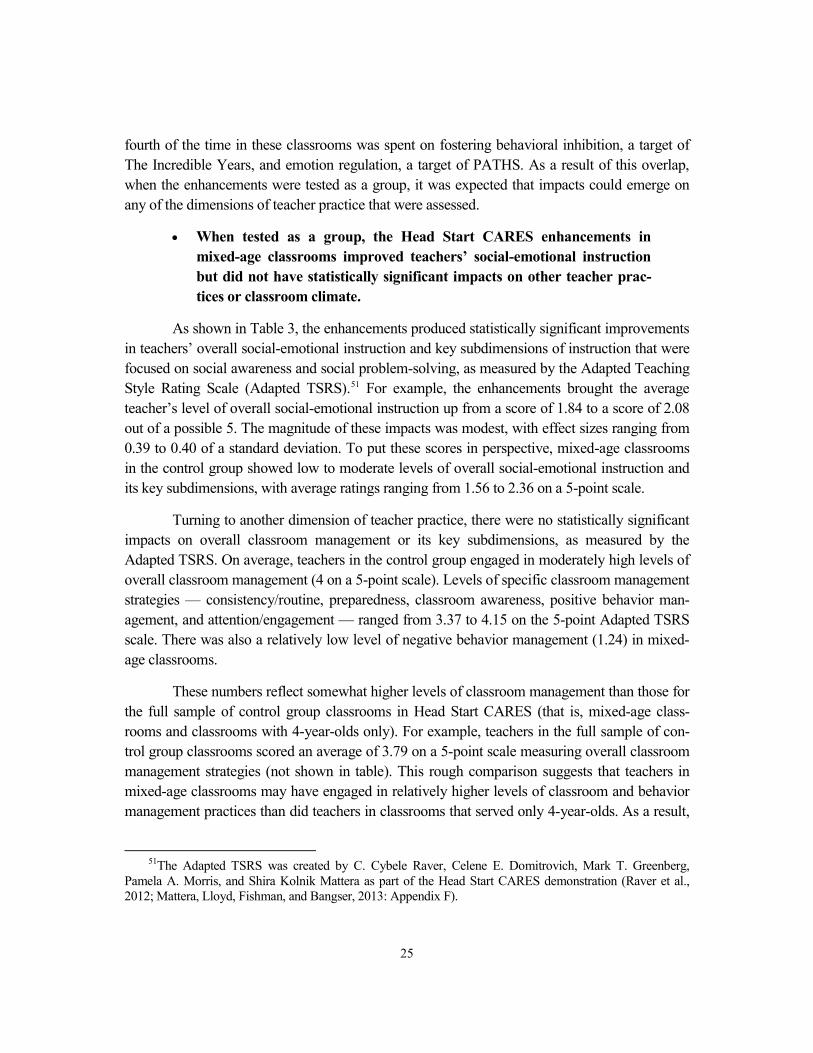
25
fourth of the time in these classrooms was spent on fostering behavioral inhibition, a target of The Incredible Years, and emotion regulation, a target of PATHS. As a result of this overlap, when the enhancements were tested as a group, it was expected that impacts could emerge on any of the dimensions of teacher practice that were assessed.
• When tested as a group, the Head Start CARES enhancements in mixed-age classrooms improved teachers’ social-emotional instruction but did not have statistically significant impacts on other teacher prac-tices or classroom climate.
As shown in Table 3, the enhancements produced statistically significant improvements in teachers’ overall social-emotional instruction and key subdimensions of instruction that were focused on social awareness and social problem-solving, as measured by the Adapted Teaching Style Rating Scale (Adapted TSRS).51 For example, the enhancements brought the average teacher’s level of overall social-emotional instruction up from a score of 1.84 to a score of 2.08 out of a possible 5. The magnitude of these impacts was modest, with effect sizes ranging from 0.39 to 0.40 of a standard deviation. To put these scores in perspective, mixed-age classrooms in the control group showed low to moderate levels of overall social-emotional instruction and its key subdimensions, with average ratings ranging from 1.56 to 2.36 on a 5-point scale.
Turning to another dimension of teacher practice, there were no statistically significant impacts on overall classroom management or its key subdimensions, as measured by the Adapted TSRS. On average, teachers in the control group engaged in moderately high levels of overall classroom management (4 on a 5-point scale). Levels of specific classroom management strategies — consistency/routine, preparedness, classroom awareness, positive behavior man-agement, and attention/engagement — ranged from 3.37 to 4.15 on the 5-point Adapted TSRS scale. There was also a relatively low level of negative behavior management (1.24) in mixed-age classrooms.
These numbers reflect somewhat higher levels of classroom management than those for the full sample of control group classrooms in Head Start CARES (that is, mixed-age class-rooms and classrooms with 4-year-olds only). For example, teachers in the full sample of con-trol group classrooms scored an average of 3.79 on a 5-point scale measuring overall classroom management strategies (not shown in table). This rough comparison suggests that teachers in mixed-age classrooms may have engaged in relatively higher levels of classroom and behavior management practices than did teachers in classrooms that served only 4-year-olds. As a result,
51The Adapted TSRS was created by C. Cybele Raver, Celene E. Domitrovich, Mark T. Greenberg,
Pamela A. Morris, and Shira Kolnik Mattera as part of the Head Start CARES demonstration (Raver et al., 2012; Mattera, Lloyd, Fishman, and Bangser, 2013: Appendix F).
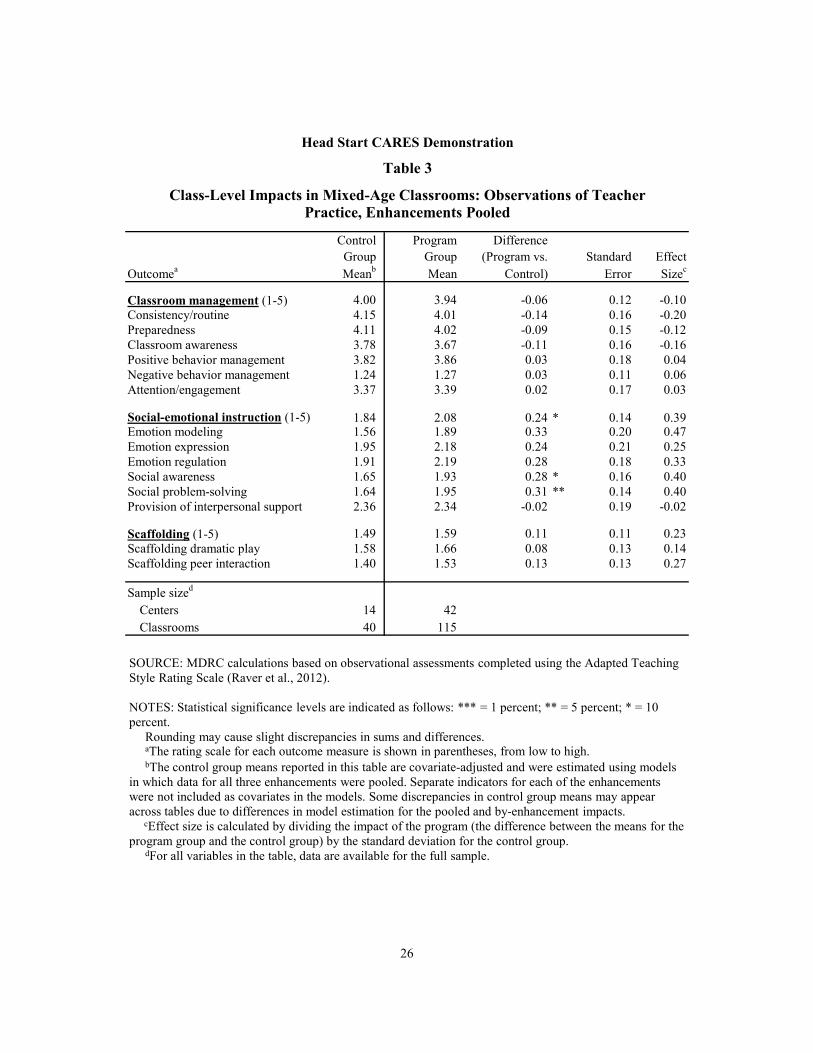
26
Control Program DifferenceGroup Group (Program vs. Standard Effect
Outcomea Meanb Mean Control) Error Sizec
Classroom management (1-5) 4.00 3.94 -0.06 0.12 -0.10Consistency/routine 4.15 4.01 -0.14 0.16 -0.20Preparedness 4.11 4.02 -0.09 0.15 -0.12Classroom awareness 3.78 3.67 -0.11 0.16 -0.16Positive behavior management 3.82 3.86 0.03 0.18 0.04Negative behavior management 1.24 1.27 0.03 0.11 0.06Attention/engagement 3.37 3.39 0.02 0.17 0.03
Social-emotional instruction (1-5) 1.84 2.08 0.24 * 0.14 0.39Emotion modeling 1.56 1.89 0.33 0.20 0.47Emotion expression 1.95 2.18 0.24 0.21 0.25Emotion regulation 1.91 2.19 0.28 0.18 0.33Social awareness 1.65 1.93 0.28 * 0.16 0.40Social problem-solving 1.64 1.95 0.31 ** 0.14 0.40Provision of interpersonal support 2.36 2.34 -0.02 0.19 -0.02
Scaffolding (1-5) 1.49 1.59 0.11 0.11 0.23Scaffolding dramatic play 1.58 1.66 0.08 0.13 0.14Scaffolding peer interaction 1.40 1.53 0.13 0.13 0.27
Sample sized
Centers 14 42Classrooms 40 115
Class-Level Impacts in Mixed-Age Classrooms: Observations of Teacher
Head Start CARES Demonstration
Practice, Enhancements Pooled
Table 3
SOURCE: MDRC calculations based on observational assessments completed using the Adapted Teaching Style Rating Scale (Raver et al., 2012).
NOTES: Statistical significance levels are indicated as follows: *** = 1 percent; ** = 5 percent; * = 10percent.
Rounding may cause slight discrepancies in sums and differences. aThe rating scale for each outcome measure is shown in parentheses, from low to high.bThe control group means reported in this table are covariate-adjusted and were estimated using models
in which data for all three enhancements were pooled. Separate indicators for each of the enhancements were not included as covariates in the models. Some discrepancies in control group means may appear across tables due to differences in model estimation for the pooled and by-enhancement impacts.
cEffect size is calculated by dividing the impact of the program (the difference between the means for the program group and the control group) by the standard deviation for the control group.
dFor all variables in the table, data are available for the full sample.

27
it may be that there was less room to further improve these dimensions of teacher practice in mixed-age classrooms, as measured by the Adapted TSRS.
Regarding classroom climate outcomes, there were no statistically significant impacts on measures of the quality of classrooms when the enhancements were considered together. Table 4 shows that mixed-age classrooms in the control group, on average, had moderately high levels of emotional support (5.52 on a 7-point scale) and classroom organization (5.07 on a 7-point scale), but scored moderately low on measures of instructional support (2.45 on a 7-point scale) and literacy focus (1.49 on a 7-point scale), according to observers who assessed the overall quality of classrooms. The enhancement classrooms showed similar levels on these dimensions of classroom climate.
Estimated Impacts on Class-Level Outcomes, by Enhancement
This section presents estimated impacts on teacher practice and classroom climate sepa-rately for each enhancement in the sample of mixed-age Head Start CARES classrooms that served 3-year-olds.
As context for interpreting the impacts on mixed-age classrooms and the 3-year-olds in them, results for the full sample of Head Start CARES classrooms and the 4-year-olds in those classrooms are also presented for each enhancement in this section and the sections on estimat-ed impacts on children’s social-emotional and pre-academic outcomes, by enhancement. How-ever, the study was not designed to test for differences in impacts between the full sample and the subsample of mixed-age classrooms because the two samples vary in a number of ways that make it difficult to draw conclusions about what might be driving observed differences in im-pacts. For example, the sample of mixed-age classrooms differed from the full sample of class-rooms on a number of characteristics, including the classrooms’ locations around the country, the types of organizations in which the grantees were located, and baseline levels of classroom climate. Therefore, results for the full sample of classrooms should not be used to make head-to-head comparisons with impacts on outcomes in the sample of mixed-age classrooms. More-over, as discussed earlier, comparisons between the two sets of analyses are hampered by dif-ferences in statistical power.
The Incredible Years
Teachers in Incredible Years classrooms received training to implement positive class-room-wide management (rules and routines), behavioral support strategies, problem-solving strategies, and positive reward structures. To a lesser degree, The Incredible Years targeted teachers’ labeling of children’s emotions and scaffolding of pretend play. As such, Incredible Years classrooms were expected to be more emotionally positive and better organized than con-trol group classrooms.
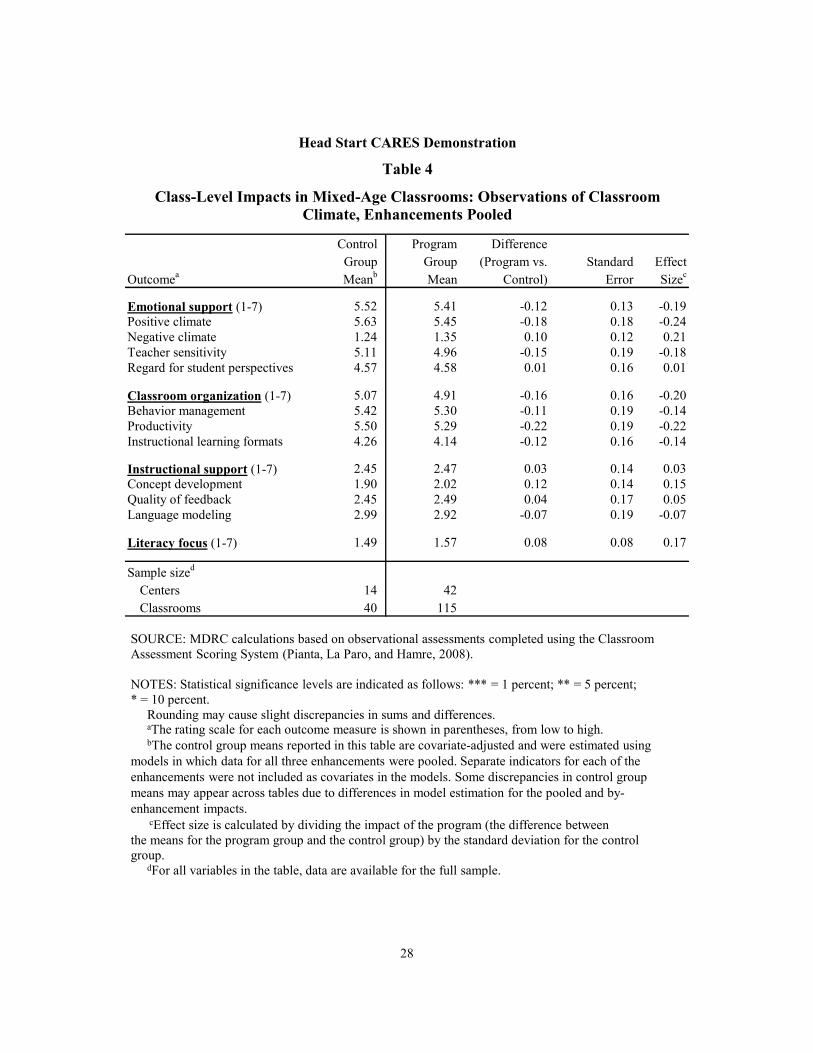
28
Control Program DifferenceGroup Group (Program vs. Standard Effect
Outcomea Meanb Mean Control) Error Sizec
Emotional support (1-7) 5.52 5.41 -0.12 0.13 -0.19Positive climate 5.63 5.45 -0.18 0.18 -0.24Negative climate 1.24 1.35 0.10 0.12 0.21Teacher sensitivity 5.11 4.96 -0.15 0.19 -0.18Regard for student perspectives 4.57 4.58 0.01 0.16 0.01
Classroom organization (1-7) 5.07 4.91 -0.16 0.16 -0.20Behavior management 5.42 5.30 -0.11 0.19 -0.14Productivity 5.50 5.29 -0.22 0.19 -0.22Instructional learning formats 4.26 4.14 -0.12 0.16 -0.14
Instructional support (1-7) 2.45 2.47 0.03 0.14 0.03Concept development 1.90 2.02 0.12 0.14 0.15Quality of feedback 2.45 2.49 0.04 0.17 0.05Language modeling 2.99 2.92 -0.07 0.19 -0.07
Literacy focus (1-7) 1.49 1.57 0.08 0.08 0.17
Sample sized
Centers 14 42Classrooms 40 115
Head Start CARES Demonstration
Table 4
Class-Level Impacts in Mixed-Age Classrooms: Observations of ClassroomClimate, Enhancements Pooled
SOURCE: MDRC calculations based on observational assessments completed using the Classroom Assessment Scoring System (Pianta, La Paro, and Hamre, 2008).
NOTES: Statistical significance levels are indicated as follows: *** = 1 percent; ** = 5 percent;* = 10 percent.
Rounding may cause slight discrepancies in sums and differences.aThe rating scale for each outcome measure is shown in parentheses, from low to high.bThe control group means reported in this table are covariate-adjusted and were estimated using
models in which data for all three enhancements were pooled. Separate indicators for each of the enhancements were not included as covariates in the models. Some discrepancies in control group means may appear across tables due to differences in model estimation for the pooled and by-enhancement impacts.
cEffect size is calculated by dividing the impact of the program (the difference betweenthe means for the program group and the control group) by the standard deviation for the control group.
dFor all variables in the table, data are available for the full sample.
29
• The Incredible Years did not produce the pattern of impacts on teacher practice and classroom climate that was expected, given The Incredible Years’ central focus on classroom management.
As shown in Table 5, teachers in Incredible Years classrooms did not demonstrate the expected statistically significantly higher levels of overall classroom management practices compared with teachers in the control group. They also did not show more positive or less nega-tive behavior management practices than did teachers in control classrooms. Teachers in mixed-age Incredible Years classrooms did, however, use statistically significantly more practices that supported children’s attention and engagement — a classroom management subscale — than their control group counterparts. This impact is moderate in magnitude (effect size of 0.44) and brought the average teacher in a mixed-age Incredible Years classroom up from a score of 3.37 to a score of 3.72 on a 5-point scale. This impact is in line with expectations because using strategies to engage and sustain children’s attention is a central aspect of the Incredible Years training. However, this impact is not part of a broader pattern of statistically significant impacts of The Incredible Years on teachers’ classroom and behavior management practices. The lack of a pattern of impacts on these practices is somewhat unexpected, given that The Incredible Years trains teachers extensively in positive behavior management. Indeed, findings for the full Head Start CARES sample showed that The Incredible Years improved teachers’ overall class-room management practices, with impacts that were moderate in magnitude.52 However, the analysis did not test for statistically significant differences in impacts between the full sample of classrooms and the subsample of mixed-age classrooms. Moreover, it is difficult to know what might be driving any differences in the impact estimates because the two samples differ along a number of characteristics.
There were no statistically significant impacts on social-emotional instructional practic-es in mixed-age Incredible Years classrooms, such as teachers’ modeling of emotions and abil-ity to draw children’s attention to peers’ emotions and support children’s social problem-solving, which were secondary foci of the Incredible Years training. (See Table 5.) In the full sample of Head Start CARES classrooms, The Incredible Years did moderately improve as-pects of teachers’ social-emotional instruction. The Incredible Years enhancement also did not yield statistically significant impacts on the extent to which teachers in mixed-age classrooms organized and scaffolded children’s play activities. This is not surprising, since The Incredible Years focuses on teacher scaffolding of children’s play to a lesser degree than it does on class-room management. Consistent with the results for mixed-age classrooms, The Incredible Years did not show impacts on teachers’ scaffolding of children’s play in the full sample.53
52Morris et al. (2014). 53Morris et al. (2014).
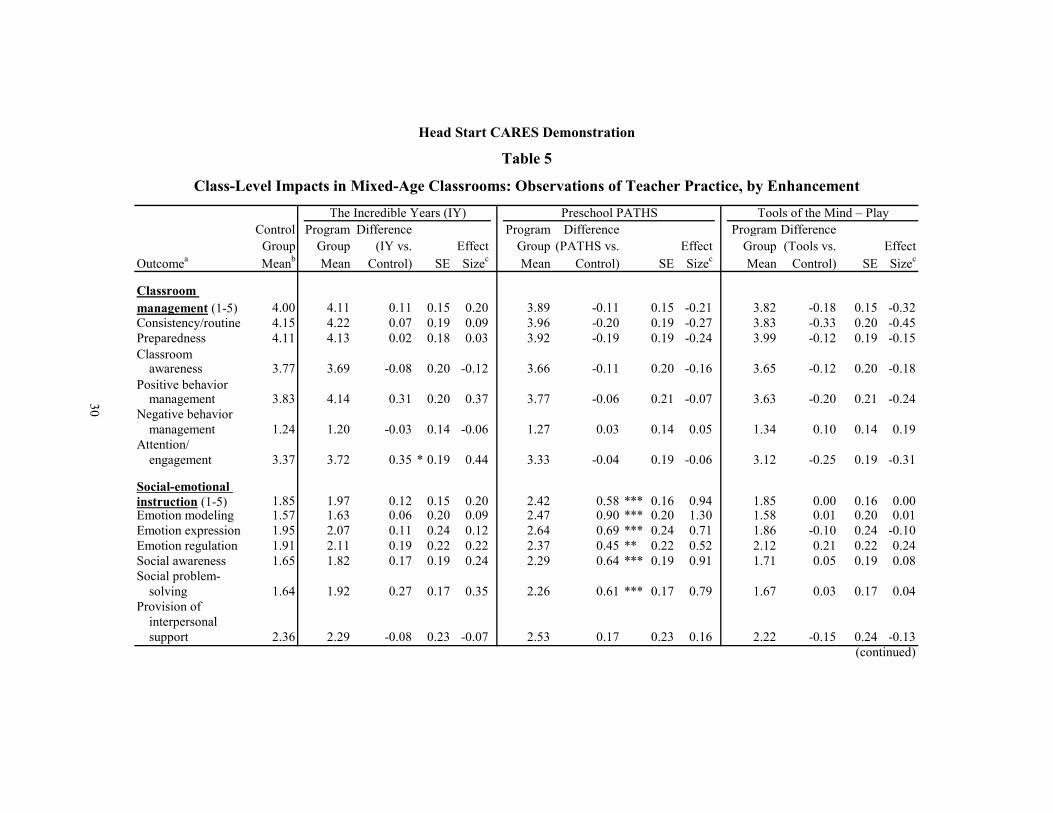
Control Program Difference Program Difference Program DifferenceGroup Group (IY vs. Effect Group (PATHS vs. Effect Group (Tools vs. Effect
Outcomea Meanb Mean Control) SE Sizec Mean Control) SE Sizec Mean Control) SE Sizec
Classroom management (1-5) 4.00 4.11 0.11 0.15 0.20 3.89 -0.11 0.15 -0.21 3.82 -0.18 0.15 -0.32Consistency/routine 4.15 4.22 0.07 0.19 0.09 3.96 -0.20 0.19 -0.27 3.83 -0.33 0.20 -0.45Preparedness 4.11 4.13 0.02 0.18 0.03 3.92 -0.19 0.19 -0.24 3.99 -0.12 0.19 -0.15Classroom
awareness 3.77 3.69 -0.08 0.20 -0.12 3.66 -0.11 0.20 -0.16 3.65 -0.12 0.20 -0.18Positive behavior
management 3.83 4.14 0.31 0.20 0.37 3.77 -0.06 0.21 -0.07 3.63 -0.20 0.21 -0.24Negative behavior
management 1.24 1.20 -0.03 0.14 -0.06 1.27 0.03 0.14 0.05 1.34 0.10 0.14 0.19Attention/
engagement 3.37 3.72 0.35 * 0.19 0.44 3.33 -0.04 0.19 -0.06 3.12 -0.25 0.19 -0.31
Social-emotional instruction (1-5) 1.85 1.97 0.12 0.15 0.20 2.42 0.58 *** 0.16 0.94 1.85 0.00 0.16 0.00Emotion modeling 1.57 1.63 0.06 0.20 0.09 2.47 0.90 *** 0.20 1.30 1.58 0.01 0.20 0.01Emotion expression 1.95 2.07 0.11 0.24 0.12 2.64 0.69 *** 0.24 0.71 1.86 -0.10 0.24 -0.10Emotion regulation 1.91 2.11 0.19 0.22 0.22 2.37 0.45 ** 0.22 0.52 2.12 0.21 0.22 0.24Social awareness 1.65 1.82 0.17 0.19 0.24 2.29 0.64 *** 0.19 0.91 1.71 0.05 0.19 0.08Social problem-
solving 1.64 1.92 0.27 0.17 0.35 2.26 0.61 *** 0.17 0.79 1.67 0.03 0.17 0.04Provision of
interpersonal support 2.36 2.29 -0.08 0.23 -0.07 2.53 0.17 0.23 0.16 2.22 -0.15 0.24 -0.13
(continued)
Class-Level Impacts in Mixed-Age Classrooms: Observations of Teacher Practice, by Enhancement
Head Start CARES Demonstration
Table 5
The Incredible Years (IY) Preschool PATHS Tools of the Mind – Play
30

Control Program Difference Program Difference Program DifferenceGroup Group (IY vs. Effect Group (PATHS vs. Effect Group (Tools vs. Effect
Outcomea Meanb Mean Control) SE Sizec Mean Control) SE Sizec Mean Control) SE Sizec
Scaffolding (1-5) 1.48 1.43 -0.06 0.13 -0.12 1.60 0.11 0.14 0.24 1.76 0.28 * 0.14 0.59Scaffolding dramatic
play 1.57 1.44 -0.13 0.15 -0.23 1.71 0.14 0.15 0.23 1.84 0.27 * 0.15 0.46Scaffolding peer
interaction 1.40 1.42 0.02 0.16 0.04 1.51 0.11 0.16 0.22 1.68 0.27 0.16 0.56
Sample sized
Centers 14 14 14 14Classrooms 40 41 37 37
The Incredible Years (IY) Preschool PATHS Tools of the Mind – Play
Table 5 (continued)
SOURCE: MDRC calculations based on observational assessments completed using the Adapted Teaching Style Rating Scale (Raver et al., 2012).
NOTES: Statistical significance levels are indicated as follows: *** = 1 percent; ** = 5 percent; * = 10 percent.Rounding may cause slight discrepancies in sums and differences.SE represents standard error.aThe rating scale for each outcome measure is shown in parentheses, from low to high.bThe control group means reported in this table are covariate-adjusted and were estimated using models in which data for all three enhancements
were pooled and a treatment indicator for each enhancement was included. Some discrepancies in control group means may appear across tables due to differences in model estimation for the pooled and by-enhancement impacts.
cEffect size is calculated by dividing the impact of the program (the difference between the means for the program group and the control group) by the standard deviation for the control group.
dFor all variables in the table, data are available for the full sample.
31

32
As shown in Table 6, the single statistically significant impact of the Incredible Years enhancement on teacher practice in mixed-age classrooms did not yield statistically significant impacts on any of the classroom climate dimensions — emotional support, classroom organiza-tion, instructional support, or literacy focus — or subdimensions that research suggests are im-portant for children’s development. Similarly, in the full sample of Head Start CARES class-rooms, The Incredible Years did not have statistically significant impacts on any of the class-room climate dimensions, although there were some small effects on a few subdimensions.54
The absence of Incredible Years impacts on teachers’ overall classroom management practices or key subdimensions of those practices, as measured by the Adapted TSRS, is some-what surprising, given that this is the central focus of the Incredible Years training. It is not clear why the findings for the subset of mixed-age classrooms seem to differ from the findings for the full sample of classrooms. It is possible that, since control group teachers in mixed-age class-rooms tended to engage in relatively high levels of classroom and behavior management, even in the absence of a social-emotional enhancement, there was less room to improve these dimen-sions of teacher practice, as measured by the Adapted TSRS. In addition, the current analysis had limited power to detect statistically significant impacts on teacher practice and classroom climate that were small or moderate in magnitude (less than 0.50 of a standard deviation).55 Therefore, it may be that The Incredible Years actually produced small improvements in teacher practice in mixed-age classrooms but definitive conclusions cannot be drawn about impacts of this size because of the limited power of the analysis.
PATHS
Teachers in PATHS classrooms were expected to display higher levels of social-emotional instruction than were control group teachers, including explicit lessons and activities that help children recognize and respond appropriately to emotions. The delivery of lessons tar-geting children’s social and emotional skills was expected to lead to more emotionally positive and well-organized classrooms.
• As expected, PATHS improved teachers’ social-emotional instruction in mixed-age classrooms, but it had limited impacts on other dimensions of teacher practice and overall classroom climate.
54Morris et al. (2014). 55The minimum detectable effect size represents the smallest true impact across teacher practice and class-
room climate outcomes that would be flagged as statistically significant using a two-tailed t-test with a 10 per-cent significance level in 80 percent of studies with a similar design. This calculation is based on the standard error of the impact estimate for each outcome and the total number of Head Start centers and center-level co-variates included in the analysis model.

33
Control Program Difference Program Difference Program DifferenceGroup Group (IY vs. Effect Group (PATHS vs. Effect Group (Tools vs. Effect
Outcomea Meanb Mean Control) SE Sizec Mean Control) SE Sizec Mean Control) SE Sizec
Emotional support (1-7) 5.53 5.47 -0.06 0.16 -0.09 5.45 -0.07 0.16 -0.12 5.30 -0.23 0.17 -0.37Positive climate 5.63 5.60 -0.03 0.21 -0.04 5.35 -0.28 0.22 -0.36 5.38 -0.25 0.22 -0.32Negative climate 1.24 1.26 0.01 0.14 0.03 1.30 0.05 0.15 0.11 1.50 0.25 * 0.15 0.52Teacher sensitivity 5.11 4.94 -0.17 0.23 -0.20 5.05 -0.06 0.24 -0.07 4.89 -0.23 0.24 -0.26Regard for student
perspectives 4.57 4.58 0.00 0.19 0.00 4.75 0.17 0.19 0.20 4.43 -0.14 0.19 -0.17
Classroom organization (1-7) 5.07 5.08 0.01 0.19 0.01 4.88 -0.19 0.19 -0.24 4.76 -0.30 0.20 -0.38Behavior
management 5.42 5.64 0.22 0.22 0.27 5.29 -0.13 0.22 -0.16 4.95 -0.47 ** 0.23 -0.57Productivity 5.50 5.44 -0.07 0.23 -0.07 5.15 -0.36 0.24 -0.37 5.26 -0.24 0.24 -0.25Instructional learning
formats 4.27 4.15 -0.12 0.20 -0.14 4.22 -0.05 0.20 -0.06 4.07 -0.20 0.20 -0.23
Instructional support (1-7) 2.45 2.39 -0.06 0.17 -0.08 2.70 0.25 0.18 0.31 2.36 -0.09 0.18 -0.12Concept development 1.90 1.91 0.01 0.16 0.01 2.30 0.40 ** 0.16 0.51 1.86 -0.04 0.16 -0.05Quality of feedback 2.45 2.46 0.01 0.22 0.01 2.69 0.25 0.22 0.27 2.33 -0.12 0.22 -0.13Language modeling 2.99 2.78 -0.21 0.23 -0.23 3.13 0.14 0.23 0.15 2.88 -0.11 0.23 -0.12
Literacy focus (1-7) 1.49 1.51 0.02 0.10 0.04 1.55 0.06 0.10 0.12 1.66 0.17 0.10 0.34
Sample sized
Centers 14 14 14 14Classrooms 40 41 37 37
(continued)
Head Start CARES Demonstration
Table 6
Class-Level Impacts in Mixed-Age Classrooms: Observations of Classroom Climate, by Enhancement
The Incredible Years (IY) Preschool PATHS Tools of the Mind – Play
34
Tables 5 and 6 also show the estimated impacts of PATHS on teacher practice and classroom climate outcomes. As in the full sample, PATHS did not produce statistically signifi-cant impacts on teachers’ classroom management practices in mixed-age classrooms. This is not entirely surprising, given that teachers’ classroom and behavioral management practices are not central targets of teacher training in PATHS.
In line with expectations, teachers in PATHS classrooms showed higher levels of social-emotional instruction than their control group counterparts (as shown in Table 5). Spe-cifically, PATHS teachers showed higher levels of instruction about emotions, modeling of emotion identification, supporting children’s expression and regulation of emotions, and facil-itating children’s understanding of social problem-solving and their peers’ emotions (social awareness). The magnitude of these impacts was moderate to large, ranging from 0.52 to 1.30 standard deviations. These impacts are consistent with those found for the full sample of PATHS classrooms, in which there were also large, statistically significant impacts on teach-ers’ social-emotional instruction.56
No statistically significant impacts of PATHS were found on teachers’ scaffolding of children’s play in either the sample of mixed-age classrooms or the full sample of classrooms. This is not surprising, since scaffolding was not a focus of the PATHS enhancement.57
As shown in Table 6, the improvements in teachers’ social-emotional instruction found in mixed-age PATHS classrooms did not change the overall climate of the classrooms in terms
56Morris et al. (2014). 57Morris et al. (2014).
Table 6 (continued)SOURCE: MDRC calculations based on observational assessments completed using the Classroom Assessment Scoring System (Pianta, La Paro, and Hamre, 2008).
NOTES: Statistical significance levels are indicated as follows: *** = 1 percent; ** = 5 percent; * = 10 percent.
Rounding may cause slight discrepancies in sums and differences.SE represents standard error.aThe rating scale for each outcome measure is shown in parentheses, from low to high.bThe control group means reported in this table are covariate-adjusted and were estimated using models in
which data for all three enhancements were pooled and a treatment indicator for each enhancement was included. Some discrepancies in control group means may appear across tables due to differences in model estimation for the pooled and by-enhancement impacts.
cEffect size is calculated by dividing the impact of the program (the difference between the means for the program group and the control group) by the standard deviation for the control group.
dFor all variables in the table, data are available for the full sample.
35
of how warm and sensitive they were for children or how well the classrooms were organized and managed. But, a statistically significant improvement was observed for concept develop-ment (in which children are asked questions like “Why?” to support their higher-order think-ing). This statistically significant positive impact on one of the instructional support subdimen-sions of CLASS is in keeping with PATHS training and was moderate in magnitude (effect size of 0.51). PATHS also had statistically significant impacts on the CLASS instructional support dimension and subdimensions in the full sample of classrooms.58 Thus, in general, the impacts on teacher practice in mixed-age PATHS classrooms mirror those found in the full set of PATHS classrooms in Head Start CARES.
Tools of the Mind—Play
Rather than providing explicit lessons focused on young children’s self-regulation, Tools of the Mind—Play targets their make-believe play and the way other learning experiences are structured and supported in the classroom. As such, the program focuses on the way in which teachers organize and scaffold children’s play activities. In turn, changes in teacher prac-tice may yield better overall classroom climate and organization of Tools of the Mind—Play classrooms, though this is a secondary focus of the program’s training.
• As expected, Tools of the Mind—Play increased teachers’ scaffolding of children’s play, but it had no statistically significant impacts on oth-er dimensions of teacher practice and few impacts on classroom climate.
Consistent with the central focus of Tools of the Mind—Play and the findings for the full sample, the enhancement had statistically significant impacts on teachers’ overall level of scaffolding and specifically on scaffolding of dramatic play, as measured by the Adapted TSRS.59 As shown in Table 5, Tools of the Mind—Play raised the average level of overall scaf-folding (shown in the third panel of the table) from a score of 1.48 to a score of 1.76 on a 5-point scale. Similarly, the average level of scaffolding of dramatic play was raised from a score of 1.57 in control group classrooms to a score of 1.84 on a 5-point scale in program group (en-hancement) classrooms. The estimated impacts were moderate in magnitude (effect sizes of
58Morris et al. (2014). 59Teachers’ overall scaffolding of children’s play includes scaffolding of children’s dramatic play and
scaffolding of children’s peer interactions. Dramatic play is make-believe or pretend play that occurs among children in the classroom. For example, children might pretend to be at a grocery store where one child pre-tends to be a store owner while another pretends to be a shopper. Peer interactions consist of children’s col-laborative, activity-based play in the classroom, such as playing with building blocks, drawing a picture, or coloring.
36
0.59 and 0.46 of a standard deviation on overall scaffolding and scaffolding of dramatic play, respectively). No other statistically significant impacts on teacher practice were found.
As shown in Table 6, mixed-age Tools of the Mind—Play classrooms did not show a pattern of improvements in classroom climate relative to control group classrooms. Surprising-ly, the two statistically significant impacts on CLASS subdimensions showed unfavorable im-pacts of the enhancement (a statistically significant increase in negative climate and a decrease in behavior management). However, statistically significant impacts were not observed on any of the overall dimensions of CLASS or on any other subdimensions. These results are con-sistent with the general absence of statistically significant impacts on classroom climate in the full set of Tools of the Mind—Play classrooms, although those results also pointed to a statisti-cally significantly higher literacy focus in these classrooms, which was not evident in the cur-rent analysis.60
Impacts of the Head Start Cares Enhancements on 3-Year-Old Children’s Social-Emotional and Pre-Academic Outcomes This section presents impacts of the Head Start CARES enhancements on 3-year-old chil-dren’s social-emotional outcomes and pre-academic skills in spring of the Head Start year, as measured using teacher reports, for the set of enhancements as a group and separately by enhancement.
Estimated Impacts on Social-Emotional Outcomes in the Pooled Sample
Given uncertainties about whether and how the enhancements might affect 3-year-olds and given the limited statistical power of the analysis, impacts on social-emotional outcomes (assessed using the measures described in Box 4) were first explored by pooling data across the three enhancements, before turning to the separate impacts of each enhance-ment. This analysis builds on the earlier findings that the enhancements as a group improved teachers’ social-emotional instruction in mixed-age classrooms. The current section presents the results of analyses conducted to assess whether the delivery of any social-emotional enhancement in these classrooms might also improve 3-year-olds’ social and emotional competencies.
As shown in Table 7, the Head Start CARES enhancements did improve some social-emotional outcomes for 3-year-old children.
60Morris et al. (2014).
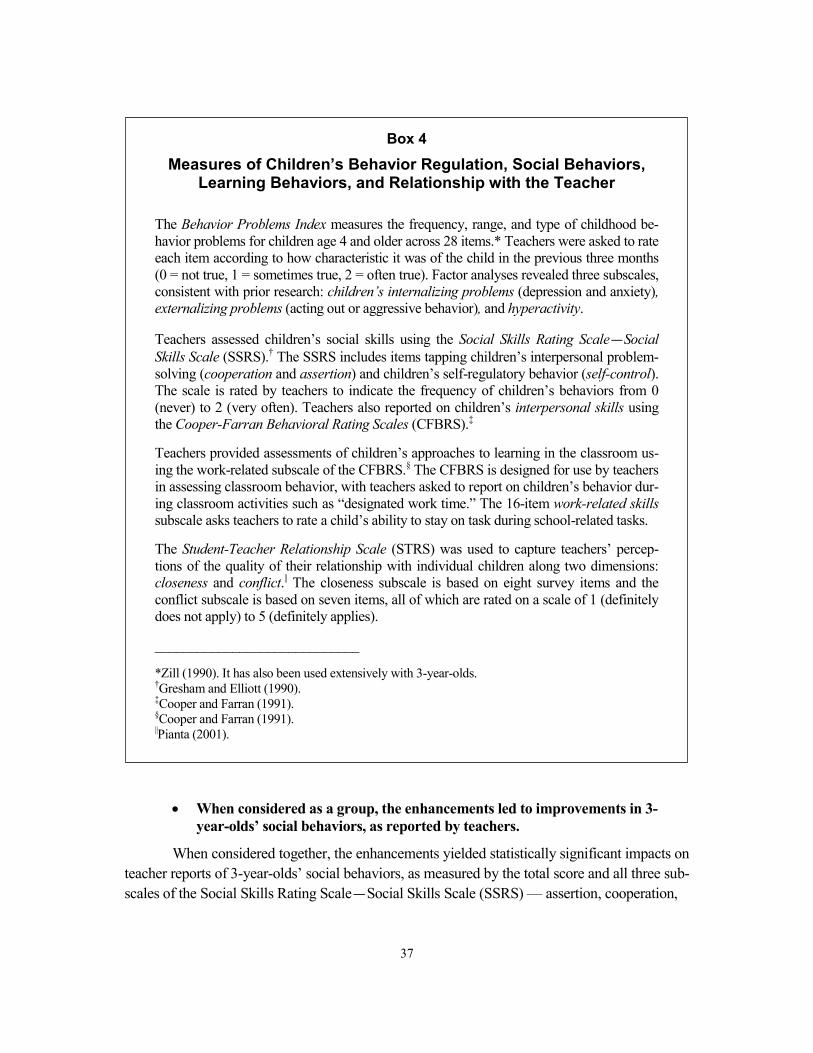
37
• When considered as a group, the enhancements led to improvements in 3-year-olds’ social behaviors, as reported by teachers.
When considered together, the enhancements yielded statistically significant impacts on teacher reports of 3-year-olds’ social behaviors, as measured by the total score and all three sub-scales of the Social Skills Rating Scale—Social Skills Scale (SSRS) — assertion, cooperation,
Box 4
Measures of Children’s Behavior Regulation, Social Behaviors, Learning Behaviors, and Relationship with the Teacher
The Behavior Problems Index measures the frequency, range, and type of childhood be-havior problems for children age 4 and older across 28 items.* Teachers were asked to rate each item according to how characteristic it was of the child in the previous three months (0 = not true, 1 = sometimes true, 2 = often true). Factor analyses revealed three subscales, consistent with prior research: children’s internalizing problems (depression and anxiety), externalizing problems (acting out or aggressive behavior), and hyperactivity.
Teachers assessed children’s social skills using the Social Skills Rating Scale—Social Skills Scale (SSRS).† The SSRS includes items tapping children’s interpersonal problem-solving (cooperation and assertion) and children’s self-regulatory behavior (self-control). The scale is rated by teachers to indicate the frequency of children’s behaviors from 0 (never) to 2 (very often). Teachers also reported on children’s interpersonal skills using the Cooper-Farran Behavioral Rating Scales (CFBRS).‡
Teachers provided assessments of children’s approaches to learning in the classroom us-ing the work-related subscale of the CFBRS.§ The CFBRS is designed for use by teachers in assessing classroom behavior, with teachers asked to report on children’s behavior dur-ing classroom activities such as “designated work time.” The 16-item work-related skills subscale asks teachers to rate a child’s ability to stay on task during school-related tasks.
The Student-Teacher Relationship Scale (STRS) was used to capture teachers’ percep-tions of the quality of their relationship with individual children along two dimensions: closeness and conflict.|| The closeness subscale is based on eight survey items and the conflict subscale is based on seven items, all of which are rated on a scale of 1 (definitely does not apply) to 5 (definitely applies).
_____________________________
*Zill (1990). It has also been used extensively with 3-year-olds. †Gresham and Elliott (1990). ‡Cooper and Farran (1991). §Cooper and Farran (1991). ||Pianta (2001).

38
Control Program DifferenceGroup Group (Program vs. Standard Effect
Outcome (Teacher Report)a Meanb Mean Control) Error Sizec
Behavior problems Total score (0-52) 6.55 6.20 -0.35 0.92 -0.04
Externalizing (0-22) 3.01 2.77 -0.24 0.40 -0.06Hyperactivity (0-10) 2.02 1.84 -0.18 0.26 -0.08Internalizing (0-20) 1.54 1.61 0.07 0.34 0.03
Social behaviors Social Skills Rating Scale (0-60) 38.61 41.50 2.89 ** 1.29 0.27
Assertion (0-20) 12.26 13.33 1.07 ** 0.47 0.25Cooperation (0-20) 13.38 14.23 0.85 * 0.46 0.22Self-control (0-20) 12.74 13.94 1.20 *** 0.45 0.30
Interpersonal skills (1-7) 5.34 5.39 0.06 0.09 0.06
Learning behaviors Work-related skills (1-7) 4.42 4.58 0.16 0.11 0.17
Student-teacher relationship 4.14 4.28 0.15 ** 0.07 0.221.81 1.74 -0.06 0.09 -0.08
Sample sized
Centers 14 42Classrooms 40 115Children 220 713
Conflict (1-5)Closeness (1-5)
Head Start CARES Demonstration
Table 7
Child-Level Impacts on 3-Year-Olds: Social-Emotional Outcomes, Enhancements Pooled
SOURCES: MDRC calculations based on the teachers’ reports on the Behavior Problems Index (Zill, 1990), the Social Skills Rating Scale (Gresham and Elliot, 1990), the Cooper-Farran Behavioral Rating Scales (Cooper and Farran, 1991), and the Student-Teacher Relationship Scale (Pianta, 2001).
NOTES: Statistical significance levels are indicated as follows: *** = 1 percent; ** = 5 percent; * = 10 percent.Rounding may cause slight discrepancies in sums and differences.aThe rating scale for each outcome measure is shown in parentheses, from low to high.bThe control group means reported in this table are covariate-adjusted and were estimated using models in
which data for all three enhancements were pooled. Separate indicators for each of the enhancements were not included as covariates in the models. Some discrepancies in control group means may appear across tables due to differences in model estimation for the pooled and by-enhancement impacts.
cEffect size is calculated by dividing the impact of the program (the difference between the means for theprogram group and the control group) by the standard deviation for the control group.
dFor all variables in the table, data are available for at least 98 percent of the sample.
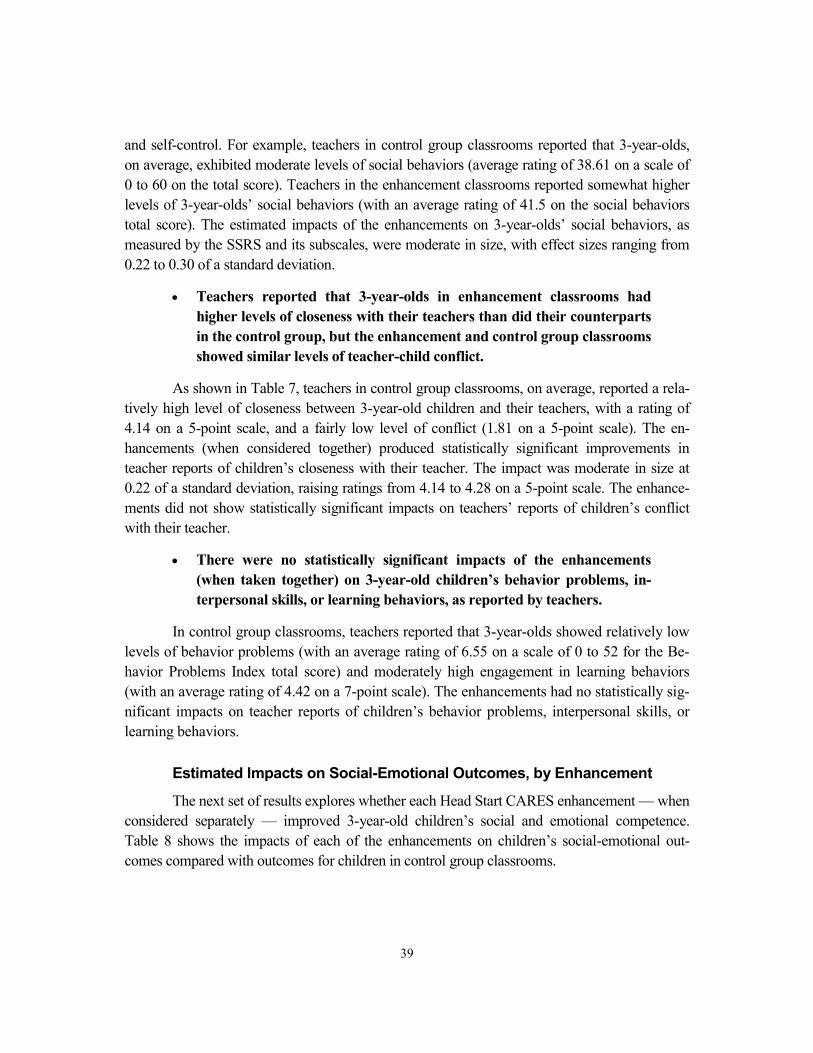
39
and self-control. For example, teachers in control group classrooms reported that 3-year-olds, on average, exhibited moderate levels of social behaviors (average rating of 38.61 on a scale of 0 to 60 on the total score). Teachers in the enhancement classrooms reported somewhat higher levels of 3-year-olds’ social behaviors (with an average rating of 41.5 on the social behaviors total score). The estimated impacts of the enhancements on 3-year-olds’ social behaviors, as measured by the SSRS and its subscales, were moderate in size, with effect sizes ranging from 0.22 to 0.30 of a standard deviation.
• Teachers reported that 3-year-olds in enhancement classrooms had higher levels of closeness with their teachers than did their counterparts in the control group, but the enhancement and control group classrooms showed similar levels of teacher-child conflict.
As shown in Table 7, teachers in control group classrooms, on average, reported a rela-tively high level of closeness between 3-year-old children and their teachers, with a rating of 4.14 on a 5-point scale, and a fairly low level of conflict (1.81 on a 5-point scale). The en-hancements (when considered together) produced statistically significant improvements in teacher reports of children’s closeness with their teacher. The impact was moderate in size at 0.22 of a standard deviation, raising ratings from 4.14 to 4.28 on a 5-point scale. The enhance-ments did not show statistically significant impacts on teachers’ reports of children’s conflict with their teacher.
• There were no statistically significant impacts of the enhancements (when taken together) on 3-year-old children’s behavior problems, in-terpersonal skills, or learning behaviors, as reported by teachers.
In control group classrooms, teachers reported that 3-year-olds showed relatively low levels of behavior problems (with an average rating of 6.55 on a scale of 0 to 52 for the Be-havior Problems Index total score) and moderately high engagement in learning behaviors (with an average rating of 4.42 on a 7-point scale). The enhancements had no statistically sig-nificant impacts on teacher reports of children’s behavior problems, interpersonal skills, or learning behaviors.
Estimated Impacts on Social-Emotional Outcomes, by Enhancement
The next set of results explores whether each Head Start CARES enhancement — when considered separately — improved 3-year-old children’s social and emotional competence. Table 8 shows the impacts of each of the enhancements on children’s social-emotional out-comes compared with outcomes for children in control group classrooms.

40
The Incredible Years
• Teachers in Incredible Years classrooms reported higher levels of 3-year-old children’s social behaviors and closeness with their teacher than did teachers in control group classrooms.
As shown in Table 8, the estimated impacts of The Incredible Years on children’s so-cial behaviors and closeness with the teacher are moderate to large in size (with effect sizes ranging from 0.40 for closeness to 0.55 for the social behaviors total score). These impacts suggest that 3-year-old children’s social behaviors can be improved when teachers’ approach-es to managing the classroom are targeted, as in The Incredible Years, and not just through explicit instruction.
The impacts on 3-year-olds’ social behaviors are about twice the size of The Incredible Years’ impact on 4-year-olds’ social behaviors (which has an effect size of 0.28 of a standard deviation) in Head Start CARES, and they are larger than most impact estimates found in other studies of the Incredible Years curriculum. For example, results from random assignment eval-uations of an adapted version of The Incredible Years that included both 3- and 4-year-old chil-dren found weaker impacts on children’s behavioral outcomes, with effect sizes that were gen-erally about 0.40 or smaller in magnitude, and on children’s executive function skills, with an effect size of 0.37.61 Again, The Incredible Years encourages teachers to look at children’s be-havior and their relationships with other children through a different lens, which may have af-fected how teachers reported these behaviors and relationships. That said, the magnitude of the impacts reported here suggests that 3-year-olds can experience noteworthy benefits from expo-sure to The Incredible Years (at least in terms of teacher perceptions of children and their be-havior), even though it was developed for use with 4-year-olds.
• The Incredible Years had no statistically significant impacts on teacher reports of children’s behavior problems, interpersonal skills, learning behaviors, or conflict with teachers.
The absence of impacts of The Incredible Years on children’s behavior problems stands in contrast to the results of other Incredible Years evaluations, which have found reductions in children’s behavior problems and conflict with peers and teachers, with effect sizes ranging from –0.27 to –0.89 in magnitude.62 However, in those studies a clinical consultant supported imple-mentation of The Incredible Years by providing in-classroom coaching to teachers one day a week and working one-on-one in the second half of the year with children who continued to display behavior problems. This more targeted approach by a clinician for children exhibiting
61Morris et al. (2010); Raver et al. (2011). 62Morris et al. (2010); Raver et al. (2009).
Control Program Difference Program Difference Program DifferenceOutcome (Teacher Group Group (IY vs. Effect Group (PATHS vs. Effect Group (Tools vs. EffectReport)a Meanb Mean Control) SE Sizec Mean Control) SE Sizec Mean Control) SE Sizec
Behavior problems Total score (0-52) 6.54 5.89 -0.65 1.12 -0.08 5.96 -0.59 1.13 -0.07 6.74 0.19 1.13 0.02
Externalizing (0-22) 3.00 2.52 -0.49 0.48 -0.12 2.69 -0.31 0.49 -0.08 3.10 0.09 0.49 0.02Hyperactivity (0-10) 2.02 1.83 -0.19 0.32 -0.08 1.77 -0.25 0.32 -0.11 1.91 -0.11 0.32 -0.05Internalizing (0-20) 1.54 1.49 -0.05 0.42 -0.02 1.59 0.05 0.42 0.02 1.76 0.22 0.42 0.09
Social behaviors Social Skills Rating Scale (0-60) 38.63 44.41 5.78 *** 1.45 0.55 40.94 2.31 1.46 0.22 39.16 0.53 1.46 0.05
Assertion (0-20) 12.27 14.42 2.15 *** 0.54 0.51 13.10 0.83 0.55 0.19 12.48 0.21 0.54 0.05Cooperation (0-20) 13.40 15.21 1.80 *** 0.48 0.48 13.97 0.57 0.49 0.15 13.52 0.11 0.49 0.03Self-control (0-20) 12.75 14.76 2.01 *** 0.52 0.50 13.93 1.18 ** 0.53 0.30 13.16 0.41 0.53 0.10
Interpersonal skills (1-7) 5.34 5.46 0.12 0.11 0.13 5.34 0.00 0.12 0.00 5.38 0.04 0.11 0.05
Learning behaviors Work-related skills (1-7) 4.42 4.64 0.22 0.14 0.23 4.60 0.18 0.14 0.19 4.51 0.09 0.14 0.09
Student-teacher relationship
4.14 4.41 0.27 *** 0.08 0.40 4.25 0.11 0.08 0.16 4.20 0.06 0.08 0.091.81 1.65 -0.15 0.11 -0.19 1.81 0.00 0.11 0.00 1.77 -0.04 0.11 -0.05
Sample sized
Centers 14 14 14 14Classrooms 40 41 37 37Children 220 246 226 241
(continued)
Conflict (1-5)Closeness (1-5)
Head Start CARES Demonstration
Table 8
Child-Level Impacts on 3-Year-Olds: Social-Emotional Outcomes, by Enhancement
The Incredible Years (IY) Preschool PATHS Tools of the Mind – Play
41

42
behavior problems may have contributed to the magnitude of impacts on children’s behavior problems found in prior studies. Nevertheless, impacts on children’s behavior problems were also found in the original Incredible Years evaluations, which did not include clinical consulta-tion.63 Exposure to The Incredible Years has also been found to lead to improvements in chil-dren’s approaches to learning, with effect sizes ranging from 0.31 to 0.34.64
PATHS
• There is little evidence to suggest that PATHS affected teacher reports of 3-year-olds’ social-emotional outcomes.
Of the 12 social and emotional outcomes explored, PATHS produced one statistically significant impact. Teachers in PATHS classrooms reported higher levels of 3-year-old chil-dren’s self-control (an SSRS subscale) than did teachers in control group classrooms. The mag-nitude of the impact was reflected in an effect size of 0.30 of a standard deviation. However, this finding is not conclusive because the impact on the SSRS social behaviors total score was not statistically significant and there was no consistent pattern of statistically significant impacts in PATHS classrooms.
To put these findings in the context of the larger Head Start CARES evaluation, PATHS produced statistically significant impacts on teacher reports of 4-year-old children’s social behaviors (SSRS total score) and assertion and self-control (SSRS subscales) that ranged
63See, for example, Webster-Stratton, Reid, and Hammond (2004). 64Morris et al. (2010).
Table 8 (continued)
SOURCES: MDRC calculations based on the teachers’ reports on the Behavior Problems Index (Zill, 1990), the Social Skills Rating Scale (Gresham and Elliot, 1990), the Cooper-Farran Behavioral Rating Scales (Cooper and Farran, 1991), and the Student-Teacher Relationship Scale (Pianta, 2001).
NOTES: Statistical significance levels are indicated as follows: *** = 1 percent; ** = 5 percent; * = 10 percent.Rounding may cause slight discrepancies in sums and differences.SE represents standard error.aThe rating scale for each outcome measure is shown in parentheses, from low to high.bThe control group means reported in this table are covariate-adjusted and were estimated using models in
which data for all three enhancements were pooled and a treatment indicator for each enhancement was included. Some discrepancies in control group means may appear across tables due to differences in model estimation for the pooled and by-enhancement impacts.
cEffect size is calculated by dividing the impact of the program (the difference between the means for theprogram group and the control group) by the standard deviation for the control group.
dFor all variables in the table, data are available for at least 98 percent of the sample.
43
from 0.17 to 0.23 in magnitude.65 In addition, another PATHS evaluation that included 3- and 4-year-old children found that PATHS improved multiple dimensions of children’s social skills, with effect sizes ranging from 0.26 to 0.50.66 However, as noted earlier, many of the skills that PATHS targets were not directly assessed for 3-year-olds in Head Start CARES.
The absence of a pattern of statistically significant impacts on 3-year-olds’ social be-haviors could reflect the limited power of the current analysis to detect small to moderate im-pacts on outcomes for children (less than 0.30 of a standard deviation).67 The magnitude of the effects of PATHS on 3-year-olds is similar to that observed for 4-year-olds in Head Start CARES: In the current analysis, 7 of the 12 impacts estimated were between 0.10 and 0.30 of a standard deviation. Therefore, it is possible that PATHS would have shown a consistent pattern of statistically significant impacts on 3-year-olds’ social behaviors had the analysis included a larger sample of 3-year-olds.
Tools of the Mind—Play
• There is no evidence to suggest that Tools of the Mind—Play affected teacher reports of 3-year-olds’ social and emotional outcomes.
No statistically significant impacts of Tools of the Mind—Play were found for 3-year-olds, as shown in Table 8. Furthermore, the magnitude of (or effect size for) almost all of these impact estimates was close to zero. For 11 of the 12 outcomes examined, the impact estimates had effect sizes of less than 0.10 of a standard deviation. These results are consistent with those of the Head Start CARES impact analysis for 4-year-olds, which found no evidence of statistical-ly significant impacts on any of the teacher-reported social-emotional outcomes examined here.68 In contrast, evidence from an evaluation of the full (two-year) Tools of the Mind program that included both 3- and 4-year-olds found that exposure to the program improved children’s social-emotional competence by reducing behavior problems, with an effect size of ‒0.47.69 However, three subsequent evaluations found no effects of Tools of the Mind on children’s social-emotional outcomes.70
65Morris et al. (2014). 66Domitrovich, Cortes, and Greenberg (2007). 67The minimum detectable effect size represents the smallest true impact across teacher reports of social-
emotional outcomes that would be flagged as statistically significant using a two-tailed t-test with a 10 percent significance level in 80 percent of studies with a similar design. This calculation is based on the standard error of the impact estimate for each outcome and the total number of Head Start centers and center-level covariates included in the analysis model.
68Morris et al. (2014). 69Barnett et al. (2008) 70Clements, Sarama, Unlu, and Layzer (2012); Farran, Lipsey, and Wilson (2012); Lonigan and Phillips
(2012).
44
Estimated Impacts on 3-Year-Olds’ Pre-Academic Outcomes in the Pooled Sample and Separately, by Enhancement
As described above, the central target of all three enhancements was children’s social-emotional competence. It is possible, however, that exposure to social-emotional enhancements could also indirectly improve 3-year-olds’ pre-academic skills. The limited research to date in this area has yielded mixed results. Some research has shown benefits of preschool social-emotional interventions for children’s academic skills,71 while other studies have found no sta-tistically significant effects.72 Using a limited set of measures of teacher-reported pre-academic skills (as described in Box 5), impact estimates are presented when the Head Start CARES enhancements are grouped together and then separately, by enhancement.
Table 9 shows the impacts of the enhancements when pooled on 3-year-olds’ pre-academic skills, as reported by teachers.
71Raver et al. (2011). 72Morris et al. (2013).
Box 5
Measures of Children’s Pre-Academic Skills
Teachers were asked to report on children’s early language and literacy, mathematical thinking, and general knowledge skills using the Academic Rating Scale (ARS).* The items are rated from 1 to 5 with 1 = not yet, 2 = beginning, 3 = in progress, 4 = intermedi-ate, and 5 = proficient. The scale is the mean of the items.
Sample items for the language and literacy subscale include (1) uses complex sentence structures — for example, says, “If she had brought her umbrella, she wouldn’t have got-ten wet”; (2) produces rhyming words — for example, says a word that rhymes with “chip”; and (3) predicts what will happen next in stories by using the pictures and storyline for clues. Sample items for the mathematical thinking subscale include (1) sorts, classifies, and compares math materials by various rules and attributes; (2) orders a group of objects; and (3) shows an understanding of the relationship between quantities.
_____________________________
*National Center for Education Statistics (n.d.).

45
• The enhancements (when considered together) did not produce statisti-
cally significant improvements in teacher reports of 3-year-olds’ pre-academic skills.
There were no statistically significant impacts on children’s general knowledge, lan-guage and literacy, or mathematical thinking skills, as reported by teachers. On a scale of 1 to 5, the means for the control group ranged from 2.14 to 2.43, while those for the program group ranged from 2.25 to 2.60, reflecting little difference in the pre-academic skills of the two groups.
Table 10 shows impacts on children’s pre-academic skills, by enhancement.
• Teachers reported stronger pre-academic skills for 3-year-olds in In-credible Years classrooms than for their counterparts in control group classrooms, but these findings are uncertain. Neither PATHS nor Tools
Control Program DifferenceGroup Group (Program vs. Standard Effect
Outcome (Teacher Report)a Meanb Mean Control) Error Sizec
Pre-academic skillsGeneral knowledge (1-5) 2.43 2.60 0.17 0.15 0.18Language and literacy (1-5) 2.15 2.30 0.15 0.12 0.15Mathematical thinking (1-5) 2.14 2.25 0.11 0.14 0.13
Sample sized
Centers 14 42Classrooms 40 115Children 220 713
Head Start CARES Demonstration
Table 9
Child-Level Impacts on 3-Year-Olds: Pre-Academic Skills, Enhancements Pooled
SOURCE: MDRC calculations based on the teachers’ reports on the Academic Rating Scale (National Center for Education Statistics, n.d.).
NOTES: Statistical significance levels are indicated as follows: *** = 1 percent; ** = 5 percent; * = 10 percent.Rounding may cause slight discrepancies in sums and differences.aThe rating scale for each outcome measure is shown in parentheses, from low to high.bThe control group means reported in this table are covariate-adjusted and were estimated using models in which
data for all three enhancements were pooled. Separate indicators for each of the enhancements were not included as covariates in the models. Some discrepancies in control group means may appear across tables due to differences in model estimation for the pooled and by-enhancement impacts.
cEffect size is calculated by dividing the impact of the program (the difference between the means for the program group and the control group) by the standard deviation for the control group.
dFor all variables in the table, data are available for at least 96 percent of the sample.
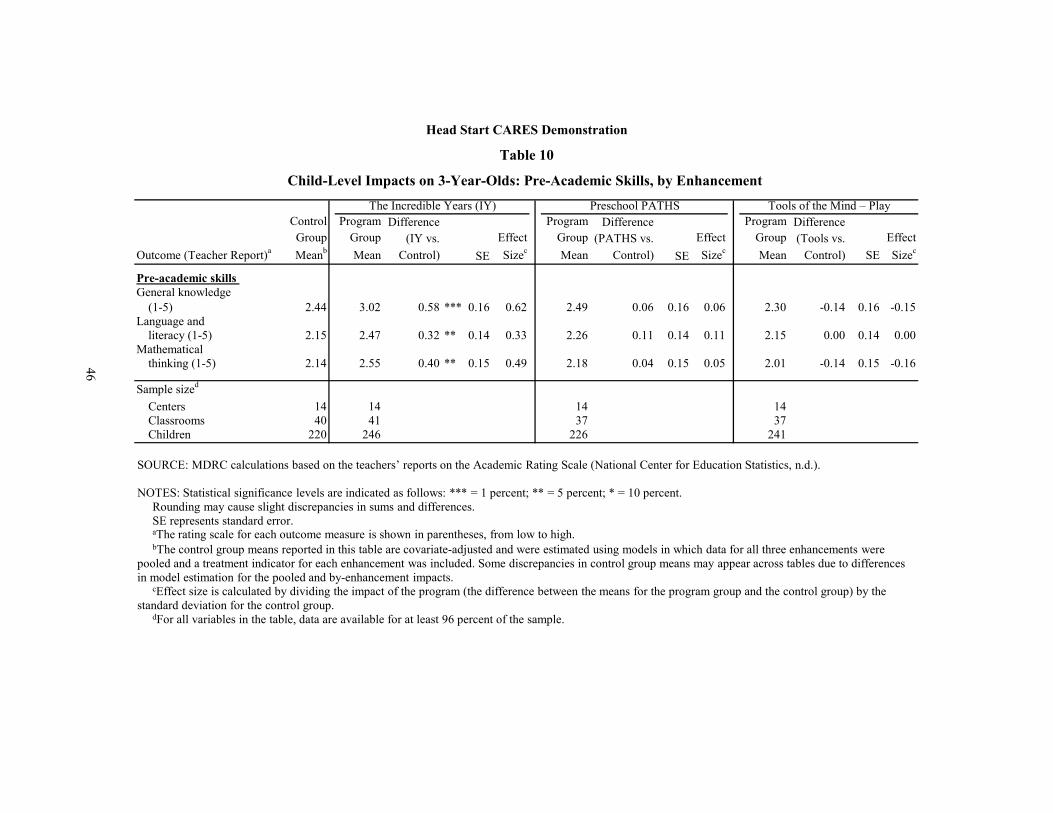
Control Program Difference Program Difference Program DifferenceGroup Group (IY vs. Effect Group (PATHS vs. Effect Group (Tools vs. Effect
Outcome (Teacher Report)a Meanb Mean Control) SE Sizec Mean Control) SE Sizec Mean Control) SE Sizec
Pre-academic skills General knowledge
(1-5) 2.44 3.02 0.58 *** 0.16 0.62 2.49 0.06 0.16 0.06 2.30 -0.14 0.16 -0.15Language and
literacy (1-5) 2.15 2.47 0.32 ** 0.14 0.33 2.26 0.11 0.14 0.11 2.15 0.00 0.14 0.00Mathematical
thinking (1-5) 2.14 2.55 0.40 ** 0.15 0.49 2.18 0.04 0.15 0.05 2.01 -0.14 0.15 -0.16
Sample sized
Centers 14 14 14 14Classrooms 40 41 37 37Children 220 246 226 241
Head Start CARES Demonstration
Table 10
Child-Level Impacts on 3-Year-Olds: Pre-Academic Skills, by Enhancement
The Incredible Years (IY) Preschool PATHS Tools of the Mind – Play
SOURCE: MDRC calculations based on the teachers’ reports on the Academic Rating Scale (National Center for Education Statistics, n.d.).
NOTES: Statistical significance levels are indicated as follows: *** = 1 percent; ** = 5 percent; * = 10 percent.Rounding may cause slight discrepancies in sums and differences.SE represents standard error.aThe rating scale for each outcome measure is shown in parentheses, from low to high.bThe control group means reported in this table are covariate-adjusted and were estimated using models in which data for all three enhancements were
pooled and a treatment indicator for each enhancement was included. Some discrepancies in control group means may appear across tables due to differences in model estimation for the pooled and by-enhancement impacts.
cEffect size is calculated by dividing the impact of the program (the difference between the means for the program group and the control group) by the standard deviation for the control group.
dFor all variables in the table, data are available for at least 96 percent of the sample.
46
47
of the Mind—Play showed statistically significant impacts on teacher reports of 3-year-olds’ pre-academic skills.
The Incredible Years impact estimates were consistent across three different pre-academic skill domains — general knowledge, language and literacy, and mathematical think-ing — and were moderate to large in size (with effect sizes ranging from 0.33 to 0.62 of a standard deviation).
The Head Start CARES impact analysis for 4-year-olds, which worked from the full sample of classrooms with 4-year-olds only and mixed-age classrooms, revealed a varied set of impacts on children’s pre-academic skills. Notably, teachers in Incredible Years classrooms also reported improvements in 4-year-olds’ pre-academic skills, but The Incredible Years showed no statistically significant impacts on these skills (including letter-word identification, early math, and expressive vocabulary skills) when measured by direct standardized assessments. The find-ings for the Head Start CARES full sample are important to consider when interpreting the im-pacts of the enhancements on 3-year-olds’ pre-academic skills. In short, the results for 3-year-olds are somewhat uncertain because pre-academic skills were a secondary target of the en-hancements, and the impacts on teacher reports of 4-year-old children’s pre-academic skills were not borne out in impacts on direct assessments of these skills.73 Nevertheless, a focus on children’s social-emotional competencies in the Head Start CARES mixed-age classrooms did not lead to decreases in 3-year-olds’ pre-academic skills. Thus, the current analysis does not suggest that a focus on social-emotional development necessarily diminishes teachers’ ability to support children’s pre-academic skills in the classroom.
Discussion The results presented in this report help address a gap in the literature about the effects of en-hanced classroom-based approaches to strengthening young children’s social and emotional development. The findings suggest that it is possible to extend the benefits of such programs to 3-year-olds, even though the enhancements were primarily designed for 4-year-old children. The findings are especially of interest because many 3-year-olds attend preschool programs.
In sum, when considered together, the Head Start CARES program enhancements pro-duced a series of positive, statistically significant impacts on 3-year-olds’ social behaviors and closeness with their teacher, as indicated by teacher reports. The exploration of impacts by en-hancement further suggests that, in this study, the positive impacts of the enhancements were primarily driven by The Incredible Years, and to a lesser extent by the other two enhancements.
73See Morris et al. (2014).
48
These results are consistent with the hypothesis that the behavioral focus of The Incredible Years may have been more accessible to 3-year-olds than the other two enhancements, which are more cognitively demanding. However, power and measurement issues in assessing the im-pacts of PATHS and Tools of the Mind—Play suggest that additional research is needed to veri-fy this hypothesis and to explore the mechanisms that might account for these impacts of The Incredible Years on 3-year-olds’ social and emotional competencies.
The findings are generally consistent with the pattern of impacts on teacher-reported outcomes for 4-year-olds reported in earlier Head Start CARES analyses, though certain im-pacts appear to be somewhat larger for 3-year-olds. A supplemental analysis of impacts on 4-year-olds in mixed-age classrooms that was conducted for this report also showed somewhat larger impacts for this subgroup than for 4-year-olds in the full sample of classrooms. This sug-gests that the mixed-age classrooms in Head Start CARES might have unique features that in-fluenced the magnitude of the impacts and may be important to explore further. For example, it may be that mixed-age classrooms enhance the socialization of both 3- and 4-year-old children in ways that same-age classrooms do not.74 If so, this could be a function of learning from one’s peers and integrating children with different skill levels and capabilities.
However, the mechanisms that account for the impacts on 3-year-olds’ social and emo-tional competencies are not entirely clear. Earlier implementation findings suggest that, on av-erage, the enhancements were satisfactorily implemented in Head Start CARES classrooms.75 Yet, when pooled, the Head Start CARES enhancements showed limited impacts on teacher practice and classroom climate in mixed-age classrooms. Furthermore, when the enhancements were considered separately, The Incredible Years did not produce the expected pattern of statis-tically significant impacts on teacher practice and classroom climate, whereas PATHS and Tools of the Mind—Play produced improvements in teacher practice that were consistent with the theories of change developed by the Head Start CARES research team (that is, improve-ments in social-emotional instruction for PATHS and increases in scaffolding for Tools of the Mind—Play).
Further exploration is needed to understand why The Incredible Years did not produce the expected impacts on teacher practice or classroom climate. Several possible explanations are posited here. First, as a whole, the Head Start CARES evaluation had less power to detect statis-tically significant impacts on class-level outcomes than on child outcomes. Thus, the fact that the subset of mixed-age classrooms is smaller than the full sample of Head Start CARES class-rooms may account for the lack of statistically significant impacts of The Incredible Years on teacher practice and classroom climate.
74See, for example, Goldman (1981). 75Mattera, Lloyd, Fishman, and Bangser (2013).
49
Second, the inconsistency in The Incredible Years’ impacts on class- and child-level out-comes could be a function of the fact that control group teachers’ use of effective classroom and behavior management strategies was somewhat higher in mixed-age classrooms than it was in the full sample of classrooms. These higher levels of classroom management might have been necessary to maintain order in classrooms with children of different ages, even in the absence of the enhancements. However, these higher levels may have made it more difficult to detect im-provements in teacher practice and classroom climate that were driven by The Incredible Years because there was less room to further improve these outcomes in mixed-age classrooms.
Third, The Incredible Years might have influenced children via alternate pathways. Supplemental analyses explored whether decreases in teacher psychological distress and burn-out (emotional exhaustion) might have led to improved teacher-reported social-emotional out-comes for 3-year-olds. However, the results did not clearly support this hypothesis; the findings indicate that teachers in both Incredible Years and PATHS classrooms reported lower levels of psychological distress than their control group counterparts. It could be that the study did not measure the mechanism responsible for the effects of The Incredible Years on 3-year-olds’ social-emotional outcomes (such as peer learning or social modeling, which might have occurred in and be unique to mixed-age group interactions in these classrooms).
This analysis also has other limitations. The study did not measure 3-year-olds’ emotion knowledge, social problem-solving skills, or executive function skills, which were key out-comes targeted by the PATHS and Tools of the Mind—Play enhancements. This gap calls for further research to investigate potential impacts of the enhancements on these outcomes for 3-year-olds before drawing conclusions about the effectiveness of specific programs for younger children. Furthermore, it is not clear whether the benefits of the enhancements would hold true for 3-year-olds in classrooms that serve only 3-year-olds. Finally, it will be important to repli-cate and further explore the findings reported here, using other data sources, given the limita-tions of relying solely on teacher-reported measures.
Despite these limitations, the findings suggest that implementing social-emotional in-terventions may be a promising strategy for supporting 3-year-olds’ social and emotional com-petence that deserves further investigation. Moreover, finding that 3-year-olds can benefit from such curricula suggests that there may be opportunities to augment these benefits for children who remain in preschool at age 4. Thus, future efforts might seek to develop and test social-emotional preschool program enhancements that include a second year of intervention.

THIS PAGE INTENTIONALLY LEFT BLANK

Appendix A
Sample Selection, Recruitment, and Random Assignment in Head Start CARES

THIS PAGE INTENTIONALLY LEFT BLANK

53
Appendix A provides a brief summary of the selection, recruitment, and random assignment process for the full Head Start CARES sample, as background for this report.
The selection and recruitment process in Head Start CARES was conducted with Head Start grantees (the local public or private nonprofit agency that has been designated a Head Start agency) or delegate agencies, so that the sample would represent the geographic, racial, and ethnic diversity of the national Head Start population. The selection and recruitment processes are discussed in detail in an earlier report summarizing the impact results of the enhancements on 4-year-old children,1 but are reviewed briefly below as context for interpreting the results presented in this report.
To select the Head Start CARES sample, several exclusion criteria first were used to nar-row the sampling frame of grantees. Grantees meeting these criteria were then stratified by re-gion of the country, racial/ethnic composition of child enrollment, and urbanicity of the location.2 The number of grantees selected in each stratum was proportional to the national Head Start population in that stratum (as a means of achieving a sample that reflected the diversity of the Head Start population). The grantees were then screened for interest, eligibility, and willingness to participate in a random assignment study and to implement the three enhancements. Grantees were determined to be ineligible if they were already systematically implementing a social-emotional curriculum or participating in another evaluation study. The final set of grantees for Head Start CARES was selected based on logistical considerations and center-level information, including proximity to grantees in other strata and whether each grantee had at least four centers with a similar racial/ethnic composition, an equal number of classrooms with full-day or part-day programs, and at least two classrooms with a minimum of eight 4-year-olds each.3
This grantee selection and recruitment process led to a sample that included 104 Head Start centers within 17 grantees across the country. This set of grantees met the geographic, ra-cial, and ethnic diversity and randomization criteria for Head Start CARES, but were not select-ed to be statistically representative of all Head Start grantees and the full range of Head Start centers across the United States. The grantees participating in Head Start CARES are somewhat unique because they replied to the research team’s initial inquiry, provided follow-up infor-mation, and agreed to a site visit. This indicates that they were amenable to participating in a
1Morris et al. (2014). 2Urbanicity is a measure of whether study participants are located in a metropolitan or rural area, or
spread across both metropolitan and nonmetropolitan environments. It is based on the Beale Code, a widely used geographic code developed by the U.S. Department of Agriculture. Codes are calculated by examining the size of a county and its proximity to a metropolitan area. More information about this cod-ing system is available at www.ers.usda.gov/briefing/rurality/RuralUrbCon.
3The Head Start CARES demonstration focused primarily on 4-year-olds. Classrooms that included only 3-year-olds were excluded from the sample, as were mixed-age classrooms with a majority of 3-year-olds.
54
demonstration aimed at learning about the effectiveness of classroom-based approaches to sup-porting children’s social and emotional development. At the same time, because programs that were already implementing strong social and emotional curricula were excluded from the study, the Head Start CARES sample likely does not represent the universe of grantees that are most invested in supporting children’s development in this area.
Random assignment in Head Start CARES took place at the center level. In some cases, all centers within a grantee were similar enough in racial/ethnic composition and part-day/full-day programming that all centers within grantees could be randomly assigned in a single block. However, for some larger grantees, there were differences among groups of centers in ra-cial/ethnic composition and part-day/full-day programming. The centers in these grantees were grouped into smaller four- or eight-center random assignment blocks so that all the centers in each block were comparable across these characteristics. In the full Head Start CARES sample, a total of 104 centers across 22 blocks were randomly assigned to one of the four study groups (The Incredible Years, Preschool PATHS, Tools of the Mind—Play, or the control group). Eighteen blocks included four centers in the study, and four blocks included eight centers. Fig-ure A.1 illustrates how random assignment was conducted in a grantee with one four-center block, a grantee with one eight-center block, and a grantee with two four-center blocks.

55
Head Start CARES Demonstration
Appendix Figure A.1
Randomization Design
GRANTEE 1
Block 1
Preschool PATHS center
Preschool PATHS center
Incredible Years center
Tools of the Mind – Play center
Incredible Years center
Control center
Block 1
NOTE: Nine grantees had 4 participating centers each; seven grantees had 8 participating centers each; and one grantee had 12 participating centers.
GRANTEE 2
Incredible Years center
Preschool PATHS center
Control center
Incredible Years center
Preschool PATHS center
Block 1 Block 2
GRANTEE 3
Incredible Years center
Preschool PATHS center
Tools of the Mind – Play center
Control center
Tools of the Mind – Play center
Control center
Tools of the Mind – Play center
Tools of the Mind – Play center
Control center

THIS PAGE INTENTIONALLY LEFT BLANK
Appendix B
Baseline Equivalence of Teachers, Classrooms, and Children Across Program and Control Groups

THIS PAGE INTENTIONALLY LEFT BLANK
59
Appendix B compares the characteristics of teachers, classrooms, and children across the three enhancement groups and the control group, as measured at study entry among classrooms that served a mix of 3- and 4-year-olds in Head Start CARES. It includes a discussion of the extent and significance of differences between the research groups. All differences discussed below are statistically significant.
The baseline characteristics of teachers, classrooms, and children across the enhance-ment and control groups were compared. This comparison is typically done in random assign-ment studies to assess the extent to which random assignment created balanced research groups with few statistically significant differences. These comparisons were conducted in the sample of mixed-aged classrooms and the sample of 3-year-old children, both when the enhancements were pooled and separately, by enhancement.
Tables B.1 through B.6 show the results of these comparisons. A small number of dif-ferences between the enhancement and control groups did emerge by chance; however, these differences do not suggest a systematically more advantaged enhancement group set of teachers, classrooms, or children relative to the teachers, classrooms, and children in the control group. Thus, observed program impacts at follow-up can be attributed to assignment to the enhance-ment condition with greater certainty.
Differences between teachers of mixed-age classrooms in the program and control groups are shown in Appendix Tables B.1 and B.2. When the enhancements were pooled (shown in Appendix Table B.1), teachers in the program group were found to be slightly older than teachers in the control group. Compared with teachers in the control group, more teachers in the program group were white and a smaller share was African-American. Teachers in the program group were found to have higher levels of depression (as measured by the K-6 Psycho-logical Distress Scale) and to be less likely to place equal value on children’s academic readi-ness and social-emotional development (“Neutral focus”).
When the comparisons were conducted by enhancement, as shown in Appendix Table B.2, a handful of differences emerged in each case. For The Incredible Years, relative to teachers in the control group, more teachers were white and fewer were African-American. For PATHS, a larger share of teachers was also white compared with the control group. PATHS teachers were also somewhat older than teachers in the control group. Finally, relative to teachers in the control group, a smaller share of PATHS teachers placed equal value on chil-dren’s academic readiness and social-emotional development (“Neutral focus”) and a larger share valued a focus on social-emotional development. In Tools of the Mind—Play classrooms, teachers were somewhat older than their counterparts in control group classrooms and a smaller share was African-American. Tools of the Mind—Play teachers also valued a focus on academ-ics more than control group teachers.
60
These small differences in teachers’ reported characteristics did not translate into any consistent observed differences in teacher practice and classroom climate (as shown in Appen-dix Tables B.3 and B.4). Of all observed measures of the Adapted Teaching Style Rating Scale (Adapted TSRS) and the Classroom Assessment Scoring System (CLASS), not one showed a statistically significant difference across enhancement and control groups when the enhance-ments were pooled, and only one showed a statistically significant difference by enhancement: PATHS classrooms scored higher than control classrooms on literacy focus, one of the CLASS subdimensions. That this was the only difference suggests that it was not part of a pattern of differences across the enhancement and control groups and indicates that the teaching practices and classroom climate of the enhancement and control group classrooms were well matched at baseline.
For child outcomes, only one difference emerged (as shown in Appendix Tables B.5 and B.6). When the enhancements were pooled, the program group had a somewhat smaller share of girls than did the control group. This difference was also borne out in the comparisons conducted by enhancement. Both PATHS and Tools of the Mind—Play classrooms had a smaller share of girls than did classrooms in the control group. These differences do not suggest that the children in the program and control groups differed in a systematic way that might have introduced bias into the impact analysis.
In sum, these findings suggest that random assignment was successful in producing groups of classrooms, teachers, and children that did not systematically differ across enhance-ment and control groups in the sample of 3-year-olds.
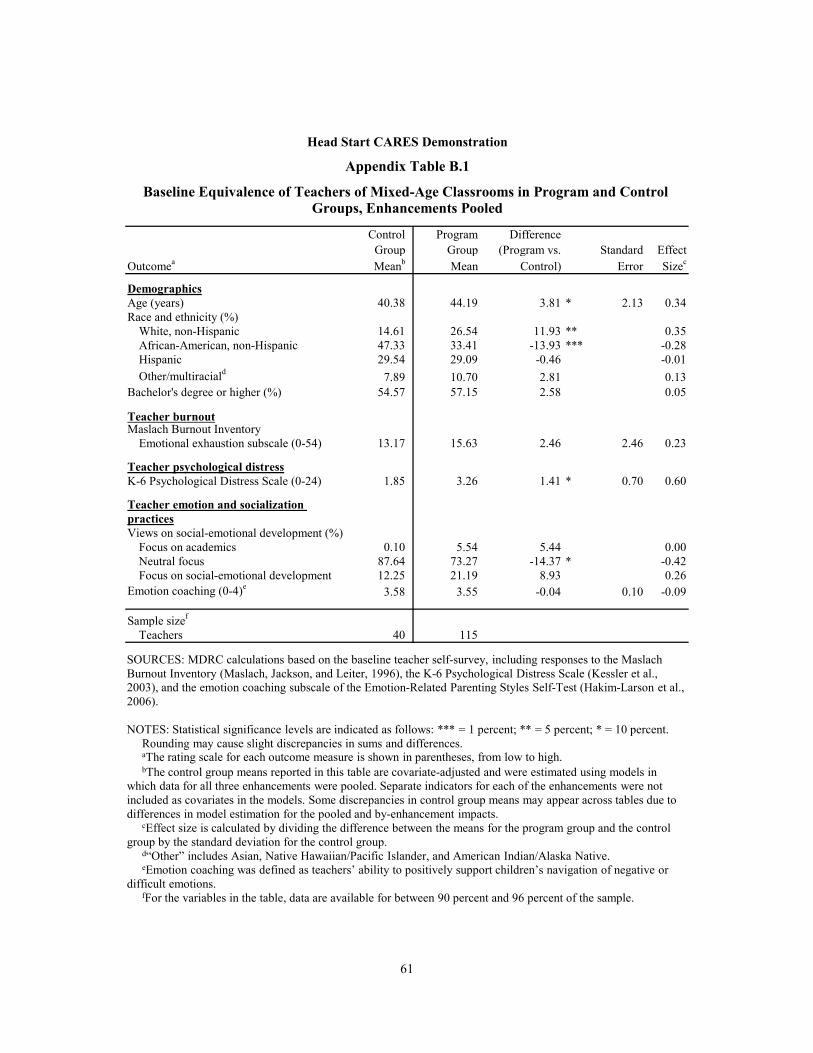
61
Control Program DifferenceGroup Group (Program vs. Standard Effect
Outcomea Meanb Mean Control) Error Sizec
DemographicsAge (years) 40.38 44.19 3.81 * 2.13 0.34Race and ethnicity (%)
White, non-Hispanic 14.61 26.54 11.93 ** 0.35African-American, non-Hispanic 47.33 33.41 -13.93 *** -0.28Hispanic 29.54 29.09 -0.46 -0.01Other/multiraciald 7.89 10.70 2.81 0.13
Bachelor's degree or higher (%) 54.57 57.15 2.58 0.05
Teacher burnoutMaslach Burnout Inventory
Emotional exhaustion subscale (0-54) 13.17 15.63 2.46 2.46 0.23
Teacher psychological distressK-6 Psychological Distress Scale (0-24) 1.85 3.26 1.41 * 0.70 0.60
Teacher emotion and socialization practicesViews on social-emotional development (%)
Focus on academics 0.10 5.54 5.44 0.00Neutral focus 87.64 73.27 -14.37 * -0.42Focus on social-emotional development 12.25 21.19 8.93 0.26
Emotion coaching (0-4)e 3.58 3.55 -0.04 0.10 -0.09
Sample sizef
Teachers 40 115
Head Start CARES Demonstration
Appendix Table B.1
Baseline Equivalence of Teachers of Mixed-Age Classrooms in Program and Control Groups, Enhancements Pooled
SOURCES: MDRC calculations based on the baseline teacher self-survey, including responses to the Maslach Burnout Inventory (Maslach, Jackson, and Leiter, 1996), the K-6 Psychological Distress Scale (Kessler et al., 2003), and the emotion coaching subscale of the Emotion-Related Parenting Styles Self-Test (Hakim-Larson et al., 2006).
NOTES: Statistical significance levels are indicated as follows: *** = 1 percent; ** = 5 percent; * = 10 percent.Rounding may cause slight discrepancies in sums and differences. aThe rating scale for each outcome measure is shown in parentheses, from low to high.bThe control group means reported in this table are covariate-adjusted and were estimated using models in
which data for all three enhancements were pooled. Separate indicators for each of the enhancements were not included as covariates in the models. Some discrepancies in control group means may appear across tables due to differences in model estimation for the pooled and by-enhancement impacts.
cEffect size is calculated by dividing the difference between the means for the program group and the control group by the standard deviation for the control group.
d“Other” includes Asian, Native Hawaiian/Pacific Islander, and American Indian/Alaska Native.eEmotion coaching was defined as teachers’ ability to positively support children’s navigation of negative or
difficult emotions.fFor the variables in the table, data are available for between 90 percent and 96 percent of the sample.
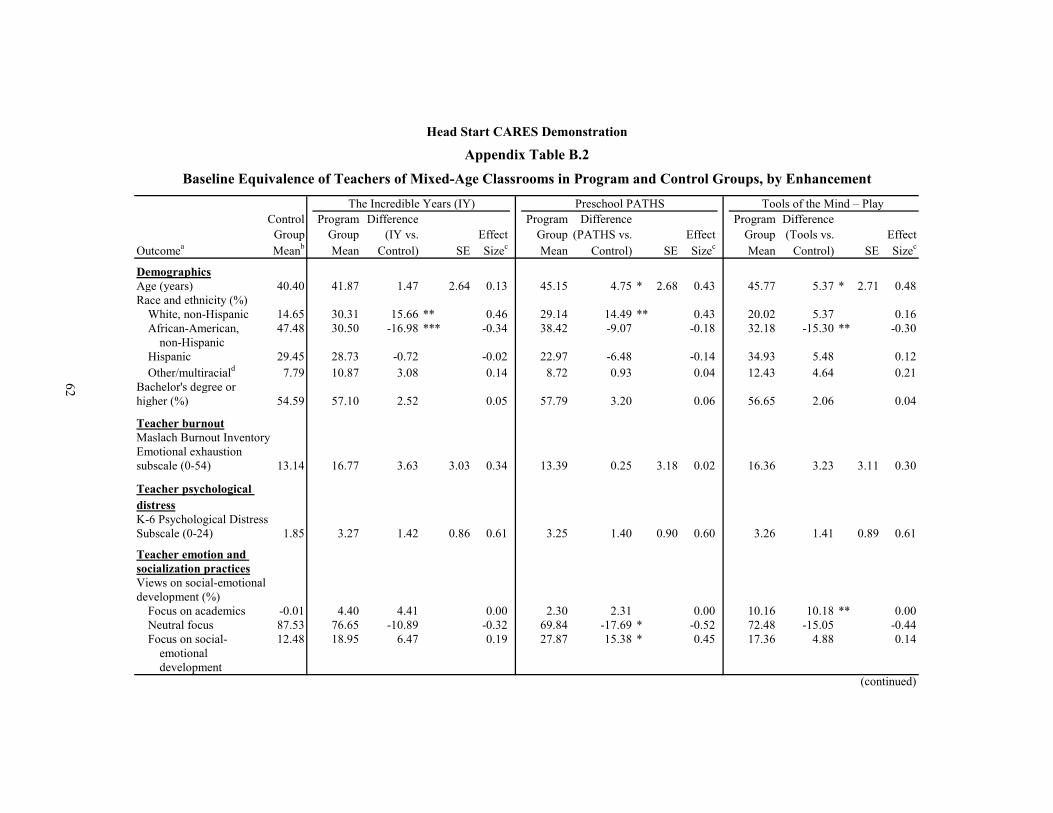
62
Control Program Difference Program Difference Program DifferenceGroup Group (IY vs. Effect Group (PATHS vs. Effect Group (Tools vs. Effect
Outcomea Meanb Mean Control) SE Sizec Mean Control) SE Sizec Mean Control) SE Sizec
DemographicsAge (years) 40.40 41.87 1.47 2.64 0.13 45.15 4.75 * 2.68 0.43 45.77 5.37 * 2.71 0.48Race and ethnicity (%)
White, non-Hispanic 14.65 30.31 15.66 ** 0.46 29.14 14.49 ** 0.43 20.02 5.37 0.16African-American, 47.48 30.50 -16.98 *** -0.34 38.42 -9.07 -0.18 32.18 -15.30 ** -0.30
non-HispanicHispanic 29.45 28.73 -0.72 -0.02 22.97 -6.48 -0.14 34.93 5.48 0.12Other/multiraciald 7.79 10.87 3.08 0.14 8.72 0.93 0.04 12.43 4.64 0.21
Bachelor's degree or higher (%) 54.59 57.10 2.52 0.05 57.79 3.20 0.06 56.65 2.06 0.04
Teacher burnoutMaslach Burnout Inventory
13.14 16.77 3.63 3.03 0.34 13.39 0.25 3.18 0.02 16.36 3.23 3.11 0.30
Teacher psychological distressK-6 Psychological DistressSubscale (0-24) 1.85 3.27 1.42 0.86 0.61 3.25 1.40 0.90 0.60 3.26 1.41 0.89 0.61
Teacher emotion and socialization practicesViews on social-emotional development (%)
Focus on academics -0.01 4.40 4.41 0.00 2.30 2.31 0.00 10.16 10.18 ** 0.00Neutral focus 87.53 76.65 -10.89 -0.32 69.84 -17.69 * -0.52 72.48 -15.05 -0.44Focus on social- 12.48 18.95 6.47 0.19 27.87 15.38 * 0.45 17.36 4.88 0.14
emotional development
Emotional exhaustion subscale (0-54)
(continued)
Head Start CARES Demonstration
Appendix Table B.2
Baseline Equivalence of Teachers of Mixed-Age Classrooms in Program and Control Groups, by Enhancement
The Incredible Years (IY) Preschool PATHS Tools of the Mind – Play
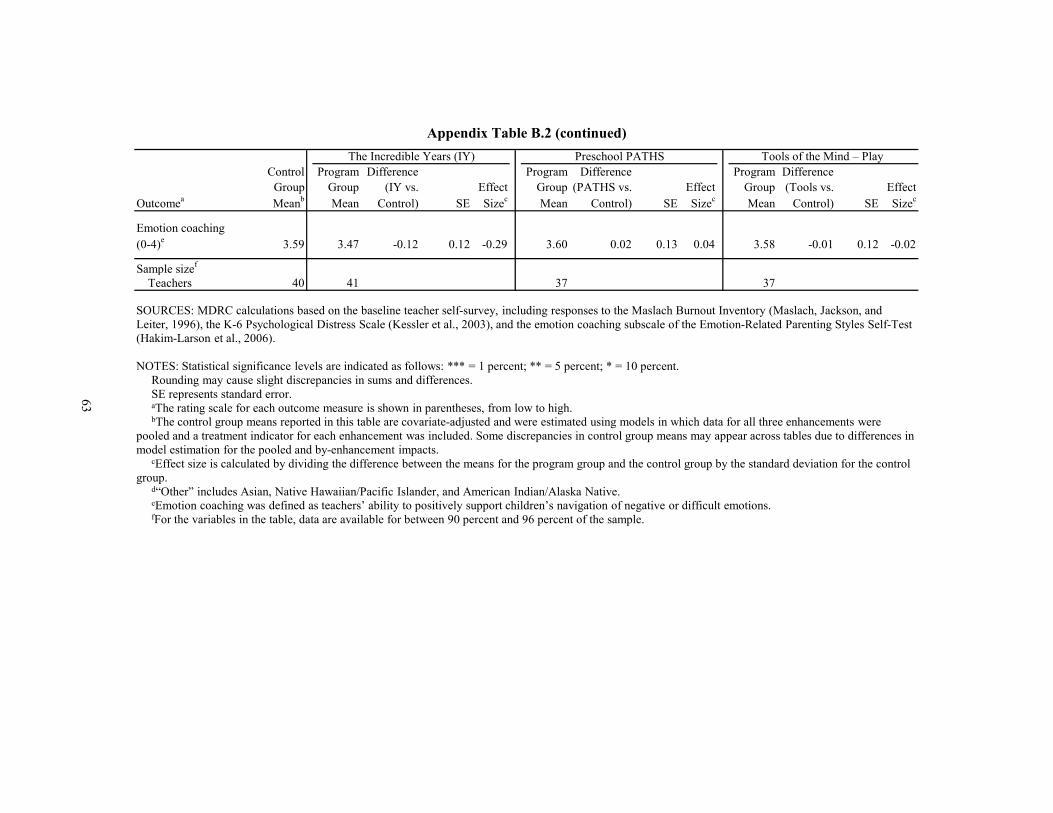
63
Control Program Difference Program Difference Program DifferenceGroup Group (IY vs. Effect Group (PATHS vs. Effect Group (Tools vs. Effect
Outcomea Meanb Mean Control) SE Sizec Mean Control) SE Sizec Mean Control) SE Sizec
Emotion coaching 3.59 3.47 -0.12 0.12 -0.29 3.60 0.02 0.13 0.04 3.58 -0.01 0.12 -0.02
Sample sizef
Teachers 40 41 37 37
(0-4)e
Appendix Table B.2 (continued)The Incredible Years (IY) Preschool PATHS Tools of the Mind – Play
SOURCES: MDRC calculations based on the baseline teacher self-survey, including responses to the Maslach Burnout Inventory (Maslach, Jackson, and Leiter, 1996), the K-6 Psychological Distress Scale (Kessler et al., 2003), and the emotion coaching subscale of the Emotion-Related Parenting Styles Self-Test (Hakim-Larson et al., 2006).
NOTES: Statistical significance levels are indicated as follows: *** = 1 percent; ** = 5 percent; * = 10 percent.Rounding may cause slight discrepancies in sums and differences.SE represents standard error.aThe rating scale for each outcome measure is shown in parentheses, from low to high.bThe control group means reported in this table are covariate-adjusted and were estimated using models in which data for all three enhancements were
pooled and a treatment indicator for each enhancement was included. Some discrepancies in control group means may appear across tables due to differences in model estimation for the pooled and by-enhancement impacts.
cEffect size is calculated by dividing the difference between the means for the program group and the control group by the standard deviation for the control group.
d“Other” includes Asian, Native Hawaiian/Pacific Islander, and American Indian/Alaska Native.eEmotion coaching was defined as teachers’ ability to positively support children’s navigation of negative or difficult emotions.fFor the variables in the table, data are available for between 90 percent and 96 percent of the sample.

64
Control Program DifferenceGroup Group (Program vs. Standard Effect
Outcomea Meanb Mean Control) Error Sizec
Observed teacher practice outcomesClassroom management (1-5) 3.75 3.76 0.02 0.17 0.02Social-emotional instruction (1-5) 1.77 1.74 -0.02 0.18 -0.03Scaffolding (1-5) 1.31 1.35 0.04 0.12 0.07
Observed classroom climate outcomesEmotional support (1-7) 5.37 5.34 -0.03 0.19 -0.03Classroom organization (1-7) 4.73 4.82 0.09 0.19 0.09Instructional support (1-7) 2.77 2.76 -0.01 0.18 -0.01Literacy focus (1-7) 1.30 1.36 0.06 0.09 0.17
Sample sized
Classrooms 40 115
Head Start CARES Demonstration
Appendix Table B.3
Baseline Equivalence of Mixed-Age Classrooms in Program and Control Groups, Enhancements Pooled
SOURCES: MDRC calculations based on the observational assessments completed using the Adapted Teaching Style Rating Scale (Raver et al., 2012) and the Classroom Assessment Scoring System (Pianta, La Paro, and Hamre, 2008).
NOTES: Statistical significance levels are indicated as follows: *** = 1 percent; ** = 5 percent; * = 10 percent.Rounding may cause slight discrepancies in sums and differences. aThe rating scale for each outcome measure is shown in parentheses, from low to high.bThe control group means reported in this table are covariate-adjusted and were estimated using models in
which data for all three enhancements were pooled. Separate indicators for each of the enhancements were not included as covariates in the models. Some discrepancies in control group means may appear across tables due to differences in model estimation for the pooled and by-enhancement impacts.
cEffect size is calculated by dividing the difference between the means for the program group and the control group by the standard deviation for the control group.
dFor all variables in the table, data are available for 99 percent of the sample.

Control Program Difference Program Difference Program DifferenceGroup Group (IY vs. Standard Effect Group (PATHS vs. Standard Effect Group (Tools vs. Standard Effect
Outcomea Meanb Mean Control) Error Sizec Mean Control) Error Sizec Mean Control) Error Sizec
Observed teacher practice outcomesClassroom management
(1-5) 3.75 3.64 -0.10 0.20 -0.13 3.66 -0.08 0.21 -0.11 3.98 0.24 0.20 0.30Social-emotional
instruction (1-5) 1.77 1.60 -0.17 0.22 -0.22 1.62 -0.14 0.23 -0.19 2.00 0.23 0.22 0.31Scaffolding (1-5) 1.31 1.28 -0.03 0.15 -0.04 1.35 0.04 0.16 0.07 1.43 0.12 0.16 0.19
Observed classroom climate outcomesEmotional support (1-7) 5.37 5.27 -0.11 0.24 -0.12 5.32 -0.06 0.25 -0.06 5.45 0.07 0.24 0.08Classroom
organization (1-7) 4.73 4.66 -0.07 0.23 -0.07 4.75 0.02 0.24 0.02 5.05 0.32 0.23 0.31Instructional support (1-7) 2.77 2.58 -0.19 0.22 -0.18 2.84 0.07 0.23 0.07 2.87 0.10 0.23 0.10Literacy focus (1-7) 1.30 1.34 0.04 0.11 0.11 1.50 0.20 * 0.11 0.55 1.25 -0.05 0.11 -0.14
Sample sized
Classrooms 40 41 37 37
The Incredible Years (IY) Preschool PATHS Tools of the Mind – Play
Head Start CARES Demonstration
Appendix Table B.4Baseline Equivalence of Mixed-Age Classrooms in Program and Control Groups, by Enhancement
SOURCES: MDRC calculations based on the observational assessments completed using the Adapted Teaching Style Rating Scale (Raver et al., 2012) and the Classroom Assessment Scoring System (Pianta, La Paro, and Hamre, 2008).
NOTES: Statistical significance levels are indicated as follows: *** = 1 percent; ** = 5 percent; * = 10 percent.Rounding may cause slight discrepancies in sums and differences.aThe rating scale for each outcome measure is shown in parentheses, from low to high.bThe control group means reported in this table are covariate-adjusted and were estimated using models in which data for all three enhancements were
pooled and a treatment indicator for each enhancement was included. Some discrepancies in control group means may appear across tables due to differences in model estimation for the pooled and by-enhancement impacts.
cEffect size is calculated by dividing the difference between the means for the program group and the control group by the standard deviation for the control group.
dFor all variables in the table, data are available for 99 percent of the sample.
65

66
Control Program DifferenceGroup Group (Program vs. Standard Effect
Outcomea Meanb Mean Control) Error Sizec
DemographicsAge (years) 3.44 3.43 -0.01 0.02 -0.03Female (%) 57.85 48.94 -8.91 ** -0.18
Behavior problems (teacher report)Total score (0-52) 7.30 7.85 0.55 1.16 0.08
Externalizing (0-22) 2.87 3.35 0.48 0.50 0.13Hyperactivity (0-10) 2.27 2.34 0.07 0.32 0.03Internalizing (0-20) 2.11 2.15 0.05 0.46 0.02
Social behaviors (teacher report)Social Skills Rating Scale (0-60) 33.77 35.14 1.37 1.60 0.13
Assertion (0-20) 10.15 10.73 0.58 0.65 0.12Cooperation (0-20) 11.98 12.39 0.41 0.53 0.11Self-control (0-20) 11.55 12.00 0.45 0.58 0.11
Interpersonal skills (1-7) 5.22 5.23 0.01 0.12 0.02
Learning behaviors (teacher report)Work-related skills (1-7) 4.14 4.17 0.03 0.14 0.03
Student-teacher relationship (teacherreport)
3.97 4.03 0.06 0.09 0.081.82 1.87 0.04 0.12 0.05
Pre-academic skills (teacher report)General knowledge (1-5) 1.81 1.72 -0.09 0.11 -0.12Language and literacy (1-5) 1.69 1.60 -0.09 0.10 -0.14Mathematical thinking (1-5) 1.58 1.53 -0.05 0.10 -0.08
Sample sized
Children 211 641
(continued)
Head Start CARES Demonstration
Appendix Table B.5
Baseline Equivalence of Child Characteristics and Pre-Test Measures for
Closeness (1-5)Conflict (1-5)
3-Year-Olds in Program and Control Groups, Enhancements Pooled
SOURCES: MDRC calculations based on the teachers’ reports, including responses to the Behavior Problems Index (Zill, 1990), the Social Skills Rating Scale (Gresham and Elliot, 1990), the Cooper-Farran Behavioral Rating Scales (Cooper and Farran, 1991), the Student-Teacher Relationship Scale (Pianta, 2001), and the Academic Rating Scale (National Center for Education Statistics, n.d.).
NOTES: Statistical significance levels are indicated as follows: *** = 1 percent; ** = 5 percent; * = 10 percent. Rounding may cause slight discrepancies in sums and differences. aThe rating scale for each outcome measure is shown in parentheses, from low to high.

67
Appendix Table B.5 (continued)
bThe control group means reported in this table are covariate-adjusted and were estimated using models in which data for all three enhancements were pooled. Separate indicators for each of the enhancements were not included as covariates in the models. Some discrepancies in control group means may appear across tables due to differences in model estimation for the pooled and by-enhancement impacts.
cEffect size is calculated by dividing the difference between the means for the program group and the control group by the standard deviation for the control group.
dFor all variables in the table, data are available for at least 95 percent of the sample.
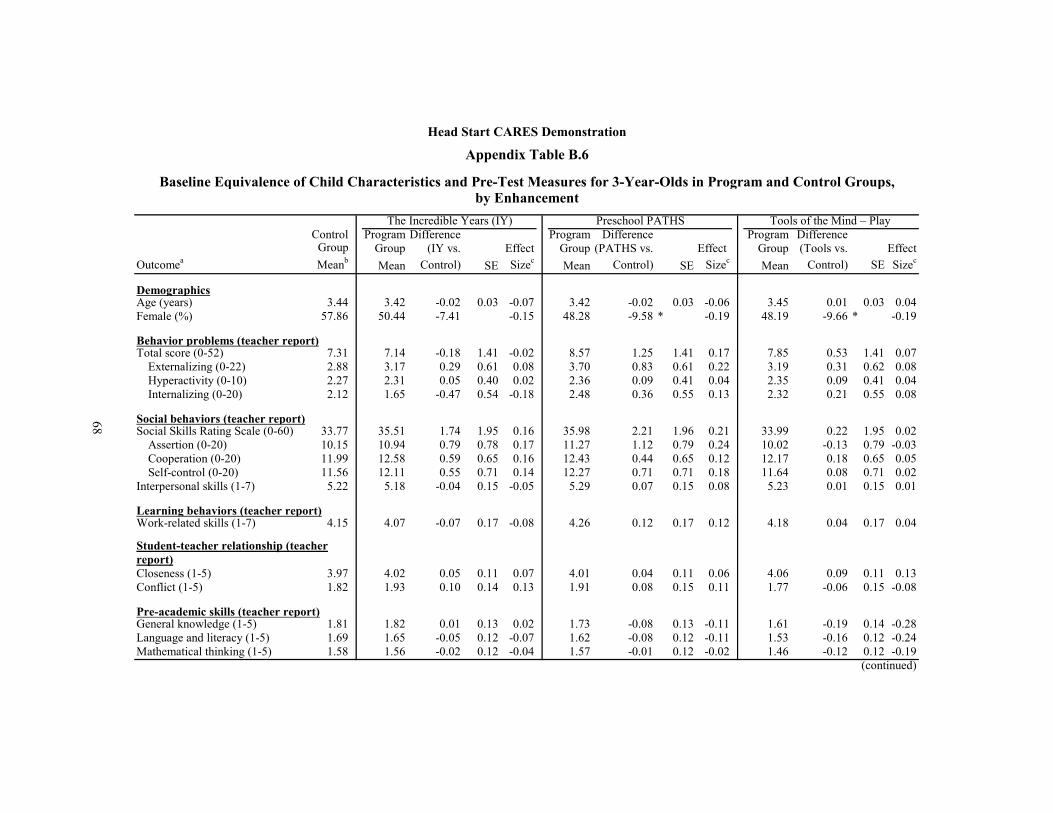
Control Program Difference Program Difference Program DifferenceGroup Group (IY vs. Effect Group (PATHS vs. Effect Group (Tools vs. Effect
Outcomea Meanb Mean Control) SE Sizec Mean Control) SE Sizec Mean Control) SE Sizec
DemographicsAge (years) 3.44 3.42 -0.02 0.03 -0.07 3.42 -0.02 0.03 -0.06 3.45 0.01 0.03 0.04Female (%) 57.86 50.44 -7.41 -0.15 48.28 -9.58 * -0.19 48.19 -9.66 * -0.19
Behavior problems (teacher report)Total score (0-52) 7.31 7.14 -0.18 1.41 -0.02 8.57 1.25 1.41 0.17 7.85 0.53 1.41 0.07
Externalizing (0-22) 2.88 3.17 0.29 0.61 0.08 3.70 0.83 0.61 0.22 3.19 0.31 0.62 0.08Hyperactivity (0-10) 2.27 2.31 0.05 0.40 0.02 2.36 0.09 0.41 0.04 2.35 0.09 0.41 0.04Internalizing (0-20) 2.12 1.65 -0.47 0.54 -0.18 2.48 0.36 0.55 0.13 2.32 0.21 0.55 0.08
Social behaviors (teacher report)Social Skills Rating Scale (0-60) 33.77 35.51 1.74 1.95 0.16 35.98 2.21 1.96 0.21 33.99 0.22 1.95 0.02
Assertion (0-20) 10.15 10.94 0.79 0.78 0.17 11.27 1.12 0.79 0.24 10.02 -0.13 0.79 -0.03Cooperation (0-20) 11.99 12.58 0.59 0.65 0.16 12.43 0.44 0.65 0.12 12.17 0.18 0.65 0.05Self-control (0-20) 11.56 12.11 0.55 0.71 0.14 12.27 0.71 0.71 0.18 11.64 0.08 0.71 0.02
Interpersonal skills (1-7) 5.22 5.18 -0.04 0.15 -0.05 5.29 0.07 0.15 0.08 5.23 0.01 0.15 0.01
Learning behaviors (teacher report)Work-related skills (1-7) 4.15 4.07 -0.07 0.17 -0.08 4.26 0.12 0.17 0.12 4.18 0.04 0.17 0.04
Student-teacher relationship (teacherreport)
3.97 4.02 0.05 0.11 0.07 4.01 0.04 0.11 0.06 4.06 0.09 0.11 0.131.82 1.93 0.10 0.14 0.13 1.91 0.08 0.15 0.11 1.77 -0.06 0.15 -0.08
Pre-academic skills (teacher report)General knowledge (1-5) 1.81 1.82 0.01 0.13 0.02 1.73 -0.08 0.13 -0.11 1.61 -0.19 0.14 -0.28Language and literacy (1-5) 1.69 1.65 -0.05 0.12 -0.07 1.62 -0.08 0.12 -0.11 1.53 -0.16 0.12 -0.24Mathematical thinking (1-5) 1.58 1.56 -0.02 0.12 -0.04 1.57 -0.01 0.12 -0.02 1.46 -0.12 0.12 -0.19
Closeness (1-5)Conflict (1-5)
(continued)
Appendix Table B.6Head Start CARES Demonstration
Tools of the Mind – Play Preschool PATHSThe Incredible Years (IY)
by EnhancementBaseline Equivalence of Child Characteristics and Pre-Test Measures for 3-Year-Olds in Program and Control Groups,
68
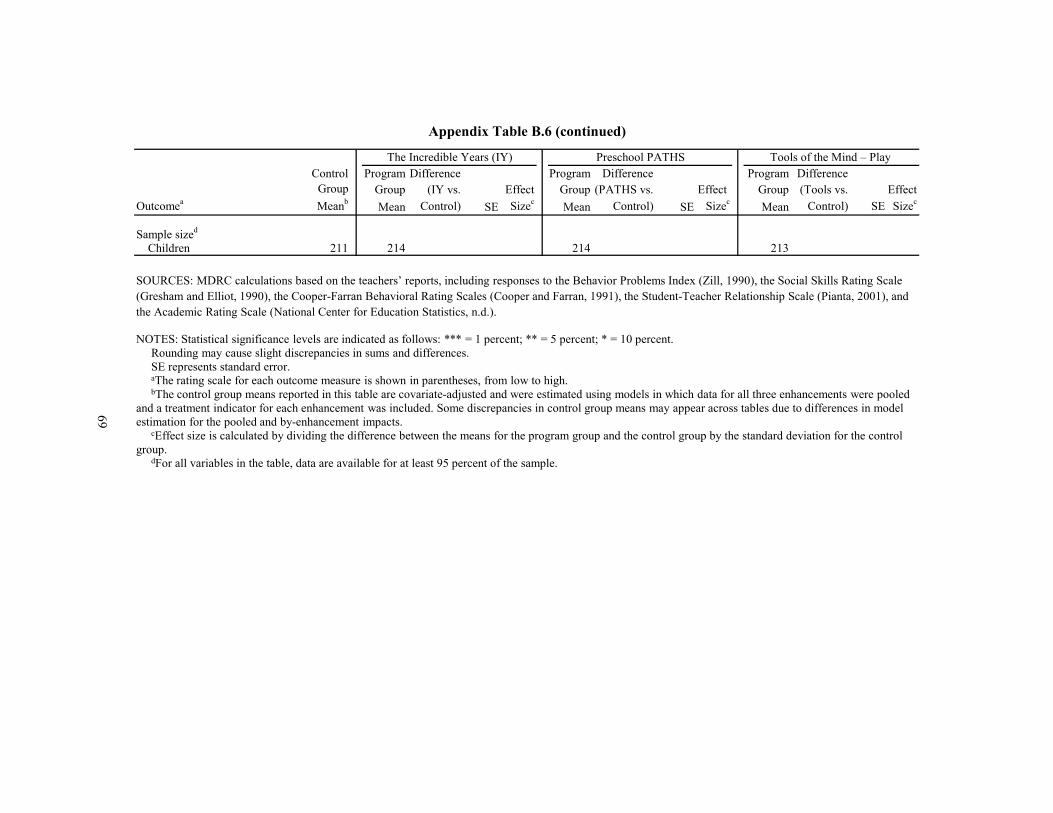
69
Control Program Difference Program Difference Program DifferenceGroup Group (IY vs. Effect Group (PATHS vs. Effect Group (Tools vs. Effect
Outcomea Meanb Mean Control) SE Sizec Mean Control) SE Sizec Mean Control) SE Sizec
Sample sized
Children 211 214 214 213
The Incredible Years (IY) Preschool PATHS Tools of the Mind – Play
Appendix Table B.6 (continued)
SOURCES: MDRC calculations based on the teachers’ reports, including responses to the Behavior Problems Index (Zill, 1990), the Social Skills Rating Scale (Gresham and Elliot, 1990), the Cooper-Farran Behavioral Rating Scales (Cooper and Farran, 1991), the Student-Teacher Relationship Scale (Pianta, 2001), and the Academic Rating Scale (National Center for Education Statistics, n.d.).
NOTES: Statistical significance levels are indicated as follows: *** = 1 percent; ** = 5 percent; * = 10 percent. Rounding may cause slight discrepancies in sums and differences.SE represents standard error.aThe rating scale for each outcome measure is shown in parentheses, from low to high.bThe control group means reported in this table are covariate-adjusted and were estimated using models in which data for all three enhancements were pooled
and a treatment indicator for each enhancement was included. Some discrepancies in control group means may appear across tables due to differences in model estimation for the pooled and by-enhancement impacts.
cEffect size is calculated by dividing the difference between the means for the program group and the control group by the standard deviation for the control group.
dFor all variables in the table, data are available for at least 95 percent of the sample.

THIS PAGE INTENTIONALLY LEFT BLANK
Appendix C
Sensitivity Analyses: Child-Level Impacts Controlling for Baseline Differences

THIS PAGE INTENTIONALLY LEFT BLANK

73
Appendix C examines the extent to which the impact estimates for 3-year-old children are internally valid and unbiased, despite the small differences across the enhancement and control groups shown in Appendix B.
Baseline data for children were collected between September and December of the Head Start year. As was shown in Appendix Tables B.5 and B.6, one small difference was observed between children in the program and control groups, both when the enhancements were pooled and when the comparisons were conducted by enhancement: There were more girls in the control group classrooms than in the pooled program group, PATHS classrooms, and Tools of the Mind—Play classrooms. This may be because random assignment did not completely “work” and minor differences between groups emerged. To assess the effect of these baseline differences, analyses were conducted to estimate impacts on 3-year-olds’ social-emotional and pre-academic outcomes while controlling for child gender. The findings are shown in Appendix Tables C.1 through C.4. The pattern of impacts on children’s social-emotional and pre-academic outcomes did not change when child gender was included as a covariate in the models.
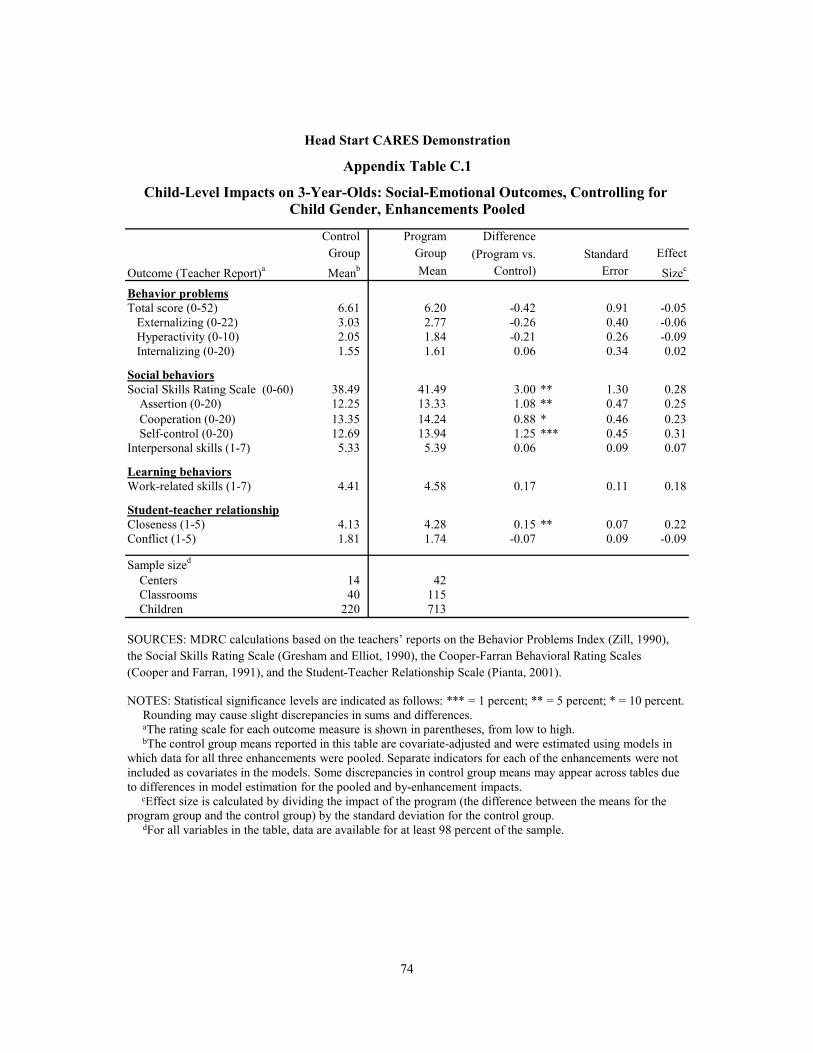
74
Control Program DifferenceGroup Group (Program vs. Standard Effect
Outcome (Teacher Report)a Meanb Mean Control) Error Sizec
Behavior problemsTotal score (0-52) 6.61 6.20 -0.42 0.91 -0.05
Externalizing (0-22) 3.03 2.77 -0.26 0.40 -0.06Hyperactivity (0-10) 2.05 1.84 -0.21 0.26 -0.09Internalizing (0-20) 1.55 1.61 0.06 0.34 0.02
Social behaviorsSocial Skills Rating Scale (0-60) 38.49 41.49 3.00 ** 1.30 0.28
Assertion (0-20) 12.25 13.33 1.08 ** 0.47 0.25Cooperation (0-20) 13.35 14.24 0.88 * 0.46 0.23Self-control (0-20) 12.69 13.94 1.25 *** 0.45 0.31
Interpersonal skills (1-7) 5.33 5.39 0.06 0.09 0.07
Learning behaviorsWork-related skills (1-7) 4.41 4.58 0.17 0.11 0.18
Student-teacher relationshipCloseness (1-5) 4.13 4.28 0.15 ** 0.07 0.22Conflict (1-5) 1.81 1.74 -0.07 0.09 -0.09
Sample sized
Centers 14 42Classrooms 40 115Children 220 713
Head Start CARES Demonstration
Appendix Table C.1
Child-Level Impacts on 3-Year-Olds: Social-Emotional Outcomes, Controlling for Child Gender, Enhancements Pooled
SOURCES: MDRC calculations based on the teachers’ reports on the Behavior Problems Index (Zill, 1990), the Social Skills Rating Scale (Gresham and Elliot, 1990), the Cooper-Farran Behavioral Rating Scales (Cooper and Farran, 1991), and the Student-Teacher Relationship Scale (Pianta, 2001).
NOTES: Statistical significance levels are indicated as follows: *** = 1 percent; ** = 5 percent; * = 10 percent.Rounding may cause slight discrepancies in sums and differences.aThe rating scale for each outcome measure is shown in parentheses, from low to high.bThe control group means reported in this table are covariate-adjusted and were estimated using models in
which data for all three enhancements were pooled. Separate indicators for each of the enhancements were not included as covariates in the models. Some discrepancies in control group means may appear across tables due to differences in model estimation for the pooled and by-enhancement impacts.
cEffect size is calculated by dividing the impact of the program (the difference between the means for theprogram group and the control group) by the standard deviation for the control group.
dFor all variables in the table, data are available for at least 98 percent of the sample.

Control Program Difference Program Difference Program DifferenceOutcome (Teacher Group Group (IY vs. Effect Group (PATHS vs. Effect Group (Tools vs. EffectReport)a Meanb Mean Control) SE Sizec Mean Control) SE Sizec Mean Control) SE Sizec
Behavior problems Total score (0-52) 6.61 5.88 -0.73 1.11 -0.09 5.97 -0.64 1.12 -0.08 6.73 0.13 1.12 0.02
Externalizing (0-22) 3.03 2.51 -0.51 0.48 -0.12 2.69 -0.34 0.48 -0.08 3.09 0.07 0.48 0.02Hyperactivity (0-10) 2.05 1.83 -0.21 0.32 -0.09 1.77 -0.27 0.32 -0.12 1.90 -0.14 0.32 -0.06Internalizing (0-20) 1.55 1.49 -0.07 0.41 -0.03 1.59 0.04 0.42 0.01 1.76 0.20 0.42 0.08
Social behaviors Social Skills Rating Scale (0-60) 38.52 44.41 5.90 *** 1.45 0.56 40.96 2.44 1.47 0.23 39.14 0.63 1.46 0.06
Assertion (0-20) 12.25 14.42 2.17 *** 0.54 0.51 13.10 0.85 0.55 0.20 12.48 0.22 0.55 0.05Cooperation (0-20) 13.37 15.21 1.84 *** 0.49 0.49 13.98 0.60 0.49 0.16 13.52 0.15 0.49 0.04Self-control (0-20) 12.70 14.76 2.06 *** 0.52 0.52 13.94 1.24 ** 0.53 0.31 13.15 0.46 0.53 0.11
Interpersonal skills (1-7) 5.33 5.45 0.13 0.11 0.14 5.34 0.01 0.11 0.01 5.38 0.05 0.11 0.06
Learning behaviors Work-related skills (1-7) 4.41 4.64 0.22 0.14 0.23 4.60 0.19 0.14 0.20 4.51 0.09 0.14 0.10
Student-teacher relationship Closeness (1-5) 4.14 4.41 0.27 *** 0.08 0.40 4.25 0.11 0.08 0.16 4.20 0.06 0.08 0.09Conflict (1-5) 1.81 1.66 -0.16 0.11 -0.19 1.81 -0.01 0.11 -0.01 1.77 -0.05 0.11 -0.06Sample sized
Centers 14 14 14 14Classrooms 40 41 37 37Children 220 246 226 241
(continued)
Head Start CARES Demonstration
Appendix Table C.2
Child-Level Impacts on 3-Year-Olds: Social-Emotional Outcomes, Controlling for Child Gender, by Enhancement
The Incredible Years (IY) Preschool PATHS Tools of the Mind – Play
75
Appendix Table C.2 (continued)
SOURCES: MDRC calculations based on the teachers’ reports on the Behavior Problems Index (Zill, 1990), the Social Skills Rating Scale (Gresham and Elliot, 1990), the Cooper-Farran Behavioral Rating Scales (Cooper and Farran, 1991), and the Student-Teacher Relationship Scale (Pianta, 2001).
NOTES: Statistical significance levels are indicated as follows: *** = 1 percent; ** = 5 percent; * = 10 percent.Rounding may cause slight discrepancies in sums and differences.SE represents standard error.aThe rating scale for each outcome measure is shown in parentheses, from low to high.bThe control group means reported in this table are covariate-adjusted and were estimated using models in which data for all three enhancements were
pooled and a treatment indicator for each enhancement was included. Some discrepancies in control group means may appear across tables due to differences in model estimation for the pooled and by-enhancement impacts.
cEffect size is calculated by dividing the impact of the program (the difference between the means for the program group and the control group) by the standard deviation for the control group.
dFor all variables in the table, data are available for at least 98 percent of the sample.
76
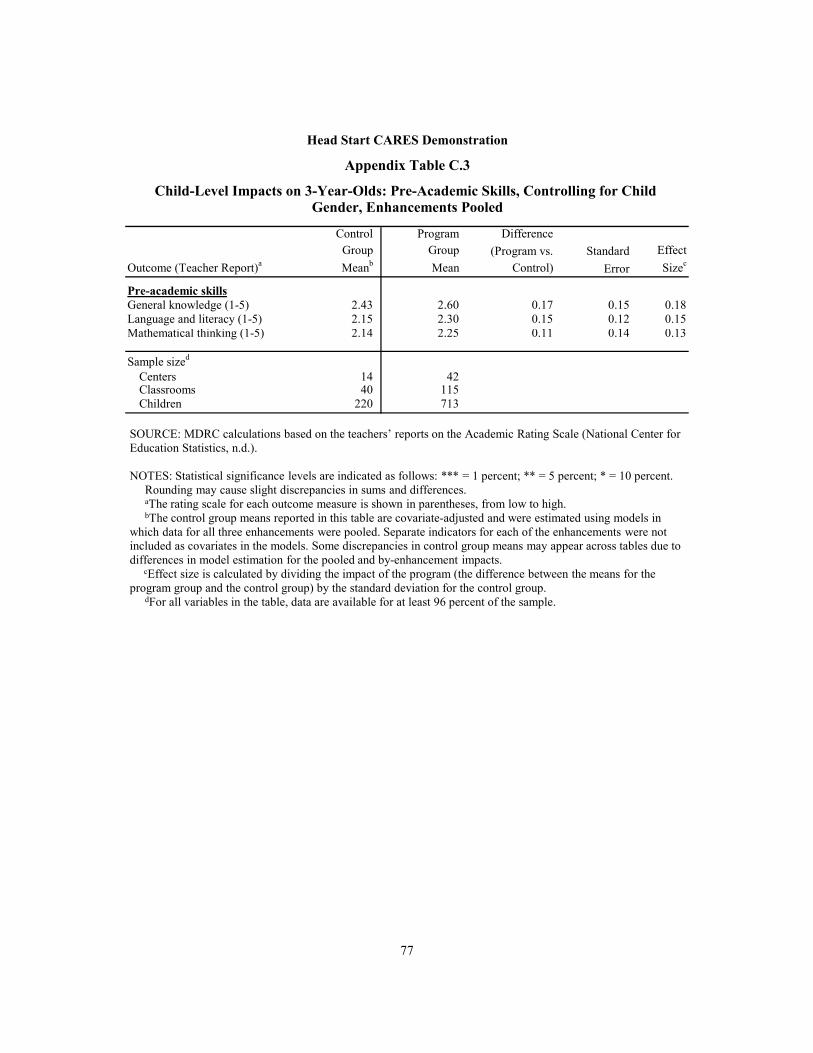
77
Control Program DifferenceGroup Group (Program vs. Standard Effect
Outcome (Teacher Report)a Meanb Mean Control) Error Sizec
Pre-academic skillsGeneral knowledge (1-5) 2.43 2.60 0.17 0.15 0.18Language and literacy (1-5) 2.15 2.30 0.15 0.12 0.15Mathematical thinking (1-5) 2.14 2.25 0.11 0.14 0.13
Sample sized
Centers 14 42Classrooms 40 115Children 220 713
Head Start CARES Demonstration
Appendix Table C.3
Child-Level Impacts on 3-Year-Olds: Pre-Academic Skills, Controlling for Child Gender, Enhancements Pooled
SOURCE: MDRC calculations based on the teachers’ reports on the Academic Rating Scale (National Center for Education Statistics, n.d.).
NOTES: Statistical significance levels are indicated as follows: *** = 1 percent; ** = 5 percent; * = 10 percent.Rounding may cause slight discrepancies in sums and differences.aThe rating scale for each outcome measure is shown in parentheses, from low to high.bThe control group means reported in this table are covariate-adjusted and were estimated using models in
which data for all three enhancements were pooled. Separate indicators for each of the enhancements were not included as covariates in the models. Some discrepancies in control group means may appear across tables due to differences in model estimation for the pooled and by-enhancement impacts.
cEffect size is calculated by dividing the impact of the program (the difference between the means for theprogram group and the control group) by the standard deviation for the control group.
dFor all variables in the table, data are available for at least 96 percent of the sample.

Control Program Difference Program Difference Program DifferenceGroup Group (IY vs. Effect Group (PATHS vs. Effect Group (Tools vs. Effect
Outcome (Teacher Report)a Meanb Mean Control) SE Sizec Mean Control) SE Sizec Mean Control) SE Sizec
Pre-academic skillsGeneral knowledge (1-5) 2.44 3.02 0.58 *** 0.16 0.62 2.49 0.06 0.16 0.06 2.30 -0.14 0.16 -0.15Language and literacy (1-5) 2.15 2.47 0.32 ** 0.14 0.33 2.26 0.11 0.14 0.11 2.15 0.00 0.14 0.00Mathematical thinking (1-5) 2.14 2.55 0.40 ** 0.15 0.49 2.18 0.04 0.15 0.05 2.01 -0.14 0.15 -0.16
Sample sized
Centers 14 14 14 14Classrooms 40 41 37 37Children 220 246 226 241
Head Start CARES Demonstration
Appendix Table C.4
Child-Level Impacts on 3-Year-Olds: Pre-Academic Skills, Controlling for Child Gender, by Enhancement
The Incredible Years (IY) Preschool PATHS Tools of the Mind – Play
SOURCE: MDRC calculations based on the teachers’ reports on the Academic Rating Scale (National Center for Education Statistics, n.d.).
NOTES: Statistical significance levels are indicated as follows: *** = 1 percent; ** = 5 percent; * = 10 percent.Rounding may cause slight discrepancies in sums and differences.SE represents standard error.aThe rating scale for each outcome measure is shown in parentheses, from low to high.bThe control group means reported in this table are covariate-adjusted and were estimated using models in which data for all three enhancements were
pooled and a treatment indicator for each enhancement was included. Some discrepancies in control group means may appear across tables due to differences in model estimation for the pooled and by-enhancement impacts.
cEffect size is calculated by dividing the impact of the program (the difference between the means for the program group and the control group) by the standard deviation for the control group.
dFor all variables in the table, data are available for at least 96 percent of the sample.
78

Appendix D
Measures Used in Head Start CARES Impact Analysis of 3-Year-Olds

THIS PAGE INTENTIONALLY LEFT BLANK
81
Appendix D provides further details on each of the measures used in the impact analysis of 3-year-olds’ outcomes. These details include information about how subscales were created, reliability scores, scoring rules, and internal consistencies. Information about measurement work conducted for the class-level measures discussed below is presented in an earlier report, which includes estimates of Head Start CARES’ impacts on 4-year-olds.1 When a measure’s internal consistency is presented as a range, it indicates that the Cronbach’s α varied across baseline and follow-up.
Teacher Practice and Classroom Climate
Adapted Teaching Style Rating Scale (Adapted TSRS)
In the spring before implementation and in the spring of the implementation year, asses-sors who were blind to the intervention status of the classrooms observed the lead teacher in each classroom for two hours.2 The Adapted TSRS was adapted for the Head Start CARES project by Dr. Cybele Raver from the original TSRS measure used in the Head Start REDI study.3 The Adapted TSRS was created to measure the targeted teacher practice of each of the three enhancements as they were implemented effectively in the classroom. Teachers were rated on a 5-point Likert scale on three teacher practices: (1) classroom management, which includes consistency/routine, preparedness, classroom awareness, positive behavior management, negative behavior management, and attention/engagement; (2) social-emotional instruction, which includes emotion modeling, emotion expression, emotion regulation, social awareness, social problem-solving, and provision of interpersonal support; and (3) scaffolding, which includes scaffolding dramatic play and scaffolding peer interaction.4 The Adapted TSRS was coded in two segments at the same time as the Classroom Assessment Scoring System (CLASS) observation, which is described in the next section. Each Adapted TSRS segment was made up of 40 minutes of observation followed by 10 minutes of coding.
At least 20 percent of classrooms in the full Head Start CARES sample were observed by two individuals at the same time to check for reliability. An item was considered reliable if the observers’ scores on that item differed by no more than 1 point. All the reliability scores across each of the two segments in an Adapted TSRS observation (30 scores in total) were averaged to calculate reliability for that observation. The average reliability score was 96 percent across all baseline observations and 93 percent across all follow-up observations in the
1Morris et al. (2014). 2Raver et al. (2012). 3Domitrovich, Cortes, and Greenberg (2007). 4Scaffolding consists of helping a child accomplish a challenging task or acquire a skill that is just beyond
the child’s current skill level.

82
full sample. When reliability coding took place in a classroom and two sets of scores were obtained, Adapted TSRS scores were created by averaging the scores across both observers for these classrooms.
The three Adapted TSRS scales are internally consistent for the sample of mixed-age Head Start CARES classrooms (Classroom Management Cronbach’s α = 0.88-0.92; Scaffold-ing Cronbach’s α = 0.72-0.90; Social-Emotional Instruction Cronbach’s α = 0.87-0.88).
Classroom Assessment Scoring System ― Preschool Version (CLASS)
In the spring before implementation and in the spring of the implementation year, indi-viduals who were blind to the intervention status of the classrooms observed all adults (includ-ing both teachers) in the classroom for half a day.5 CLASS provides global, 7-point Likert scores in four domains of classroom climate: (1) emotional support, which includes positive climate, negative climate, teacher sensitivity, and regard for student perspectives; (2) classroom organization, which includes behavior management, productivity, and instructional learning formats; (3) instructional support, which includes concept development, quality of feedback, and language modeling; and (4) literacy focus.
CLASS is coded in four segments; each segment consists of 20 minutes of observation followed by 10 minutes of coding. The score for each of the 11 dimensions that make up the four domains listed above was calculated as the average of the scores on that dimension across the four segments. The score for each of the first three domains listed above was calculated as the average of the scores of its dimensions.6 At least 20 percent of classrooms in the full Head Start CARES sample were observed by two individuals at the same time to check for reliability (the same classrooms that were used to assess reliability of the observers for the Adapted TSRS, as described above). An item was considered reliable if the observers’ scores on that item differed by no more than 1 point. The average reliability score was 95 percent across all baseline observations and 93 percent across all follow-up observations in the full sample. Also, like the Adapted TSRS, class-level CLASS scores used in this analysis were created by averag-ing scores across observers for these classrooms.
The items were categorized into the three specified domains (emotional support, class-room organization, and instructional support) based on the original factor analysis work for the measure.7 These domains are widely used for educational research and for administrative and assessment purposes in schools. The three scales are internally consistent for the sample of mixed-
5La Paro, Pianta, and Stuhlman (2004). 6Literacy focus includes only one dimension. 7Hamre, Pianta, Mashburn, and Downer (2007).
83
age Head Start CARES classrooms (Emotional Support Cronbach’s α = 0.85-0.89; Classroom Organization Cronbach’s α = 0.86-0.89; Instructional Support Cronbach’s α = 0.89-0.90).
Children’s Behavior Regulation and Learning Behaviors
Behavior Problems Index (BPI)
The Behavior Problems Index (BPI) was used as a teacher-reported measure of the fre-quency, range, and type of children’s behavior problems.8 A confirmatory factor analysis (CFA) of the teacher data for the sample of 3-year-olds confirmed that, consistent with prior research, three subscales fit the data well: children’s externalizing behavior (acting out or aggressive behavior), internalizing behavior (depression and anxiety), and hyperactivity. Appendix Table D.1 shows the factor loadings from this CFA.
The 28-item survey uses a 3-point Likert scale (0 = not true, 1 = sometimes true, 2 = of-ten true). For the total score and each subscale, the score was calculated as the sum of the survey items. Internal consistency for the total score was high for the teacher-reported total BPI (Cronbach’s α = 0.94). It was also high for the teacher-reported externalizing subscale (11 items, Cronbach’s α = 0.92), internalizing subscale (10 items, Cronbach’s α = 0.84-0.85), and hyperactivity subscale (5 items, Cronbach’s α = 0.83-0.85).
Cooper-Farran Behavioral Rating Scales (CFBRS) ― Work-Related Skills (WRS)
The Work-Related Skills subscale of the Cooper-Farran Behavioral Rating Scales is a 16-item survey based on a 7-point Likert scale.9 Teachers rated children on their ability to stay focused during school-related activities. The score for each child was calculated as the average of the survey items. Internal consistency is high for the sample of 3-year-olds (Cronbach’s α = 0.92).
8Zill (1990). 9Cooper and Farran (1991).
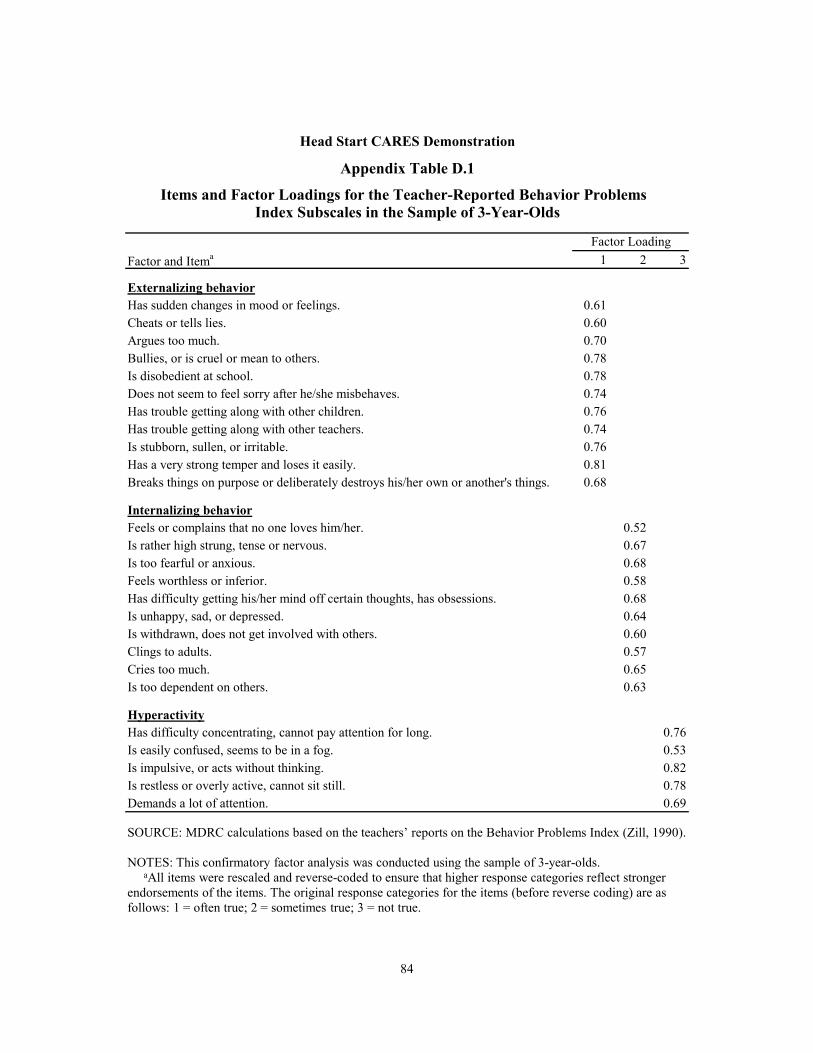
84
Factor and Itema 1 2 3
Externalizing behaviorHas sudden changes in mood or feelings. 0.61Cheats or tells lies. 0.60Argues too much. 0.70Bullies, or is cruel or mean to others. 0.78Is disobedient at school. 0.78Does not seem to feel sorry after he/she misbehaves. 0.74Has trouble getting along with other children. 0.76Has trouble getting along with other teachers. 0.74Is stubborn, sullen, or irritable. 0.76Has a very strong temper and loses it easily. 0.81Breaks things on purpose or deliberately destroys his/her own or another's things. 0.68
Internalizing behaviorFeels or complains that no one loves him/her. 0.52Is rather high strung, tense or nervous. 0.67Is too fearful or anxious. 0.68Feels worthless or inferior. 0.58Has difficulty getting his/her mind off certain thoughts, has obsessions. 0.68Is unhappy, sad, or depressed. 0.64Is withdrawn, does not get involved with others. 0.60Clings to adults. 0.57Cries too much. 0.65Is too dependent on others. 0.63
HyperactivityHas difficulty concentrating, cannot pay attention for long. 0.76Is easily confused, seems to be in a fog. 0.53Is impulsive, or acts without thinking. 0.82Is restless or overly active, cannot sit still. 0.78Demands a lot of attention. 0.69
Factor Loading
Head Start CARES Demonstration
Appendix Table D.1
Items and Factor Loadings for the Teacher-Reported Behavior Problems Index Subscales in the Sample of 3-Year-Olds
SOURCE: MDRC calculations based on the teachers’ reports on the Behavior Problems Index (Zill, 1990).
NOTES: This confirmatory factor analysis was conducted using the sample of 3-year-olds.aAll items were rescaled and reverse-coded to ensure that higher response categories reflect stronger
endorsements of the items. The original response categories for the items (before reverse coding) are as follows: 1 = often true; 2 = sometimes true; 3 = not true.
85
Children’s Social Behaviors
Social Skills Rating System ― Social Skills Scale (SSRS)
The SSRS measures children’s ability to cooperate with others, assert themselves to solve conflicts with peers, and regulate their own behavior.10 Preschool teachers reported on how often the child displays these social skills. The SSRS includes 30 items based on a 3-point Likert scale. The total social skills score was calculated as the sum of these 30 items and was internally consistent for preschool teachers in the sample of 3-year-olds (Cronbach’s α = 0.95-0.96). The three subscales — cooperation, assertion, and self-control — were calculated as the sum of the 10 items in each subscale. The subscales also showed high internal consistency for preschool teachers in the 3-year-old sample (cooperation Cronbach’s α = 0.88; assertion Cronbach’s α = 0.90; and self-control Cronbach’s α = 0.90-0.91).
Cooper-Farran Behavioral Rating Scales (CFBRS) ― Interpersonal Skills (IPS)
The IPS is a 21-item survey based on a 7-point Likert scale.11 The score for each child was calculated as the average of the survey items and showed high internal consistency in the 3-year-old sample (Cronbach’s α = 0.92).
Student-Teacher Relationship
Student-Teacher Relationship Scale (STRS)
The STRS measures teachers’ perceptions of the quality of their relationship with indi-vidual children along two dimensions: closeness and conflict.12 The closeness subscale is based on eight survey items and the conflict subscale is based on seven items, all of which are rated on a scale of 1 (definitely does not apply) to 5 (definitely applies). The two subscales showed high internal consistency in the 3-year-old sample (closeness Cronbach’s α = 0.81; and conflict Cronbach’s α = 0.90).
10Gresham and Elliot (1990). 11Cooper and Farran (1991). 12Pianta (2001).

86
Pre-Academic Skills
Academic Rating Scale (ARS)
The ARS consists of three subscales that assess children’s early language and literacy, mathematical thinking, and general knowledge skills.13 It is a 21-item survey and is based on a 5-point Likert scale. Scores are averages across the survey items in each subscale. The language and literacy subscale includes questions about whether children use complex sentence structures (for example, “If she had brought her umbrella, she wouldn’t have gotten wet”), can produce rhyming words, and can predict what will happen next in stories by using the pictures and storyline for cues. The mathematical thinking subscale includes questions about whether children can sort, classify, and compare math materials by various rules and attributes, order a group of objects, and show an understanding of the relationship between quantities. The general knowledge subscale includes such questions as whether the child “forms explanations based on observations and explorations” and “classifies and compares living and nonliving things in different ways.” All three subscales show internal consistency in the 3-year-old sample (lan-guage and literacy Cronbach’s α = 0.92-0.94; mathematical thinking Cronbach’s α = 0.94-0.96; and general knowledge Cronbach’s α = 0.92-0.96).
Teacher Characteristics
Race and Ethnicity
Race and ethnicity were coded into four mutually exclusive categories: (1) Hispanic (teacher indicated she was of Spanish, Hispanic, or Latino origin, regardless of race), (2) non-Hispanic white; (3) non-Hispanic black or African-American; and (3) non-Hispanic other (American Indian or Alaska Native, Asian, native Hawaiian or Pacific Islander, or multiracial).
Maslach Burnout Inventory Emotional Exhaustion Subscale (MBI)
Lead teachers’ ratings of emotional exhaustion and overextension at work were as-sessed using the MBI educator rating scale. Teachers rated nine items on a scale of 0 to 6.14 The overall score was the sum of the nine items and ranged from 0 to 54. The measure showed good internal consistency in the sample of teachers in mixed-age classrooms (Cronbach’s α = 0.90-0.91).
13National Center for Education Statistics (n.d.). 14Maslach, Jackson, and Leiter (1996).

87
Kessler Psychological Distress Scale (K-6)
The K-6 includes six questions that ask teachers about their emotional state.15 The sur-vey responses were collected using a scale of 1 (none of the time) to 5 (all of the time) and rescaled to 0 (none of the time) to 4 (all of the time). The six individual items were summed, producing an overall score ranging from 0 to 24. Low scores indicate low levels of psychologi-cal distress, and high scores indicate high levels of psychological distress. Example questions include “During the last 30 days, about how often did you feel nervous?” and “During the last 30 days, about how often did you feel worthless?” The measure showed good internal con-sistency in the sample of teachers in mixed-age classrooms (Cronbach’s α = 0.72-0.75).
Views on Social-Emotional Development
Teachers responded to a question asking about the relative value they placed on “aca-demic readiness” and “social-emotional readiness.” Teachers were considered to have an academic focus if they valued children’s academic readiness a lot more or a little more than social-emotional readiness. Teachers were considered to have a neutral focus if they valued academic readiness as much as they valued social-emotional readiness. Teachers were consid-ered to have a social-emotional focus if they valued academic readiness a little less or a lot less than social-emotional readiness.
Emotion Coaching
Emotion coaching was defined as teachers’ ability to positively support children’s navi-gation of negative or difficult emotions. Five items from the 23-item short version of the emotion coaching subscale of the Emotion-Related Parenting Styles Self-Test were included on the teacher self-survey.16 Four of these five items were highly correlated with each other and were used to construct a baseline measure of emotion coaching. Lead teachers responded to questions such as “When a child in my classroom is sad, we sit down to talk over the sadness” and “When a child in my classroom gets angry, my goal is to get him/her to stop.” The four items showed high internal consistency (Cronbach’s α = 0.82-0.84).
15Kessler et al. (2003). 16Hakim-Larson et al. (2006).

THIS PAGE INTENTIONALLY LEFT BLANK

Appendix E
Model Specifications

THIS PAGE INTENTIONALLY LEFT BLANK

91
Appendix E provides details about the analytic approach used to calculate the impact estimates presented in this report.
The following two-level model with fixed-effects dummy variables for the block level was used for the classroom and teacher outcomes:
Level 1: Classrooms in centers
µββ kcj
jkcjckc WY ++= ∑>0
0
Level 2: Centers
υγβ ccβ
βcc TZ ++= Π∑=
12
10
Reduced-form two-level model for classroom and teacher outcomes:
υµβγ ckcj
jkcjcβ
βckc WTZY ++++= ∑Π∑>= 0
12
1
Where:
Y kc = the outcome for classroom k in center c
W jkc = baseline characteristic j for classroom k in center c
Z βc = an indicator variable equal to 1 if center c is in random assignment block β,
and 0 otherwise
T c = the treatment indicator, which equals 1 if center c was randomized to treat-
ment (an intervention) and 0 if it was randomized to control status
µ kc = a random error for classroom k in center c that is independently and identi-
cally distributed across classrooms in centers
υ c = a random error for center c that is independently and identically distributed across centers
The following three-level model was used for the child outcomes:
Level 1: Students in classrooms
εαα skci
iskcikcskc XY ++= ∑>0
0

92
Level 2: Classrooms in centers
µβα kcckc +=00
Level 3: Centers
υγβ ccβ
βcc TZ ++= Π∑=
12
10
Reduced-form three-level model for child outcomes:
υµεαγ ckcskciskcicβ
βcskc XTZY +++++= ∑Π∑=
12
1
Where:
Y skc = the outcome for student s from classroom k in center c
X iskc = baseline characteristic i for student s from classroom k in center c
Z βc = an indicator variable equal to 1 if center c is in random assignment block β,
and 0 otherwise
T c = the treatment indicator, which equals 1 if center c was randomized to treat-
ment (an intervention) and 0 if it was randomized to control status
ε skc = a random error for student s from classroom k in center c that is independent-ly and identically distributed across students in classrooms
µ kc = a random error for classroom k in center c that is independently and identi-
cally distributed across classrooms in centers
υ c = a random error for center c that is independently and identically distributed across centers

Appendix F
Attrition and Turnover Analyses

THIS PAGE INTENTIONALLY LEFT BLANK
95
Appendix F examines the extent to which attrition of 3-year-old children and teacher turnover in the analysis sample might have biased the impact estimates presented in this report.
Child-Level Attrition Overall, approximately 13 percent of the sample of 3-year-olds left the Head Start centers between baseline data collection in fall of the preschool year and follow-up data collection in spring of the preschool year. Some attrition is to be expected, especially in a sample of low-income children, and 13 percent does not reflect a substantial number of children. It does, however, raise two important questions. First, did the children who left centers over the course of the year differ from those who stayed for the entire year? And second, was there differential attrition across the enhancement and control groups? The answer to the first question sheds light on differences between the baseline and follow-up samples of children. However, any differences found do not imply a bias in the impact estimates that are presented. The second question allows for the investigation of potential bias in the impact estimates as a result of attrition. The concern here is that differential attrition across the program and control groups could have resulted in groups of children in the enhancement and control classrooms who differed substantially.
With regard to the first question, an analysis comparing 3-year-old children who left the centers with those who remained suggests that children who left demonstrated higher levels of total behavior problems and externalizing and internalizing behavior problems than did those who stayed. Children who left were also rated lower on closeness with their teachers and higher on conflict with their teachers (as shown in Appendix Table F.1). These findings are consistent with previous work that shows that children who leave preschool classrooms tend to be a higher-risk group of children.1
With regard to the second question, attrition was calculated for the pooled enhance-ments, each enhancement separately, and the control group. When the three enhancements were pooled, the level of child attrition was statistically significantly lower for the program group than for the control group (13 percent for the pooled enhancements; 19 percent for the control group; statistically significant at p < 0.10). When the three enhancements were examined separately, attrition was statistically significantly lower for The Incredible Years (12 percent) and Tools of the Mind—Play (12 percent) than for the control group (19 percent; statistically significant at p < 0.10). Attrition in PATHS classrooms (15 percent) was similar to that in control group classrooms. The lower attrition rate in Incredible Years and Tools of the Mind—Play classrooms could have resulted in a higher-risk sample remaining in these classrooms than
1Raver, Garner, and Smith-Donald (2007).

96
DifferenceStayers Leavers (Leavers vs. Standard Effect
Outcomea Mean Mean Stayers) Error Sizeb
DemographicsAge (years) 3.43 3.43 0.00 0.03 -0.01Female (%) 51.09 51.98 0.89 0.02
Child outcomes (teacher report)Behavior problems Total score (0-52) 7.44 9.25 1.80 ** 0.88 0.21
Externalizing (0-22) 3.10 3.97 0.86 * 0.45 0.20Hyperactivity (0-10) 2.31 2.39 0.08 0.25 0.03Internalizing (0-20) 2.02 2.87 0.85 *** 0.30 0.29
Social behaviors Social Skills Rating Scale (0-60) 34.82 34.61 -0.21 1.16 -0.02
Assertion (0-20) 10.53 10.85 0.32 0.46 0.07Cooperation (0-20) 12.31 12.11 -0.21 0.40 -0.05Self-control (0-20) 11.93 11.64 -0.29 0.42 -0.07
Interpersonal skills (1-7) 5.25 5.13 -0.12 0.10 -0.12
Learning behaviors Work-related skills (1-7) 4.18 4.09 -0.09 0.10 -0.09
Student-teacher relationship Closeness (1-5) 4.04 3.91 -0.13 ** 0.06 -0.18Conflict (1-5) 1.83 2.01 0.18 ** 0.09 0.20
Pre-academic skillsGeneral knowledge (1-5) 1.75 1.72 -0.03 0.06 -0.04Language and literacy (1-5) 1.63 1.60 -0.03 0.06 -0.05Mathematical thinking (1-5) 1.54 1.56 0.02 0.06 0.03
Sample sizec
Children 742 110
(continued)
Head Start CARES Demonstration
Appendix Table F.1
Child Baseline Characteristics and Pre-Test Measures in the Sample of 3-Year-Olds:Differences Between Children Who Left the Program and Children Who Stayed in
the Program
SOURCES: MDRC calculations based on the teachers’ reports, including responses to the Behavior Problems Index (Zill, 1990), the Social Skills Rating Scale (Gresham and Elliot, 1990), the Cooper-Farran Behavioral Rating Scales (Cooper and Farran, 1991), the Student-Teacher Relationship Scale (Pianta, 2001), and the Academic Rating Scale (National Center for Education Statistics, n.d.).
NOTES: Statistical significance levels are indicated as follows: *** = 1 percent; ** = 5 percent; * = 10 percent.Rounding may cause slight discrepancies in sums and differences.
97
in control group classrooms, which could have attenuated the impacts on the follow-up sample of 3-year-olds. To examine whether this differential attrition resulted in groups of Incredible Years and Tools of the Mind—Play children who differed from those in control group class-rooms, baseline differences were examined between children in Incredible Years and control group classrooms and between children in Tools of the Mind—Play and control group class-rooms for those children who remained at follow-up. Among children who did not leave the sample, there were no statistically significant differences between the Incredible Years group and the control group or between the Tools of the Mind—Play group and the control group, suggesting that while there was a lower rate of attrition in Incredible Years and Tools of the Mind—Play classrooms than in control group classrooms, it did not produce an unbalanced sample.
Teacher-Level Turnover Teacher turnover was also examined in the sample of mixed-age classrooms. Since data were collected on teachers who replaced the teachers who left, this is not an “attrition” analysis per se. Rather, it is helpful for understanding the extent to which the baseline data represent the follow-up sample of teachers, as well as the extent to which implementation in Head Start CARES might have been compromised if changes in teaching staff occurred after the beginning of teacher training. Overall, approximately 30 percent of teachers left the mixed-age classrooms between baseline data collection in the spring before the preschool year and follow-up in the spring of the preschool year. Most of the teachers who left the sample did so during the summer before the implementation year began. Teachers who left the sample were more likely to have less than three years of experience, more likely to report being burnt out and psychologically distressed, less likely to report a neutral teaching focus, and more likely to report a focus on social-emotional development (as shown in Appendix Table F.2). Despite these differences, teacher turnover rates for the pooled enhancements and for The Incredible Years, PATHS, and Tools of the Mind—Play were not statistically significantly different from the turnover rate for the control group.
Appendix Table F.1 (continued)aThe rating scale for each outcome measure is shown in parentheses, from low to high.bEffect size is calculated by dividing the difference between the means for the leavers group and the stayers
group by the standard deviation for the stayers group.cFor all variables in the table, data are available for at least 95 percent of the sample.

98
DifferenceStayers Leavers (Leavers vs. Standard Effect
Outcomea Mean Mean Stayers) Error Sizeb
DemographicsAge (years) 43.60 42.11 -1.49 2.28 -0.12Race and ethnicity (%)
White, non-Hispanic 23.33 23.53 0.21 0.01African-American, non-Hispanic 35.49 41.12 5.62 0.11Hispanic 28.59 30.61 2.02 0.05Other/multiracialc 12.53 4.57 -7.96 -0.26
Bachelor's degree or higher (%) 55.16 59.00 3.84 0.08Teaching experience (%)
< 3 years 3.72 11.86 8.14 ** 0.59 3 to < 10 years 24.47 30.48 6.00 0.14
≥ 10 years 71.78 57.80 -13.98 -0.32
Teacher burnout Maslach Burnout Inventory
Emotional exhaustion subscale (0-54) 13.64 17.72 4.09 * 2.00 0.39
Teacher psychological distressK-6 Psychological Distress Scale (0-24) 2.48 3.68 1.21 * 0.64 0.38
Teacher emotion and socialization practicesViews on social-emotional development (%)
Focus on academic 2.86 6.46 3.60 0.21Neutral focus 83.11 65.50 -17.61 ** -0.48Focus on social-emotional development 14.04 28.04 14.01 * 0.42
Emotion coaching (0-4)d 3.56 3.54 -0.02 0.09 -0.04
Sample sizee
Teachers 104 45
Head Start CARES Demonstration
Appendix Table F.2
Baseline Teacher Characteristics in Mixed-Age Classrooms: Differences Between Teachers Who Left the Program and Teachers Who Stayed in
the Program
(continued)
SOURCES: MDRC calculations based on the baseline teacher self-survey, including responses to the Maslach Burnout Inventory (Maslach, Jackson, and Leiter, 1996), the K-6 Psychological Distress Scale (Kessler et al., 2003), and the emotion coaching subscale of the Emotion-Related Parenting Styles Self-Test (Hakim-Larson et al., 2006).
NOTES: Statistical significance levels are indicated as follows: *** = 1 percent; ** = 5 percent; * = 10 percent.
Rounding may cause slight discrepancies in sums and differences.aThe rating scale for each outcome measure is shown in parentheses, from low to high.
99
Appendix Table F.2 (continued)
bEffect size is calculated by dividing the difference between the means for the leavers group and the stayers group by the standard deviation for the stayers group.
c“Other” includes Asian, Native Hawaiian/Pacific Islander, and American Indian/Alaska Native.dEmotion coaching was defined as teachers’ ability to positively support children’s
navigation of negative or difficult emotions.eFor all variables in the table, data are available for at least 94 percent of the sample.

THIS PAGE INTENTIONALLY LEFT BLANK

Appendix G
Glossary

THIS PAGE INTENTIONALLY LEFT BLANK
103
Classroom climate: Children’s experiences and interactions in the classroom.
Coaching: In this study, coaching entailed a 30-minute meeting with the coach, lead teacher, and assistant teacher, as well as a 60-minute observation period in the classroom.
Emotion knowledge: An awareness of one’s emotions and those of others as well as an understanding of how to identify emotions both affectively and in emotionally evocative situations.
Executive function: Set-shifting (or the ability to flexibly shift between different pieces of information), inhibition (or the ability to stop or repress an immediate response in favor of a planned response), and working (or short-term) memory.
Externalizing problems: A form of behavior problems that manifests through acting out or aggressive behavior.
Grantee: The local public or private nonprofit agency that has been designated as a Head Start provider.
Impact: The difference in average outcomes for the program (in this study, the “enhancement”) and control groups, as measured at follow-up. This difference is referred to as the “impact” of the program because, in a random assignment study, the program and control groups are similar when they enter the study. Therefore, any difference between the groups at a later point in time can be confidently attributed to the program.
Internalizing problems: A form of behavior problems that manifests through internalizing or withdrawn behavior such as depression or anxiety.
Learning behaviors: Children’s ability to focus their attention and behavior during classroom activities. Sometimes referred to as “approaches to learning.” Learning behaviors encompass skills such as persistence, curiosity, and engagement.
Scaffolding: A teacher helping to support a child to reach a challenging task or skill that is just beyond the child’s current ability level.
Skills: “Building blocks” that are the prerequisites to various behaviors.
Social behaviors: Children’s positive interactions with peers and teachers.
Social-emotional development/competence: The developing capacity of the child to form close and secure adult and peer relationships; experience, regulate, and express emotions in socially and culturally appropriate ways; and explore the environment and learn.1
1Yates et al. (2008).
104
Social problem-solving: A multistep process including the assessment of a problem, develop-ing solutions and understanding the outcomes of various solutions, and selecting a competent response from among a set of possible responses.
Teacher training: In the Head Start CARES study, teacher training comprised an ongoing set of workshops offered throughout the year in which lead and assistant teachers could learn enhancement-specific material from highly skilled trainers at regular intervals.
105
References
Aber, J. Lawrence, Stephanie Jones, and Jennifer Cohen. 2000. “The Impact of Poverty on the Mental Health and Development of Very Young Children.” Pages 113-128 in C. H. Zeanah Jr. (Ed.), Handbook of Infant Mental Health, 2nd Edition. New York: Guilford Press.
Aikens, Nikki, Lara Kristin Hulsey, Emily Moiduddin, Ashley Kopack, Amy Takyi-Laryea, Louisa Tarullo, and Jerry West. 2011. Data Tables for FACES 2009 Head Start Children, Families, and Programs: Present and Past Data from FACES Report. OPRE Report 2011-33b. Washington, DC: Office of Planning, Research and Evaluation, Administration for Children and Families, U.S. Department of Health and Human Services.
Arnold, David H., Sharice A. Brown, Susan Meagher, Courtney N. Baker, Jennifer Dobbs, and Greta L. Doctoroff. 2006. “Preschool-based Programs for Externalizing Problems.” Education and Treat-ment of Children 29: 311-339.
Barnett, Steven W., Kwanghee Jung, Donald J. Yarosz, Jessica Thomas, Amy Hornbeck, Robert Stechuk, and Susan Burns. 2008. “Educational Effects of the Tools of the Mind Curriculum: A Randomized Trial.” Early Childhood Research Quarterly 23: 299-313.
Biederman, Joseph, Dina R. Hirshfeld-Becker, Jerrold F. Rosenbaum, Christine Herot, Deborah Fried-man, Nancy Snidman, Jerome Kagan, and Stephen V. Faraone. 2001. “Further Evidence of Asso-ciation Between Behavioral Inhibition and Social Anxiety in Children.” American Journal of Psy-chiatry 158: 1673-1679.
Bierman, Karen L., Celene E. Domitrovich, Robert L. Nix, Scott D. Gest, Janet A. Welsh, Mark T. Greenberg, Clancy Blair, Keith E. Nelson, and Suhkdeep Gill. 2008. “Promoting Academic and Social-Emotional School Readiness: The Head Start REDI Program.” Child Development 79, 6: 1802-1817.
Blair, Clancy B., and Rachel Peters Razza. 2007. “Relating Effortful Control, Executive Function, and False Belief Understanding to Emerging Math and Literacy Ability in Kindergarten.” Child Devel-opment 78, 2: 647-663.
Bloom, Howard, Carolyn J. Hill, Alison Rebeck Black, and Mark W. Lipsey. 2008. Performance Tra-jectories and Performance Gaps as Achievement Effect-Size Benchmarks for Educational Inter-ventions. New York: MDRC.
Broidy, Lisa M., Richard E. Tremblay, Bobby Brame, David Fergusson, John L. Horwood, Robert Laird, Terrie E. Moffitt, Daniel S. Nagin, John E. Bates, Kenneth A. Dodge, Rolf Loeber, Donald R. Lynam, Gregory S. Pettit, and Frank Vitaro. 2003. “Developmental Trajectories of Childhood Disruptive Behaviors and Adolescent Delinquency: A Six-Site, Cross-national Study.” Develop-mental Psychology 39, 2: 222-245.
106
Center on the Social and Emotional Foundations for Early Learning. 2008. “Handout 1.7. Definition of Social Emotional Development.” CSEFEL Infant-Toddler Module 1. Nashville, TN: Center on the Social and Emotional Foundations for Early Learning. Website: http://csefel.vanderbilt.edu/resources/inftodd/mod1/1.7.pdf.
Child Trends. 2014. Head Start: Indicators on Children and Youth. Child Trends Data Bank. Bethesda, MD: Child Trends. Web site: www.childtrends.org/wp-content/uploads/2013/02/97_Head_Start.pdf.
Clements, Douglas H., Julie Sarama, Fatih Unlu, and Carolyn Layzer. 2012. “The Efficacy of an Inter-vention Synthesizing Scaffolding Designed to Promote Self-Regulation with an Early Mathematics Curriculum: Effects on Executive Function.” Presented at SREE Spring 2012 Conference, Wash-ington, DC, March 8-10.
Cole, Pamela, Margaret K. Michel, and Laureen O’Donell Teti. 1994. “The Development of Emotion Regulation and Dysregulation: A Clinical Perspective.” Monographs of the Society for Research in Child Development 59, 2-3: 73-102.
Cooper, David H., and Dale Clark Farran.1991. The Cooper-Farran Behavioral Rating Scales. Bran-don, VT: Clinical Psychology Publishing Co.
Consortium on the School-Based Promotion of Social Competence. 1994. “The School-Based Promo-tion of Social Competence: Theory, Research, Practice, and Policy.” Pages 269-315 in Robert J. Haggerty, Lonnie R. Sherrod, Norman Garmezy, and Michael Rutter (eds.), Stress, Risk and Resil-ience in Children and Adolescence: Processes, Mechanisms, and Interventions. New York: Cam-bridge University Press.
Costello, E. Jane, Gordon P. Keeler, and Adrian Angold. 2001. “Poverty, Race/Ethnicity and Psychiatric Disorder: A Study of Rural Children.” American Journal of Public Health 91: 1494-1498.
Diamond, Adele. 2002. “Normal Development of Prefrontal Cortex from Birth to Young Adulthood: Cognitive Functions, Anatomy, and Biochemistry.” Pages 466-503 in Donald T. Stuss (ed.), Prin-ciples of Frontal Lobe Function. New York: Oxford University Press.
Domitrovich, Celene E., Rebecca C. Cortes, and Mark T. Greenberg. 2007. “Improving Young Chil-dren’s Social and Emotional Competence: A Randomized Trial of the Preschool ‘PATHS’ Curric-ulum.” The Journal of Primary Prevention 28, 2: 67-91.
Domitrovich, Celene E., Scott D. Gest, Sukhdeep Gill, Karen L. Bierman, Janet A. Welsh, and Damon Jones. 2009. “Fostering High-Quality Teaching with an Enriched Curriculum and Professional Development Support: The Head Start REDI Program.” American Educational Research Journal 46: 567-597.
Farran, Dale, Mark W. Lipsey, and Sandra Jo Wilson. 2012. “Experimental Evaluation of the Tools of the Mind Curriculum.” Presented at SREE Spring 2012 Conference, Washington, DC, March 8-10.
Goldman, Jane A. 1981. “Social Participation of Preschool Children in Same- versus Mixed-age Groups.” Child Development 52, 2:, 644-650.
107
Gresham, Frank, and Stephen N. Elliott. 1990. Social Skills Rating System Manual. Minneapolis, MN: NCS Pearson, Inc.
Hakim-Larson, Julie, Alison Parker, Catharine Lee, Jacqueline Goodwin, and Sylvia Voelker. 2006. “Measuring Parental Meta-Emotion: Psychometric Properties of the Emotion-Related Parenting Styles Self-Test.” Early Education and Development 17, 2: 229-251.
Hamre, Bridget K., Robert C. Pianta, Andrew J. Mashburn, and Jason T. Downer. 2007. Building a Sci-ence of Classrooms: Application of the CLASS Framework in over 4,000 U.S. Early Childhood and Elementary Classrooms. New York: Foundation for Child Development.
Kessler, Ronald C., Peggy R. Barker, Lisa J. Colpe, Joan F. Epstein, Joseph C. Gfroerer, Eva Hiripi, Mary J. Howes, Sharon-Lise T. Normand, Ronald W. Manderscheid, Ellen E. Walters, and Alan M. Zaslavsky. 2003. “Screening for Serious Mental Illness in the General Population.” Archives of General Psychiatry 60: 184-189.
Ladd, Gary W., Sandra H. Birch, and Eric S. Buhs. 1999. “Children’s Social and Scholastic Lives in Kindergarten: Related Spheres of Influence?” Child Development 70, 6: 1373-1400.
Ladd, Gary W., and Kim B. Burgess. 1999. “Charting the Relationship Trajectories of Aggressive, Withdrawn, and Aggressive/Withdrawn Children During Early Grade School.” Child Develop-ment 70, 4: 910-929.
La Paro, Karen M., Robert C. Pianta, and Megan Stuhlman. 2004. “The Classroom Assessment Scoring System: Findings from the Pre-kindergarten Year.” The Elementary School Journal 104, 5: 409-426.
Lonigan, Christopher J., Stephen R. Burgess, and Jason L. Anthony. 2000. “Development of Emergent Literacy and Early Reading Skills in Preschool Children: Evidence from a Latent-Variable Longi-tudinal Study.” Developmental Psychology 36, 5: 596-613.
Lonigan, Christopher J., and Beth M. Phillips. 2012. “Comparing Skills-Focused and Self-Regulation Focused Preschool Curricula: Impacts on Academic and Self-Regulatory Skills.” Presented at SREE Spring 2012 Conference, Washington, DC, March 8-10.
Mattera, Shira, Chrishana M. Lloyd, Mike Fishman, and Michael Bangser. 2013. A First Look at the Head Start CARES Demonstration: Large-Scale Implementation of Programs to Improve Chil-dren’s Social-Emotional Competence. OPRE Report 2013-47. Washington, DC: Office of Plan-ning, Research and Evaluation, Administration for Children and Families, U.S. Department of Health and Human Services.
Maslach, Christina, Susan E. Jackson, and Michael P. Leiter. 1996. Maslach Burnout Inventory Manu-al. Third Edition. Menlo Park, CA: Mind Garden.
McClelland, Megan M., Frederick J. Morrison, and Deborah. L. Holmes. 2000. “Children at Risk for Early Academic Problems: The Role of Learning-Related Social Skills.” Early Childhood Re-search Quarterly 15, 3: 307-329.
Moiduddin, Emily, Nikki Aikens, Louisa Tarullo, Jerry West, and Yange Xue. 2012. Child Outcomes and Classroom Quality in FACES 2009. OPRE Report 2012-37a. Washington, DC: Office of
108
Planning, Research and Evaluation, Administration for Children and Families, U.S. Department of Health and Human Services.
Morales, Julie R., and Nancy G. Guerra. 2006. “Effects of Multiple Context and Cumulative Stress on Urban Children’s Adjustment in Elementary School.” Child Development 77, 4: 907-923.
Morris, Arlene M., Jean M. Williams, Anne E. Atwater, and Jack H. Wilmore. 1982. “Age and Sex Dif-ferences in Motor Performance of 3 Through 6 Year Old Children.” Research Quarterly for Exer-cise and Sport 53, 3: 214-221.
Morris, Pamela, Chrishana M. Lloyd, Megan Millenky, Nicole Leacock, C. Cybele Raver, and Michael Bangser. 2013. Using Classroom Management to Improve Preschoolers’ Social and Emotional Skills: Final Impact and Implementation Findings from the Foundations of Learning Demonstra-tion in Newark and Chicago. New York: MDRC.
Morris, Pamela, Shira K. Mattera, Nina Castells, Michael Bangser, Karen Bierman, and Cybele Raver. 2014. Impact Findings from the Head Start CARES Demonstration: National Evaluation of Three Approaches to Improving Preschoolers’ Social and Emotional Competence. OPRE Report 2014-44. Washington, DC: Office of Planning, Research and Evaluation, Administration for Children and Families, U.S. Department of Health and Human Services.
Morris, Pamela, C. Cybele Raver, Megan Millenky, Stephanie Jones, and Chrishana M. Lloyd. 2010. Making Preschool More Productive: How Classroom Management Training Can Help Teachers. New York: MDRC.
Murray, Desiree W., Natalie Murr, and David L. Rabiner. 2012. “Preliminary Effects of the Incredible Years Teacher Training Program on Classroom Management Skills.” Presented at SREE Spring 2012 Conference, Washington, DC, March 8-10.
National Center for Education Statistics. n.d. Academic Rating Scale. Washington, DC: National Center for Education Statistics. Website: http://nces.ed.gov/ECLS/kinderinstruments.asp.
Pianta, Robert C. 2001. Student-Teacher Relationship Scale — Short Form. Lutz, FL: Psychological Assessment Resources, Inc.
Pianta, Robert C., Karen M. La Paro, and Bridget K. Hamre. 2008. Classroom Assessment Scoring Sys-tem Manual: Pre-K. Baltimore, MD: Paul H. Brookes Publishing Co.
Raver, C. Cybele, Celene E. Domitrovich, Mark T. Greenberg, Pamela A. Morris, and Shira Kolnik Mattera. 2012. “Adapted Teaching Style Rating Scale.” Unpublished. New York: MDRC.
Raver, C. Cybele, Pamela W. Garner, and Radiah Smith-Donald. 2007. “The Roles of Emotion Regula-tion and Emotion Knowledge for Children’s Academic Readiness: Are The Links Causal?” Pages 121-147 in Robert C. Pianta, Marth J. Cox, and Kyle L. Snow (eds.), School Readiness and the Transition to Kindergarten in the Era of Accountability. Baltimore: Brookes Publishing.
Raver, C. Cybele, Stephanie N. Jones, Christine Li-Grining, Fuhua Zhai, Kristen Bub, and Emily Press-ler. 2011. “CSRP’s Impact on Low-Income Preschoolers’ Preacademic Skills: Self-Regulation as a Mediating Mechanism.” Child Development 82, 1: 362-378.
109
Raver, C. Cybele, Stephanie M. Jones, Christine P. Li-Grining, Molly Metzger, Kina Smallwood, and Latriese Sardin. 2008. “Improving Preschool Classroom Processes: Preliminary Findings from a Randomized Trial Implemented in Head Start Settings.” Early Childhood Research Quarterly 63, 3: 253-255.
Raver, C. Cybele, Stephanie M. Jones, Christine Li-Grining, Fuhua Zhai, Molly W. Metzger, and Bon-nie Solomon. 2009. “Targeting Children’s Behavior Problems in Preschool Classrooms: A Clus-ter-Randomized Controlled Trial.” Journal of Consulting and Clinical Psychology 77, 2: 302-316.
Reid, M. Jamila, Carolyn Webster-Stratton, and Mary Hammond. 2003. “Follow-Up of Children Who Received the Incredible Years Intervention for Oppositional-Defiant Disorder: Maintenance and Prediction of 2-Year Outcome.” Behavior Therapy 34: 471-491.
Tarullo, Louisa, Nikki Aikens, Emily Moiduddin, and Jerry West. 2010. A Second Year in Head Start: Characteristics and Outcomes of Children Who Entered the Program at Age Three. ACF/OPRE Report. Washington, DC: U.S. Department of Health and Human Services, Administration for Children and Families, Office of Planning, Research and Evaluation.
U.S. Department of Health and Human Services, Administration for Children and Families. 2012. Of-fice of Head Start Program Information Report, 2011-2012. Washington, DC: U.S. Department of Health and Human Services, Administration for Children and Families.
Webster-Stratton, Carolyn, M. Jamila Reid, and Mary Hammond. 2004. “Treating Children with Early-Onset Conduct Problems: Intervention Outcomes for Parent, Child, and Teacher Training.” Jour-nal of Clinical Child and Adolescent Psychology 33, 1: 105-124.
Webster-Stratton, Carolyn, M. Jamila Reid, and Mary Hammond. 2001. “Preventing Conduct Prob-lems, Promoting Social Competence: A Parent and Teacher Training Partnership in Head Start.” Journal of Clinical Child Psychology 30, 3: 238-302.
Webster-Stratton, Carolyn, M. Jamilia Reid, and Mike Stoolmiller. 2008. “Preventing Conduct Prob-lems and Improving School Readiness: Evaluation of the Incredible Years Teacher and Child Training Programs in High-Risk Schools.” Journal of Child Psychology and Psychiatry 49, 5: 471-488.
Wellman, Henry M., David Cross, and Julanne Watson. 2001. “Meta-Analysis of Theory-of-Mind De-velopment: The Truth about False Belief.” Child Development 72, 3: 655-684.
Williford, Amanda A., and Terri L. Shelton. 2008. “Using Mental Health Consultation to Decrease Dis-ruptive Behaviors in Preschoolers: Adapting an Empirically-Supported Intervention.” Journal of Child Psychology and Psychiatry 49, 2: 191-200.
Yates, Tweety, Michaelene M. Ostrosky, Gregory A. Cheatham, Angel Fettig, LaShorage Shaffer, and Rosa Milagros Santos. 2008. Research Synthesis on Screening and Assessing Social-Emotional Competence. Nashville, TN: Center on the Social Emotional Foundations for Early Learning. Website: http://csefel.vanderbilt.edu/documents/rs_screening_assessment.pdf.
Zill, Nicholas. 1990. Behavior Problems Index Based on Parent Report. Washington, DC: Child Trends.

THIS PAGE INTENTIONALLY LEFT BLANK
111
Earlier Publications on Head Start CARES
Impact Findings from the Head Start CARES Demonstration National Evaluation of Three Approaches to Improving Preschoolers’ Social and
Emotional Competence 2014. Pamela Morris, Shira K. Mattera, Nina Castells, Michael Bangser, Karen Bierman, Cybele Raver. Head Start CARES for Migrant and Seasonal Families Adapting a Preschool Social-Emotional Curriculum 2014. Mike Fishman, Jessica Wille. A First Look at the Head Start CARES Demonstration Large-Scale Implementation of Programs to Improve Children’s Social-Emotional Competence 2013. Shira Kolnik Mattera, Chrishana M. Lloyd, Mike Fishman, Michael Bangser. Coaching as a Key Component in Teachers’ Professional Development Improving Classroom Practices in Head Start Settings 2012. Chrishana M. Lloyd, Emily L. Modlin.
____________________________ NOTE: A complete publications list is available from MDRC and on its website (www.mdrc.org), from which copies of reports can also be downloaded.

THIS PAGE INTENTIONALLY LEFT BLANK