impacts of the 2014-2015 highly pathogenic avian influenza
TRANSCRIPT
i Impacts of the 2014-2015 Highly Pathogenic Avian Influenza Outbreak on the U.S. Poultry Sector, LDPM-282-02
USDA, Economic Research Service
United StatesDepartmentof Agriculture
www.ers.usda.gov
A Report from the Economic Research ServiceA Report from the Economic Research Service
LDPM-282-02December 2017
Approved by USDA’s World Agricultural
Outlook Board
www.ers.usda.gov
Impacts of the 2014-2015 Highly Pathogenic Avian Influenza Outbreak on the U.S. Poultry SectorSean Ramos, Matthew MacLachlan, and Alex Melton
Abstract
Between December 2014 and June 2015, more than 50 million chickens and turkeys in the United States died of highly pathogenic avian influenza (HPAI) or were destroyed to stop the spread of the disease. These birds accounted for about 12 percent of the U.S. table-egg laying population and 8 percent of the estimated inventory of turkeys grown for meat. In response to this historic animal-disease event, many destination markets for U.S. poultry commodities levied trade restric-tions on U.S. poultry exports, distorting markets and exacerbating economic losses. This report provides an overview of the 2014-2015 HPAI outbreak and its resulting impacts on U.S. poultry production, trade, and prices.
Keywords: avian influenza, infectious animal disease, market disruption, trade restrictions, poultry production, poultry exports, poultry prices.
Acknowledgments
The authors thank the following technical peer reviewers for their comments and insight: Tomislav Vukina, North Carolina State University; Ann Seitzinger, USDA, Agricultural Plant and Health Inspection Service; Claire Mezoughem and Tyler Cozzens, USDA, Foreign Agricultural Service; Mesbah Motamed, USDA, Economic Research Service (ERS); and Warren Preston, USDA, Office of the Chief Economist. The authors also appreciate the guidance and support provided by Jeff Gillespie, Keithly Jones, Tom Capehart, Linwood Hoffman, and Mark Jekanowski of USDA/ERS. This report was reviewed and cleared by Shayle Shagam of USDA’s World Agricultural Outlook Board. Thanks also to ERS editor Margaret Carter and ERS designer Lori A. Fields.
ii Impacts of the 2014-2015 Highly Pathogenic Avian Influenza Outbreak on the U.S. Poultry Sector, LDPM-282-02
USDA, Economic Research Service
In accordance with Federal civil rights law and U.S. Department of Agriculture (USDA) civil rights regulations and policies, the USDA, its Agencies, offices, and employees, and institutions participating in or administering USDA programs are prohibited from discriminating based on race, color, national origin, religion, sex, gender identity (including gender expression), sexual orientation, disability, age, marital status, family/parental status, income derived from a public assistance program, political beliefs, or reprisal or retaliation for prior civil rights activity, in any program or activity conducted or funded by USDA (not all bases apply to all programs). Remedies and complaint filing dead-lines vary by program or incident.
Persons with disabilities who require alternative means of communication for program information (e.g., Braille, large print, audiotape, American Sign Language, etc.) should contact the responsible Agency or USDA's TARGET Center at (202) 720-2600 (voice and TTY) or contact USDA through the Federal Relay Service at (800) 877-8339. Additionally, program information may be made available in languages other than English.
To file a program discrimination complaint, complete the USDA Program Discrimination Complaint Form, AD-3027, found online at How to File a Program Discrimination Complaint and at any USDA office or write a letter addressed to USDA and provide in the letter all of the information requested in the form. To request a copy of the complaint form, call (866) 632-9992. Submit your completed form or letter to USDA by: (1) mail: U.S. Department of Agriculture, Office of the Assistant Secretary for Civil Rights, 1400 Independence Avenue, SW, Washington, D.C. 20250-9410; (2) fax: (202) 690-7442; or (3) email: [email protected].
USDA is an equal opportunity provider, employer, and lender.
Contents
Introduction . . . . . . . . . . . . . . . . . . . . . . . . . . . . . . . . . . . . . . . . . . . . . . . . . . . . . . . . . . . . . . . . . . . .1
Disease Overview and Scope . . . . . . . . . . . . . . . . . . . . . . . . . . . . . . . . . . . . . . . . . . . . . . . . . . . . . .2
Poultry Commodity Market Impacts . . . . . . . . . . . . . . . . . . . . . . . . . . . . . . . . . . . . . . . . . . . . . . .5
Production declined sharply in the egg and turkey market . . . . . . . . . . . . . . . . . . . . . . . . . . . . . .5
Exports fell off for all poultry commodities . . . . . . . . . . . . . . . . . . . . . . . . . . . . . . . . . . . . . . . . .7
Egg and turkey prices increased, broiler prices decreased . . . . . . . . . . . . . . . . . . . . . . . . . . . . . 10
HPAI Impacts in 2016 . . . . . . . . . . . . . . . . . . . . . . . . . . . . . . . . . . . . . . . . . . . . . . . . . . . . . . . . . . . 14
Conclusion . . . . . . . . . . . . . . . . . . . . . . . . . . . . . . . . . . . . . . . . . . . . . . . . . . . . . . . . . . . . . . . . . . . .15
References . . . . . . . . . . . . . . . . . . . . . . . . . . . . . . . . . . . . . . . . . . . . . . . . . . . . . . . . . . . . . . . . . . . .16
On August 28, 2018, the report Impacts of the 2014-2015 Highly Pathogenic Avian Influenza Outbreak on the U.S. Poultry Sector was reposted to correct the title on figure 5, from “poultry production indices” to “poultry export indices .” No data were updated .

1 Impacts of the 2014-2015 Highly Pathogenic Avian Influenza Outbreak on the U.S. Poultry Sector, LDPM-282-02
USDA, Economic Research Service
Introduction
The 2014-2015 outbreak of highly pathogenic avian influenza (HPAI) was the largest poultry health disaster in U.S. history (Hagerman and Marsh, 2016; APHIS, 2015c). More than 50 million birds were lost to the disease itself or to depopulation, overshadowing bird losses during any previous U.S. outbreak.1 Losses of table-egg laying chickens, or “layers,” and turkeys grown for meat,2 the primary poultry varieties affected, were estimated at 12 and 8 percent of their respective invento-ries.3 Losses of broiler chickens, which provide virtually all U.S. chicken meat, were less than 0.01 percent of their estimated inventory (APHIS, 2016a; NASS, 2016b).4
The large volumes of poultry produced and exported by the United States intensified the economic importance of the market and trade policy responses to the HPAI outbreak. As of 2014, the United States was the world’s largest producer of chicken and turkey meat and the second largest producer of chicken eggs (FAO, 2017). U.S. farm-level sales of these commodities amounted to over $48 billion in 2014 (NASS, 2016a). A considerable share of U.S. poultry production has typically been exported; in 2010-14, 19 percent of U.S. broiler production was exported, as was 12 and 4 percent of turkey and egg production, respectively (ERS, 2016a; NASS, 2016b). The loss of birds to HPAI reduced U.S. egg and turkey supplies, and HPAI-related trade restrictions in many foreign markets reduced the overseas demand for U.S. egg, turkey, and broiler products.
Variation in the degree of HPAI-induced production and trade losses across the different poultry commodities ultimately led to different outcomes for each commodity market. The increased scar-city of egg and turkey products resulted in higher prices for consumers and discouraged exports. Trade restrictions on U.S. poultry exports effectively decreased the demand for all U.S. poultry commodities and resulted in lower prices for broiler meat.
This report complements previous research on the market impacts of the HPAI outbreak. These include studies that analyzed the outbreak’s effects on specific components of the poultry market (Johnson et al., 2016; Huang et al., 2016) and that estimated, with varying methods and results, the outbreak’s cost (DIS, 2015; Elam, 2015; and Johansson et al., 2016). Our report adds important details on the economic indicators that characterize the outbreak’s broad market impacts.
1An outbreak of HPAI resulted in the loss of 17 million birds between 1983 and 1984.
2Table-egg laying chickens are referred to as “layers” in this report. The three poultry types referred to in this paragraph produce nearly all the poultry products consumed in the United States; we use the term “poultry” to refer to the commodities produced by these three poultry types. The terms “egg” and “eggs” refer to table eggs only, except where noted.
3The percent losses were calculated as the number of each poultry type that was lost to HPAI divided by their respective inventory estimates as of April 1, 2015, prior to appreciable bird losses to the disease. Turkey inventory was approximated by assuming that 4 months represents the average period from hatching to slaughter. See figure 4 for details on the poultry variet-ies that were reported lost to HPAI.
4The percent loss for broilers was calculated as it was for layers and turkeys. The estimated broiler inventory assumed that 7 weeks represents the average period from hatching to slaughter.

2 Impacts of the 2014-2015 Highly Pathogenic Avian Influenza Outbreak on the U.S. Poultry Sector, LDPM-282-02
USDA, Economic Research Service
Disease Overview and Scope
The majority of HPAI infections observed in the 2014-15 outbreak emerged at the intersection of the Central and Mississippi flyways used by wild birds during seasonal migration (fig. 1). Migratory waterfowl are believed to have set the outbreak in motion by introducing two strains of the HPAI virus to domesticated birds.5 Of the several pathways that USDA’s Animal and Plant Health Inspection Service (APHIS) cited as capable of spreading HPAI, no single one alone explains the outbreak (APHIS, 2015a). Between-facilities transmission at the height of the outbreak was impor-tant and was attributed mostly to fomites, including shared equipment, clothing/boots of employees, and vehicles used during rendering or feed distribution.6 Dense production in Minnesota and Iowa was accompanied by a clustered array of HPAI cases.
After a slow onset of infection in the western United States, often among dispersed backyard flocks, the vast majority of cases were observed in the Mississippi Flyway among layers and turkeys (fig. 2). This pattern is attributed to a high prevalence of HPAI among waterfowl there and intensive poultry production. Approximately 87 percent of bird losses occurred in Iowa and Minnesota. The bulk of other cases occurred in the adjacent states of Nebraska, Wisconsin, and South Dakota.
Figure 1 U.S. flyways and highly pathogenic avian influenza-induced losses in domesticated flocks by county, 2014-15
k = thousand; M = million.Source: USDA, Animal and Plant Health Inspection Service (APHIS), 2016a; U.S. Department of Commerce, Census Bureau, 2015; and U.S. Department of the Interior, U.S. Fish and Wildlife Service (USFWS), 2015.
5For both strains, some of the genetic material was previously observed in low-pathogenic avian influenza endemic to North America, while other genetic material originated in a strain of avian influenza observed in Eurasia (Pasick et al., 2015; APHIS, 2015b; Jeong et al., 2014). Waterfowl from different North American and Asian flyways interact—and potentially spread HPAI across flyways—in their northern ranges.
6A fomite is an inanimate object or material substance that can transmit infection.

3 Impacts of the 2014-2015 Highly Pathogenic Avian Influenza Outbreak on the U.S. Poultry Sector, LDPM-282-02
USDA, Economic Research Service
More than 80 percent of bird losses, totaling 39 million, were recorded between April 17 and May 19, 2015 (fig. 3). Layers accounted for a large majority of the lost birds. Layer losses were compounded by extensive losses of layer pullets, birds that mature into replacement layers. Turkey losses were magnified by the relatively large size of birds and smaller inventory. Additionally, almost 600,000 breeding turkeys were lost.
Figure 2
Highly pathogenic avian influenza (HPAI) outbreak timeline, 2014-15
Case = an HPAI-infected premises as reported by APHIS (2016).Source: USDA, Animal and Plant Health Inspection Service (APHIS), 2016a, and USDA, Food Safety and Inspection Service (FSIS), 2015.
First report of HPAI in Washington State
Two backyard flocks infected in Oregon and Washington
First trade restrictions imposed
HPAI cases caused by a new strain in Pacific Northwest backyard flocks
Two cases of the old strain affect nearly 250,000 poultry birds
in California
December 2014
The new strain appears in Central
and Mississippi flyways
7 cases
200,000 birds lost, mostly commercial
turkeys in Minnesota
March2015
97 cases
24 million birds lost; 13 million are layer operations of
>1 million
85 cases and 19 million birds lost in Iowa and
Minnesota
May2015
January toFebruary 2015
95 cases
Nearly 22 million birds lost
79 cases in Minnesota
and Iowa
April 2015
The outbreak tapers
16 cases
3 million birds lost
June 2015
Figure 3
Cumulative bird losses to highly pathogenic avian influenza by production type, 2014-15
Notes: “Others” includes birds from breeding or backyard operations, as well as poultry whose variety was not identified. About 700,000 birds that were lost to HPAI—almost entirely layer pullets—were not counted in this figure because no date was associated with their loss. Two operations had HPAI confirmed but no reported bird count.Source: USDA, Animal and Plant Health Inspection Service (APHIS), 2016a.
7
36
1
0
5
10
15
20
25
30
35
40
Dec-14 Jan-15 Feb-15 Mar-15 Apr-15 May-15 Jun-15
Mill ion
Layers
Turkeys (meat)
Layer pullets
Others

4 Impacts of the 2014-2015 Highly Pathogenic Avian Influenza Outbreak on the U.S. Poultry Sector, LDPM-282-02
USDA, Economic Research Service
After rapidly expanding, the outbreak came to an abrupt end in June 2015. The rapid response of APHIS and producers, and the transitory nature of the wild hosts and flu season, contributed to the brevity of the outbreak. Federal expenditures totaled about $879 million—including covering costs for depopulation, cleaning and disinfection, and $200 million in indemnities for lost birds, as reported in Johansson et al. (2016).7 These outlays mitigated some of the market impacts covered in this report by supporting producers affected by HPAI as they rehabilitated and restocked their oper-ations. The outlays also buoyed trade by encouraging foreign buyers’ confidence in poultry products from regions where HPAI was absent.
7For an analysis of the costs and benefits of Federal spending to control the 2014-15 HPAI outbreak, see Johansson et al. (2016).

5 Impacts of the 2014-2015 Highly Pathogenic Avian Influenza Outbreak on the U.S. Poultry Sector, LDPM-282-02
USDA, Economic Research Service
Poultry Commodity Market Impacts
Market responses and changes in trade policies among foreign trade partners extended the economic impact of HPAI beyond the producers whose operations were directly affected by the disease. Lost birds contracted supply, while trade restrictions on U.S. poultry exports decreased the pool of avail-able consumers. These two market shifts increased and decreased prices, respectively, and ultimately affected the revenues of all producers.
This report focuses on changes in the performance of each poultry commodity market in aggre-gate. We use national-level data that represent average market effects across a variety of individual poultry producers.8 The related market components of production, trade, and prices are evaluated separately below to show how impacts compared across poultry commodities.
Production declined sharply in the egg and turkey market
HPAI resulted in lower production of commodities for which supplies had previously been growing. USDA’s November 2014 forecasts for 2015 anticipated a 3-percent annual increase in both broiler and turkey production, and a 2-percent increase in egg production (WAOB, 2014). These projections, however, preceded the outbreak, which lowered egg and turkey production substantially during and afterward (fig. 4). In contrast, HPAI did not affect broiler production, with production growth continuing through 2015 and aligning with prior forecasts.
Figure 4
Monthly poultry production indices for 2014-16, seasonally adjusted with monthly averages in the pre-highly pathogenic avian influenza (HPAI) period
Notes: Shaded area represents the period when HPAI was observed in wild or domesticated birds (excludes an isolated case in February because it arose spontaneously from an existing strain of low-pathogenic avian influenza and was confined to a single premises). Each index sets November 2014 equal to 100. To account for seasonality, monthly produc-tion for each commodity is adjusted with a seasonal index using 2010-14 monthly averages, omitting December 2014 due to overlap with the outbreak. The seasonal index represents each month’s average across the sample period relative to the sample period average for all months. Broiler and turkey production data are based on “ready-to-cook” meat produced during expected slaughter days each month. Table-egg production data are adjusted by the calendar days per month to account for leap years.Source: USDA, Economic Research Service calculations based on data from USDA, National Agricultural Statistics Service (NASS), 2016b, and USDA, Animal and Plant Health Inspection Service (APHIS), 2016a.
85
90
95
100
105
Jan-14 Jun-14 Nov-14 Apr-15 Sep-15 Feb-16 Jul-16 Dec-16
Outbreak period Broiler Turkey Egg
8Some research has incorporated or studied HPAI impacts on local economies (DIS, 2015; Johnson et al., 2016).
6 Impacts of the 2014-2015 Highly Pathogenic Avian Influenza Outbreak on the U.S. Poultry Sector, LDPM-282-02
USDA, Economic Research Service
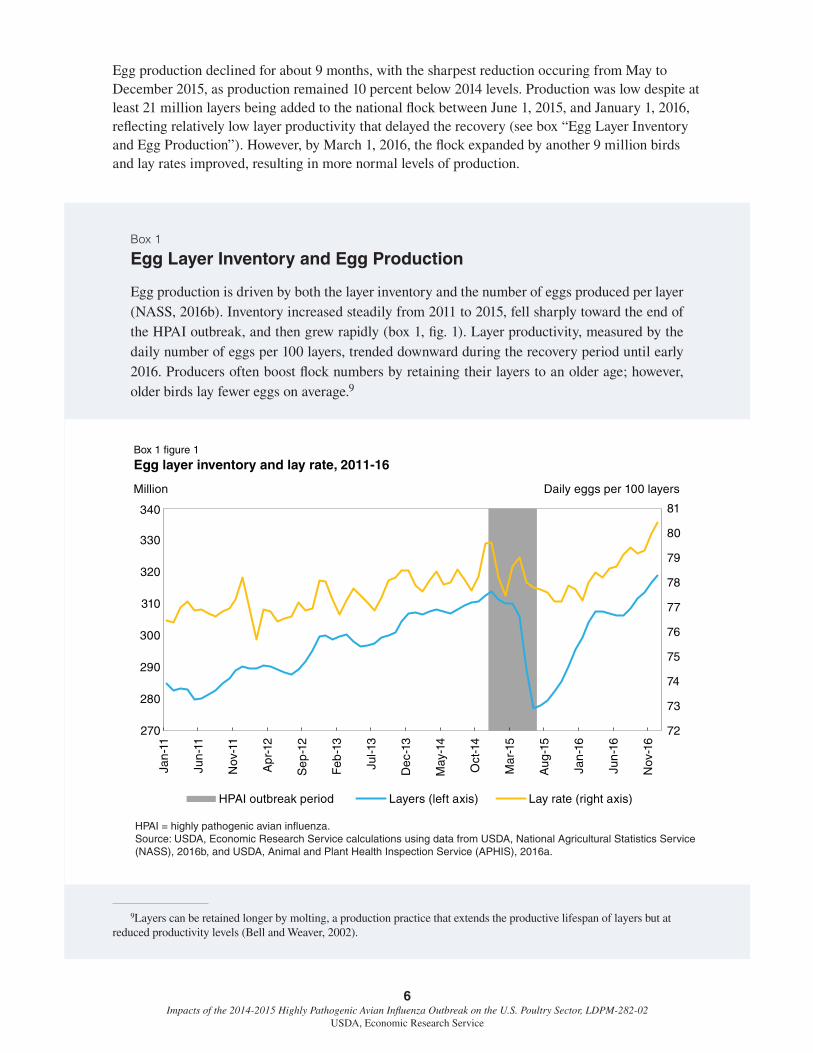
Egg production declined for about 9 months, with the sharpest reduction occuring from May to December 2015, as production remained 10 percent below 2014 levels. Production was low despite at least 21 million layers being added to the national flock between June 1, 2015, and January 1, 2016, reflecting relatively low layer productivity that delayed the recovery (see box “Egg Layer Inventory and Egg Production”). However, by March 1, 2016, the flock expanded by another 9 million birds and lay rates improved, resulting in more normal levels of production.
Box 1 Egg Layer Inventory and Egg Production
Egg production is driven by both the layer inventory and the number of eggs produced per layer (NASS, 2016b). Inventory increased steadily from 2011 to 2015, fell sharply toward the end of the HPAI outbreak, and then grew rapidly (box 1, fig. 1). Layer productivity, measured by the daily number of eggs per 100 layers, trended downward during the recovery period until early 2016. Producers often boost flock numbers by retaining their layers to an older age; however, older birds lay fewer eggs on average.9
Box 1 figure 1
Egg layer inventory and lay rate, 2011-16
HPAI = highly pathogenic avian influenza.Source: USDA, Economic Research Service calculations using data from USDA, National Agricultural Statistics Service (NASS), 2016b, and USDA, Animal and Plant Health Inspection Service (APHIS), 2016a.
72
73
74
75
76
77
78
79
80
81
270
280
290
300
310
320
330
340
Jan-
11
Jun-
11
Nov
-11
Apr
-12
Sep
-12
Feb
-13
Jul-1
3
Dec
-13
May
-14
Oct
-14
Mar
-15
Aug
-15
Jan-
16
Jun-
16
Nov
-16
Daily eggs per 100 layersMillion
HPAI outbreak period Layers (left axis) Lay rate (right axis)
9Layers can be retained longer by molting, a production practice that extends the productive lifespan of layers but at reduced productivity levels (Bell and Weaver, 2002).

7 Impacts of the 2014-2015 Highly Pathogenic Avian Influenza Outbreak on the U.S. Poultry Sector, LDPM-282-02
USDA, Economic Research Service
The impact of HPAI on turkey production was initially similar to its impact on egg production, but turkey production rebounded faster. While monthly production for June-July 2015 averaged 10 percent below a year earlier, monthly production in August-December 2015 averaged only 5 percent lower. Expectations for seasonally elevated Thanksgiving demand created incentives for producers to accelerate production by slaughtering turkeys at lower weights than in previous years. The average slaughter weight of turkeys in July-December 2015 declined 2 percent from 2014, whereas weights had increased 1 percent per year over the same months during 2010-14. Despite less meat per bird, the short-term effect of accelerated slaughter appears to have been more meat production, as indi-cated by the sharp postoutbreak rebound in production.
The recovery in egg and turkey production to more normal levels in early 2016 was faster than expected. January-March production exceeded USDA’s January-released forecasts for eggs and turkey meat by 4.2 and 5.5 percent, respectively (WAOB, 2016).10 An uncertain timeframe for production to recover to preoutbreak levels resulted from potential delays, such as producer decisions regarding the pace of repopulation and regulatory procedures for replacing flocks.
Biologically, it takes between 3 and 5 months to grow replacement layers and turkeys—from their hatching to their productive stages. The inventory of mature breeding animals also has to expand for it to be feasible to produce replacement birds at rates much higher than normal. Additionally, the need to comply with cleaning and testing protocols mandated by APHIS delayed the repopulation of infected facilities several months (APHIS, 2016b).
Some industry participants and observers expected an especially extended recovery period for egg production. One of the largest egg farmer cooperatives, for example, predicted that production could remain below pre-HPAI levels through February 2017 (UEP, 2015).11 Producers were expected to repopulate their facilities gradually rather than all at once, which would stagger the ages of layers and ensure more balanced production levels over time since hen productivity varies by age. However, despite these expectations, egg production reached pre-HPAI levels in March 2016, exceeding March 2014 production.
Exports fell off for all poultry commodities
HPAI resulted in substantially lower exports of U.S. poultry products as the supply of egg and turkey products declined and over 50 countries restricted the import of U.S. poultry products to varying degrees. Lower supplies of turkey and egg products led to higher prices, which further reduced export volume. Market forces beyond the poultry sector, including the relative strength of the U.S. dollar, compounded the effects of the outbreak on the export market.
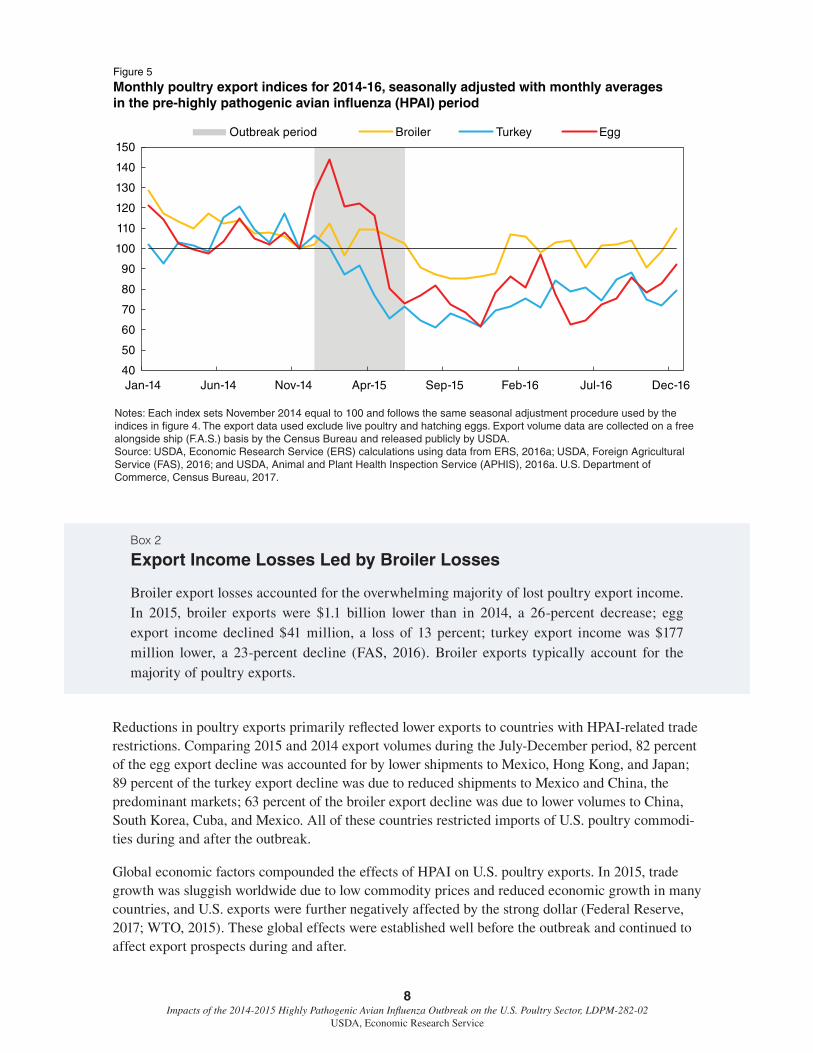
Trade restrictions and reduced supplies caused sharp reductions in egg and turkey export volumes: July-December 2015 shipments of egg and turkey products were 45 and 41 percent lower, respec-tively, than the same months the previous year (fig. 5). The decline in broiler exports was relatively less severe, in part because production did not decline. During July-December 2015, broiler exports were 18 percent lower than the same period in 2014. Notably, the loss in income from broiler exports far surpassed income losses from the reduced egg and turkey exports (see box “Export Income Losses Led by Broiler Losses”).
10USDA projections for egg production include hatching-egg production. Table eggs accounted for more than 86 percent of the January-March 2016 total.
11This timeframe for recovery cohered with expectations released in other reports in the same period (Elam, 2015; Greene, 2015; DIS, 2015).
8 Impacts of the 2014-2015 Highly Pathogenic Avian Influenza Outbreak on the U.S. Poultry Sector, LDPM-282-02
USDA, Economic Research Service
Figure 5
Monthly poultry export indices for 2014-16, seasonally adjusted with monthly averages in the pre-highly pathogenic avian influenza (HPAI) period
Notes: Each index sets November 2014 equal to 100 and follows the same seasonal adjustment procedure used by the indices in figure 4. The export data used exclude live poultry and hatching eggs. Export volume data are collected on a free alongside ship (F.A.S.) basis by the Census Bureau and released publicly by USDA.Source: USDA, Economic Research Service (ERS) calculations using data from ERS, 2016a; USDA, Foreign Agricultural Service (FAS), 2016; and USDA, Animal and Plant Health Inspection Service (APHIS), 2016a. U.S. Department of Commerce, Census Bureau, 2017.
Outbreak period Broiler Turkey Egg
40
50
60
70
80
90
100
110
120
130
140
150
Jan-14 Jun-14 Nov-14 Apr-15 Sep-15 Feb-16 Jul-16 Dec-16
Box 2
Export Income Losses Led by Broiler Losses
Broiler export losses accounted for the overwhelming majority of lost poultry export income. In 2015, broiler exports were $1.1 billion lower than in 2014, a 26-percent decrease; egg export income declined $41 million, a loss of 13 percent; turkey export income was $177 million lower, a 23-percent decline (FAS, 2016). Broiler exports typically account for the majority of poultry exports.
Reductions in poultry exports primarily reflected lower exports to countries with HPAI-related trade restrictions. Comparing 2015 and 2014 export volumes during the July-December period, 82 percent of the egg export decline was accounted for by lower shipments to Mexico, Hong Kong, and Japan; 89 percent of the turkey export decline was due to reduced shipments to Mexico and China, the predominant markets; 63 percent of the broiler export decline was due to lower volumes to China, South Korea, Cuba, and Mexico. All of these countries restricted imports of U.S. poultry commodi-ties during and after the outbreak.
Global economic factors compounded the effects of HPAI on U.S. poultry exports. In 2015, trade growth was sluggish worldwide due to low commodity prices and reduced economic growth in many countries, and U.S. exports were further negatively affected by the strong dollar (Federal Reserve, 2017; WTO, 2015). These global effects were established well before the outbreak and continued to affect export prospects during and after.

9 Impacts of the 2014-2015 Highly Pathogenic Avian Influenza Outbreak on the U.S. Poultry Sector, LDPM-282-02
USDA, Economic Research Service
Trade restrictions reduced export demand
Some countries closed their markets to all U.S. poultry exports during and after the outbreak. However, countries that restricted trade often limited their restrictions to certain U.S. regions. This regionalization allowed other areas to continue exporting and prevented a larger market disruption.12 Regionalized trade restrictions were specific to either the States, counties, or control areas where HPAI had been documented (APHIS, 2015c).13 Several of the United States’ most important poultry markets imposed regional restrictions, while China, for example, implemented a total ban (table 1).
Table 1 Examples of trade restrictions on U.S. poultry exports that resulted from the 2014-15 highly pathogenic avian influenza outbreak, and market shares by commodity
Country Extent of restrictions Share of U.S. exports, 2014
Mexico State Broiler (21%), Turkey (64%), Egg (23%)
Canada State, county, control area Broiler (5%), Turkey (3%), Egg (30%)
China National Broiler (4%), Turkey (7%), Egg (0.2%)
Hong Kong County Broiler (3%), Turkey (2%), Egg (14%)
Japan State Broiler (1%), Turkey (2%), Egg (12%)
Source: USDA Economic Research Service (ERS), 2016a; USDA, Food Safety and Inspection Service (FSIS), 2015; and USDA, Foreign Agricultural Service (FAS), 2016.
Notably, Canada replaced State-level restrictions with county-level restrictions and then control-area-level restrictions over the course of 2015. (A few countries not listed in table 1 also reduced the regional extent of their trade restrictions over time.) APHIS encouraged these regional limits on trade restrictions by sharing information on HPAI detections and disease-control measures (APHIS, 2015d). This approach benefitted from international standards for regionalization of trade restric-tions (see box “International Guidelines Recommend Regionalization”).
Box 3
International Guidelines Recommend Regionalization
The World Organisation for Animal Health (OIE) provides its 180-member nations with general guidelines for trade policy responses to HPAI (OIE, 2016). In cases of HPAI detection in domesticated birds, OIE supports regionally focused trade restrictions that depend on the disease-control efforts and reporting of the affected country. However, importing countries ulti-mately decide whether these measures are sufficient. Member and nonmember nations are free to ignore the OIE’s recommendations and impose restrictions on imports from entire nations or regions for as long as they want.
12Many of the trade restrictions continued to allow heat-treated products under various specifications (FSIS, 2015).
13Control areas (sometimes called control zones) are defined by USDA to have the following: a perimeter at least 10 km beyond the closest infected premises, movement controls, and surveillance activities (APHIS, 2017).

10 Impacts of the 2014-2015 Highly Pathogenic Avian Influenza Outbreak on the U.S. Poultry Sector, LDPM-282-02
USDA, Economic Research Service
Egg and turkey prices increased, broiler prices decreased
HPAI caused both supply and demand changes for poultry commodities by altering produc-tion levels and the pool of foreign buyers. The substantial price changes that followed varied by commodity in part because the outbreak resulted in different relative changes in production (supply) and exports (demand).
After the outbreak, egg prices rose sharply, while turkey prices increased modestly, and broiler prices fell (fig. 6). While eggs and turkey experienced both production losses (reduced supply) and trade restrictions (reduced demand), the net effect was for the prices of both commodities to increase. Since broiler production was not reduced by the HPAI outbreak, the temporary loss of important export markets resulted in a large increase in the supply of broiler meat on the domestic market, pushing prices lower.
After the outbreak, record-high egg prices were the most notable market change, with price increases far surpassing production losses on a relative basis.14 Over the May-December 2015 period, the benchmark egg price was 61 percent above a year earlier, while production declined only about 10 percent. The significantly greater egg price changes reflect inelastic demand (see box “Surging Egg Prices and Inelastic Demand”).
Figure 6
Monthly poultry price indices for 2014-16, seasonally adjusted with monthly averagesin the pre-highly pathogenic avian influenza (HPAI) period
Notes: : Each index sets November 2014 equal to 100 and follows the same seasonal adjustment procedure used by the indices in figures 4 and 5. USDA benchmark prices for poultry commodities are wholesale prices for large grade A eggs, frozen turkey hens, and whole broiler chickens (WAOB, 2016). The turkey and broiler prices are considered national prices; the egg prices are taken from the New York market.Source: USDA, Economic Research Service calculations using data from USDA, Agricultural Marketing Service (AMS), 2016a, and USDA, Animal and Plant Health Inspection Service (APHIS), 2016a.
Outbreak period Broiler Turkey Egg
40
60
80
100
120
140
160
180
Jan-14 Jun-14 Nov-14 Apr-15 Sep-15 Feb-16 Jul-16 Dec-16
14The record egg price compares nominal prices since 1960 for the benchmark item in New York (ESMIS, 2017).

11 Impacts of the 2014-2015 Highly Pathogenic Avian Influenza Outbreak on the U.S. Poultry Sector, LDPM-282-02
USDA, Economic Research Service
Egg price increases abated before production recovered substantially; the October 2015 price was 30 percent above a year earlier, a much smaller increase than previous months. During this period, egg market supplies were bolstered by a very large increase in imports, including shell eggs graded for processing, and liquid and dried egg products. Before 2015, these imports were marginal, attributable in part to inspection standards and relatively high import prices. After the outbreak, however, monthly imports of these items peaked above 15 percent of the processed eggs available domestically (fig. 7).15 (See box 4 for more detail about the processing eggs market and its relationship to the wider egg market.)
Box 4
Surging Egg Prices and Inelastic Demand
The “price elasticity of demand” is a measure of how much consumers change their consump-tion levels in response to price increases or decreases. Previous research suggests that eggs are among the most price inelastic of food commodities, which helps explain why egg prices surged after the HPAI outbreak (Andreyeva et al., 2010). The May-August 2015 price increases for consumer-grade eggs were surpassed by price increases for processing-grade eggs, which are often used by restaurants, bakers, and other commercial operations (box 4, fig. 1). Demand from these commercial buyers is particularly inelastic in the short run because the substitution of other products for eggs affects product formulas and packaging as well as contracts and customer relationships. Prices for processing-grade eggs may drive price increases in consumer-grade eggs during an egg shortage because commercial buyers of processing-grade eggs can substitute with eggs that are graded for consumers.
Box 4 figure 1
Daily prices for processing- and consumer-grade eggs, and their spread, 2014-15
Notes: Processing-grade eggs are represented in the figure by Central States “breaking stock” reported by USDA, Agricultural Marketing Service (AMS), 2016a. Consumer-grade eggs are represented by the USDA benchmark product, large grade A eggs in the New York market.Source: USDA, Economic Research Service calculations using data from USDA, Agricultural Marketing Service (AMS), 2016a, and USDA, Animal and Plant Health Inspection Service (APHIS), 2016a.
0.00
0.50
1.00
1.50
2.00
2.50
3.00
Jan-14 Apr-14 Aug-14 Dec-14 Apr-15 Aug-15 Dec-15
Dollars per dozen
Outbreak period
Processing-grade eggs
Consumer-grade eggs (NY)
Spread (consumer grade minus processing grade)
15Imports of shell eggs were mostly from Europe, while egg products specifically were mostly of Dutch origin.

12 Impacts of the 2014-2015 Highly Pathogenic Avian Influenza Outbreak on the U.S. Poultry Sector, LDPM-282-02
USDA, Economic Research Service
Source: USDA, Economic Research Service (ERS) calculations using data from ERS, 2016a; USDA, Foreign Agricultural Service (FAS), 2016; and USDA, National Agricultural Statistics Service (NASS), 2016c.
0
2
4
6
8
10
12
14
16
0
5
10
15
20
25
30
35
Jan-14 Jun-14 Nov-14 Apr-15 Sep-15 Feb-16 Jul-16 Dec-16
Million dozen (shell equivalent) Percent
Processed eggs (left axis)
Processing-grade shell
eggs (left axis)
Other shell eggs (left
axis)
Import share, processed
market (right axis)
Figure 7
U.S. egg imports by product group and the import share of available processed eggs, 2014-16
Frozen turkey hen prices increased much more gradually than egg prices, in part because whole turkey consumption typically occurs during the holiday season, which was well after the conclusion of the outbreak. Prices peaked in October 2015 at 17 percent above the prior year, before a modest production recovery during October-December dampened further increases. By contrast, since demand for turkey breast meat is far less seasonal than for whole birds, the price impact on it was more immediate, with prices for boneless/skinless turkey breasts increasing by 75 percent between May and July 2015 (AMS, 2016a).
After the outbreak, whole broiler prices continued to decline. By October 2015, prices reached a 4-year low that was 30 percent below a year earlier. This significant market response reflected export losses, since nearly a fifth of broiler production was typically exported before the outbreak. The decline in the price of leg quarters, which typically account for the majority of broiler exports, was exceptional. In July-December 2015, leg-quarter prices on the Northeast and Southern markets were 48 and 65 percent below a year earlier, respectively. Low prices for broiler products may have also reflected a considerable decline in many agricultural prices, a trend that preceded the outbreak and continued throughout the period (Purdue, 2015).
After the HPAI outbreak, the price changes in the poultry sector appeared to drive significant revenue changes in 2015 (see box “Post-HPAI Price Impacts on Poultry-sector Revenue”).

13 Impacts of the 2014-2015 Highly Pathogenic Avian Influenza Outbreak on the U.S. Poultry Sector, LDPM-282-02
USDA, Economic Research Service
Box 5
Post-HPAI Price Impacts on Poultry-sector Revenue
USDA uses survey data to estimate annual poultry-sector revenue. The estimates measure the sales value of poultry production but not costs or net profits. Changes in estimated revenue in 2015 relative to the prior year indicate that, on average, producers were more affected by price changes than production-level changes. Estimated 2015 revenues for the egg and turkey indus-tries were 32 and 8 percent higher than in 2014, respectively, while 2015 broiler industry reve-nues were 12 percent lower than in 2014 (NASS, 2016a). HPAI affected each poultry commodity differently, but the revenue changes for each industry as a whole followed the direction of price changes. This common effect is attributable to inelastic demand—buyers resisted adjusting the quantity of their purchases on the basis of price changes.

14 Impacts of the 2014-2015 Highly Pathogenic Avian Influenza Outbreak on the U.S. Poultry Sector, LDPM-282-02
USDA, Economic Research Service
HPAI Impacts in 2016
In 2016, egg and turkey production returned to more typical levels (fig. 4). Yet, poultry exports and prices did not return to preoutbreak levels (figs. 5 and 6). Persistent and evolving responses to HPAI, including market- and policy-driven ones, contributed to the prolonged market disturbance. However, the continued outbreak impact was obscured by market shifts that were unrelated to HPAI.
U.S. poultry exports in 2016 remained mostly below preoutbreak levels. Many trade restrictions were lifted before 2016, but a few important markets remained restricted or closed, including China, Mexico, and South Korea. An isolated HPAI case in February 2016 led to some regionalized restric-tions on exports originating in Indiana and may have helped prolong restrictions that remained in place from the earlier outbreak. Exports were also challenged by continued dollar appreciation and generally weak global economic and trade growth (Federal Reserve, 2017; IMF, 2016). As a result, low exports contributed downward pressure on prices for many poultry products into 2016.
Egg price volatility in 2016 was exceptional. Prices fell sharply less than a year after reaching record-high levels in 2015. Compared to before the outbreak, 2016 egg exports were down, and egg production was up due to the recovery, leading to higher domestic egg supplies.16 Additionally, a leading egg producer reported that the high 2015 prices encouraged domestic commercial buyers to reformulate products with less egg content, possibly resulting in a sustained reduction in demand (Business Wire, 2016).17
Broiler exports in 2016 remained 7 percent below their 2010-14 average. With production at record levels, domestic supplies remained above preoutbreak levels, including large amounts in cold storage. Broiler stocks, reported by USDA, averaged 20 percent higher in 2016 than during 2010-14 (NASS, 2016b). These high supplies contributed to the prolonged slump in broiler prices below preoutbreak levels.
Frozen turkey hen prices, on the other hand, remained above preoutbreak levels for most of 2016. In general, turkey supplies were above the preoutbreak level due to the recovery in production and weak exports. However, stocks of whole turkeys in public cold storage through October were low, with month-ending stocks averaging 10 percent below 2010-14 (NASS, 2016b). These low stock levels helped support the high price of frozen hens into the second half of 2016, when it reached more normal levels.
These disruptions to the U.S. poultry market reflected both prolonged HPAI impacts and global trends. U.S. poultry exports remained relatively low, largely as a result of remaining trade restric-tions, a strong dollar, and weak trade growth globally. U.S. poultry prices that were lower than before the outbreak indicated the effect of lower exports on domestic supplies, as well as lower agricultural prices more generally across many markets (FAO, 2016).
16These higher supplies were evidenced by USDA calculations of domestic disappearance, which is a proxy for eggs available for domestic marketing (ERS, 2016b).
17The expanded role of cage-free products may have also altered the supply and demand for eggs and resulted in additional price volatility. While data on cage-free layers in 2016 was limited, between September 2015 and September 2016 over half of the estimated net increase in the national flock was due to more cage-free layers (AMS, 2016b; NASS, 2016b).

15 Impacts of the 2014-2015 Highly Pathogenic Avian Influenza Outbreak on the U.S. Poultry Sector, LDPM-282-02
USDA, Economic Research Service
Conclusion
The 2014-2015 HPAI outbreak had a substantial impact on the U.S. poultry sector. Trade restric-tions during and after the outbreak affected all poultry commodities, but the overall market impact differed for each commodity, reflecting several factors. Egg and turkey production decreased as a result of the large number of birds lost or destroyed during the outbreak, so despite export losses from restricted trade, egg and turkey prices rose. Though these higher prices increased revenue for producers that did not directly experience the outbreak, producers that lost birds to HPAI and consumers who paid higher prices for the products were negatively impacted.
In the broiler industry, very few birds were lost or destroyed due to HPAI, but the economic losses resulting from trade restrictions in foreign markets were serious. These restrictions decreased over-seas demand for broiler products and led to lower prices for broiler producers—highlighting the importance of policy responses to the total cost of the outbreak.
Observations from the 2014-2015 HPAI outbreak include:
1. The U.S. poultry sector may be able to recover quickly from production losses from disease events, but other market impacts—such as trade losses and price instability—can persist. Poultry production returned to more typical levels in early 2016 as the egg and turkey industries recovered; however, prices for many poultry products remained at multiyear lows in 2016, partly due to lingering export weakness related to the outbreak and other factors.
2. Disease events can result in disparate impacts across the poultry sector. HPAI had very negative impacts on many producers, as bird losses per operation averaged 50,000 for turkeys and over 1 million for layers where the disease was confirmed. Many other egg and turkey producers lost no production—they received higher prices in the short run without bearing the high costs incurred by those directly affected by the outbreak.
3. Disease events can impact related industries even if the disease has no direct effect. The broiler industry lost less than 0.01 percent of its U.S. inventory to HPAI, yet the threat of potential infection was the basis of trade restrictions that contributed to much lower 2015 and 2016 broiler prices compared to preoutbreak levels.
In 2015, USDA mobilized a great deal of funding and many personnel to reduce the intensity of the HPAI outbreak, compensated directly affected producers, and informed trading partners of outbreak findings to prevent or reduce trade restrictions. Ongoing efforts by the Department have sought to continuously improve its policy and planning for future potential outbreaks. The few HPAI events that occurred in the United States in 2016 and 2017 were quickly extinguished with relatively few birds lost.

16 Impacts of the 2014-2015 Highly Pathogenic Avian Influenza Outbreak on the U.S. Poultry Sector, LDPM-282-02
USDA, Economic Research Service
References
Andreyeva, T., M.W. Long, and K.D. Brownell. 2010. “The Impact of Food Prices on Consumption: A Systematic Review of Research on the Price Elasticity of Demand for Food,” American Journal of Public Health 100(2):216-22.
Bell, D., and W. Weaver (eds.). 2002. Commercial Chicken Meat and Egg Production, Fifth Edition. New York, NY: Springer.
Business Wire. 2016. “Cal-Maine Foods Reports Second Quarter Fiscal 2017 Results,” December 22.
Decision Innovation Solutions (DIS). 2015. “Economic Impact of Highly Pathogenic Avian Influenza (HPAI) on Layers in the U.S.,” Decision Innovation Solutions, Urbandale, IA, July.
Elam, T.E. 2015. “Economic Losses from the 2015 Highly Pathogenic Avian Flu Outbreak,” FarmEcon LLC, Carmel, IN.
Federal Reserve System. 2017. “Trade Weighted U.S. Dollar Index: Broad,” Federal Reserve Economic Data, Federal Reserve Bank of St. Louis.
Greene, J.L. 2015. Update on the Highly-Pathogenic Avian Influenza Outbreak of 2014-2015, R-5700, Congressional Research Service, July 20.
Hagerman, A.D., and T.L. Marsh. 2016. “Theme Overview: Economic Consequences of Highly Pathogenic Avian Influenza,” Choices 31(2).
Huang, W., A.D. Hagerman, and D.A. Bessier. 2016. “The Impact of Highly Pathogenic Avian Influenza on Table Egg Prices,” Choices 31(2).
International Monetary Fund (IMF). 2016. “Subdued Demand: Symptoms and Remedies,” World Economic Outlook, International Monetary Fund, Washington, DC, October.
Jeong, J., M.-I. Kang, E.-K. Lee, B.-M. Song, Y.-K. Kwon, H.-R. Kim, K.-S. Choi, J.-Y. Kim, H.-J. Lee, O.-K. Moon, W. Jeong, J. Choi, J.-H. Baek, Y. Joo, Y. Ho Park, H.-S. Lee, and Y.-J. Lee. 2014. “Highly pathogenic avian influenza virus (H5N8) in domestic poultry and its relationship with migratory birds in South Korea during 2014,” Veterinary Microbiology 173(3-4):249-57.
Johansson, R.C., W.P. Preston, and A. Hillberg Seitzinger. 2016. “Government Spending to Control Highly Pathogenic Avian Influenza,” Choices 31(2).
Johnson, K.K., R.M. Seeger, and T.L. Marsh. 2016. “Local Economies and Highly Pathogenic Influenza,” Choices 31(2).
Pasick, J., Y. Berhane, T. Joseph, V. Bowes, T. Hisanaga, K. Handel, and S. Alexandersen. 2015. “Reassortant Highly Pathogenic Influenza A H5N2 Virus Containing Gene Segments Related to Eurasian H5N8 in British Columbia, Canada, 2014,” Scientific Reports 5(9484).
Purdue University. 2015. “Purdue Agricultural Economics Report: Outlook for the Agricultural Economy in 2016,” December.

17 Impacts of the 2014-2015 Highly Pathogenic Avian Influenza Outbreak on the U.S. Poultry Sector, LDPM-282-02
USDA, Economic Research Service
United Egg Producers (UEP). 2015. “Egg Farms Make Progress Toward Recovery And Repopulation After Avian Influenza,” August 26.
United Nations. 2016. “Food Outlook: October 2016,” Food and Agriculture Organization (FAO), Rome, Italy.
United Nations. 2017. “FAOSTAT,” Food and Agriculture Organization (FAO), Rome, Italy.
U.S. Department of Agriculture, Agricultural Marketing Service (AMS). 2016a. “Custom Report Portal for Poultry.”
U.S. Department of Agriculture, Agricultural Marketing Service (AMS). 2016b. “Monthly Cage-Free Shell Egg Report.”
U.S. Department of Agriculture, Animal and Plant Health Inspection Service (APHIS). 2015a. Epidemiologic and Other Analyses of HPAI-Affected Poultry Flocks: September 9, 2015 Report.
U.S. Department of Agriculture, Animal and Plant Health Inspection Service (APHIS). 2015b. Prevent Avian Influenza at Your Farm; Improve Your Biosecurity with Simple Wildlife Management Practices, July.
U.S. Department of Agriculture, Animal and Plant Health Inspection Service (APHIS). 2015c. Statement before the Subcommittee on Livestock and Foreign Agriculture, House Agriculture Committee, by Dr. John Clifford, Deputy Administrator, Veterinary Services, APHIS, July 30.
U.S. Department of Agriculture, Animal and Plant Health Inspection Service (APHIS). 2015d. Remarks as Prepared for Associate Administrator Jere Dick, International Conference on Avian Influenza and Poultry Trade, June 22.
U.S. Department of Agriculture, Animal and Plant Health Inspection Service (APHIS). 2016a. “HPAI 2014/15 Confirmed Detections.”
U.S. Department of Agriculture, Animal and Plant Health Inspection Service (APHIS). 2016b. Final Report for the 2014-2015 Outbreak of Highly Pathogenic Avian Influenza (HPAI) in the United States, Veterinary Services; Surveillance, Preparedness, and Response Service, August 11.
U.S. Department of Agriculture, Animal and Plant Health Inspection Service (APHIS). 2017. Highly Pathogenic Avian Influenza (HPAI) Response: Ready Reference Guide—Overview of Zones, May.
U.S. Department of Agriculture, Economic Research Service (ERS). 2016a. “Livestock and Meat International Trade Data.”
U.S. Department of Agriculture, Economic Research Service (ERS). 2016b. “Livestock and Meat Domestic Data,” “Quarterly red meat, poultry, and egg supply and disappearance and per capita disappearance.”
U.S. Department of Agriculture, Economics, Statistics and Market Information System (ESMIS). 2017. “Poultry Yearbook,” Albert R. Mann Library, Cornell University.

18 Impacts of the 2014-2015 Highly Pathogenic Avian Influenza Outbreak on the U.S. Poultry Sector, LDPM-282-02
USDA, Economic Research Service
U.S. Department of Agriculture, Food Safety and Inspection Service (FSIS). 2015. “Export Library – Requirements by Country.”
U.S. Department of Agriculture, Foreign Agricultural Service (FAS). 2016. “Global Agricultural Trading System (GATS).”
U.S. Department of Agriculture, National Agricultural Statistics Service (NASS). 2016a. Poultry Production and Value: 2015 Summary, April.
U.S. Department of Agriculture, National Agricultural Statistics Service (NASS). 2016b. “Quick Stats.”
U.S. Department of Agriculture, National Agricultural Statistics Service (NASS). 2017. Egg Products, February.
U.S. Department of Agriculture, World Agricultural Outlook Board (WAOB). 2014. World Agricultural Supply and Demand Estimates, November.
U.S. Department of Agriculture, World Agricultural Outlook Board (WAOB). 2016. World Agricultural Supply and Demand Estimates, January.
U.S. Department of Commerce, Census Bureau. 2015. “Cartographic Boundary Shapefiles – States.”
U.S. Department of Commerce, Census Bureau. 2017. “Guide to Foreign Trade Statistics.”
U.S. Department of the Interior, U.S. Fish and Wildlife Service (USFWS). 2015. “Administrative Waterfowl Flyway Boundaries.”
World Organisation for Animal Health (OIE). 2016. “Avian Influenza Portal,” World Organisation for Animal Health, Paris, France.
World Trade Organization (WTO). 2015. World Trade Report 2015, World Trade Organization, Geneva, Switzerland.

19 Impacts of the 2014-2015 Highly Pathogenic Avian Influenza Outbreak on the U.S. Poultry Sector, LDPM-282-02
USDA, Economic Research Service

20 Impacts of the 2014-2015 Highly Pathogenic Avian Influenza Outbreak on the U.S. Poultry Sector, LDPM-282-02
USDA, Economic Research Service