impacts of the oregon inlet terminal groincore.ecu.edu/geology/riggs/impacts oregon inlet terminal...
TRANSCRIPT

1
IMPACT OF THE OREGON INLET TERMINAL GROIN ON DOWNSTREAM BEACHES OF PEA ISLAND, NC OUTER BANKS
Stanley R. Riggs and Dorothea V. Ames
11-15-09
INTRODUCTION
The basic function of the terminal groin and rock revetment at Oregon Inlet (Fig. 1) was to 1) stop the southward migration of Oregon Inlet and 2) keep the north end of Pea Island from abandoning the Oregon Inlet bridge within the inlet (NCDOT, 1989). Both structures were built in the period from October 1989 to March 1991 and have been successful in carrying out their original design function.
FIGURE 1. Photographs show the two rock structures built along the south side of Oregon Inlet in 1989-1991 to stop the southward migration of the inlet and keep the bridge attached to Pea Island.
Whether the terminal groin at Oregon Inlet has had a negative impact on the downstream shoreline of Pea Island beaches is a totally different question. In order to answer this question, NCDOT contracted Overton and Fisher in October 1989 (report 1 in 1990 to report 27 in March 2005) and Overton (reports 28 to 31 in June 2007) to carry out a monitor study of the adjacent six miles of Pea Island beaches, the northern half of Pea Island. Fisher, Overton, and Jarrett (2004) summarized the monitor data from 1989-2003 and utilized it as a basis for developing cost estimates for building and maintaining the new Highway 12 across Pea Island over the next 100 years for NCDOT.

2
The NCDOT (1989) stated that the “severe ocean shoreline erosion that is taking place along the two mile stretch of shoreline south of the Oregon Inlet Coast Guard Station, a result of the inlet’s inefficient sand bypassing, will continue. The problems associated with the severe ocean shoreline erosion…..can only be addressed by a separate corrective measure. The most desirable solution for this problem would be to undertake a program of periodic beach nourishment to offset the sediment deficit imposed by Oregon Inlet.” Thus, to minimize negative impacts of the Oregon Inlet terminal groin on the downstream Pea Island shoreline, the USACE agreed to place the sediment from routine Oregon Inlet channel dredging either directly on the Pea Island beach or in the shallow near-shore of the northernmost 3 miles of Pea Island.
According to the NCDOT (1989) report, the purpose of the monitor program is “to document the changes in the shoreline on the northern end of Pea Island, within six miles of the terminal groin….a known area of high shoreline erosion. It is anticipated that the groin will reduce this erosion and serve to stabilize the down-drift shoreline.” However, NCDOT “agreed to provide (additional) beach nourishment if it can be shown that there is a significant increase in erosion rates with the construction of the groin…(based upon) the determination of the historical rates of erosion.” “If the monitoring program determines that there is an increase in shoreline erosion above the background historical rates, then two thresholds for corrective beach nourishment have been established.”
THE PEA ISLAND MONITOR STUDY
Neither the methodology nor the shoreline erosion data in the monitor study reports of Overton and Fisher (2005), Overton (2007), and Fisher, Overton, and Jarrett (2004) are being called into question in this paper. However, there are problems with some assumptions made in the reports and the fact that critical coastal processes, including considerable human coastal modifications, are generally ignored. Since the latter factors greatly impact shoreline-change rates, they also will influence the interpretation of the monitor data. An additional problem is the paucity of basic data within their reports that does not allow for a comprehensive re-evaluation or peer-review of their conclusions.
If an inlet is highly managed (e.g., channels dredged for navigation and sediment discharged offshore, channels relocated, inlet deltas mined for beach nourishment sand, and/or inlet flanks fixed in place with hardened structures such as terminal groins, jetties, etc.) the critical inlet-beach sediment couplet becomes destabilized with substantial consequences.
A) Oregon Inlet was slowly migrating southward at an average of ~77 ft/yr from 1849 to 1980 (NCDOT, 1989; Riggs et al., 2009). Major inlet management was undertaken to maintain a navigational channel under the fixed navigation span on the Oregon Inlet bridge from 1980 to 1989. With this change the annual rate of inlet migration increased dramatically to ~265 ft/yr. Then in 1988-1989, the southward migration increased to ~1,100 ft/yr in a combined response to the extensive dredging and severe storms. The latter events led NCDOT to obtain a variance from the NCCRC to build the Oregon Inlet terminal groin and the rock

3
revetment around the south base of the bridge to stop inlet migration and keep the bridge anchored to Pea Island, respectively.
FIGURE 2. NCDOT map shows the location of the southward migrating Oregon Inlet that led up to the construction of the terminal groin and rock revetment along the southern inlet flank in order to stabilize the inlet in 1989-1991. The red star marks the location of the old US Coast Guard Station.
B) A minor scale of inlet management began with the construction of the Oregon Inlet bridge across the in 1962 to 1963. Because the bridge was built with a fixed navigational span over a southward migrating inlet, minor dredging began with the completion of the bridge in 1963 to keep the main channel under the navigational span (NCDOT, 1989). B) Intense inlet management began in 1983 to 1988 as the USACE increased its hopper dredging operations as 3.234 million cubic yards of sediment dredged from the Oregon Inlet channel and ocean bar were discharged into the nearshore (> 20 ft) of northernmost Pea Island (NCDOT, 1989). The estimated cost of the five-year hopper dredging operations using the average figure of 400,000 cubic yards/yr at an average of $1,660,000 per year (Fisher et al., 2004) resulted in an estimated cost of $8.3 million. C) In addition to the increased dredging, the period from 1982 to 1995 was a period of intense extra-tropical nor’easters on the Outer Banks with an average of 34 storms/yr as compared to the period from 1997 to 2002 with ~13 storms/yr (Pietrafesa, pers. comm., 2009).

4
The monitor study reports of (Overton and Fisher, 2005; Overton, 2007) develop a “historical erosion rate” used as the baseline for comparing the post-terminal groin monitor data with pre-terminal groin shoreline conditions. The purpose of this comparison was to determine if the terminal groin had accelerated shoreline erosion.
A) The aerial photographs from 9-19-84 and 10-9-88 were selected for the determination of the “historical erosion rate” or baseline for the monitor study. These times were selected to represent the period “after the USACE initiated large scale hopper dredging in Oregon Inlet” that “caused acceleration in the rate of shoreline erosion on the north end of Pea Island. The authors argued that “the use of earlier aerial photography might introduce a bias towards a lower historical erosion rate” and the use of photography after a March 1989 storm “had the potential to bias the historical erosion rate analysis to higher values.” B) Several major interpretation problems arise by utilizing the 1984-1988 data set as the baseline. Using a four-year time period immediately prior to construction of the terminal groin does not represent a satisfactory “historical record” because this time slice represents both a time of severe shoreline erosion due in part to the increased scale of inlet dredging and offshore dumping and a period of increased numbers of nor’east storms (Pietrafesa, pers. comm., 2009). C) Consequently, the dramatic increased rate of inlet migration (Fig. 2) and shoreline erosion response led directly to the need for constructing the terminal groin to stop inlet migration and anchor the bridge to Pea Island. The Fisher et al. (2004) study utilized the NCDCM erosion data (1949 to1998) as
their background erosion rate. Use of this longer historical data set resulted in a much lower mean annual erosion rate for the monitor site (~8.1 ft/yr) substantially less than the monitor study (27.4 ft/yr), the rate obtained by the 1984 to 1988 data set of Overton (2007). The NCDCM data set represents a mixed time period that includes both pre-terminal groin and post-terminal groin erosion rates, making it impossible to sort out the direct impact of the terminal groin. The lower erosion rates utilized by the 2004 study led to smaller estimates of beach nourishment and consequently lower estimated highway construction and maintenance costs over the 100-year projected life of the project (Riggs et al., 2009).
The NCDOT funded shoreline monitor study for the northern six miles of Pea Island has generally ignored the various processes of human modifications that routinely have taken place to maintain highway 12 on Pea Island since the study began. An unknown amount of dredging was done to keep the Oregon Inlet channel under the fixed navigational bridge span since completion of the bridge in 1963 (NCDOT, 1989). Approximately 6.4 million cubic yards (Table 1) of Oregon Inlet hopper dredged sediment (between1983-2009) were deposited as beach nourishment in the shallow near-shore portion of the northern three miles of Pea Island beaches. Approximately 5.6 million cubic yards (Table 1) of Oregon Inlet pipe-line dredged sediment (between1989-2009) were deposited as beach nourishment on the northern three miles of Pea Island beaches (Fig. 3).

5
TABLE 1. This table is a general summary of the Oregon Inlet dredging and Pea Island beach nourishment efforts from 1983 to 2009. These numbers are based upon the scattered and incomplete records that were available to the public from numerous sources as indicated. Thus, these data are at best a close approximation and are probably on the conservative side. However, the importance is that there has been a substantial effort to stop the Pea Island shoreline recession that started before the terminal groin was built, but has significantly increased along miles 1 to 3 of northern Pea Island since the construction of the terminal groin in 1989-1991.

6
FIGURE 3. The 1999 aerial photograph shows the northern highly vulnerable zone of Stone et al. (1991) with highway 12 immediately adjacent to a very narrow and steep beach with abundant highway wash-overs. The 2004 oblique aerial shows a pipeline dredge beach nourishment project substantially widening the beach in the seaward direction. The 2007 oblique aerial shows the loss of the nourished beach and return to a very narrow and steep condition with common highway wash-overs. The red X marks the same spot on all photos.
In addition, NCDOT mined approximately 0.7 million cubic yards (Table 1) of
sediment from the Oregon Inlet terminal groin fillet and deposited it on the Pea Island beaches around mile post four to five in 1992-93 and 1996-97 to construct barrier dune-ridges (Fig. 4). The construction and reconstruction of multiple barrier dune-ridges have been ongoing by NCDOT on an irregular basis along about seven miles of Pea Island in the three vulnerable sections of Hwy 12 as defined by Stone et al. (1991). In concert with the bulldozing and sand-fencing associated with construction of barrier dune-ridges, emplacement of extensive sand bag installations have recently been utilized at both the middle (Fig. 4) and southern vulnerable sections of highway 12 as defined by Stone et al. (1991).
Ultimately about 1.3 miles of highway 12 in the southern vulnerable section and 3.5 miles of highway 12 in the middle vulnerable section (Figs. 4 and 5) were in the ocean. Westward highway relocation was required at a cost of $4.3 million dollars to NCDOT, including sand bag removal at the latter site.

7
FIGURE 4. Aerial photographs from 1999 and 2002 show the middle (locally called the sandbag area) vulnerable section of Pea Island (Stone et al., 1991). The 1999 aerial shows the former path of highway 12 prior to relocation in 1996 and the relocated highway. The 2002 aerial photo shows the paleo-shorelines for 1963, 1980, and 1996 with substantially increased rates of erosion during the two time slices.

8
FIGURE 5. Photograph of sand-bagged highway 12 that was in the ocean during a storm in 1996. Following this storm NCDOT moved a 3 mile segment of highway 12 in the middle vulnerable area, locally known as the sand bag area, landward to its new location shown on the 1999 aerial photograph.
The monitor studies did differentiate the effect of periods of both high and low storm activity as demonstrated by Riggs and Ames (2007), Riggs et al. (2009, in review) and Pietrafesa (pers. comm., 2009). When shoreline erosion rates are considered on a series of shorter time-slices and compared with specific decadal-scale storm activity, there are alternating periods of recession and accretion with an overall net long-term (~150 year) recession for Pea Island.
The timing of the opening and closing of paleo-inlets within Pea Island and their role in modifying the patterns of adjacent shoreline erosion and accretion was not taken into consideration in the monitor study. The only portion of Pea Island that shows a net accretion on the NCDCM data set happens to be exactly where the paleo-New and Paleo-Loggerhead inlets have repeatedly opened and closed through out the recent history. When a longer term data set is considered (e.g., Everts et al., 1983; Riggs et al., 2009, in review) this portion of Pea Island demonstrates a net recession rather than net accretion that are related to either storm patterns and/or inlet dynamics associated with the timing of inlet openings and closings.
NCDOT (1989), as well as the monitor study, failed to consider the impact of sea-level rise and island migration in their efforts to stabilize Oregon Inlet and Pea Island in order to hold highway 12 in its present location. They concluded that “barrier island migration will not affect the integrity and function of the terminal groin….(since) barrier island migration is a phenomenon that occurs very slowly rather than over time spans that are normally associated with man’s activities on these landforms.” Even though the NCDOT report was produced in 1989, it still is totally naïve and even wrong conclusion based upon the vast amount of evidence that existed at that time and has been developed since then (Culver et al., 2007; Gutierrez et al., 2007; Horton et al., 2009; Kemp et al., 2009; Mallinson et al., 2005, 2008a, 2009; Pilkey and Young, 2009; Riggs et al., 2008, 2009, in review; Williams and Gutierrez, 2009; Zervas, 2004). Why didn’t the monitor study team raise this issue in their reports, as the status of highway 12 worsens with time, and attempt to recognize any evidence of sea-level rise in their vast data base? HAS THERE BEEN A SUBSTANTIAL IMPACT OF THE OREGON INLET TERMINAL GROIN TO THE DOWNSTREAM BEACHES OF PEA ISLAND?
The primary question before the State of North Carolina is as follows: What is the impact of the Oregon Inlet terminal groin on the downstream beaches of Pea Island? There is a vast and relevant data base accumulated by the USGS funded research project on northeastern North Carolina coastal barrier island and inlet dynamics, as well as data on ocean shoreline erosion (Riggs and Ames, 2003, 2007; Riggs et al., 2008, 2009, in review; Mallinson et al., 2005, 2008a, 2008b, 2009; Culver et al., 2006, 2007; Smith et al., 2008). Based upon the many studies, our data strongly suggests that the terminal groin is contributing to the shoreline recession problems on Pea Island.

9
With construction of the terminal groin and all associated efforts dealing with dredging, beach nourishment, and maintenance of highway 12 on Pea Island, the processes of erosion have not been stopped in the monitor study area. The human efforts have temporarily slowed down the process of shoreline recession in a small portion of the study area by the regular addition of dredged sand to the 1 to 3 mile section of northern Pea Island at a very high cost. But each new beach nourishment project is quickly eroded away. Ongoing shoreline recession ultimately has forced NCDOT to emplace sand-bag walls and finally relocate highway 12 in the vicinity of miles 4.5 to 6, as well as the southern-most portion of Pea Island.
Erosion-rate data are extremely variable for any given portion of the shoreline and depend upon the degree and frequency of storms, type of human modification, associated inlet dynamics, and variability in the underlying and shore-face geology. Thus, the time frame selected for measuring the end points becomes critical and will determine whether it is a low, medium, or high rate of recession. In addition, smoothing out the lateral shoreline recession data utilizing running averages can mask some important lateral variations in shore-face composition and underlying geology. Likewise, if one uses short-term time slices, individual events such as storms, storm patterns, beach nourishment, etc. become important, whereas, with the long-term data averages out the influence of important variables resulting in generally smooth lines that reflect long-term net recession (Figs 6 and 9).
The report of Fisher et al. (2004) utilizes the NCDCM 1949 to1998 erosion rate data (Fig. 6) as the baseline or expected erosion rate. The problem with this data set is due to the time increment; it crosses time that includes both pre- and post-human modification and therefore is not satisfactory to answer the question concerning the impact of the terminal groin on the downstream beaches of Pea Island. The monitor reports of Overton and Fisher (2005) and Overton (2007) use the 1984 to 1988 erosion rate baseline (Fig. 6). The problem with utilizing this data set as the baseline is due to the dramatically increased erosion rates due to a period of increased inlet dredging and consequent rates of inlet migration and shoreline erosion. Also, utilizing this large erosion rate within the 1984-1988 period, in concert with the USACE beach nourishment within miles 1 to 3, kept the post-terminal groin shoreline monitor erosion rates well below baseline. Thus, decreasing the likelihood that NCDOT will not have to step in with an expanded beach nourishment program (Fig. 7).
10
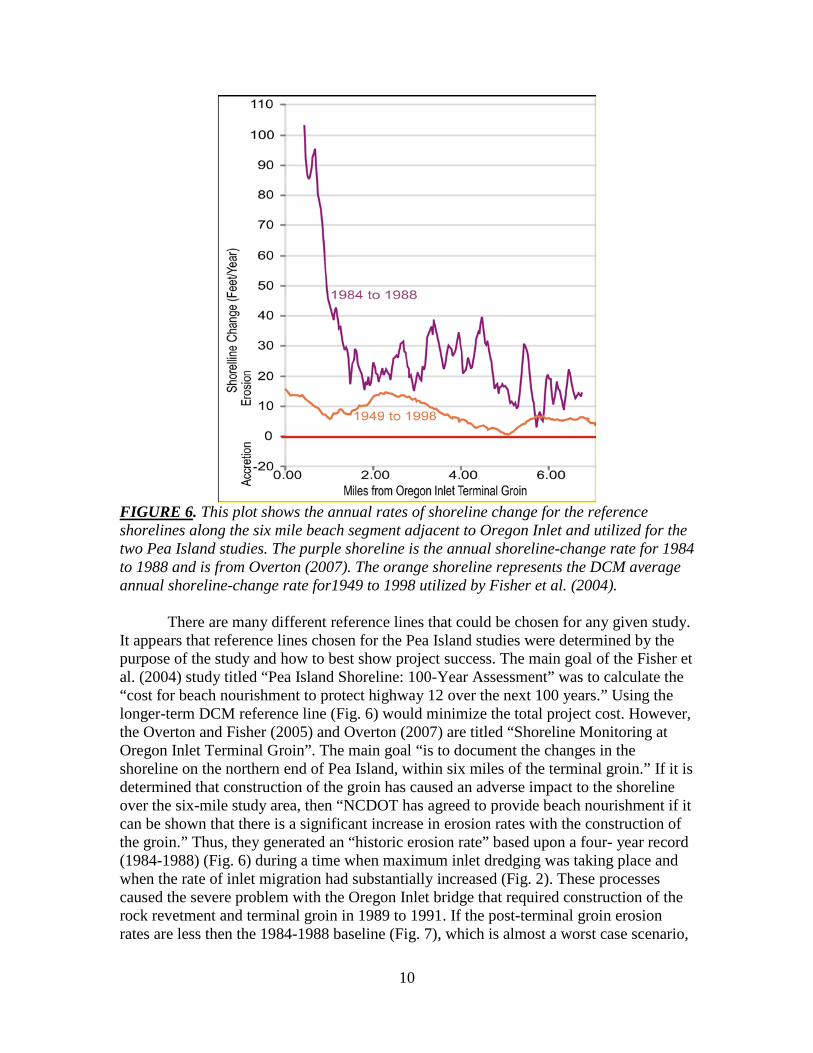
FIGURE 6. This plot shows the annual rates of shoreline change for the reference shorelines along the six mile beach segment adjacent to Oregon Inlet and utilized for the two Pea Island studies. The purple shoreline is the annual shoreline-change rate for 1984 to 1988 and is from Overton (2007). The orange shoreline represents the DCM average annual shoreline-change rate for1949 to 1998 utilized by Fisher et al. (2004).
There are many different reference lines that could be chosen for any given study. It appears that reference lines chosen for the Pea Island studies were determined by the purpose of the study and how to best show project success. The main goal of the Fisher et al. (2004) study titled “Pea Island Shoreline: 100-Year Assessment” was to calculate the “cost for beach nourishment to protect highway 12 over the next 100 years.” Using the longer-term DCM reference line (Fig. 6) would minimize the total project cost. However, the Overton and Fisher (2005) and Overton (2007) are titled “Shoreline Monitoring at Oregon Inlet Terminal Groin”. The main goal “is to document the changes in the shoreline on the northern end of Pea Island, within six miles of the terminal groin.” If it is determined that construction of the groin has caused an adverse impact to the shoreline over the six-mile study area, then “NCDOT has agreed to provide beach nourishment if it can be shown that there is a significant increase in erosion rates with the construction of the groin.” Thus, they generated an “historic erosion rate” based upon a four- year record (1984-1988) (Fig. 6) during a time when maximum inlet dredging was taking place and when the rate of inlet migration had substantially increased (Fig. 2). These processes caused the severe problem with the Oregon Inlet bridge that required construction of the rock revetment and terminal groin in 1989 to 1991. If the post-terminal groin erosion rates are less then the 1984-1988 baseline (Fig. 7), which is almost a worst case scenario,

11
along with enough nourishment sand supplied to the beach and highway 12 maintenance expended, then NCDOT has a low likelihood of having to add additional beach nourishment sand to Pea Island (Tables 1 and 2).
FIGURE 7. This figure shows the same two reference plots as shown in Figure 6, as well as the annual shoreline-change rate for the monitor site from 1989 to 2003 (from Fisher et al., 2004) in solid gray and green colors. In addition, the plot shows the island zones (yellow boxes) that have been the focus of extensive beach nourishment efforts from 1983 to 2009 and that have been characterized by a sand-bag emplacement and road relocation, respectively. The high cost efforts within these two zones (Tables 1 and 2) contribute to the decreased erosion rates within the northern 1to 3 mile zone and the 5 mile zone between miles 3 to 7. However, major portions of the 3 to 7 mile zone have doubled the erosion rates relative to the DCM reference shoreline, in spite of the extensive human modifications (Tables 1 and 2).
Utilizing the data sets in Figure 7, it becomes clear that the erosion rate for the 1 to 3 milepost segment of northern Pea Island was ameliorated by the deposition of beach nourishment sand, but was substantially increased in the beach segment from 3 to 6 miles to the south. In addition, extensive barrier dune-ridges were constructed and maintained through this segment along with the emplacement of sandbags to attempt to hold highway 12 in place. Ultimately in 1996, this segment of highway 12 had to be moved westward in response to the severe shoreline recession.

12
To better address the question of the impact of the terminal groin upon Pea Island, it is recommended that a three baseline series of shoreline-change rates be utilized along the six miles of shoreline adjacent to Oregon Inlet (Figs. 8 and 9). The three periods would represent a period of pre-major human modification (e.g., 1947 to 1963), a period of minor human modification (e.g. 1963 to1980), and the period of major human modification of Oregon Inlet and Pea Island (e.g. 1980 to present). These dates are not perfect, but they do represent better choices to more accurately represent the pre- and post-terminal groin shoreline responses. As demonstrated in Figures 8 and 9, these shoreline-change rates demonstrate substantial differences in erosion rates along the shoreline, and have a higher potential of demonstrating differences in beach dynamics during these different periods.
FIGURE 8. A plot of shoreline-change rates for three different time segments of the long-term average shoreline-change data for the monitor study area. The blue line represents the average shoreline-change rate for the time period 1947 to 1963 that pre-dates most major shore-zone modifications. During this period rates of shoreline change generally range from erosion rates of -10 to accretion rates of + 10 feet/year. We suggest that this historic data set be utilized as the reference shoreline-change rate to demonstrate the impacts of human modification, including the terminal groin. The green line data represents the shoreline-change data during 1963 to 1980 that represents a period of channel dredging and offshore dumping and demonstrates the direct impact upon the adjacent downdrift shoreline. The red line shoreline-change data for 1980 to 2006, a period of multiple and major human modifications (dredging, beach nourishment, barrier dune-ridge construction, sand bag implants, bulldozing and mining overwash sand and bulldozing back onto beach, highway relocations, etc.). The digital shorelines upon which the shoreline-change rates were calculated are from the USACE-FRF and based on Everts et al. (1983), while the 2006 data set is from the USNPS.

13
FIGURE 9. This plot shows the combined long-term shoreline-change rates (1947 to 2006) that represents all three time periods plotted in Figure 8. Notice how the longer-term data tend to smooth out the shoreline recession line. The blue line data represents the shoreline-change rates for 947 to 1963 that pre-dates most major shore-zone modifications as plotted on Figure 8. This is the natural and historic data set that should be utilized as the reference line to separate out the impacts of human modification upon barrier island dynamics, including the impact of the terminal groin. The digital shorelines upon which the shoreline-change rates were calculated are from the USACE-FRF and based on Everts et al. (1983), while the 2006 data set is from the USNPS.
In order to understand whether the terminal groin at Oregon Inlet has had a
negative impact or not on the downstream shoreline of Pea Island beaches one needs to utilize a different reference line then utilized to date. To do this the emphasis must be based upon the natural dynamics of the inlet-barrier island system; the processes that have created this coastal system and will determine how it will respond to storms and sea-level rise through time. Thus, a more realistic shoreline analysis is based on the general patterns of relative change that pre-date major human modification. This is not an argument over the methodology, absolute numbers, error bars, or small differences of change. Rather it concerns the basic approach to the data analysis and the ultimate interpretation of the role of specific processes and forces operating within the Oregon Inlet and Pea Island coastal system.
Consequently, we prefer to utilize the 1947 to 1963 reference line (Fig. 10) which represents the natural barrier island processes that generally pre-date most human modification efforts associated with inlet dredging, beach nourishment, and severe highway maintenance and relocation efforts. Comparing the shoreline-change rate from the downstream monitor study (from Fisher et al., 2004) with the natural shoreline-change rate for the time period 1947 to 1963 results in a much different interpretation as shown in Figure 10. Using this baseline, demonstrates that the downstream impacts of the terminal groin and inlet dredging are severe, in spite of the human efforts to hold the line. Thus, the main reason Hwy 12 is barely still viable on Pea Island is due to the tremendous effort associated with extensive beach nourishment, bulldozed barrier dune-

14
ridge construction and maintenance, sand-bag emplacements, and highway relocations (Tables 1 and 2).
FIGURE 10. Plot shows the annual shoreline-change rate for the monitor site from 1989 to 2003 (from Fisher et al., 2004) in solid gray and green colors. The monitor data are plotted against the annual shoreline-change rate for the 1947 to 1963 historic reference. The digital shoreline upon which the shoreline-change rate was calculated is from the USACE-FRF and based on Everts et al. (1983). In addition, the plot shows the island zones (yellow boxes) that have been the focus of extensive beach nourishment efforts from 1983 to 2009 and that have been characterized by a sand-bag emplacement and road relocation, respectively.
TABLE 2 This table is a general summary of the Oregon Inlet bridge and Pea Island highway 12 maintenance cost from 1983 to 2009. These numbers are based upon the scattered and incomplete records that were available to the public from numerous

15
sources as indicated. Thus, these data are, at best, a close approximation and are probably on the conservative side.
The costs in Table 2 are broken into two categories based upon 1) cost for
NCDOT to maintain highway 12 on Pea Island as shoreline erosion increasingly impacted the highway, and 2) cost of beach nourishment in efforts to stop the increased shoreline erosion along the northernmost 1 to 3 miles of Pea Island. Thus, attempting to hold the line has become an extremely expensive proposition.
Fisher et al. (2004) used the following estimates to calculate the costs of beach nourishment for the construction and maintenance of the new highway 12 across the northern two reaches of Pea Island:
Pipeline dredging = $4.29/ cubic yard + ~ $660 K for mob and demob. Hopper dredging = $6.49/cubic yard + ~ $1 million for mob & demob.
Based upon the 2004 costs, Fisher et al. calculated that a one million cubic yard pipeline nourishment project would cost approximately $5 million, whereas a hopper nourishment project would cost approximately $7.5 million. These cost figures were applied to USACE dredging volumes to estimate the 2006 to 2009 dredging costs in Table 2.
Fisher et al. (2004) estimate that the beach nourishment necessary to hold the proposed new highway highway 12 along the length of Pea Island for the next 100 years would take a minimum of 105.7 million cubic yards of dredged sand at a minimum cost of $930 million, and with the Oregon Inlet terminal groin in place. So one could seriously ask if the terminal groin has solved the erosion problem or stabilized the beach of downstream Pea Island into the near future? ADDITIONAL COSTS OF THE TERMINAL GROIN TO PEA ISLAND
1. Beach nourishment negatively impacts the benthic infauna within the beach and adjacent surf zone (Dolan et al., 2004 , 2006) which in turn negatively impacts the swash zone feeding habitats critical for many shorebirds, as well as the fish that feed in the surf zone.
2. An eroding and receding beach backed by a constructed barrier dune-ridge that is fixed in space and time results in an anomalously steep beach that gets steeper with time until the dune-ridge is scarped and then breached by storms. Steep beaches are too high energy for turtle and shore bird nesting sites. Beach nourishment projects temporarily stop the recession, but do not stop the erosion and quickly return to the same unstable, steep beach profile removing that habitat as favorable nesting sites.
3. The maintenance of constructed barrier dune-ridges prevent the natural and crucial process of overwash that produces the natural broad overwash ramps (Riggs et al., 2008, in review), the natural nesting habitats for piping plover, terns, oyster catchers, black skimmers, etc. Natural overwash-dominated barrier islands also result in low sloped beaches that provide essential feeding habitats for these nesting birds, as well as adequate nesting sites for sea turtles.
4. The Oregon Inlet fillet is rapidly evolving which jeopardizes the overall nesting habitats for many of the endangered species (Fig. 11).

16
a. The sand fillet is surrounded on the north and west by massive rock walls that prevent the flow through of storm overwash.
b. Instead, overwash events tend to be flooding events that fill the fillet and deposit new sediment within the confines of the fillet. With increasing fillet elevation, deflation becomes the dominant process providing great volumes of sand to the dune system and leaving a gravel lag deposit across the flats. Thus, the accreting dune fields on the southwest side of the fillet have now expanded and cover major portions of the fillet area.
c. The lower flats trap storm waters and are flooded for extended periods allowing for the expansion of marsh habitat.
d. Together the dune fields and marshes constitute a major portion of the fillet. This leaves a small portion of the original fillet area along the ocean shoreline that represents a nesting habitat for many of the endangered species. However, because the ocean front is low, nesting is often terminated by flooding events..
5. Beach nourishment sand that is generally deposited on the severely eroding segment of Pea Island (from miles 1 to 3) to protect highway 12, generally is not transported northward back into Oregon Inlet or into the terminal groin fillet. In fact the fillet is rarely filled and appears to actually be eroding on the seaward side. The dominant northeast winds and wave setup probably cause wave refraction around the end of the terminal groin, eroding the seaward side of the fillet as evidenced in Figure 11.
FIGURE 11. Oblique aerial photographs show the fillet behind the Oregon Inlet terminal groin that was built in 1989-1991. Panel A is looking south from Oregon Inlet down northern Pea Island. The cuspate geometry of the ocean shoreline within the fillet
A
B

17
suggests that wave refraction around the end of the terminal groin is causing small-scale erosion within the fillet itself. Panel B shows the extensive area of active dune fields and the impounded area on the back side that is now marsh. This leaves the constricting ocean-front zone as an active overwash plain producing important nesting habitat for many endangered species. Photographs were taken on 6-6-08 by the Program for the Study of Developed Shorelines.
REFERENCES CITED Culver, S.J., Ames, D.V., Corbett, D.R., Mallinson, D.J., Riggs, S.R., Smith, C.G., and
Vance, D.J., 2006, Foraminiferal and sedimentary record of late Holocene barrier island evolution, Pea Island, North Carolina: the role of storm overwash, inlet processes and anthropogenic modification. Journal of Coastal Research, v. 22, p.836-846.
Culver, S.J., Grand Pre, C.A., Mallinson, D.J., Riggs, S.R., Corbett, D.R., Foley, J., Male, M., Ricardo, J., Rosenberger, J., Smith, C.G., Smith, C.W., Snyder, S.W., Twamley, D., Farrell, K., and Horton, B.P. 2007. Late Holocene barrier island collapse: Outer Banks, North Carolina, U.S.A. The Sedimentary Record, v. 5, no. 4.
Dolan, R., Dofflemeyer, S., Donoghue, C., and Jones-Smith, J. 2004. Analysis of Changes in the Beach Sediment and Beach-Face Organisms Associated with Sand Bypassing from the Oregon Inlet to Pea Island, North Carolina, 1990-2002. Coastal Research Associates Report, 71 p.
Dolan, R., Donoghue, C., and Stewart, D. 2006. Long-term impacts of tidal inlet bypassing on the swash zone filter feeder Emerita talpoida, Oregon Inlet and Pea Island, North Carolina. Shore and Beach, v. 74, no. 1, p. 23-27.
Everts, C.H., Battley, J.P., and Gibson, P.N. 1983. Shoreline Movements: Cape Henry, Virginia to Cape Hatteras, North Carolina: 1849-1980. U.S. Army Corps of Engineers, Washington DC, Tech. Rept. CERC-83-1, 111 p.
Fisher, J.S., Overton, M.F., and Jarrett, T. 2004. Pea Island Shoreline: 100-Year Assessment. FDH Engineering, Inc. for NC DOT, 18 p.
Gutierrez, B.T., Williams, S.J., and Thieler, E.R. 2007. Potential for shoreline changes due to sea-level rise along the U.S. mid-Atlantic region. U.S. Geological Survey Open File Report 2007-1278. Horton, B.P., Peltier, W.R., Culver, S.J., Drummond, R., Engelhart, S.E., Kemp, A.C., Mallinson, D., Thieler, E.R., Riggs, S.R., Ames, D.V., and Thomson, K.H. 2009. Holocene sea-level changes along the North Carolina coastline and their implications for glacial isostatic adjustment models. Quaternary Science Reviews, v. 28, p. 1725-1736. Kemp, A.C., Horton, B.P., Culver, S.J., Corbett, D.R., van de Plassche, O., Gehrels, W.R., Douglas, B.C., and Parnell, A.C. 2009. Timing and magnitude of recent accelerated sea-level rise (North Carolina, United States). Geology, v. 37, no. 11, p. 1035-1038.

18
Mallinson, D.A., Riggs, S.R., Thieler, E.R., Culver, S.J., Foster, D., Corbett, D.R., Farrell, K., and Wehmiller, J. 2005. Late Neogene evolution of the northeastern coastal system: filling the northern Albemarle Sound. Marine Geology, v. 217, p. 97-117.
Mallinson, D.J., Culver, S.J., Riggs, S.R., Walsh, J.P., Ames, D.V., and Smith, C.W. 2008a. Past, Present, and Future Inlets of the Outer Banks Barrier Islands, North Carolina. White Paper published by East Carolina University, 22 p.
Mallinson, D., Mahan, S., Moore, C. 2008b. High resolution shallow geologic characterization of a late Pleistocene eolian environment using ground penetrating radar and optically stimulated luminescence techniques: North Carolina, USA. Southeastern Geology, 45: 161-177
Mallinson, D.J., Culver, S.J., Riggs, S.R., Thieler, E.R., Foster, D., Wehmiller, J., Farrell, K., Pierson, J. 2009. Regional seismic stratigraphy and controls on the Quaternary evolution of the Cape Hatteras region of the Atlantic passive margin; USA. Marine Geology.
NCDOT. 1989. Environmental Assessment and Finding of No Significant Impact: Construction of a Terminal Groin and Revetment at Pea Island: Protection of the Herbert C. Bonner Bridge and North Carolina Highway 12, Dare County, North Carolina. North Carolina Department of Transportation, Raleigh. 30 p + 3 Append.
Overton, M.F. June 2007. Shoreline Monitoring at Oregon Inlet terminal groin. Reports 28 to 31 in June 2007. Prepared for NC Dept. of Transportation, 15 p.
Overton, M.F., and Fisher, J.S. March 2005. Shoreline Monitoring at Oregon Inlet terminal groin. Reports 1 to 27 in March 2005. Prepared for NC Dept. of Transportation, 16 p.
Pilkey, O.H., and Young, R. 2009. The Rising Sea. Island Press, Washington DC. 203 p. Riggs, S.R., and Ames, D.V., 2003, Drowning of North Carolina: Sea-Level Rise
and Estuarine Dynamics: NC Sea Grant College Program, Raleigh, NC, Pub. No. UNC-SG-03-04, 152 p.
Riggs, S.R., and Ames, D.V. 2007. Effect of Storms on Barrier Island Dynamics, Core Banks, Cape Lookout National Seashore, North Carolina, 1960-2001. U.S. Geological Survey Scientific Investigations Report 2006-5309, 78 p.
Riggs, S.R., Ames, D.V., Culver, S.J., Mallinson, D.J., Corbett, D.R., and Walsh, J.P. 2008. North Carolina’s Coasts in Crisis: A Vision for the Future. White Paper Published by Members of the North Carolina Coastal Geology Cooperative Research Program, Department of Geological Sciences, East Carolina University, Greenville, NC, 26 p.
Riggs, S.R., Ames, D.V., Culver, S.J., Mallinson, D.J., Corbett, D.R., and Walsh, J.P. 2009. In the eye of a human hurricane: Oregon Inlet, Pea Island, and the Northern Outer Banks, North Carolina; In Identifying America’s Most Vulnerable Oceanfront Communities: A Geological Perspective”, Eds. J.T. Kelley, O.H. Pilkey, and J.A.G. Cooper. Geological Society of America, Special Publication 460, p. 43-72.
Riggs, S.R., Ames, D.V., Mallinson, D.J., Culver, S.J., and Parham, P.R. In Review. Barrier island dynamics and geomorphic evolution of the Outer Banks, North Carolina. U.S.Geological Survey Scientific Investigations Report, 183 p.

19
Smith, C.G., Culver, S.J., Riggs, S.R., Ames, D., Corbett, D.R., and Mallinson, D. 2008. Geospatial analysis of barrier island width of two segments of the Outer Banks, North Carolina, USA: anthropogenic curtailment of natural self-sustaining processes. Journal of Coastal Research, v. 24, p. 70-83.
Stone, J., Overton, M., and Fisher, J. 1991. Options for North Carolina Highways Vulnerable to Long-Term Erosion. N.C. Department of Transportation, Division of Highways, Raleigh, 69 p, + App.
Williams, S.J., and Guitierrez, B.T. 2009. Sea-level rise and coastal change: causes and implication for the future of coasts and low-lying regions. Shore and Beach, v. 77, no. 4, p, 1-9.
Zervas, C.E. 2004. North Carolina Bathymetry/Topography Sea Level Rise Project: Determination of Sea Level Trends. NOAA Technical Report NOS CO-OPS 041, May, 31 p.