implementation of lrfd geotechnical design for … of lrfd geotechnical design for deep foundations...
TRANSCRIPT

Implementation of LRFD Geotechnical Design for Deep Foundations Using Texas Cone Penetrometer (TCP) Test
Hoyoung Seo, Rozbeh B. Moghaddam, James G. Surles, William D. Lawson
Performed in Cooperation with the Texas Department of Transportation
and the Federal Highway Administration
Research Project 5-6788-01
Research Report No. 5-6788-01-1
http://www.techmrt.ttu.edu/reports.php
Texas Tech University
Multidisciplinary Research in Transportation

i
Technical Report Documentation Page
1. Report No.: 2. Government Accession No.: 3. Recipient’s Catalog No.:
4. Title and Subtitle:
Implementation of LRFD Geotechnical Design for Deep Foundations
Using Texas Cone Penetrometer (TCP) Test
5. Report Date:
September 2015
6. Performing Organization Code:
7. Author(s): Hoyoung Seo, Rozbeh B. Moghaddam, James G. Surles,
William D. Lawson
8. Performing Organization
Report No. 5-6788-01-1
9. Performing Organization Name and Address:
Texas Tech Center for Multidisciplinary Research in Transportation
Texas Tech University
10. Work Unit No. (TRAIS):
Box 41023
Lubbock, Texas 79409-1023
11. Contract or Grant No. :
Project 5-6788-01
12. Sponsoring Agency Name and Address
Texas Department of Transportation
Division of Research and Technology Implementation
125 E.11th Street
Austin, TX 78701-2483
13. Type of Report and Period
Cover: Technical Report
June 2015 – August 2015
14. Sponsoring Agency Code:
15. Supplementary Notes:
Project performed in cooperation with the Texas Department of Transportation and the Federal Highway
Administration.
16. Abstract:
This study provides resistance factors () for design of deep foundations to implement Load and Resistance Factor
Design (LRFD) for bridge foundations using Texas Cone Penetrometer (TCP) Test data. Initial efforts were made
to determine resistance factors using Davisson’s criterion in Research Project 0-6788: Reliability Based Deep
Foundation Design Using Texas Cone Penetrometer (TCP) Test, completed on 8/31/2014. In this study, additional
LRFD reliability analyses were performed using 5%, and 10% relative settlement criteria to determine ultimate
capacities. The resistance factors obtained using Davisson, 5%, and 10% criteria were 0.30, 0.32, and 0.31,
respectively, for total capacity of driven piles in soils with target reliability index () of 3.0. Similarly, the
resistance factors obtained using Davisson, 5%, and 10% criteria were 0.38, 0.40, and 0.39, respectively, for total
capacity of drilled shafts in soils with of 3.0. These resistance factors reflect TCP blow counts not corrected for
hammer efficiency. Based on the size and scope of the dataset, literature review, and statistical analyses, it is
recommended that resistance factors from Davisson and 5% criteria be used for driven piles in soils ( = 0.44 and
0.30 with of 2.33 and 3.0, respectively) and drilled shafts ( = 0.54 and 0.40 with of 2.33 and 3.0, respectively)
in soils, respectively. It is considered that these values are suitable for implementation for small projects. For large
projects, it is recommend consideration of determining ultimate capacity from static or dynamic load tests in
accordance with AASHTO policy which will yield higher resistance factors.
17. Key Words 18. Distribution Statement: No restrictions. This
document is available to the public through the
National Technical Information Service,
Springfield, Virginia 22161, www.ntis.gov
19. Security Classif. (of this report)
Unclassified
20. Security Classif. (of this page)
Unclassified
21. No. of Pages 22. Price
Form DOT F 1700.7 (8-72)
FHWA/TX-16/5-6788-01-1

ii

iii
Implementation of LRFD Geotechnical Design for
Deep Foundations Using Texas Cone Penetrometer
(TCP) Test
by
Hoyoung Seo
Rozbeh B. Moghaddam
James G. Surles
William D. Lawson
Implementation Report Number 5-6788-01-1
Implementation Project Number 5-6788-01
Performed in cooperation with the Texas Department of Transportation and
the Federal Highway Administration
Center for Multidisciplinary Research in Transportation
Texas Tech University
September 2016

iv
AUTHOR’S DISCLAIMER
The contents of this report reflect the views of the authors who are responsible for the facts and
the accuracy of the data presented herein. The contents do not necessarily reflect the official
view of policies of the Texas Department of Transportation or the Federal Highway
Administration. This report does not constitute a standard, specification, or regulation.
PATENT DISCLAIMER
There was no invention or discovery conceived or first actually reduced to practice in the course
of or under this contract, including any art, method, process, machine, manufacture, design or
composition of matter, or any new useful improvement thereof, or any variety of plant which is
or may be patentable under the patent laws of the United States of America or any foreign
country.
ENGINEERING DISCLAIMER
Not intended for construction, bidding, or permit purposes.
TRADE NAMES AND MANUFACTURERS’ NAMES
The United States Government and the State of Texas do not endorse products or manufacturers.
Trade or manufacturers’ names appear herein solely because they are considered essential to the
object of this report.

v
TABLE OF CONTENTS
Technical Documentation Page .................................................................................... i
Title Page ...................................................................................................................... ii
Disclaimers ................................................................................................................... iv
Table of Contents .......................................................................................................... v
List of Figures ............................................................................................................... ix
List of Tables ................................................................................................................ xiii
1. REVIEW OF ULTIMATE CAPACITY CRITERIA IMPLEMENTED BY OTHER
STATE DOTs
1.1 Research Studies Published by other DOTs Which Have Explored the
Implementation of LRFD for Deep Foundations ..................................................... 1
1.2 Ultimate Bearing Capacity Methods Used by Other DOTs ............................... 8
2. RELIABILITY ANALYSES AND DEVELOP RESISTANCE FACTOR FOR TOTAL
CAPACITY OF DRIVEN PILES IN SOILS
2.1 Determination of Ultimate Capacities Based on 5% and 10% Relative
Settlement Criteria .................................................................................................. 10
2.2 Determination of Statistical Distribution of Bias of the Resistance and Development of
Resistance Factors ................................................................................................... 13
3. RELIABILITY ANALYSES AND DEVELOP RESISTANCE FACTOR FOR TOTAL
CAPACITY OF DRILLED SHAFTS IN SOILS
3.1 Determination of Ultimate Capacities Based on 5% and 10% Relative
Settlement ............................................................................................................... 15
3.2 Determination of Statistical Distribution of Bias of the Resistance and Development
Of Resistance Factors ............................................................................................. 18
4. SUMMARY, CONCLUSIONS AND RECOMMENDATIONS
4.1 Resistance Factors for Driven Piles in Soils ..................................................... 20
4.2 Resistance Factors for Total Capacity of Drilled Shafts in Soils ...................... 21
4.3 Resistance Factors for Shaft and Base Capacities of Drilled Shafts in Soils .... 22
REFERENCES ..................................................................................................... 24

vi
LIST OF FIGURES
1. Status of LRFD Implementation of State DOTs as of 2008 ............................................. 2
2. Status of LRFD Implementation Based on Review of Research Reports, Bridge
Design Manuals, Geotechnical Manuals, and Standard Specifications Published by
Each DOT ............................................................................................................................ 7
3. Ultimate Capacity Criteria Implemented by State DOTs for (a) Driven Piles and (b)
Drilled Shafts ...................................................................................................................... 9
LIST OF TABLES
1. Ultimate Capacity Criteria and LRFD Implementation Status Reports by
State DOTs ......................................................................................................... 3
2. Summary of Other DOTs Datasets Used for LRFD Reliability Analyses................ 8
3. Summary Table for Driven Piles .............................................................................. 12
4. Summary Statistics for Biases of Resistances for Driven Piles ................................ 13
5. Summary Statistics for Biases of Loads Used in this Study ..................................... 14
6. Resistance Factors for Total Capacity of Driven Piles in Soils ( = 2.33) ............... 15
7. Resistance Factors for Total Capacity of Driven Piles in Soils ( = 3.00) ............... 15
8. Summary Table for Drilled Shafts ............................................................................ 17
9. Summary Statistics for Biases of Resistances for Drilled Shafts in Soils ................ 18
10. Resistance Factors for Total Capacity of Drilled Shafts in Soils ( = 2.33) ............ 18
11. Resistance Factors for Total Capacity of Drilled Shafts in Soils ( = 3.00) ............ 19
12. Resistance Factors for Shaft Capacity of Drilled Shafts in Soils ( = 2.33) ............ 19
13. Resistance Factors for Shaft Capacity of Drilled Shafts in Soils ( = 3.00) ............ 19
14. Resistance Factors for Base Capacity of Drilled Shafts in Soils ( = 2.33) ............. 20
15. Resistance Factors for Base Capacity of Drilled Shafts in Soils ( = 3.00) ............. 20
16. Resistance Factors Obtained from Monte Carlo Simulations for Total
Capacity of Driven Piles in Soils ............................................................................. 21
17. Resistance Factors Obtained from Monte Carlo Simulations for Total
Capacity of Drilled Shafts in Soils............................................................................ 21
18. Resistance Factors Obtained from Monte Carlo Simulations for Shaft
Capacity of Drilled Shafts in Soils............................................................................ 22
19. Resistance Factors Obtained from Monte Carlo Simulations for Base
Capacity of Drilled Shafts in Soils ........................................................................... 22

Research Project 5-6788-01 Page 1
REVIEW OF ULTIMATE CAPACITY CRITERIA IMPLEMENTED
BY OTHER STATE DOTs
This report presents a summary of the work completed under the TxDOT Implementation
Project 5-6788-01: Implementation of LRFD Geotechnical Design for Deep Foundations Using
Texas Cone penetrometer (TCP) Test and final recommendations.
As part of this literature review effort, a large number of research reports, bridge design
manuals, geotechnical manuals, and standard specifications published by each state Department
of Transportation (DOTs) were collected and reviewed in detail. These publications discuss
topics related to the development and implementation of the Load and Resistance Factor Design
(LRFD) for deep foundations and the ultimate capacity criteria to determine a foundation’s load
carrying capacity.
1.1 Research Studies Published by Other DOTs Which Have Explored the Implementation
of LRFD for Deep Foundations
Ever since the Federal Highway Administration (FHWA) mandated the use of the load
and resistance factor design (LRFD) approach for all new bridges initiated after September 2007
(Densemore 2000), most DOTs have been working on implementation of LRFD for design of
bridge foundations. AbdelSalam et al. (2010) conducted a nationwide survey of more than 30
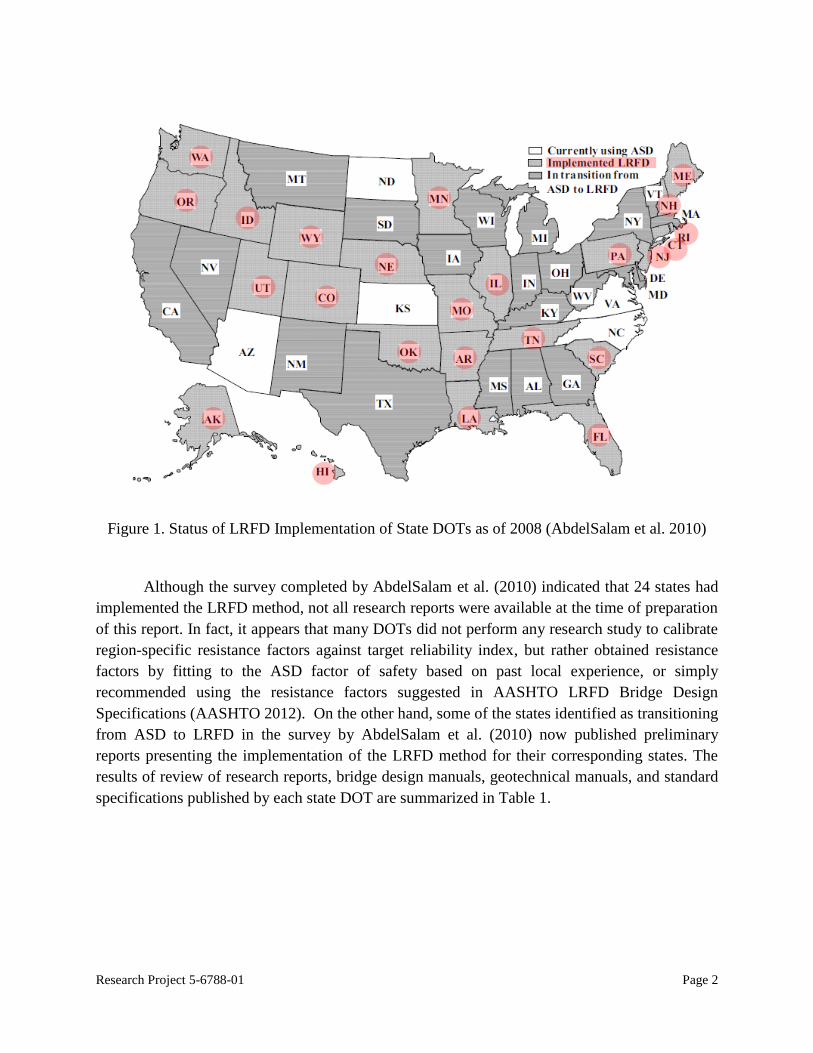
DOTs on the bridge deep foundation practices in 2008. According to AbdelSalam et al. (2010),
as of 2008 24 states had implemented the LRFD method to a certain extent, five states were still
using the allowable stress design (ASD) method, and 21 states were in the process of
transitioning to the LRFD method. Figure 1 shows the status of LRFD implementation for bridge
foundation design at the time of the survey.
Research Project 5-6788-01 Page 2
Figure 1. Status of LRFD Implementation of State DOTs as of 2008 (AbdelSalam et al. 2010)
Although the survey completed by AbdelSalam et al. (2010) indicated that 24 states had
implemented the LRFD method, not all research reports were available at the time of preparation
of this report. In fact, it appears that many DOTs did not perform any research study to calibrate
region-specific resistance factors against target reliability index, but rather obtained resistance
factors by fitting to the ASD factor of safety based on past local experience, or simply
recommended using the resistance factors suggested in AASHTO LRFD Bridge Design
Specifications (AASHTO 2012). On the other hand, some of the states identified as transitioning
from ASD to LRFD in the survey by AbdelSalam et al. (2010) now published preliminary
reports presenting the implementation of the LRFD method for their corresponding states. The
results of review of research reports, bridge design manuals, geotechnical manuals, and standard
specifications published by each state DOT are summarized in Table 1.

Research Project 5-6788-01 Page 3
Table 1. Summary Table Presenting Findings about Ultimate Capacity Criteria LRFD Implementation Status Reported by State DOTs
No. State
Implemented LRFD
according to AbdelSalam et al. (2010)
Refers to AASHTO
LRFD manual
Resistance factor obtained by fitting to ASD factor of safety based on past local
experience
Resistance factor
obtained from reliability analysis
Ultimate Capacity Criteria
Comments References
Driven Pile Drilled Shaft
1 Alabama x x
Resistance factors for driven piles were obtained by fitting to the ASD factor of safety through a research project, but current ALDOT design manual recommends AASHTO LRFD resistance factors.
Ashour et al. (2012); ALDOT (2015)
2 Alaska x No documents available
3 Arizona x
ADOT (2011)
4 Arkansas x Research project for LRFD calibration for drilled shaft foundations is underway by University of Arkansas.
AHTD (2014); Coffman (2015)
5 California x
Resistance factors obtained by fitting to the ASD factor of safety have been used for a transition period. Research project to perform a California specific calibration of resistance factors is underway by University of Texas, Arlington.
Caltrans DRISI (2014)
6 Colorado x Strategic plan to implement LRFD was released by CDOT in 2006, but no research report on resistance factor calibration is available.
Chang et al. (2011)
7 Connecticut x x Uses AASHTO LRFD resistance factors for driven piles. Resistance factors for drilled shafts are not available in the Geotechnical Engineering Manual.
ConnDOT (2005)
8 Delaware x
DelDOT (2005)
9 Florida x x Davisson 5% Kuo et al. (2002);
FDOT (2015)
10 Georgia Resistance factors for structural capacity of H and Prestressed Concrete (PSC) piles are available, but not for geotechnical capacity.
GDOT (2015)
11 Hawaii x Davisson
Resistance factors for deep foundations are not available in Standard Specifications, but Davisson's criterion to determine ultimate capacity of driven piles is recommended.
HDOT (2005)
12 Idaho x x ITD (2008)

Research Project 5-6788-01 Page 4
No. State
Implemented LRFD
according to AbdelSalam et al. (2010)
Refers to AASHTO
LRFD manual
Resistance factor obtained by fitting to ASD factor of safety based on past local
experience
Resistance factor
obtained from reliability analysis
Ultimate Capacity Criteria
Comments References
Driven Pile Drilled Shaft
13 Illinois x x x
IDOT used WSDOT driving formula for calibration of resistance factor for driven piles. For drilled shafts, IDOT refers to AASHTO LRFD resistance factors.
IDOT (2012)
14 Indiana x 10% 10% Salgado et al. (2011)
15 Iowa x Davisson Resistance factors were obtained only for driven piles.
AbdelSalam et al. (2012)
16 Kansas x 5% Resistance factors were obtained only for drilled shafts.
Yang et al. (2010)
17 Kentucky x KYTC (2014)
18 Louisiana x x Davisson 5%
Abu-Farsakh et al. (2009); Abu-Farsakh et al. (2010)
19 Maine x x
Maine DOT (2014)
20 Maryland No documents available
21 Massachusetts x MassDOT (2013)
22 Michigan x MIDOT (2012)
23 Minnesota x x Davisson
Paikowsky et al. (2014)
24 Mississippi x MDOT (2010)
25 Missouri x x Davisson
Loehr et al. (2011); Luna (2014)
26 Montana x MDT (2008)
27 Nebraska x x Nowak et al. (2007)
28 Nevada x NevadaDOT (2008)

Research Project 5-6788-01 Page 5
No. State
Implemented LRFD
according to AbdelSalam et al. (2010)
Refers to AASHTO
LRFD manual
Resistance factor obtained by fitting to ASD factor of safety based on past local
experience
Resistance factor
obtained from reliability analysis
Ultimate Capacity Criteria
Comments References
Driven Pile Drilled Shaft
29 New Hampshire x Davisson
New Bridge Design Manual is to be released. The NHDOT Spec Book does not provide resistance factors but specify Davisson's criterion to be used to determine ultimate capacity.
NHDOT (2010)
30 New Jersey x x NJDOT (2009)
31 New Mexico x Ng and Fazia (2012)
32 New York x NYSDOT (2014)
33 North Carolina x Davisson Resistance factors were obtained only for driven piles.
Rahman et al. (2002)
34 North Dakota x NDDOT (2013)
35 Ohio x Davisson Davisson Construction Manual specifies Davisson's criterion to be used to determine ultimate capacity.
OHDOT (2013); OHDOT (2015)
36 Oklahoma x x Davisson Standard and Specifications Book specifies Davisson's criterion to be used to determine ultimate capacity
OKDOT (2009)
37 Oregon x
x Davisson Bridge Design and Drafting Manual requires Foundation Designer to provide the resistance factor in the Foundation Report.
Smith et al. (2011); ODOT (2015)
38 Pennsylvania x
x Design Manual generally refers to AASHTO LRFD manual but recommends higher resistance factors than AASHTO values.
PennDOT (2015)
39 Rhode Island x x RIDOT (2007)
40 South Carolina x
x Geotechnical Manual generally refers to AASHTO LRFD manual but recommends slightly different resistance factors.
SCDOT (2010)
41 South Dakota
Standards and Manuals do not mention LRFD design of deep foundations. Research report on implementation plan of LRFD was published in 2008.
Foster and Huft (2008); SDDOT (2014); SDDOT (2015)
42 Tennessee x No documents available
43 Texas

Research Project 5-6788-01 Page 6
No. State
Implemented LRFD
according to AbdelSalam et al. (2010)
Refers to AASHTO
LRFD manual
Resistance factor obtained by fitting to ASD factor of safety based on past local
experience
Resistance factor
obtained from reliability analysis
Ultimate Capacity Criteria
Comments References
Driven Pile Drilled Shaft
44 Utah x x UDOT (2011); UDOT (2015)
45 Vermont x VTrans (2010)
46 Virginia Geotechnical manual for LRFD design of deep foundation is under development
VDOT (2010)
47 Washington x x x
Resistance factors for driven piles using WSDOT driving formula or Wave Equation analysis were obtained from reliability analyses. All other resistance factors are referred to AASHTO LRFD manual.
Allen (2005); WSDOT (2015)
48 West Virginia x WVDOH (2014)
49 Wisconsin x WisDOT (2015) Bridge
Manual
50 Wyoming x Bridge design manual for LRFD design of deep foundation is under development.
WYDOT (2013)

Research Project 5-6788-01 Page 7
According to our review, 12 state DOTs performed research projects in an effort to
calibrate resistance factors against target reliability index for driven piles, drilled shafts or both.
Five state DOTs obtained resistance factors by fitting to the ASD factor of safety based on local
experience. The remaining DOTs either refer to AASHTO LRFD manual for resistance factors
or do not specify resistance factors in their design manuals. Fig. 2 shows the LRFD
implementation status of 49 states (Texas not included) based on our review of research reports,
bridge design manuals, geotechnical manuals, and standard specifications published by each
DOT. It should be noted that among the 12 DOTs that performed research projects to calibrate
resistance factors against target reliability index, only four DOTs (Florida, Indiana, Louisiana,
and Missouri) performed calibration for both driven piles and drilled shafts. The remaining eight
DOTs performed calibration either for driven piles or for drilled shafts only. Further details are
given in Table 2.
Fig. 2 Status of LRFD Implementation Based on Review of Research Reports, Bridge Design
Manuals, Geotechnical Manuals, and Standard Specifications Published by Each DOT
32
5
12
Refers to AASHTO LRFD manual orResistance factors not specified
Resistance factor obtained by fittingto ASD factor of safety based onpast local experience
Resistance factor obtained fromreliability analysis

Research Project 5-6788-01 Page 8
Table 2. Summary of Other DOTs’ Datasets Used for LRFD Reliability Analyses
State
Reliability Analysis Number of Datasets
Driven Piles Drilled Shafts Driven Piles Drilled Shafts
Florida x x NS 273
Illinois x NS NA
Indiana x x NA* NA*
Iowa x 264** NA
Kansas x NA 26
Louisiana x x 53** 26
Minnesota x 270** NA
Missouri x x NS 31
New Mexico x NA 24
North Carolina x 175** NA
Oregon x 322** NA
Washington x 141** NA
Texas x x 30 40 (29 in soils and
11 in IGMs) * Research framework is different from conventional resistance calibration process.
** Dataset includes dynamic load tests using PDA.
1.2 Ultimate Bearing Capacity Methods Used by Other DOTs
In order to investigate which ultimate capacity criterion is employed by other DOTs to
determine measured ultimate bearing capacity for deep foundations, a review of published
research reports and design manuals corresponding to state DOTs was completed. A summary of
our review on the ultimate capacity criteria is presented in Table 1.
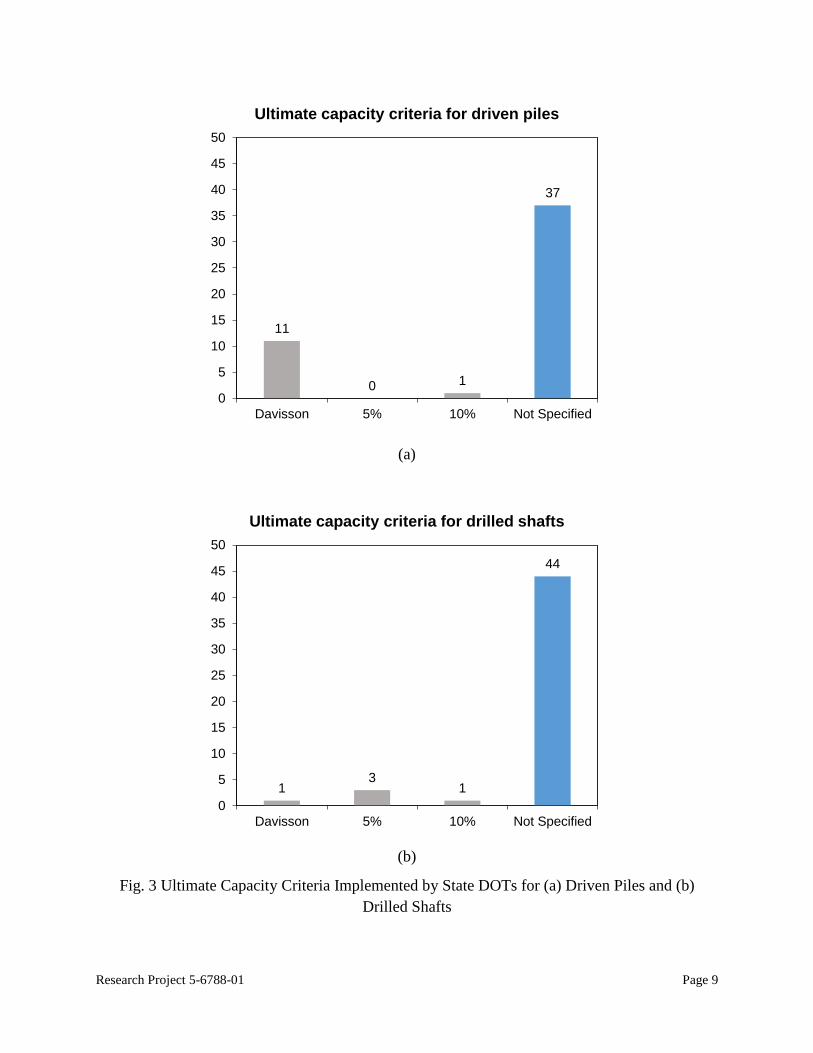
As shown in Fig. 3(a), for driven piles, 37 states out of 49 states (76%) do not specify
which criterion is used to determine the ultimate capacity. Among the 12 states which specified
the ultimate capacity criterion, 11 states use Davisson’s criterion as an ultimate capacity criterion
(seven states explicitly used Davisson’s criterion for calibration of resistance factors and four
states specify Davisson’s criterion to be used to determine ultimate capacity of driven piles in
Bridge Design Manuals or Geotechnical Manuals, even though calibrations of resistance factors
were not performed). Finally, only one state (Indiana) used the 10% relative settlement criterion
as an ultimate capacity criterion (i.e., defining the load at pile head settlement corresponding to
10% of pile diameter as an ultimate capacity) for calibration of resistance factors for driven piles.
In case of drilled shafts, 44 states out of 49 states (90%) do not specify which criterion is
used to determine the ultimate capacity, as shown in Fig. 3(b). Three states used the 5% relative
settlement criterion as an ultimate capacity criterion (i.e., defining the load at pile head
settlement corresponding to 5% of pile diameter as an ultimate capacity) for calibration of
resistance factors for drilled shafts. Again, only one state (Indiana) used the ultimate capacity
based on 10% criterion for calibration of resistance factors for drilled shafts.
Research Project 5-6788-01 Page 9
(a)
(b)
Fig. 3 Ultimate Capacity Criteria Implemented by State DOTs for (a) Driven Piles and (b)
Drilled Shafts
11
0 1
37
0
5
10
15
20
25
30
35
40
45
50
Davisson 5% 10% Not Specified
Ultimate capacity criteria for driven piles
13
1
44
0
5
10
15
20
25
30
35
40
45
50
Davisson 5% 10% Not Specified
Ultimate capacity criteria for drilled shafts

Research Project 5-6788-01 Page 10
2. Reliability Analyses and Development of Resistance Factor for Total Capacity of Driven
Piles in Soils
2.1 Determination of Ultimate Capacities Based on 5% and 10% Relative Settlement
Criteria
The dataset for the previous Research Project 0-6788 consisted of 33 driven piles. All 33
driven piles are precast square concrete piles with widths ranging from 14 to 20 inches and
penetration depths ranging from 15 to 83.5 ft. Among the 33 load tests, 28 of them were
conventional static top-down load tests and the remaining five tests were statnamic load tests.
None of the 33 load tests were instrumented with strain gages; therefore, resistance factors were
determined only for total capacity.
Among the 33 load tests, 22, 12, and one were loaded beyond the Davisson’s criterion, 5%
relative settlement criterion, and 10% relative settlement criterion, respectively. Among the 11
tests which did not reach the Davisson’s offset line, eight reached at least an elastic line and were
included in our dataset. However, the remaining three tests which did not reach even the elastic
line were deemed non-usable and therefore excluded from the dataset for the subsequent
reliability analyses in the previous Research Project 0-6788. Consequently, 30 tests on driven
piles were included in the final load-test dataset. The same 30 load tests were used in this
Implementation Project 5-6788-01.
For the 29 load tests that did not reach a settlement of 10% of diameter at the pile head,
the load-settlement curves were extrapolated up to 10% pile diameter. In doing so, the research
team used the weighted hyperbolic fitting technique. In the original Chin’s method (Chin 1970),
it is assumed that the load-settlement curves of deep foundations are hyperbolic as follows:
𝑄 =𝑤
𝐶1𝑤 + 𝐶2 (Eq. 1)
where Q = applied load, w = pile head settlement, and C1 & C2 = fitting constants. Chin (1970)
suggested that C1 and C2 be determined by fitting a straight line through load test results in w/Q
versus w space. In this fitting process, it is implicitly assumed that each data point carries the
same weight. On the other hand, the weighted hyperbolic technique, which was developed in the
previous Research Project 0-6788, takes the squared values of each settlement data point as
weights to determine the fitting parameters for the hyperbolic curve. Mathematically, the fitting
constants C1 and C2 are the parameters found using a weighted least-square regression method
and expressed as follows:

Research Project 5-6788-01 Page 11
𝐶1 =
(∑𝑤𝑖2
𝑄𝑖) − 𝐶2(∑𝑤𝑖)
∑𝑤𝑖2
(Eq. 2a)
𝐶2 =
(∑𝑤𝑖𝑄𝑖) (∑𝑤𝑖
2) − (∑𝑤𝑖) (∑𝑤𝑖2
𝑄𝑖)
𝑛(∑𝑤𝑖2) − (∑𝑤𝑖)
2
(Eq. 2b)
where Qi = each applied load, wi = each measured settlement, and n = summation of weights.
The weighted hyperbolic curve is then constructed using the C1 and C2 obtained from Eqs. (2a)
and (2b), respectively. In the previous Research Project 0-6788, it was found that the weighted
hyperbolic fitting technique yielded slightly less scatter than the original Chin’s method, when
comparing the Davisson capacity from the extrapolated curve with that from the measured load-
settlement curve.
In this Implementation Project 5-6788-01, ultimate capacities based on 5% and 10%
relative settlement criteria were determined from the weighted hyperbolic curves using the
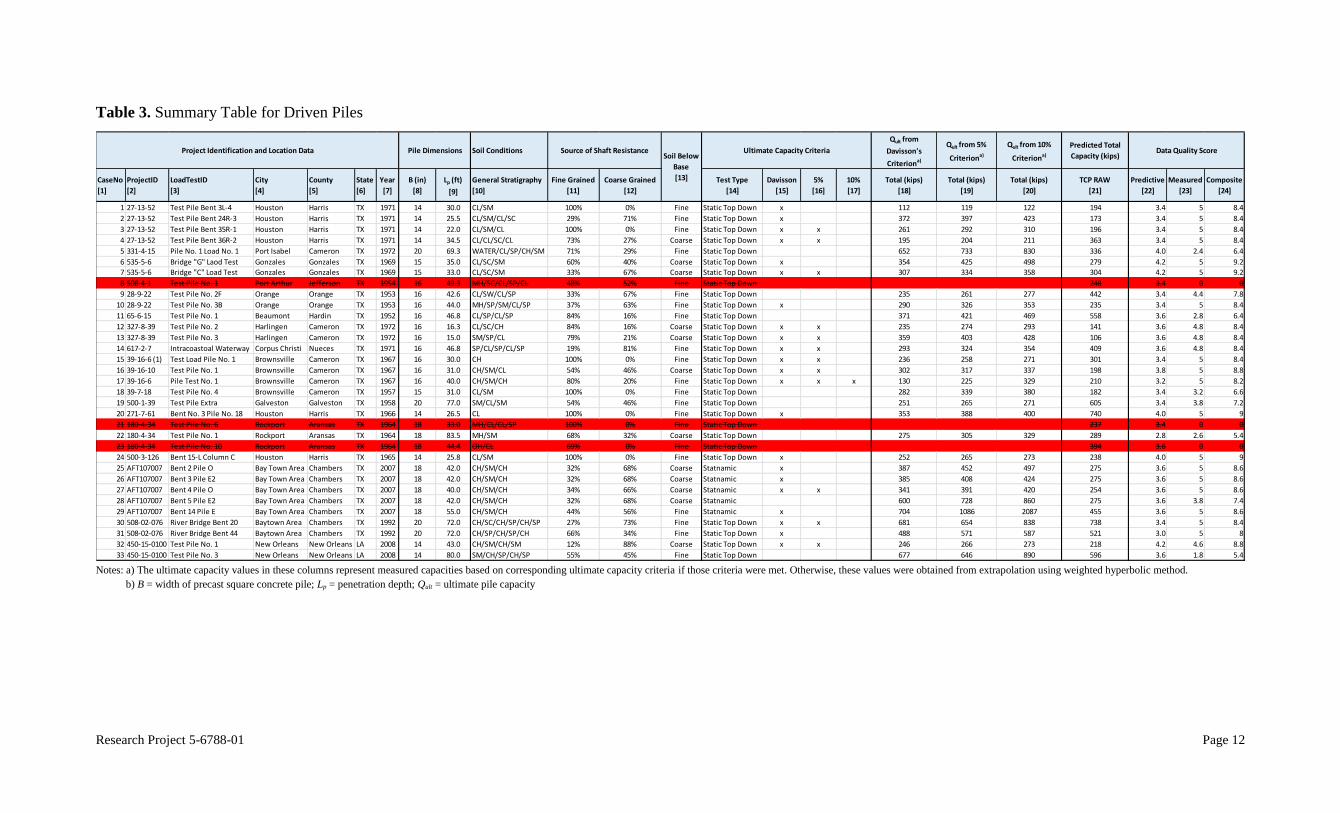
aforementioned technique. Table 3 presents a summary of the ultimate capacities based on
Davisson, 5%, and 10% criteria of driven piles (the three tests disregarded in the subsequent
analysis, highlighted with red color and struck-through, were also included in Table 3). It should
be noted that the ultimate capacity values in Columns 18 through 20 represent measured
capacities based on corresponding ultimate capacity criteria if those criteria were met.
Otherwise, these values were obtained from extrapolation using the weighted hyperbolic method.
Research Project 5-6788-01 Page 12
Table 3. Summary Table for Driven Piles
Notes: a) The ultimate capacity values in these columns represent measured capacities based on corresponding ultimate capacity criteria if those criteria were met. Otherwise, these values were obtained from extrapolation using weighted hyperbolic method.
b) B = width of precast square concrete pile; Lp = penetration depth; Qult = ultimate pile capacity
Soil Conditions
Qult from
Davisson's
Criteriona)
Qult from 5%
Criteriona)
Qult from 10%
Criteriona)
CaseNo
[1]
ProjectID
[2]
LoadTestID
[3]
City
[4]
County
[5]
State
[6]
Year
[7]
B (in)
[8]
Lp (ft)
[9]
General Stratigraphy
[10]
Fine Grained
[11]
Coarse Grained
[12]
Test Type
[14]
Davisson
[15]
5%
[16]
10%
[17]
Total (kips)
[18]
Total (kips)
[19]
Total (kips)
[20]
TCP RAW
[21]
Predictive
[22]
Measured
[23]
Composite
[24]
1 27-13-52 Test Pile Bent 3L-4 Houston Harris TX 1971 14 30.0 CL/SM 100% 0% Fine Static Top Down x 112 119 122 194 3.4 5 8.4
2 27-13-52 Test Pile Bent 24R-3 Houston Harris TX 1971 14 25.5 CL/SM/CL/SC 29% 71% Fine Static Top Down x 372 397 423 173 3.4 5 8.4
3 27-13-52 Test Pile Bent 35R-1 Houston Harris TX 1971 14 22.0 CL/SM/CL 100% 0% Fine Static Top Down x x 261 292 310 196 3.4 5 8.4
4 27-13-52 Test Pile Bent 36R-2 Houston Harris TX 1971 14 34.5 CL/CL/SC/CL 73% 27% Coarse Static Top Down x x 195 204 211 363 3.4 5 8.4
5 331-4-15 Pile No. 1 Load No. 1 Port Isabel Cameron TX 1972 20 69.3 WATER/CL/SP/CH/SM 71% 29% Fine Static Top Down 652 733 830 336 4.0 2.4 6.4
6 535-5-6 Bridge "G" Laod Test Gonzales Gonzales TX 1969 15 35.0 CL/SC/SM 60% 40% Coarse Static Top Down x 354 425 498 279 4.2 5 9.2
7 535-5-6 Bridge "C" Load Test Gonzales Gonzales TX 1969 15 33.0 CL/SC/SM 33% 67% Coarse Static Top Down x x 307 334 358 304 4.2 5 9.2
8 508-4-1 Test Pile No. 1 Port Arthur Jefferson TX 1954 16 49.3 MH/SC/CL/SP/CL 48% 52% Fine Static Top Down 248 3.4 0 0
9 28-9-22 Test Pile No. 2F Orange Orange TX 1953 16 42.6 CL/SW/CL/SP 33% 67% Fine Static Top Down 235 261 277 442 3.4 4.4 7.8
10 28-9-22 Test Pile No. 3B Orange Orange TX 1953 16 44.0 MH/SP/SM/CL/SP 37% 63% Fine Static Top Down x 290 326 353 235 3.4 5 8.4
11 65-6-15 Test Pile No. 1 Beaumont Hardin TX 1952 16 46.8 CL/SP/CL/SP 84% 16% Fine Static Top Down 371 421 469 558 3.6 2.8 6.4
12 327-8-39 Test Pile No. 2 Harlingen Cameron TX 1972 16 16.3 CL/SC/CH 84% 16% Coarse Static Top Down x x 235 274 293 141 3.6 4.8 8.4
13 327-8-39 Test Pile No. 3 Harlingen Cameron TX 1972 16 15.0 SM/SP/CL 79% 21% Coarse Static Top Down x x 359 403 428 106 3.6 4.8 8.4
14 617-2-7 Intracoastoal Waterway Corpus Christi Nueces TX 1971 16 46.8 SP/CL/SP/CL/SP 19% 81% Fine Static Top Down x x 293 324 354 409 3.6 4.8 8.4
15 39-16-6 (1) Test Load Pile No. 1 Brownsville Cameron TX 1967 16 30.0 CH 100% 0% Fine Static Top Down x x 236 258 271 301 3.4 5 8.4
16 39-16-10 Test Pile No. 1 Brownsville Cameron TX 1967 16 31.0 CH/SM/CL 54% 46% Coarse Static Top Down x x 302 317 337 198 3.8 5 8.8
17 39-16-6 Pile Test No. 1 Brownsville Cameron TX 1967 16 40.0 CH/SM/CH 80% 20% Fine Static Top Down x x x 130 225 329 210 3.2 5 8.2
18 39-7-18 Test Pile No. 4 Brownsville Cameron TX 1957 15 31.0 CL/SM 100% 0% Fine Static Top Down 282 339 380 182 3.4 3.2 6.6
19 500-1-39 Test Pile Extra Galveston Galveston TX 1958 20 77.0 SM/CL/SM 54% 46% Fine Static Top Down 251 265 271 605 3.4 3.8 7.2
20 271-7-61 Bent No. 3 Pile No. 18 Houston Harris TX 1966 14 26.5 CL 100% 0% Fine Static Top Down x 353 388 400 740 4.0 5 9
21 180-4-34 Test Pile No. 6 Rockport Aransas TX 1964 18 33.0 MH/CL/CL/SP 100% 0% Fine Static Top Down 237 3.4 0 0
22 180-4-34 Test Pile No. 1 Rockport Aransas TX 1964 18 83.5 MH/SM 68% 32% Coarse Static Top Down 275 305 329 289 2.8 2.6 5.4
23 180-4-34 Test Pile No. 10 Rockport Aransas TX 1964 18 44.4 OH/CL 69% 0% Fine Static Top Down 394 3.6 0 0
24 500-3-126 Bent 15-L Column C Houston Harris TX 1965 14 25.8 CL/SM 100% 0% Fine Static Top Down x 252 265 273 238 4.0 5 9
25 AFT107007 Bent 2 Pile O Bay Town Area Chambers TX 2007 18 42.0 CH/SM/CH 32% 68% Coarse Statnamic x 387 452 497 275 3.6 5 8.6
26 AFT107007 Bent 3 Pile E2 Bay Town Area Chambers TX 2007 18 42.0 CH/SM/CH 32% 68% Coarse Statnamic x 385 408 424 275 3.6 5 8.6
27 AFT107007 Bent 4 Pile O Bay Town Area Chambers TX 2007 18 40.0 CH/SM/CH 34% 66% Coarse Statnamic x x 341 391 420 254 3.6 5 8.6
28 AFT107007 Bent 5 Pile E2 Bay Town Area Chambers TX 2007 18 42.0 CH/SM/CH 32% 68% Coarse Statnamic 600 728 860 275 3.6 3.8 7.4
29 AFT107007 Bent 14 Pile E Bay Town Area Chambers TX 2007 18 55.0 CH/SM/CH 44% 56% Fine Statnamic x 704 1086 2087 455 3.6 5 8.6
30 508-02-076 River Bridge Bent 20 Baytown Area Chambers TX 1992 20 72.0 CH/SC/CH/SP/CH/SP 27% 73% Fine Static Top Down x x 681 654 838 738 3.4 5 8.4
31 508-02-076 River Bridge Bent 44 Baytown Area Chambers TX 1992 20 72.0 CH/SP/CH/SP/CH 66% 34% Fine Static Top Down x 488 571 587 521 3.0 5 8
32 450-15-0100 Test Pile No. 1 New Orleans New Orleans LA 2008 14 43.0 CH/SM/CH/SM 12% 88% Coarse Static Top Down x x 246 266 273 218 4.2 4.6 8.8
33 450-15-0100 Test Pile No. 3 New Orleans New Orleans LA 2008 14 80.0 SM/CH/SP/CH/SP 55% 45% Fine Static Top Down 677 646 890 596 3.6 1.8 5.4
Data Quality ScoreProject Identification and Location Data Pile Dimensions Source of Shaft ResistanceSoil Below
Base
[13]
Predicted Total
Capacity (kips)Ultimate Capacity Criteria

Research Project 5-6788-01 Page 13
2.2 Determination of Statistical Distribution of Bias of the Resistance and Development of
Resistance Factors
The measured (or extrapolated) ultimate capacities for each ultimate capacity criteria were
compared with the predicted capacities obtained using TCP raw blow counts (TCP Raw) without
hammer energy correction. Biases (i= measured resistance/predicted resistance) for each test
were then computed for each ultimate capacity criterion. In order to compute the mean and
coefficient of variation (COV) of the biases, a weighting factor that ranged from 0 to 1 was used
to consider the uncertainties associated with the data quality, as done in the previous Research
Project 0-6788. Detailed procedures to obtain the weighted mean and COV of the biases are as
follows:
a) Take the log transformation of the data (i.e. xi = ln(i)).
b) Compute the weighted mean (�̅�) and variance (sx) of the log-transformed sample
c) Plug the weighted mean and variance of the log-transformed sample into the following
equations to obtain weighted uniformly minimum variance unbiased estimators (UMVUE)
for mean (E[]) and standard deviations (SD[]):
𝐸[𝜆] = exp(�̅�) 𝑔(0.5𝑠𝑥2), and (Eq. 3)
𝑆𝐷[𝜆]2 = exp(2�̅�) {𝑔(2𝑠𝑥2) − 𝑔 (
𝑛−2
𝑛−1𝑠𝑥2)}, where (Eq. 4)
𝑔(𝑡) = 1 +𝑛 − 1
𝑛𝑡 +
(𝑛 − 1)3
𝑛22!
𝑡2
𝑛 + 1+(𝑛 − 1)5
𝑛33!
𝑡3
(𝑛 + 1)(𝑛 + 3)+ ⋯ (Eq. 5)
d) Compute COV by dividing SD[] by E[] obtained from Eqs. (3) and (4), respectively.
The weighted UMVUE summary statistics for the 30 load tests on driven piles in soils are
given in Table 4. As expected, the mean biases for 5% and 10% criteria are greater than that for
Davisson’s criterion. It was observed that the COVs for 5% and 10% criteria were also greater
than that for Davisson’s criterion.
Table 4. Summary Statistics for Biases of Resistances for Driven Piles
Ultimate Capacity
Criteria
Total number of load
tests considered
(Total sample size)
Effective sample
size
Mean of Bias COV of Bias
Davisson 30 26.8 1.224 0.532
5% 30 26.8 1.397 0.559
10% 30 26.8 1.600 0.620

Research Project 5-6788-01 Page 14
Resistance factors were obtained following the first order second moment (FOSM)
method and the Monte Carlo simulation using the bias statistics presented in Table 4. In the
FOSM method, resistance factor () is obtained from the following equation:
𝜙 =
𝜆𝑅 (𝛾𝐷𝐿𝑄𝐷𝐿
𝑄𝐿𝐿+ 𝛾𝐿𝐿)√
1 + 𝐶𝑂𝑉𝑄𝐷𝐿2 + 𝐶𝑂𝑉𝑄𝐿𝐿
2
1 + 𝐶𝑂𝑉𝑅2
(𝜆𝐷𝐿𝑄𝐷𝐿
𝑄𝐿𝐿+ 𝜆𝐿𝐿) 𝑒𝑥𝑝 {𝛽√ln[(1 + 𝐶𝑂𝑉𝑅
2)(1 + 𝐶𝑂𝑉𝑄𝐷𝐿2 + 𝐶𝑂𝑉𝑄𝐿𝐿
2 )]}
(Eq. 6)
where λR = mean bias of the resistance
λDL = bias of the dead load
λLL = bias of the live load
COVR = coefficient of variation of the resistance
COVQDL = coefficient of variation of the dead load
COVQLL = coefficient of variation of the live load
𝛾𝐷𝐿 = load factor for dead load
𝛾𝐿𝐿 = load factor for live load
QDL= dead load
QLL = live load
= target reliability index
In the Monte Carlo simulation, resistance factors are obtained by trying different values
of resistance factors (Try) until the target probabilities of failure of 0.01 (corresponding to ≈
2.33) and 0.001 (corresponding to ≈ 3.00) were achieved. In this study, total simulation size
was chosen to be 1,000,000.
For both the FOSM method and Monte Carlo simulation, the values presented in Table 5
were used for bias statistics for dead and live loads following recommendation by AASHTO
(Nowak 1999).
Table 5. Summary Statistics for Biases of Loads used in This Study
Loads Dead-to-Live Load
Ratio Load Factors () Mean of Bias () COV of Bias
Live Load (LL) 2
LL = 1.75 LL = 1.15 COVLL = 0.2
Dead Load (DL) DL = 1.25 LL = 1.05 COVLL = 0.1

Research Project 5-6788-01 Page 15
Tables 6 and 7 present LRFD resistance factors obtained both from the FOSM method
and Monte Carlo simulations for target reliability indices of 2.33 and 3.00, respectively. Note
that the 95% confidence intervals presented in the table are based on the FOSM resistance
factors.
Table 6. Resistance Factors for Total Capacity of Driven Piles in Soils ( = 2.33)
Ultimate
Capacity
Criteria
Effective
Sample
Size
Mean of
Bias
COV of
Bias
(Monte Carlo)
(FOSM)
Lower
95% CI
Upper
95% CI
Davisson 26.8 1.224 0.532 0.44 0.41 0.30 0.53
5% 26.8 1.397 0.559 0.47 0.44 0.31 0.58
10% 26.8 1.600 0.620 0.47 0.44 0.30 0.59
Table 7. Resistance Factors for Total Capacity of Driven Piles in Soils ( = 3.00)
Ultimate
Capacity
Criteria
Effective
Sample
Size
Mean of
Bias
COV of
Bias
(Monte Carlo)
(FOSM)
Lower
95% CI
Upper
95% CI
Davisson 26.8 1.224 0.532 0.30 0.28 0.19 0.39
5% 26.8 1.397 0.559 0.32 0.30 0.20 0.42
10% 26.8 1.600 0.620 0.31 0.29 0.19 0.42
According to our analyses, resistance factors for of 2.33 obtained from the Monte Carlo
simulations are 0.44, 0.47, and 0.47 for Davisson, 5%, and 10% criteria respectively. Similarly,
resistance factors for of 3.00 are 0.30, 0.32, and 0.31 for Davisson, 5%, and 10% criteria
respectively. Although the mean bias is the greatest for 10% criterion, it does not necessarily
yield the greatest resistance factors because the COV is also the largest for 10% criterion.
3. Reliability Analyses and Develop Resistance Factor for Total Capacity of Drilled Shafts
in Soils
3.1 Determination of Ultimate Capacities Based on 5% and 10% Relative Settlement
Criteria
The dataset for the previous Research Project 0-6788 consisted of 41 drilled shafts.
Among the 41 drilled shafts, 29 of them were installed in soils and the remaining 11 were
installed in IGMs or rocks. In this Implementation Project 5-6788-01, reliability analyses were
done on the 29 load tests performed on drilled shafts installed in soil layers only. Among the 29
load tests in soils, 14 were conventional static top-down load tests, three were statnamic load
tests, and the remaining 12 tests were O-cell load tests. Three of the 14 conventional static load
tests were instrumented with strain gages, and separate measurements of shaft and base
capacities were made. The 12 O-cell tests also provided separate measurements of shaft and base
capacities.

Research Project 5-6788-01 Page 16
Among the 29 load tests in soils, 13, 9, and two were loaded beyond the Davisson’s
criterion, 5% relative settlement criterion, and 10% relative settlement criterion, respectively. For
the 27 load tests that did not reach a settlement of 10% of diameter at the pile head, the load-
settlement curves were extrapolated up to 10% pile diameter. In doing so, the research team used
the weighted hyperbolic fitting technique for top-down load tests and the t-z method for O-cell
tests.
Table 8 presents a summary of the ultimate capacities based on Davisson, 5%, and 10%
criteria of drilled shafts in soils (11 tests performed on drilled shafts installed in IGMs or rocks,
highlighted with grey color, were also included in Table 8 for the sake of completeness of the
dataset). Note that shaft and base capacities were also determined separately using 5% and 10%
relative settlement criteria for the instrumented tests. Ultimate capacity values in Columns 19,
22, and 25 represent measured capacities based on corresponding ultimate capacity criteria if
those criteria were met. Otherwise, these values were obtained from extrapolations.

Research Project 5-6788-01 Page 17
Table 8. Summary Table for Drilled Shafts
Notes: a) The ultimate capacity values in these columns represent measured capacities based on corresponding ultimate capacity criteria if those criteria were met. Otherwise, these values were obtained from extrapolation using weighted hyperbolic method.
b) B = diameter of drilled shaft; Lp = embedment depth; Qult = ultimate pile capacity
Soil Conditions
Case No.
[1]
ProjectID
[2]
LoadTestID
[3]
City
[4]
County
[5]
State
[6]
Year
[7]
B (in)
[8]
Lp (ft)
[9]
General Stratigraphy
[10]
Fine
Grained
[11]
Coarse
Grained
[12]
IGM/Rock
[13]
Davisson
[16]
5%
[17]
10%
[18]
Total
[19]
Shaft
[20]
Base
[21]
Total
[22]
Shaft
[23]
Base
[24]
Total
[25]
Shaft
[26]
Base
[27]
Total
[28]
Shaft
[29]
Base
[30]
Predictive
[31]
Measured
[32]
Composite
[33]
34 AFT109054 Site 1A Load Test Grapevine Tarrant TX 2009 36 50.0 CH/CH/R/R 9% 0% 91% IGM/Rock Statnamic 3300 5439 4562 877 4.2 3 7.2
35 AFT109054 Site 1B Load Test Grapevine Tarrant TX 2009 36 25.0 CH/CH/R/R 100% 0% 0% IGM/Rock Statnamic x x 638 918 396 522 4.2 5 9.2
36 AFT109054 Site 3A Load Test Grapevine Tarrant TX 2009 36 25.0 CH/CH/R/R/R 100% 0% 0% Fine Statnamic x x 1788 937 658 279 4.2 4.8 9
37 AFT109054 Site 3B Load Test Grapevine Tarrant TX 2009 36 40.0 CH/CH/R/R/R 32% 0% 68% IGM/Rock Statnamic 3492 2616 877 4.2 2 6.2
38 AFT107001NC Bent 4 Pier 2 Load Test Sinton San Patricio TX 2007 48 51.0 SM/CL/SM/CH 25% 75% 0% Coarse Statnamic 2142 2174 2225 2454 1863 591 3.8 2.6 6.4
39 AFT107001NC Bent 3 Pier 1 Load Test Sinton San Patricio TX 2007 48 51.0 SM/CL/SM/CH 25% 75% 0% Coarse Statnamic 2051 2104 2188 2454 1863 591 3.8 2.6 6.4
40 AFT107001NC Bent 3 Pier 2 Load Test Sinton San Patricio TX 2007 48 51.0 SM/CL/SM/CH 25% 75% 0% Coarse Statnamic 5538 5677 6323 2454 1863 591 3.8 2.6 6.4
41 3-5-72-176 MTS-1 Montopolis Travis County TX 1974 30 23.0 CL/CL/CL/I 18% 0% 82% Fine Static Top Down x 914 1001 1078 1906 1357 550 4.6 5 9.6
42 3-5-72-176 MTS-2 Montopolis Travis County TX 1974 30 24.0 CL/CL/CL/I 17% 0% 83% Fine Static Top Down x 1052 1108 1156 2030 1480 550 4.6 5 9.6
43 3-5-72-176 MTS-3 Montopolis Travis County TX 1974 30 24.0 CL/CL/CL/I 24% 0% 76% Fine Static Top Down x x 977 1138 1279 2077 1528 550 4.6 5 9.6
44 271-14-60 Load Test No. 1 Houston Harris TX 1967 36 60.0 CL/SM/CL/CL 95% 5% 0% Fine Static Top Down 1690 1708 1763 1663 1475 188 3.2 3.8 7
45 74-2 Test No. 1 Hailey Hollow Live Oak TX 1969 24 20.0 CL/SC 100% 0% 0% Coarse Static Top Down x x x 549 837 1130 454 372 81 2.4 4.6 7
46 2374-6 Test No. 2 Dallas Dallas TX 1975 36 20.0 CL/SM/I 82% 18% 0% IGM/Rock Static Top Down x x 840 664 346 317 2.8 5 7.8
47 177-11-7 Test No. 3 Houston Harris TX 1953 18 26.4 CL/CH/CL/CH/CL 100% 0% 0% Fine Static Top Down 121 124 125 180 151 29 4.0 4.4 8.4
48 177-11-7 Load Test No. 4 Houston Harris TX 1953 18 23.0 CL/CH/CL/CH/CL 100% 0% 0% Fine Static Top Down 110 121 124 124 114 9 4.0 4.4 8.4
49 89-8 Load Test Shaft 1 Test 3 Houston Harris TX 1970 30 23.0 CH/CL/CH 100% 0% 0% Fine Static Top Down x 260 150 110 273 151 124 278 151 130 245 216 29 5.0 5 10
50 89-8 Load Test Shaft 3 Test 3 Houston Harris TX 1970 30 23.0 CH/CL/CH 100% 0% 0% Fine Static Top Down x x x 188 104 84 197 107 90 199 105 93 245 216 29 5.0 5 10
51 89-8 Load Test Shaft 4 Test 1 Houston Harris TX 1970 30 45.0 CH/CL/CH 100% 0% 0% Fine Static Top Down x x 607 376 224 628 362 262 648 418 307 501 456 44 5.0 5 10
52 SS25-1 Test Shaft No. G1 Houston Harris TX 1973 30 59.0 CL/SM 24% 76% 0% Coarse Static Top Down 982 998 1017 1025 923 102 4.2 3.8 8
53 SS25-1 Test Shaft No. G2 Houston Harris TX 1973 30 77.0 CL/SM/CL 55% 45% 0% Coarse Static Top Down x 1361 1380 1402 801 772 30 3.6 4.4 8
54 SS25-1 Test Shaft No. BB Houston Harris TX 1973 30 45.0 CL/SM 23% 77% 0% Coarse Static Top Down x x 1201 1355 1597 1574 1298 276 3.8 5 8.8
55 TxDOT-UT-ADSC Test Shaft No. 1 Austin Travis TX 2012 30 80.3 I/I 0% 0% 100% IGM/Rock O-Cell 2408 2066 343 5677 5068 609 4.4 3.4 7.8
56 TxDOT-UT-ADSC Test Shaft No. 2 Austin Travis TX 2012 30 79.3 I/I 0% 0% 100% IGM/Rock O-Cell 2282 1912 370 5538 4930 609 4.4 4.4 8.8
57 TxDOT-Dallas LT-1258 O-Cell Load Test Dallas Dallas TX 2013 36 60.8 SC/SP/GP/I 0% 3% 97% IGM/Rock O-Cell 1316 746 569 6745 5866 879 4.6 5 9.6
58 UAR-ADSC-Turrell LT-1138-5-2 Turrell Crittenden AR 2013 72 65.5 CH/ML/SP 26% 74% 0% Coarse O-Cell 2724 1651 1073 3148 1694 1454 4062 1737 2405 1988 1520 468 5.0 3.5 8.5
59 UAR-ADSC-Turrell LT-1138-4-1 Turrell Crittenden AR 2013 48 86.2 CH/ML/SP 17% 83% 0% Coarse O-Cell 2458 2324 135 2560 2413 148 2726 2555 171 1641 1523 118 5.0 3.6 8.6
60 UAR-ADSC-Turrell LT-1138-6-3 Turrell Crittenden AR 2013 48 87.0 CH/ML/SP 17% 83% 0% Coarse O-Cell 2701 2064 637 2918 2177 741 3417 2406 1011 1695 1543 153 5.0 3.4 8.4
61 UAR-ADSC-SiloamSpring LT-1138-2 Siloam Springs Benton AR 2013 72 21.4 SC/R 0% 23% 77% IGM/Rock O-Cell 4724 1646 3078 5138 1632 3506 5.0 1.9 6.9
62 UAR-ADSC-SiloamSpring LT-1138-1 Siloam Springs Benton AR 2013 48 25.2 SC/R 0% 13% 87% IGM/Rock O-Cell 5650 3060 2590 3577 2019 1558 5.0 1.7 6.7
63 024-03-0010 LT-8467 Ragley-1 Ragley Beauregard LA 1999 66 62.2 SM/CL/CH/CL/SM 94% 6% 0% Fine O-Cell 1108 437 672 1123 441 682 1141 447 694 1696 1432 263 3.6 3.2 6.8
64 024-03-0010 LT-8944 Ragley-2 Ragley Beauregard LA 1999 66 40.6 CL/CH/CL/SM 100% 0% 0% Fine O-Cell 1151 833 318 1218 836 382 1321 838 483 946 805 141 3.4 4.5 7.9
65 103-249-160 LT-9943 Highland Park Baton Rouge Baton Rouge LA 2008 72 81.9 CL/CH/CL/CH/CL/CL 100% 0% 0% Fine O-Cell 1889 1569 320 1936 1575 361 2004 1583 422 2115 1839 276 3.2 4.3 7.5
66 103-249-160 LT-9459 Essen Ln Baton Rouge Baton Rouge LA 2008 48 99.0 CL/CH/CL/CH/CL 100% 0% 0% Fine O-Cell 2511 2329 182 2594 2380 214 2792 2473 319 1806 1663 142 4.0 4.2 8.2
67 455-09-0006 LT-9934-2 Unknown Pond Caddo Shreveport LA 2011 48 39.5 CH/SM/CL/SM/CL 100% 0% 0% Fine O-Cell 844 484 360 859 494 366 874 503 371 846 195 652 3.8 3.4 7.2
68 455-09-0006 US71 LT9934-1 Caddo Shreveport LA 2011 66 47.0 CL/ML/SM/CH 28% 71% 0% Coarse O-Cell 1563 909 654 1580 919 660 1596 929 667 1380 1099 281 4.2 3 7.2
69 LT-8249 Bentonite Slurry Ohkay Owingeh Rio Arriba NM 1995 31 47.0 GW-GM/SM/SW-SM/SP-SM 0% 100% 0% Coarse O-Cell 1459 429 1029 1537 487 1050 1683 598 1085 2278 2031 247 3.8 2.8 6.6
70 LT-8249 Polymer Slurry Test No. 2 Ohkay Owingeh Rio Arriba NM 1995 31 47.0 GW-GM/SM/SW-SM/SP-SM 0% 100% 0% Coarse O-Cell 1748 529 1219 1808 584 1224 2000 763 1237 2296 2049 247 3.8 2.8 6.6
71 LT-9190 Sunland Park Test Shaft No. 1 Sunland Park Dona Ana NM 2006 48 74.5 SM/SM/SP/SM/SP 0% 100% 0% Coarse O-Cell 1855 1307 548 2118 1405 714 2916 1568 1348 2309 1965 344 3.8 2.2 6
72 FHWA-HPR-NM-90-03 FHWA-HPR-NM-90-03 Albequerque Bernalillo NM 1993 32 54.9 SP/SM/GW-GM/ML/SM 12% 87% 0% Coarse Static Top Down x x 1483 1637 2248 1247 1135 112 4.2 5 9.2
73 405-681-6737 LT-1025-1 Hollis Harmon OK 2013 72 80.1 SM/CL/CH/VOID/CH/R/VOID/R/R/R 61% 4% 35% IGM/Rock O-Cell 2415 1507 908 8306 7575 731 2.8 2.6 5.4
74 405-681-6737 LT 1025-2 Hollis Harmon OK 2013 72 101.3 SM/CL/CH/VOID/CH/R/VOID/R/R/R 48% 3% 49% IGM/Rock O-Cell 2794 2229 565 10340 9609 731 2.8 2.8 5.6
Data Quality ScoreProject Identification and Location DataDrilled Shaft
DimensionsSource of Shaft Resistance
Soil Below
Base
[14]
Predicted Capacity Using
TCP RAW Blow Counts (kips)Test Type
[15]
Ultimate Capacity CriteriaQult from 5% Criteriona)
(kips)
Qult from 10% Criteriona)
(kips)
Qult from Davisson's
Criteriona)

Research Project 5-6788-01 Page 18
3.2 Determination of Statistical Distribution of Bias of the Resistance and Development of
Resistance Factors
The measured (or extrapolated) ultimate capacities for each ultimate capacity criteria
were compared with the predicted capacities obtained using TCP raw blow counts (TCP Raw)
without hammer energy correction. Biases (i= measured resistance/predicted resistance) for
each test were then computed for each ultimate capacity criterion. In order to compute the mean
and coefficient of variation (COV) of the biases, a weighting factor that ranged from 0 to 1 was
used to consider the uncertainties associated with the data quality, as done in the previous
Research Project 0-6788. The same procedures described in Section 2.2 of this report were used
to obtain the weighted mean and COV of the biases.
The weighted UMVUE summary statistics for the 29 load tests on drilled shafts in soils
are given in Table 9. As expected, the mean biases for 5% and 10% criteria are greater than that
for Davisson’s criterion. It was observed that the COVs for 5% and 10% criteria were also
greater than that for Davisson’s criterion.
Table 9. Summary Statistics for Biases of Resistances for Drilled Shafts in Soils
Ultimate Capacity
Criteria
Total number of load
tests considered
(Total sample size)
Effective sample
size
Mean of Bias COV of Bias
Davisson 29 26.4 1.027 0.393
5% 29 26.4 1.100 0.399
10% 29 26.4 1.219 0.443
As was done for the driven piles, resistance factors for drilled shafts in soils were
obtained following the FOSM method and the Monte Carlo simulation using the bias statistics
presented in Table 9. Tables 10 and 11 present LRFD resistance factors for total capacity of
drilled shafts in soils obtained both from the FOSM method and Monte Carlo simulations for
target reliability indices of 2.33 and 3.00, respectively. Note that the 95% confidence intervals
presented in the table are based on the FOSM resistance factors.
Table 10. Resistance Factors for Total Capacity of Drilled Shafts in Soils ( = 2.33)
Ultimate
Capacity
Criteria
Effective
Sample
Size
Mean of
Bias
COV of
Bias
(Monte Carlo)
(FOSM)
Lower
95% CI
Upper
95% CI
Davisson 26.4 1.027 0.393 0.51 0.46 0.36 0.57
5% 26.4 1.100 0.399 0.54 0.49 0.39 0.59
10% 26.4 1.219 0.443 0.54 0.49 0.39 0.60

Research Project 5-6788-01 Page 19
Table 11. Resistance Factors for Total Capacity of Drilled Shafts in Soils ( = 3.00)
Ultimate
Capacity
Criteria
Effective
Sample
Size
Mean of
Bias
COV of
Bias
(Monte Carlo)
(FOSM)
Lower
95% CI
Upper
95% CI
Davisson 26.4 1.027 0.393 0.38 0.34 0.26 0.44
5% 26.4 1.100 0.399 0.40 0.36 0.28 0.45
10% 26.4 1.219 0.443 0.39 0.36 0.27 0.45
According to our analyses, resistance factors for total capacity of drilled shafts installed
in soils with of 2.33 obtained from Monte Carlo simulations are 0.51, 0.54, and 0.54 for
Davisson, 5%, and 10% criteria respectively. Similarly, resistance factors with of 3.00 are 0.38,
0.40, and 0.39 for Davisson, 5%, and 10% criteria respectively. Although the mean bias is the
greatest for 10% criterion, it does not necessarily yield the greatest resistance factors because the
COV is also the largest for 10% criterion.
In addition to the resistance factors for total capacity of drilled shafts in soils, resistance
factors for shaft and base capacities were also obtained using results from the 15 instrumented
load tests. Tables 12 and 13 present LRFD resistance factors for shaft capacity of drilled shafts in
soils obtained both from the FOSM method and Monte Carlo simulations for target reliability
indices of 2.33 and 3.00, respectively.
Table 12. Resistance Factors for Shaft Capacity of Drilled Shafts in Soils ( = 2.33)
Ultimate
Capacity
Criteria
Total number of
load tests
considered
(Total sample
size)
Effective
Sample
Size
Mean
of Bias
COV
of Bias
(Monte
Carlo)
(FOSM)
Lower
95%
CI
Upper
95%
CI
Davisson 15 13.6 0.968 0.717 0.23 0.22 0.11 0.37
5% 15 13.6 0.986 0.696 0.25 0.23 0.13 0.38
10% 15 13.6 1.029 0.66 0.28 0.26 0.15 0.4
Table 13. Resistance Factors for Shaft Capacity of Drilled Shafts in Soils ( = 3.00)
Ultimate
Capacity
Criteria
Total number of
load tests
considered
(Total sample
size)
Effective
Sample
Size
Mean
of Bias
COV
of Bias
(Monte
Carlo)
(FOSM)
Lower
95%
CI
Upper
95%
CI
Davisson 15 13.6 0.968 0.717 0.14 0.14 0.06 0.25
5% 15 13.6 0.986 0.696 0.15 0.15 0.07 0.26
10% 15 13.6 1.029 0.66 0.18 0.17 0.09 0.28

Research Project 5-6788-01 Page 20
Tables 14 and 15 present resistance factors for base capacity of drilled shafts in soils
obtained both from FOSM method and Monte Carlo simulations for target reliability indices of
2.33 and 3.00, respectively.
Table 14. Resistance Factors for Base Capacity of Drilled Shafts in Soils ( = 2.33)
Ultimate
Capacity
Criteria
Total number of
load tests
considered
(Total sample
size)
Effective
Sample
Size
Mean
of Bias
COV
of Bias
(Monte
Carlo)
(FOSM)
Lower
95%
CI
Upper
95%
CI
Davisson 15 13.6 2.760 0.674 0.72 0.67 0.34 1.17
5% 15 13.6 3.099 0.681 0.79 0.75 0.36 1.37
10% 15 13.6 3.747 0.709 0.90 0.85 0.37 1.68
Table 15. Resistance Factors for Base Capacity of Drilled Shafts in Soils ( = 3.00)
Ultimate
Capacity
Criteria
Total number of
load tests
considered
(Total sample
size)
Effective
Sample
Size
Mean
of Bias
COV
of Bias
(Monte
Carlo)
(FOSM)
Lower
95%
CI
Upper
95%
CI
Davisson 15 13.6 2.760 0.674 0.45 0.44 0.20 0.82
5% 15 13.6 3.099 0.681 0.50 0.48 0.20 0.98
10% 15 13.6 3.747 0.709 0.56 0.54 0.20 1.20
4. Summary, Conclusions and Recommendations
This research study has developed resistance factors for total capacity of driven piles and drilled
shafts in soils using 5% and 10% relative settlement criteria as ultimate capacity criteria. Among
the final dataset of 70 load tests, 59 tests (30 for driven piles and 29 for drilled shafts) performed
in soil layers only were considered in this study. With consideration to data quality, the effective
sample sizes are 26.8 and 26.4 for driven piles and drilled shafts in soils, respectively. For drilled
shafts, in addition to the resistance factors for total capacity, resistance factors for shaft and base
capacities were also obtained using results from the 15 instrumented load tests.
4.1 Resistance Factors for Driven Piles in Soils
Resistance factors for total capacity of driven piles in soils predicted with raw TCP blowcounts
are presented in Table 16 with target reliability index β of 2.33 and 3.0. The effective sample size
used in the analysis for driven piles in soils was 26.8.

Research Project 5-6788-01 Page 21
Table 16. Resistance Factors Obtained from Monte Carlo Simulations for Total Capacity of
Driven Piles in Soils
Ultimate
Capacity
Criteria
Effective
Sample Size
Mean of
Bias
COV of
Bias
Resistance factor
( = 2.33)
Resistance factor
( = 3.00)
Davisson 26.8 1.224 0.532 0.44 0.30
5% 26.8 1.397 0.559 0.47 0.32
10% 26.8 1.600 0.620 0.47 0.31
Based on the size and scope of the dataset, literature review, and statistical analyses, the
following conclusions and recommendations are supported by this research:
Although the mean bias is the greatest for 10% criterion, it does not necessarily yield the
greatest resistance factors because the COV is also the largest for 10% criterion.
Considering wide spread use of Davisson criterion for driven piles in United States and
small increase in values when other criteria were used, resistance factors from Davisson
capacity are recommended for driven piles in soils.
The resistance factors of 0.44 and 0.30 (with target reliability index of 2.33 and 3.0,
respectively) for total capacity of driven piles in soils using raw TCP blowcounts are
suitable for implementation for small projects.
For large projects, we recommend consideration of determining ultimate capacity from
static or dynamic load tests in accordance with AASHTO policy (AASHTO 2012) which
will yield higher resistance factors.
4.2 Resistance Factors for Total Capacity of Drilled Shafts in Soils
Resistance factors for total capacity of drilled shafts in soils predicted with raw TCP blowcounts
are presented in Table 17 with target reliability index β of 2.33 and 3.0. The effective sample size
used in the analysis for driven piles in soils was 26.4.
Table 17. Resistance Factors Obtained from Monte Carlo Simulations for Total Capacity of
Drilled Shafts in Soils
Ultimate
Capacity
Criteria
Effective
Sample
Size
Mean of
Bias COV of Bias
Resistance factor
( = 2.33)
Resistance factor
( = 3.00)
Davisson 26.4 1.027 0.393 0.51 0.38
5% 26.4 1.100 0.399 0.54 0.40
10% 26.4 1.219 0.443 0.54 0.39
Based on the size and scope of the dataset, literature review, and statistical analyses, the
following conclusions and recommendations are supported by this research:
Although the mean bias is the greatest for 10% criterion, it does not necessarily yield the
greatest resistance factors because the COV is also the largest for 10% criterion.

Research Project 5-6788-01 Page 22
Considering that FHWA suggests 5% criterion for drilled shafts (O’Neil and Reese 1999)
and 5% yields the largest value among the three criteria considered in this study,
resistance factors from 5% criterion are recommended for drilled shafts in soils.
The resistance factors of 0.54 and 0.40 (with target reliability index of 2.33 and 3.0,
respectively) for total capacity of drilled shafts in soils using raw TCP blowcounts are
suitable for implementation.
For large projects, we recommend consideration of determining ultimate capacity from
static load tests in accordance with AASHTO policy (AASHTO 2012) which will yield
higher resistance factors.
4.3 Resistance Factors for Shaft and Base Capacities of Drilled Shafts in Soils
Resistance factors for shaft and base capacities of drilled shafts in soils predicted with
raw TCP blowcounts are presented in Tables 18 and 19, respectively, with target reliability index
β of 2.33 and 3.0. The effective sample size used in the analysis for driven piles in soils was 13.6.
Table 18. Resistance Factors Obtained from Monte Carlo Simulations for Shaft Capacity of
Drilled Shafts in Soils
Ultimate
Capacity
Criteria
Effective
Sample
Size
Mean of
Bias COV of Bias
Resistance factor
( = 2.33)
Resistance factor
( = 3.00)
Davisson 13.6 0.968 0.717 0.23 0.14
5% 13.6 0.986 0.696 0.25 0.15
10% 13.6 1.029 0.660 0.28 0.18
Table 19. Resistance Factors Obtained from Monte Carlo Simulations for Base Capacity of
Drilled Shafts in Soils
Ultimate
Capacity
Criteria
Effective
Sample
Size
Mean of
Bias COV of Bias
Resistance factor
( = 2.33)
Resistance factor
( = 3.00)
Davisson 13.6 2.760 0.674 0.72 0.45
5% 13.6 3.099 0.681 0.79 0.50
10% 13.6 3.747 0.709 0.90 0.56
Based on the size and scope of the dataset, literature review, and statistical analyses, the
following conclusions and recommendations are supported by this research:
Resistance factors differentiated for shaft and base capacity and based on raw TCP
blowcounts for drilled shafts in soils are variable:
o Shaft: 0.25 and 0.15 (with target reliability index of 2.33 and 3.0, respectively)
o Base: 0.79 and 0.50 (with target reliability index of 2.33 and 3.0, respectively)
For small projects where differentiation between base and shaft resistances is not critical,
the resistance factors for shaft and base resistance are suitable for implementation.
Research Project 5-6788-01 Page 23
For large projects where it is critical that base and shaft resistance be differentiated, we
recommend consideration of determining ultimate capacity from static load tests in
accordance with AASHTO policy (AASHTO 2012) which will yield higher resistance
factors.

Research Project 5-6788-01 Page 24
REFERENCES
AASHTO (2012). AASHTO LRFD Bridge Design Specifications, Customary U.S. Units, 6th
Edition. American Association of State Highway and Transportation Officials
AbdelSalam, S. S., Ng, K. W., Sritharan, S., Suleiman, M. T., and Roling, M. (2012).
Development of LRFD Procedures for Bridge Pile Foundations in Iowa - Volume III:
Recommended Resistance Factors with Consideration of Construction Control and Setup, Report
No. IHRB Projects TR-584, Institute for Transportation, Iowa State University
AbdelSalam, S. S., Sritharan, S., Suleiman, M. T. (2010). “Current Design and Construction
Practices of Bridge Pile Foundations with Emphasis on Implementation of LRFD.” Journal of
Bridge Engineering, 15(6), pp. 749-758
Abu-Farsakh, M. Y., Yoon, S., and Tsai, C. (2009). Calibration of Resistance Factors Needed in
the LRFD Design of Driven Piles, Report No. FHWA/LA.09/449, Louisiana Transportation
Research Center
Abu-Farsakh, M. Y., Yu, Xinbao, Yoon, S., and Tsai, C. (2010). Calibration of Resistance
Factors Needed in the LRFD Design of Drilled Shafts, Report No. FHWA/LA.10/470, Louisiana
Transportation Research Center
ADOT (2011). Bridge Design Guidelines, Arizona Department of Transportation
AHTD (2014). Standard Specification for Highway Construction. Arkansas State Highway and
Transportation Department
ALDOT (2015). Structural Design Manual. Alabama Department of Transportation Bridge
Bureau
Allen, T. M. (2005). Development of the WSDOT Pile Driving Formula and Its Calibration for
Load and Resistance Factor Design (LRFD). Final Report Prepared for Washington State
Department of Transportation. Report No. WA-RD 610.1
Ashour, M., Helal, A., and Ardalan, H. (2012). Upgrade of Axially Loaded Pile-Soil Modeling
with the Implementation of LRFD Design Procedure. Research Report submitted to State of
Alabama Department of Transportation (ALDOT), Contract No. 930-769
Caltrans DRISI (2014). “Calibrating LRFD Geotechnical Axial (Tension and Compression)
Resistance Factors () for Driven Piles and Drilled Shafts.” Research Notes, Caltrans Division of
Research, Innovation and System Information
CDOT (2011). CDOT Strategic Plan for Data Collection and Evaluation of Grade 50 H-Piles
Into Bedrock. Report No. CDOT-2011-11, Colorado Department of Transportation
Chin, F. V. (1970). “Estimation of Ultimate Load of Piles Not Carried to Failure.” Proceedings
of 2nd Southeast Asian Conference on Soil Engineering, pp.81-90
Coffman, R. A. (2015). LRFD Calibration for Drilled Shaft Foundations. Ongoing research
project sponsored by the Arkansas State Highway and Transportation Department, the Deep
Research Project 5-6788-01 Page 25
Foundations Institute, McKinney Drilling, Aldridge Drilling, and the University of Arkansas
(Retrieved from http://trc1204-lrfd-drilled-shafts.uark.edu/ on June 23, 2015)
ConnDOT (2005). Geotechnical Engineering Manual. Connecticut Department of
Transportation
DelDOT (2005). Bridge Design Manual. The State of Delaware Department of Transportation.
Densmore, D. H. (2000, May 30). Load and Resistance Factor Design (LRFD) Memo. Retrieved
March 19, 2012, from http://www.fhwa.dot.gov/bridge/062800.htm
FDOT (2015). Structures Design Guidelines. Florida Department of Transportation
Foster, J. H. and Huft, D. L. (2008). Review and Refinement of SDDOT’s LRFD Deep
Foundation Design Method. Final Report Prepared for South Dakota Department of
Transportation. Report No. SD2008-08-P
GDOT (2015). Bridges and Structures Design Manual. Georgia Department of Transportation
HDOT (2005). Standard Specifications. State of Hawaii Department of Transportation
IDOT (2012). Bridge Manual. Illinois Department of Transportation
ITD (2015). LRFD Bridge Design Manual. The Idaho Transportation Department
Kuo, C. L., McVay, M., and Birgisson, B. (2002). “Calibration of load and resistance factor
design.” Transportation Research Record 1808, Transportation Research Board, Washington,
DC, 108–111.
KYTC (2014). Structural Design. Kentucky Transportation Cabinet
Loehr, J. E., Bowders, J.J., , Ge, L., Likos, W. J., Luna, R., Maerz, N., Rosenblad, B. L., and
Stephenson, R. W. (2011). Engineering Policy Guidelines for Design of Drilled Shafts. Final
Report Prepared for Missouri Department of Transportation, Project TRyy0922, Report No.:
cmr12003
Luna, R. (2014). Evaluation of Pile Load Tests for Use in Missouri LRFD Guidelines. Final
Report Prepared for Missouri Department of Transportation, Project TRyy1226, Report No.:
cmr14-015
MaineDOT (2014). Bridge Design Guide. The Maine Department of Transportation
MassDOT (2013). LRFD Bridge Manual – Part I. Massachusetts Department of Transportation
MDOT (2010). Bridge Design Manual. Mississippi Department of Transportation
MDT (2008). Geotechnical Manual. Montana Department of Transportation
MIDOT (2012). Bridge Design Manual. Michigan Department of Transportation
NDDOT (2013). Design Manual. North Dakota Department of Transportation

Research Project 5-6788-01 Page 26
NevadaDOT (2008). Structures Manual. Nevada Department of Transportation
Ng, T-T. and Fazia, S. (2012). Development and Validation of a Unified Equation for Drilled
Shaft Foundation Design in New Mexico. Final Report Prepared for New Mexico Department of
Transportation, Report No. NM10MSC-01
NHDOT (2010). Standard Specifications for Road and Bridge Construction. State of New
Hampshire Department of Transportation.
NJDOT (2009). Design Manual for Bridges and Structures. New Jersey Department of
Transportation
Nowak, A. (1999). “NCHRP Report 368: Calibration of LRFD Bridge Design Code”. TRB,
Washington, DC.
Nowak, A. S., Kozikowski, M., Larsen, J., Lutomirski, T., and Paczkowski, P. (2007).
Implementation of the AASHTO LRFD Code in Geotechnical Design-Piles. Final Report
Prepared for Nebraska Department of Roads, Report No. SPR-1(07) P595
NYSDOT (2014). LRFD Bridge Design Specifications. New York State Department of
Transportation
ODOT (2015). Bridge Design and Drafting Manual. Oregon Department of Transportation
OHDOT (2013). Bridge Design Manual. State of Ohio Department of Transportation
OHDOT (2013). Construction and Material Specifications. State of Ohio Department of
Transportation
OKDOT (2009). Standard and Specifications Book. Oklahoma Department of Transportation
Paikowsky, S. G., Canniff, M., Robertson, S., and Budge, A. S. (2014). Load and Resistance
Factor Design (LRFD) Pile Driving Project – Phase II Study. Minnesota State University
PennDOT (2015). Design Manual, Part 4. Pennsylvania Department of Transportation
Rahman, M. S., Gabr, M. A., Sarica, R. Z., and Hossain, M. S. (2002). Load and Resistance
Factor Design (LRFD) for Analysis/Design of Piles Axial Capacity. Final Report Prepared for
North Carolina Department of Transportation, Report No. FHWA/NC/2005-08
O’Niel, M. W. and Reese, L. C. (1999). Drilled Shafts: Construction Procedures and Design
Methods. Report No. FHWA-IF-99-025, Federal Highway Administration
RIDOT (2007). LRFD Bridge Design Manual. Rhode Island Department of Transportation
Salgado, R., Woo, S. I., and Kim, D. (2011). Development of Load and Resistance Factor
Design for Ultimate and Serviceability Limit States of Transportation Structure Foundations.
Publication FHWA/IN/JTRP-2011/03, Joint Transportation Research Program, Indiana
Department of Transportation and Purdue University
SCDOT (2010). Geotechnical Design Manual. South Carolina Department of Transportation

Research Project 5-6788-01 Page 27
SDDOT (2014). Structures Construction Manual. South Dakota Department of Transportation
SDDOT (2015). Standard Specifications for Roads and Bridges. South Dakota Department of
Transportation
Smith, T. D., Banas, A., Gummer, M., and Jin, J. (2011). Recalibration of the GRLWEAP LRFD
Resistance Factor for Oregon DOT. Final Report Prepared for Oregon Department of
Transportation, Report No. FHWA-OR-RD-11-08
UDOT (2011). Geotechnical Manual of Instruction. Utah Department of Transportation
UDOT (2015). Structures Design and Detailing Manual. Utah Department of Transportation
VDOT (2010). Geotechnical Manual for Structures. Virginia Department of Transportation
VTrans (2010). VTrans Structures Design Manual. Vermont Agency of Transportation
WisDOT (2015). Bridge Design Manual. State of Wisconsin Department of Transportation
WSDOT (2015). Geotechnical Design Manual. Washington State Department of Transportation
WVDOH (2014). Bridge Design Manual. West Virginia Division of Highways
WYDOT (2013). Bridge Design Manual. Wyoming Department of Transportation
Yang, X., Han, J., Parson, R. L. (2010). Development of Recommended Resistance Factors for
Drilled Shafts in Weak Rocks Based on O-Cell Tests. Report No. K-Tran:KU-07-4, A
Cooperative Transportation Research Program between Kansas Department of Transportation
and The University of Kansas