import competition from and outsourcing to china: a curse or blessing for firms?
TRANSCRIPT

ISSN 2042-2695
CEP Discussion Paper No 1038
December 2010
Import Competition from and Outsourcing to China: A Curse or Blessing for Firms?
Giordano Mion and Linke Zhu

Abstract We use Belgian manufacturing firm-level data over the period 1996- 2007 to analyze the impact of imports from different origins on firm growth, exit, and skill upgrading. For this purpose we use both industry-level and firm-level imports by country of origin and distinguish between firm-level outsourcing of final versus intermediate goods. Results indicate that China is different from both other low-wage and OECD countries. Industry-level import competition and firm-level outsourcing to China reduce firm employment growth and induce skill upgrading. In contrast, industry-level imports have no effect on Belgian firm survival, while firm-level outsourcing of finished goods to China even increased firm's probability of survival. In terms of skill upgrading, the effect of Chinese imports is large. Import competition from China accounts for 42% (20%) of the within firm increase in the share of skilled workers (non-production workers) in Belgian manufacturing over the peri od of our analysis, but these effects, as well as the employment reducing effect, remain mainly in low-tech industries. Firm-level outsourcing to China further accounts for a small but significant increase in the share of non-production workers. This change in employment structure is in line with predictions of recent model of trade-induced technological change and offshoring. Keywords: import competition, outsourcing, China, skill upgrading, technological change JEL Classifications: F14, F16, L25 This paper was produced as part of the Centre’s Globalisation Programme. The Centre for Economic Performance is financed by the Economic and Social Research Council. Acknowledgements We thank Andrew Bernard, Italo Colantone, Emmanuel Dhyne, Maarten Goos, Kaza Miyagiwa, Stijn Vanormelingen, Ilke Van Beveren, and Gerald Willman, as well as seminar participants at ETSG 2010, LICOS, the University of Glasgow, the University of Swansea, and the Université Catholique de Louvain for helpful comments and suggestions. The views expressed in this paper are our own and do not necessarily reflect those of the National Bank of Belgium. All remaining errors are ours. Giordano Mion is an Associate of the Globalisation Programme at the Centre for Economic Performance, London School of Economics. He is also a Lecturer in Economic Geography in the Department of Geography, LSE and an affiliate of the Centre for Economic Policy Research (CEPR). Linke Zhu is with the Centre for Institutions & Economic Performance (LICOS) at the Catholic Université of Leuven. Published by Centre for Economic Performance London School of Economics and Political Science Houghton Street London WC2A 2AE All rights reserved. No part of this publication may be reproduced, stored in a retrieval system or transmitted in any form or by any means without the prior permission in writing of the publisher nor be issued to the public or circulated in any form other than that in which it is published. Requests for permission to reproduce any article or part of the Working Paper should be sent to the editor at the above address. © G. Mion and L. Zhu, submitted 2010

1 Introduction
For many developed countries the past decades has been characterized by large and rising
imports from China, a loss in manufacturing employment, firm exit and offshoring of especially
low skilled jobs to low wage countries. This has triggered a substantial amount of research
both from trade economists and labor economists in search of a causal relationship between
the imports from low wage countries and labor market outcomes in (especially) developed
countries. The purpose of this paper is to contribute to this literature by using firm-level
panel data for Belgium that are highly disaggregate and which includes information on firm-
level imports by source country. The use of this data offers several distinct innovations
compared to the previous literature. First, by using firm-level data we can control for firm
heterogeneity and analyze within industry re-allocation effects which was not possible in
studies using industry-level data. Second, by having access to imports at the firm-level,
we can usefully distinguish between an industry-wide import competition effect and a firm-
specific effect for those firms importing goods directly from low wage countries (outsourcing).
Third, it allows us to distinguish two different types of firm-level outsourcing: outsourcing of
intermediate and finished goods.
Our empirical strategy in part follows Bernard, Jensen and Schott (2006) – henceforth BJS
(2006) – and Biscourp and Kramarz (2007). BJS (2006) study the effects of industry-level
import competition from low wage countries on US manufacturing firms’ employment growth
and survival. We perform a similar analysis while introducing within firm skill upgrading
as a new margin of adjustment to foreign competition and focusing on China. Our results
confirm the (modest) negative impact of low-wage countries’ import competition on firms’
employment growth and survival while further qualifying China as special with respect to
number of dimensions. Above all, our findings indicate that import competition from China,
but not from other low-wage countries, is responsible for a large fraction of the observed
skill upgrading in Belgian manufacturing. Indeed, Rodrik (2006) and Schott (2008) already
pointed out that Chinese exports have different characteristics with respect to other low-wage
countries, i.e., they are more sophisticated and show more overlap with products of OECD
countries.
2

Concerning our analysis of firm-level outsourcing, previous industry level studies1 did not
allow researchers to: (i) control for firm heterogeneity; (ii) distinguish within firm adjustment
from between firm adjustment; (iii) take into account the different effect of international
sourcing depending on the final vs intermediate nature of the imported goods. One notable
exception is Biscourp and Kramarz (2007). Similar to them we use firm-level imports and
distinguish between outsourcing of intermediate goods and of final goods by countries of origin.
Different to their study, we address the endogeneity problem inherent in the use of firm-level
imports by adopting an IV strategy and exploiting product-country level tariffs and trade
weighted exchange rates.
While we look at several firm performance measures in this paper, the skill upgrading
measures are arguably the focus of our interest. Since the late 1980s, there has been a rising
concern about low-skilled workers in developed countries. Both job opportunities and wages
for low-skilled workers are decreasing relative to high-skilled workers. Several explanations
have been put forward including trade-induced technological change (Bloom et al. 2008)
as well as more recent theories on the offshoring of tasks (Grossman and Rossi-Hansberg,
2008). While labor economists have provided a sizable amount of firm-level evidence relating
technological change and within firm skill upgrading,2 firm-level trade studies focusing on
trade channels have only started to surface.3 The rapid growth of a country like China
provides a nice opportunity to study its role in these events. In this paper we set out to test
for a causal relationship between imports and the skill structure of Belgian firms. Our data
allows us to single out the differential impact of import competition and outsourcing as well
as to measure workers’ skill by their education level, which enables us to go beyond the crude
distinction between production and nonproduction workers used in the literature (Feenstra
and Hanson, 1996; Machin and Van Reenen, 1998).
Our main findings show that China is different from other low-wage countries but also
1Feenstra and Hanson (1999) for the US, Hijzen et al. (2005) for the UK, Falk and Koebel (2002) forGermany, etc.
2See, for example, Levy and Murnane (1996), Doms, Dunne and Troske (1997), and Bresnahan, Brynjolfsson,and Hitt (2002).
3There exist some firm-level studies relating skill upgrading within multi-national firms, such as Head andRies (2002) for Japanese multinationals, Hansson (2005) for Swedish multinationals, and Castellani et al. (2008)for Italian multinationals. However, such contributions focus on a special group of firms (multinationals) onlyand it is thus questionable how to extend results to a larger spectrum of firms. Our paper also relates to somefirm-level analysis about developing countries and trade, such as Bustos (2005) for Argentina and Verhoogen(2008) for Mexico.
3
different from OECD countries and its separate inclusion in the analysis brings out new
results. Both industry-level import competition and firm-level outsourcing of finished goods
from China reduce firm employment growth and induce skill upgrading. In contrast, industry-
level imports have no effect on Belgian firm survival, while firm-level outsourcing of finished
goods to China even increased firm’s probability of survival. The effect of Chinese imports is
large in terms of skill upgrading. Import competition from China accounts for 42% (20%) of
the within firm increase in the share of skilled workers (non-production workers) in Belgian
manufacturing over the period of our analysis, but these effects, as well as the employment
growth effect, remain mainly in low-tech industries. Firm-level outsourcing to China of both
finished and intermediate goods further accounts for a small but significant increase in the
share of non-production workers. These changes in employment structure are in line with
predictions of offshoring models and Schott’s (2008) ’moving up the quality ladder’ story
while complementing the findings about import competition from China and technological
upgrade by Bloom et al. (2008).
The remainder of this paper is organized as follows. In Section 2, we we briefly review
the theoretical literature relating trade and skill upgrading. Section 3 describes the data and
the instrumental variables. Section 4 contains summary statistics and takes a first look at
the evidence. In Section 5 we present the econometric model and discuss estimations results.
Section 6 is a concluding one.
2 Theoretical background on skill upgrading
The strongest result arising from our study is the positive effect of import competition from
and outsourcing to China on skill-upgrading in Belgian manufacturing. In this Section we
briefly review the theoretical literature relating trade to the demand of workers with different
skill levels.
So far, the favorite explanation for the increase in relative demand of skilled workers in
developed countries is the ’skill-biased technological change’ (SBTC). The main reasons that
led economists to favor SBTC over trade-related alternative stories are as follows. First, skill
upgrading was found to occur mainly within industries rather than between industries, which
4

contrasts the prediction of the standard Heckscher-Ohlin (HO) theory (Berman, Bound and
Griliches, 1994). Second, skill upgrading not only occurred in developed countries but also
in developing countries, which also goes against HO. Third, product-price studies revealed
that the prices of labor intensive goods did not decrease significantly relative to skill intensive
goods in developed countries. This violates the prediction of the Stolper-Samuelson theorem
(Lawrence and Slaughter, 1993, Leamer, 1996, and Baldwin and Cain, 2000). Finally, factor
content calculations revealed that trade with developing countries was not important enough
to have a major impact on employment structure in developed countries (see, e.g., Krugman,
1995).
However, some recent developments in both trade theory and applied trade analyses have
challenged this view. First, some scholars have stressed the complementarity between trade
and technology. Trade liberalization may alter the returns of different alternative technologies
and induce skill-biased technological change and skill upgrading (Wood, 1998, Acemoglu,
2003, Ekholm and Midelfart, 2005, Bloom et al., 2008 ). This view makes the trade-based
explanation consistent with the technology-based one. Additionally, trade economists have
recently extended the traditional HO model and shifted the focus away from trade in goods
to trade in tasks and offshoring (Feenstra and Hanson, 1996, Feenstra and Hanson, 2001,
Grossman and Rossi-Hansberg, 2008). This shift in focus makes trade-induced within industry
skill upgrading possible. Trade in tasks can explain why both developed and developing
countries can experience skill upgrading after trade liberalization. By offshoring its most
labor intensive tasks, skill intensity in developed countries rises while the newly offshored tasks
going to developing countries tend to be more skill intensive than those already performed
there.
In short, there are reasons to believe that trade is an important mechanisms affecting em-
ployment structure changes in the developed countries. While most of the above mentioned
debate has an industry-level focus, in this paper we go one step further by looking at within
firm employment outcomes and in particular skill upgrading. Within firm skill upgrading
naturally follows from the above mentioned within industry mechanisms as long as one con-
siders homogeneous firms. However, as emphasized by BJS (2006), if firms are heterogeneous
in dimensions that affect their likelihood to grow, survive, and update their production pro-
5

cess then a substantial part of skill upgrading within an industry may occur across firms.
Throughout our analysis, we will pay attention to this complementary reallocation mecha-
nisms.
We see at least three mechanisms through which trade may induce within firm skill up-
grading. First, trade may induce within firm technology upgrading which, to the extent the
later is a skill-biased, will increase firm’s relative employment of skilled workers (Bloom et
al. 2008). Second, multi-product firms may specialize in more skill intensive products when
facing competition from low-wage imports, which will also induce within firm skill upgrading
(Bernard et al, 2010). Finally, firms have the option to outsource the labor intensive stages of
the production process to low-wage countries so increasing their demand for skilled workers
(Grossman and Rossi-Hansberg, 2008).
3 Data
In this Section we provide details about the data and the methodology used in order to con-
struct our measures of import competition and outsourcing, firm-level outcomes and control
variables, as well as instruments.
3.1 Measuring import competition: industry-level import and production
data
Industry-level imports data comes from the ComExt Intra- and Extra-European Trade Data,
which is an harmonized and comparable statistical database for EU countries merchandize
trade. The database is compiled by Eurostat using statistics from the member states. We
extract data on both Belgian and EU15 manufacturing imports by country of origin and
by 4-digit NACE rev.1.1 industry for the period 1995-2007. Then we categorize countries
into four groups: OECD countries, China, other low-wage countries (BJS), and the rest of
the world. The definition for low-wage country is from Table 1 in BJS (2006), where they
consider countries with less than 5 percent of U.S. per capita GDP in 1992 as low-wage
countries. According to such definition, major labor-abundant countries like China, India and
Vietnam are all classified as low-wage. Unlike BJS (2006), we distinguish China from BJS
6

countries.
We use the variable import share4 to measure the degree of import competition faced by
Belgian firms from the different country groups at the four digit NACE code industry level.
Our working hypothesis is, as in BJS (2006), that firms within an industry experience a similar
competitive pressure on their final products which can be proxied by the importance of imports
of the same products from other countries. We construct two distinct import share measures
for Belgium and the EU15. We use the Belgian import share in our baseline estimations and
report results based on the EU15 import share in the Appendix.5 IMPSHAREcjt denotes
the import share of country group c of the goods produced by industry j in year t and is
defined as:
IMPSHAREcjt =
IM cjt
IMjt + PRjt
where IM cjt and IMjt represent (respectively) the value of imports from country group c and
all countries. PRjt is Belgian domestic production of industry j in year t and comes from the
Prodcom dataset also provided by Eurostat.
3.2 Measuring outsourcing: firm-level import data
Belgian imports data by year, firm, product (CN8 nomenclature), and country are provided
by the National Bank of Belgium (nbb) and cover the period 1995-2007. Micro trade data
are collected by the nbb on a monthly basis from Intrastat (intra-EU trade) and Extrastat
(extra-EU trade) declarations that cover the universe of trade transactions.6 The reliability
of the trade declaration data builds upon the mandatory VAT returns that firms are obliged
4We use import share, rather than import penetration as defined in BJS (2006), because of some peculiarfeature of Belgium. Belgium is a super-trader and, in a few 4 digit industries, exports are larger than the sumof import and production causing import penetration to be negative. This is another reason why we reportresults based on EU15 imports as a robustness check.
5The reasons we use EU15 import share for robustness are as follows. First, some imports of other EU15countries from China may be re-exported to Belgium. Second, Belgian firms export a lot to EU market.Imports from China by other EU countries may thus reduce their imports from Belgium so affecting Belgianfirms.
6For intra-EU trade, the threshold above which a legal obligation to declare exports arises is (from 1stJanuary 2006 onwards) 1 million euros. The threshold has changed over time going from 104,105 euros for theperiod 1993-1997, to 250,000 euros for the period 1998-2005. Firms trading less than 1 million euros representless than 1% of aggregated exports. Moreover, firms often do provide information about their trade even whenthey are below the threshold. Extra-EU trade is virtually exhaustive with the legal requirement for declarationbeing a value of 1,000 euros or more or a weight of 1,000 kg or more.
7

to file either monthly or quarterly depending the volume of sales and purchase of goods. Sales
and purchases involving a non-resident must be separately indicated in VAT returns due to the
different treatment of these operation with respect to the VAT tax. This information is then
used by the nbb to identify firms involved in trade activities which are then required to file,
whenever relevant, the Intrastat and/or Extrastat declaration. Balance sheet and trade data
were merged using the VAT number which uniquely identifies firms in Belgium. The trade
data is extremely rich and comparable in quality to the widely known French Customs data
used by Eaton et al. (2004) among others. Information about the nature of the transaction is
also available and, for the purpose of our analysis, we concentrate on transactions involving
transfer of ownership so leaving aside trade related to (i) work done; and (ii) return and
replacement of goods.
As above argued, outsourcing cannot be properly analyzed at the industry level using
input-output tables. We thus follow Biscourp and Kramarz (2007) and use firm-level imports.
In order to capture the different facets of outsourcing we first divide a firm’s imports into two
categories: imports of finished goods and imports of intermediate goods. Finished goods are
defined as CN8 products that correspond to the same 3-digit NACE code of the main activity
of the firm.7 Other imports are defined as imports of intermediate goods. The purpose of this
distinction is to broadly account for the different nature of imports of goods that are ‘ready
to sell’ versus imports of goods that will be further processed within the firm. Our measure
of outsourcing of finished goods is:
OUTFIN cit =
IMF cit
Tit
where IMF cit corresponds to firm i imports of finished goods from country group c in year t
and Tit is firm turnover in year t. Outsourcing of intermediate goods by firm i at time t from
country group c (OUTINT cit) is defined as:
OUTINT cit =
IMIcitTit
where IMF cit corresponds to firm i imports of intermediate goods from country group c in
7A detailed correspondence table between CN8 and NACE 3-digit codes across time have been provided bythe nbb.
8

year t. As for country groups, we build on the same partition used for industry-level imports
shares IMPSHAREcjt, i.e. OECD countries, China, other low-wage countries (BJS), and the
rest of the world.
3.3 Firm-level outcomes and controls: balance sheet data
Firm-level balance sheet data over the period 1996-2007 comes from the Business Registry
covering the population of Belgian firms required to file their (unconsolidated) accounts to
the nbb. The data combine annual accounts figures with data from the Crossroads Bank
on firms’ main sector, activity and legal status. Overall, most firms that are registered in
Belgium (i.e., that exist as a separate legal entity) and have limited liability are required to
file annual accounts.8 Specifically, all limited-liability firms that are incorporated in Belgium
have to report unconsolidated accounts involving balance sheet items and income statements.
Belgian firms that are in addition part of a group also have to submit consolidated accounts
where they report the joint group’s activities in a consolidated way. However, Belgian affiliates
of a foreign group which do not exist as a separate legal entity in Belgium are not required
to report unconsolidated accounts (they are required to file a consolidated account, but these
data do not allow us to obtain firm-level characteristics for the Belgian affiliate). There are
two types of annual accounts: full and abbreviated. Firms have to file a full annual account
when they exceed at least two of the following three cutoffs: (i) employ at least 50 employees;
(ii) have an annual turnover of more than 7.3 million euros; and (iii) report total assets of
more than 3.65 million euros.
For this study, we selected those companies with their main activity in the manufacturing
sector (NACE 2-digits codes 15 to 37) that filed a full-format or abbreviated balance sheet
between 1996 and 2007. This provides us with about 15,000 firms per year for which all
the relevant information is available. The data coverage, compared with other European
firm-level data, is particularly good. For example, despite France has almost 6 times more
manufacturing employment than Belgium, the well-known French EAE (Enquete Annuelle
8Exceptions include: sole traders; small companies whose members have unlimited liability; general partner-ships; ordinary limited partnerships; cooperative limited liability companies; large companies whose membershave unlimited liability, if none of the members is a legal entity; public utilities; agricultural partnerships;hospitals, unless they have taken the form of a trading company with limited liability; health insurance funds;professional associations; schools and higher education institutions.
9

Entreprise) manufacturing firms database contains data on about ‘only’ 25,000 firms.
Using the information from the balance sheet data, we construct a battery of firms’ co-
variates and retrieve the main NACE 5-digit activity code of each firm. NP/Eit is the share of
non-production workers of firm i at time t, which is defined as the ratio of non-manual workers
NP (including managers) to total employment E,9 and is a proxy for the skill intensity of the
workforce. The log of tangible assets per worker – log(K/E)it – is instead used as a measure of
capital intensity while log value added per worker – log(VA/E)it – and log total employment –
log(E)it – are used as measures for labor productivity and firm size, respectively. As standard
in the empirical Industrial Organization literature we also consider the log of firm age plus
one – log(Age)it. Finally, we use intangible assets per worker – log(Intang.K/E)it – to control
for technology-related expenditure within the firm.10
As for dependant variables, we consider a number of measures of firm performances/employment
structure. To limit endogeneity problems, we follow Bernard and Jensen (2004) and use firm
covariates at time t and dependent variables at time t + 1. The first dependent variables is
firm growth (∆Eit+1), which is defined as the log difference between a firm total employment
in year t+ 1 and t. The second one is firm exit (Deathit+1), which is defined as disappearing
from the balance sheet dataset for at least two consecutive years starting from t + 1. We
then further consider two measures of the skill level of a firm workforce. The first one is the
previously mentioned share of non-production workers that we take at time t+1 (NP/Eit+1).
The second one is a measure of the educational level of the workforce. While most related
empirical papers use the share of non-production workers to measure skill, we are able to go
further thanks to a unique feature of the data. We are indeed able to track, for firms with
full-format balance sheets only (essentially large firms), the educational level of workers that
enter and exit a firm in each year. At the cost of decreasing sample size, we are thus able
to construct a proxy for the share of skilled workers based on education.11 In particular our
measure Sit+1 is based on the following time decomposition:
9We use full time equivalent as a measure for employment.10Intangible assets include patents, licences, and R&D capitalized costs as well as goodwill.11In what follows, we consider a worker as being skilled upon having more than secondary school education
(ISCED levels 5 or 6).
10

Sit+1 =skillit+1
Eit+1=skilli0Eit+1
+skill net flow0:t+1
i
Eit+1(1)
where skillit+1 is the number of skilled workers in firm i at time t+1, and skill net flow0:t+1i
is the net inflow (i.e., gross inflow minus gross outflow) of skilled workers between year 0
and year t + 1 for firm i. The only term on the righthand side of equation (1) which is
unobservable in our data is skilli0, i.e. the initial number of skilled workers in firm i. We
use the oldest available information (year 1996) about non-production workers and re-scale
it to match aggregate figures on the stock of skilled workers in manufacturing12 as a proxy
for skilli0. We acknowledge that such measure is prone to measurement error and so results
concerning Sit+1 should be taken with caution even in IV estimations.
3.4 Instrumental variables
The key variables in our analysis are IMPSHAREcjt, OUTFIN
cit, and OUTINT c
it. In or-
der to solve the potential endogeneity problems arising with these variables we use exchange
rates and ad valorem tariffs data to construct instrumental variables for both industry-level
(import share) and firm-level (outsourcing of finished and intermediate goods) imports. From
the perspective of a Belgian firm, IMPSHAREcjt can be reasonably considered as given in
her optimization process. However, while simultaneity is likely not to be an issue, omitted
variables is. Import shares and their evolution over time might indeed be correlated with
unobserved factors that cause the analyzed outcome like, for example, technological progress.
On the other hand, for OUTFIN cit and OUTINT c
it simultaneity is possibly the main source
of endogeneity because the choice of a firm to outsource is likely to both affect and being
affected by other firm decisions. The main insight of our IV strategy is to exploit the ex-
ogenous variation of trade-weighted exchange rates and tariffs as predictors for changes in
IMPSHAREcjt, OUTFIN
cit, and OUTINT c
it.
Exchange rates data comes from the IFS database compiled by the IMF. Ad valorem
tariff data comes from the online customs tariff database, also called the TARIC, provided by
European Commission. Such dataset integrates all tariff-like restrictions applying to goods
that enter the EU market by country of origin and CN8 code for several years. The fact that
12Aggregate figures on the stock of skilled workers by industry come from the Belgian labor force survey.
11

detailed tariff information is available along two dimensions (country and product) is a pretty
unique feature of these data compared to, for example, the widely used UNCTAD’s TRAINS
data base in which only information at the HS6 digit is available. Although the database
contains information about many trade restrictive measures (like quotas, weight-based tariff,
etc.) we only use ad valorem tariffs to construct our IVs. To construct a comprehensive trade
barrier index that utilizes information on all trade measures is in fact both cumbersome and
highly questionable. For this reason we decide to focus on ad valorem tariff data only.
We use exchange rates in order to construct both group c-industry specific and group
c-firm specific IVs for, respectively, industry-level and firm-level imports. To this end we
exploit trade ratios using them as weights. We denote by IV EXCHSHAcjt the exchange rate
IV for IMPSHAREcjt and by IV EXCHFIN c
it (IV EXCHINT cit ) the exchange rate IV for
outsourcing of finished (intermediate) goods. We construct them as follows:
IV EXCHSHAcjt =
∑h∈c
IMhj0
IMj0EXCHh
t
IV EXCHFIN cit =
∑h∈c
IMF hi0
Ti0EXCHh
t
IV EXCHINT cit =
∑h∈c
IMIhi0Ti0
EXCHht
where h denotes a country, EXCH denotes exchange rates, and 0 denotes the initial value
of the corresponding variable. We use the oldest information on trade ratios only (1995)
rather than the contemporaneous one because the current trade ratio is likely to be endoge-
nous. We further consider firm turnover rather than firm total imports as the denominator of
IV EXCHFIN cit and IV EXCHINT c
it because the variable would otherwise be defined for
importing firms only.
Similarly, denoting by IV DUTY SHAcjt the tariff IV for IMPSHAREc
jt, and by IV DUTY FIN cit
(IV DUTY INT cit) the tariff IV for outsourcing for finished (intermediate) goods we construct
the as follows:
12

IV DUTY SHAcjt =
∑h∈c,p∈j
IMhp0
IMj0Dh
pt
IV DUTY FIN cit =
∑h∈c,p∈fp
IMF hpi0
Ti0Dh
pt
IV DUTY INT cit =
∑h∈c,p∈ip
IMIhpi0Ti0
Dhpt
where D denotes ad valorem tariffs, p denotes an 8-digit CN product code, and fp (ip) denotes
the set of finished (intermediate) goods.13 Again, we use the oldest information on trade ratios
only to be on the safe side.
4 A few intriguing figures and descriptive statistics
In this Section we provide some aggregate descriptive information on the key variables we
use both at the whole manufacturing level and at two digit NACE industry level. Figure 1
shows that the import share of China for manufacturing as a whole increased substantially
during the period 1996-2007. Starting from the same level as other low-wage countries in
1996, China’s import share triplicate during the period while the import share of other low-
wage countries has only slightly increased. This remarkable difference is one of the empirical
facts that make us believe that China needs to be treated separately. Incidentally in 2001,
which is the year China officially entered WTO, Belgian manufacturing employment started,
as showed in Figure 2, to fall sharply. Is it China to blame for this? The answer that we
provide in the next Section is actually “not much”.
Figures 1 and 2 just display two common time trends without any pretence of causality.
However, they have the virtue of summarizing rather well what is the common fear about
the increase in competition due to Chinese imports: employment losses. What is usually
less emphasized is that another performance measure is also correlated with the increase in
China‘s import share: the skill upgrading of the workforce. Figures 3 and 4 show the evolution
over the period 1996-2007 of, respectively, the share of non-production workers and the share
13It is important to stress that both fp and ip are firm-time specific as they depend on the NACE 3-digitindustry code of a firm.
13

of skilled workers in Belgian manufacturing. Both are indeed steadily increasing over time
(especially after 1998) and we will show in the next Section that import competition from
China has largely contributed to within firm skill upgrading.
Last but not least, what makes the picture even more interesting is the fact that import
competition is not the only channel via which Chinese and other low-wage countries imports
are eventually affecting manufacturing firm in the western world. Some Chinese goods are in
fact directly imported by manufacturing firms for either immediate sale (finished goods) or
further processing (intermediate goods). This is a rather different form of trade for these firms
who might actually benefit a lot in terms of increased performance and profitability. Figures
5 and 6 shows the time evolution of the share (%) of Belgian manufacturing firms involved,
respectively, in outsourcing of finished and intermediate goods with China and other low-wage
countries over the period 1996-2007. Again, a rather flat line for BJS countries and a straight
increasing line for China. Is outsourcing more or less important than import competition
for firm performances? The evidence we provide in the next Section points towards import
competition having a much sizeable effect on firms.
The above evidence does not certainly provide a basis for casual statements and econo-
metric analysis is needed. This is the goal of the next Section. However, one necessary
condition to reach some conclusions is that there is enough identifying variation in the data.
Our key explanatory variables vary across the NACE 4-digit (import share) and firm (out-
sourcing of finished and intermediate goods) dimensions. Table 1 provides evidence that there
is already considerable variation in our dependent variables across the relatively aggregated
NACE 2-digit breakdown over the period of analysis. While being strongly negative in the
case of Apparel and Leather product and footwear, employment growth has been remarkable
for Office machinery and computers. On the other hand the Apparel and Leather product
and footwear industries have experienced an impressive increase in both the share of non-
production and skilled workers. However, the Other Transportation equipment industry has
also experienced a noticeable skill upgrade while keeping a modest exit rate and a pretty good
employment growth.
Tables 2 to 4 further report the value and changes of our main explanatory variables over
the sample period by NACE 2-digit industry. As in the previous case, these Tables highlight
14

the fact that there is quite a lot of variation even at the relatively aggregated NACE 2-digit
breakdown. Table 2 shows the value of the import share of China and other low-wage countries
in 1996 and 2007 as well as their change over the period. One can see, the import share of both
China and other low-wage countries increased in almost all industries, but Chinese imports
increased generally faster, especially in relative high-tech industries like office machinery and
computers, electrical machinery, radio, TV and communication equipment, etc. Actually, even
in 2007, imports from other low-wage countries still concentrate on low-tech industries like
textile, apparel and leather goods, while Chinese imports span both low-tech and high-tech
industries from the beginning of the period. This fact is in line with the literature emphasizing
the relative sophistication of Chinese exports (Schott, 2008).
Table 3 and 4 report, respectively, the 1996 and 2007 levels (and change) of the share
of firms that are involved in outsourcing of finished and intermediate goods from China and
other low-wage countries by NACE 2-digit industry. The pattern is similar to that shown
in Table 2: more and more firms start importing from low-wage countries over the period,
especially from China. There is a lot of heterogeneity across industries with, for example,
the Radio, TV and Communication Equipment industry experiencing the highest level and
increase of the share of firms importing finished and intermediate goods from China. Though
this industry might, to some extent, be considered as low tech, the increase in the share of
outsourcing firms from China in the Chemical industry speaks about the high technological
content of some Chinese products.
5 Econometric results
In this Section we analyze the impact of both import competition and outsourcing on four
firm outcome measures: employment growth, firm exit, share of blue collar workers and share
of skilled (highly educated) workers. Import competition (IMPSHAREcjt) is measured by
industry-level import shares from the four different country groups (OECD, China, BJS,
Other). As in BJS (2006), our underlying assumption is that firms within an industry ex-
perience a similar competitive pressure on their final products which can be proxied by the
importance of imports of the same goods from other countries. As for outsourcing, we de-
15

part from the standard practice of using aggregate data and input-output tables and follow
Biscourp and Kramarz (2007) by using firm-level imports. In order to capture the different
facets of outsourcing we divide, for each country group, a firm’s imports into two categories:
imports of finished goods (OUTFIN cit) and imports of intermediate goods (OUTINT c
it).
In order to solve the potential endogeneity problems arising from omitted variables and
simultaneity we use exchange rates and ad valorem tariffs data to construct instrumental
variables. The main insight of our IV strategy is to exploit the exogenous variation of trade-
weighted exchange rates and tariffs as predictors for changes in IMPSHAREcjt, OUTFIN
cit,
and OUTINT cit. In particular, we use 1995 industry (firm) weights in order to minimize the
issue of the endogeneity of weights for import share (firm outsourcing).
5.1 Econometric model
Equation (2) is based on BJS (2006) and the dependant variable (Yit+1) will be either firm
employment growth (∆Eit+1), or firm exit (Deathit+1), or the firm share of non-production
workers (NP/Eit+1) or its share of skilled workers (S/Eit+1). Vit is a vector of time-varying
firm i controls including firm size, age, labor productivity, capital intensity, and its intangible
capital intensity (the latter being used as control for expenditure in technology). When con-
sidering employment growth and firm exit we also include the current share of non-production
workers as a further control in Vit. T1jt is instead a vector containing the time-varying indus-
try j-level variables which measure the degree of import competition from different country
groups (IMPSHAREcjt). T2it, which is not considered in BJS (2006), is a vector contain-
ing the time-varying firm-level variables which measure the importance of outsourcing of final
(OUTFIN cit) and intermediate (OUTINT c
it) goods from the different country groups. Finally,
δt is a vector of time dummies and δi is firm fixed effect.
Yit+1 = c+ V′itα+ T1
′jtβ1 + T2
′itβ2 + δt + δi + εit (2)
Following BJS (2006), in additional specifications we have interacted T1jt and T2it with
some firm characteristics (factor intensities and labor productivity) in order to account for the
impact of import competition and outsourcing across firms within an industry. We do not find
16

any significant effect for the interaction between outsourcing and firm characteristics, while
for import competition we find some results for employment growth and firm exit only. We
thus report only results about interactions of import competition in the case of employment
growth and firm exit.
In some other specifications we interact T1jt with categorial dummies indicating whether
a given NACE 4-digit industry is low, medium-low, medium-high, or high-tech. The tech-
nological ranking of industries we build upon, reported in Figure 7, has been obtained by
Eurostat based on R&D spending statistics. The purpose of this exercise is to see whether
Chinese import competition have different effects on firms in industries characterized by dif-
ferent technology levels. While it is clear from the descriptive statistics in the previous Section
that sizeable imports from China can be found in both low- and high-tech industries, it is less
clear whether the competitive pressure they exsert on firms is the same.
For all of the above estimations, we use exchange rates and ad valorem tariffs data to
construct IV’s for import competition and outsourcing of finished and intermediate goods.
For firm-level trade, lagged firm-level imports are also used as instruments. The estimation
results are shown in Tables 5 to ??. Tables 5 to 7 show estimation results for equation (2) for
employment growth and firm exit with the first two Tables focusing on import competition
and the last one on firm-level outsourcing. Tables ?? to 10 show estimation results of equation
(2) for the share of non-production and the share of skilled workers with the first two Tables
being devoted to import competition and the last one to outsourcing. Tables ?? to 16 in
the Appendix provide robust evidence of our results by using industry-level import shares of
the EU15 (instead of Belgium) as measures of import competition from the different country
groups. Results are virtually identical and so we will not discuss them any further.
We use robust standard errors and statistics. At the bottom of each Table we report the
under-identification (Kleibergen-Paap LM), weak identification (Kleibergen-Paap Wald F),
and over-identification (Hansen J) statistics and p-vales. The number of endogenous variables
and number of instruments are also indicated along with the number of observations, firms,
and the R2. Results indicates that our instruments for both industry-level and firm-level trade
are overall not weak. At the same time, however, the Hansen J statistic sometimes rejects the
null of no over-identification when industry-level import competition is instrumented. This
17

suggests that caution is needed in such cases. Note that such problem does not arises in the
regressions where only outsourcing of finished and intermediate goods is instrumented.
5.2 Employment growth
Table 5 reports the relationship between firm employment growth and import competition
for our four country groups: OECD, China, other low-wage countries (BJS), and the rest
of the world (Other). In order to make our results comparable to previous studies, and in
particular to BJS (2006), we do not consider for the moment firm-level outsourcing variables,
i.e. the vector T2it, in the estimation of (2). The first three columns report within estimates
while the remaining three columns report IV estimates. Columns 1 and 4 refer to the baseline
specification. In columns 2 and 5, we add interaction terms of some firm characteristics
(share of non-production workers, capital intensity and productivity) with both Chinese and
BJS import shares. In column 3 and 6 we instead consider interaction terms of industry-
level categorial dummies measuring technological intensity with China’s import share.14 In
all the regressions, we include year and firm fixed effects to control for aggregate trends in
manufacturing employment growth and unobserved (time-invariant) firm characteristics.
Within estimation results in column 1 reveal that employment growth is negatively as-
sociated to import competition from China as well as BJS countries with roughly similar
magnitudes. This is not the case for both OECD and Other countries’ import competi-
tion which have insignificant coefficients. These finding echoes those of BJS (2006) and are
partially confirmed by IV estimations in column 4. Indeed, when instrumenting, only im-
port competition from BJS countries has a significant (and larger) coefficient with respect
to China. Columns 5 and 6 further qualify IV results. The interactions of IMPSHAREcjt
for BJS countries and China with firm characteristics indicate that, contrary to the case of
BJS countries, Chinese imports are inducing a re-allocation of resources across Belgian firms
characterized by different capital intensities. In particular, firms with high capital intensity
are particularly hit by Chinese import competition which is somewhat in line with the Schott
(2008) story discussed earlier. However, capital intensity does not necessarily correspond to
high-tech. Indeed, column 6 indicates that the only group of industries whose employment
14The omitted category refers to low-tech industries. See the data Section and Figure 7 for further details.
18

growth is significantly affected by import competition from China is the excluded category (i.e.
the low-tech). As for other industries, the sum of the reference category parameter and the
interaction term is in fact never significant. Last but not least, the implied growth magnitude
of our coefficients is far from being shocking. The average firm yearly employment growth
in our panel data is 0.58%. Taking the coefficient value corresponding to low-tech industries
(who account for roughly 36% of Belgian manufacturing employment) in column 6 (-0.5167)
and considering that the average across firms (belonging to this subset of manufacturing) of
IMPSHAREcjt for China has steadily increased from 0.0138 in 1996 to 0.0502 in 2007, we
get that import competition from China could be blamed for a -0.5167 × 0.0138=-0.71% firm
employment growth effect in 1996 and a -0.5167 × 0.0502=-2.59% firm employment growth
effect in 2007. As for other low wage countries, using the coefficient in column 6, which now
refers to all manufacturing, and the average import shares in 1996 and 2007 reveals that im-
port competition from BJS countries turns into a -0.47% growth effect for 1996 and a -1.19%
growth effect in 2007.
Overall, our qualitative findings so far are in line with the existing literature while further
qualifying China as being different from other low-wage countries. Though, our Hansen J
calls for caution and we cannot unfortunately compare the quality of our over-identifying
restrictions with previous studies.15 In Table ?? we report results on the relationship between
employment growth and firm-level trade which are given in the first 3 columns. The full
econometric model in (2) is now estimated with column 1 (2 and 3) providing within (IV)
estimates. Import competition variables, i.e. the vector T1it, is included but coefficients are
not reported in order to save space. Our preferred specification is the one in column 3 where
industry-level trade, in contrast to column 2, is not instrumented and our Hansen J statistic
does not reject the validity of our instruments.
Two key features stand out from our results. First of all, contrary to a widespread fear,
firm outsourcing does not dramatically affect firm employment growth. This is certainly the
first order effect and comes from coefficients being almost never significant or, when they are
significant, having a small magnitude. The coefficient on imports of intermediates from OECD
15Though the number of instruments in BJS (2006) is larger than the number of endogenous variables, noover-identifying test statistic is provided and/or mentioned.
19

countries (0.1296) is actually positive and significant. The relatively stable over time mean of
OUTINT cit for OECD countries across manufacturing firm is 0.0396 meaning that this type
of outsourcing accounts for a 0.1296 × 0.0396=0.51% firm employment growth effect. While
the coefficient of outsourcing of finished goods to China (-0.3182) is significant and negative,
it is in the end economically small. Outsourcing to China steadily increased from 0.0005 in
1996 to 0.0015 in 2007 implying that it accounted only for -0.3182 × 0.0015=-0.05% firm
employment growth in Belgian firm level manufacturing in 2007.
Two comments are in order. First, our firm-level analysis confirms both the ambiguity and
the limited impact of outsourcing on employment found in previous industry-level studies in
the literature (Amiti and Shang-Jin Wei, 2005). Second, our finding on China is in line with
the hypothesis put forward by Biscourp and Kramarz (2007) that outsourcing to low wage
countries has a negative effect on firm employment only when the imported goods are final
in nature. While Biscourp and Kramarz (2007) could only perform a correlation exercise our
IV results suggest, at least for China, a deeper causal relationship.
5.3 Firm exit
Table 6 repots the relationship between firm exit and import competition from different coun-
try groups while columns 4, 5 and 6 of Table 7 contains our estimations of the full model for
firm exit with a focus on the role of outsourcing. The structure of the different specifications
presented is the same as for employment growth.
Focusing on IV results in Table 6 reveals that, contrary to import competition for other
low-wage countries, imports from China are not increasing the likelihood of firm exit. This
is again another dimension in which China is different from BJS countries whose import
competition instead induces significantly more exit. OECD countries behave like China in
that their import competition does not significantly affect firm survival while imports from
other countries actually decrease the likelihood of exit. This latter result is quite puzzling
and might be related to measurement error in this residual country category.
Interactions with firm-level variables in column 5 further indicate that neither for China
nor for BJS countries there is a strong evidence of an heterogenous firm response. Only
20

the interaction between import competition from BJS countries and productivity is in fact
significant at the 10% level. Moreover, results from column 6 actually suggest (although
significance is weak) that Chinese imports decrease exit in high-tech industries. This finding
confirms the descriptive evidence we provided about the active role of China in high-tech
industries and might reflect the existence of some complementarities. Implied magnitudes of
significant coefficients are, in line with the case of employment growth, not stunning. The
unconditional probability of firm exit in the panel is 11.92% and import competition from
BJS countries increases the probability of exit by 0.44% in 1996 and 1.00% in 2007.
Overall, our findings on import competition are again in line with the existing literature
while further qualifying China as being different from other low-wage countries. We now turn
to IV results about the role of firm-level outsourcing on exit reported in Table 7. For the
same reasons explained above, the specification in column 6 is our preferred one. Again, the
big picture is that most coefficients are not significant and/or small with results for China
and OCED standing out. Outsourcing of finished goods from OECD countries increase the
likelihood of firm exit. This might be due to firms moving out of Belgium to the country of
origin of final goods sourcing. On the other hand, outsourcing of intermediate (finished) goods
from China increases (decreases) the probability of exiting. Combined with the previously
identified negative impact on firm employment growth, our finding on finished goods depicts
a scenario in which firms respond to globalization by outsourcing some of their jobs to China
(via the import of finished goods) but in turn gets more competitive and are able to survive.
Finally, turning coefficients into induced exit probabilities by means of average values
of OUTFIN cit and OUTINT c
it reveals that, in 2007, outsourcing of finished (intermediate)
goods with China causes a decrease (increase) of the exit probability of 0.03% (0.06%). As
for OECD countries, the effect of OUTFIN cit in 2007 is larger and equals 0.21%.
5.4 Skill upgrading
Tables 8 and 9 report the relationship of, respectively, firms’s employment structure (share
of non-production workers) and skill intensity (share of skilled workers) with industry-level
import competition from different country groups. The first two columns of each Table report
21

within estimates while the remaining two columns report IV estimates. In column 2 and 4 of
each Table, we consider interaction terms of our industry-level categorial dummies measuring
technological intensity with the Chinese import share. In all the regressions, we include year
and firm fixed effects to control for aggregate trends and unobserved (time-invariant) firm
characteristics.
The basic message from IV results of both Tables is the same: import competition from
China is inducing within firm skill upgrading by both fostering an increase of the share of
non-production workers and an increase in the share of workers with tertiary education. At
the same time neither import competition from OECD nor from other low-wage countries has
a significant effect on skill upgrading. These original findings are of high policy relevance and
pins down a key firm adjustment margin to globalization to be added to those identified in
BJS (2006).
The magnitude of the impact is big. NP/Eit+1 and S/Eit+1 are, contrary to employment
growth and firm exit, stock variables so that a more useful way of interpreting coefficients’
magnitudes is to compute what share of the observed time change (between 1996 and 2007)
of NP/Eit+1 and S/Eit+1 can be accounted for by the time change of IMPSHAREcjt. Doing
this back of the envelope calculation with coefficients from column 3 reveals that import
competition from China is responsible for 19.77% (42.71%)16 of the increase in the share of
non-production (skilled) workers in Belgian manufacturing over our period of analysis. As
further shown in column 4, all of the adjustment is taking place in low-tech industries with,
for example, China accounting for 79.25% of the increase in the share of skilled workers in
these industries.
Skill upgrading in low-tech industries due to increased import competition from China has
to be compared with the negative impact we found on employment growth due to Chinese
imports and the non significant effect on firm exit for those industries. Overall, our results
can be rationalized by the following argument. Even though imports from China raise the
degree of competition in the Belgian market pushing firms to reduce their employment, it
also induces firms to upgrade their technology and employment structure. In the presence of
16Using the firm sample in column 3 of Table 8, we get that the import share of China increased by 0.026from 1996 to 2006, while NP/Eit+1 increased by 0.038 from 1997 to 2007, thus we get the contribution ofChina’s import share is 0.026× 0.289/0.038=0.1977, or 19.77%, where 0.289 is the coefficient of China’s importshare in column 3 of table 8. The other numbers used in this Section are calculated in similar way.
22

market failures limiting technology adoption, like those described in Bloom et al. (2008), this
may ultimately be beneficial for firms and make them less likely to die. Bloom et al. (2008)
show that import competition from China is inducing a sizeable within firm technological
upgrade as measured by firm-level IT spending and patents. Our findings complement their
results by pointing that such technological upgrade goes hand in hand with skill upgrading.
Skill upgrading certainly requires an upgrade of the technology used by firms and vice versa,
meaning that it is hard to disentangle the two. However, our results indicate that skill
upgrading in response to import competition from China is taking place over and above what
can be explained by our control variable measuring expenditure in technology. In this light,
the specialization of multi-product firms into more skill intensive products (Bernard et al,
2010) represents a plausible complementary explanation.
Table 10 reports our estimation results for skill upgrading and outsourcing. The first three
columns report the relationship between the share of non-production workers and firm-level
imports while the last three columns contains results for the share of skilled workers. The
structure of the different specifications presented is the same as for Table 7.
Looking at results for NP/Eit+1 reveals that firm-level outsourcing has, contrary to the
case of employment growth and exit, in many cases a significant impact. A more careful
inspection tells us that in the IV specifications, outsourcing of finished goods from all country
groups induces skill upgrading. This is a very strong result and is in line with, for example,
the trade-in-tasks model of Grossman and Rossi-Hansberg (2008). To the extent that the final
production stage (assembly) is low skill intensive as compared to other stages like design and
commercialization, the involvement of a firm into outsourcing of final goods can reasonably
induce skill upgrading due to shift of a firm domestic activities towards more skill intensive
tasks. However, the magnitude of the effects we are talking about is rather small. Given
estimated coefficients in column 3 and time changes of OUTFIN cit across the four country
groups, the increase in outsourcing (from all origins) of final goods during the period 1996-
2007 accounts for a mere 0.50% of the increase in NP/Eit+1. Interestingly, China is different,
i.e., also the outsourcing of intermediate goods induces skill upgrading. Again, the effect is
small (0.68%).
The picture is quite different when looking at estimations for the share of skilled workers.
23

In this case, only outsourcing from OECD countries has a significant impact which is pointing
again towards skill upgrading. Both outsourcing of final and intermediate goods to OECD
countries induces a within firm increase in the share of college educated workers with the
impact being stronger for the finished goods. Indeed, the time change of outsourcing of
finished (intermediate) goods to OECD countries accounts for 3.48% (1.06%) of the time
change of S/Eit+1 over our period of analysis.
6 Conclusion
Imports from China into Belgium have risen faster than from other low-wage country imports
in recent years. This paper evaluates the effect of both industry-wide and firm-level imports
from China separately from other countries’ imports on Belgian manufacturing firms in terms
of employment growth, firm survival and skill-upgrading. In obtaining our results we use an
IV strategy exploiting product-country level ad-valorem tariffs and trade weighted exchange
rates as instruments.
We find that, with respect to imports from other low-wage countries, Chinese imports
have a different impact on within firm-level employment changes. Import competition from
China significantly and negatively affects employment growth, but only for firms in low tech
industries. Contrary to the popular belief, import competition from China does not nega-
tively affect firm survival in manufacturing. This result holds even when accounting for firm
heterogeneity within an industry. Our findings on firm-level outsourcing actually suggest that
imports of finished goods decrease the probability of firm death. However, these effects are
small in magnitude.
The strongest result we obtain is about skill upgrading. Import competition from China
accounts for 42% (20%) of the within firm increase in the share of skilled workers (non-
production workers), with most of the adjustment taking place in low tech industries. Firm-
level outsourcing to China of both finished and intermediate goods further accounts for a small
but significant increase in the share of non-production workers. These changes in employment
structure are in line with predictions of offshoring models and Schott’s (2008) ’moving up the
quality ladder’ story while complementing the findings about import competition from China
24

and technological upgrade by Bloom et al. (2008). Even though imports from China raise
the degree of competition in the Belgian market pushing firms to reduce their employment,
it also induces firms to upgrade their technology and employment structure. In the presence
of market failures limiting technology adoption, like those described in Bloom et al. (2008),
this may ultimately be beneficial for firms and make them less likely to die.
We propose two directions for future research. First, the set of instruments for firm-
level outsourcing can be widened to improve instruments’ strength further. Second, there are
other firm-level margins of adjustment in the face of import competition (such as product
switching, quality upgrading, technology upgrading) that are likely to be related to those we
examined and whose relative importance and interaction represent an interesting avenue for
future research.
25

References
[1] Acemoglu, D., 2003. Patterns of skill premia. Review of Economic Studies 70(2), 199-230.
[2] Amiti, M., Wei, S.J., 2005. Fear of service outsourcing: is it justified? Economic Policy
20, No. 42, 308-347.
[3] Baldwin, R.E., Cain, G.G., 2000. Shifts in relative U.S. wages: the role of trade, tech-
nology, and factor endowments. Review of Economics and Statistics 82 (4), 580-595.
[4] Berman, E., Bound, J., Griliches, Z., 1994. Changes in the demand for skilled labor
within US manufacturing: evidence from the annual survey of manufactures. Quarterly
Journal of Economics 109 (2), 367-397.
[5] Bernard, Andrew B. and J. Bradford Jensen, 2004. Why Some Firms Export. The Review
of Economics and Statistics, 86(2), 447-464.
[6] Bernard, A.B., Jensen, J.B., Schott, P.K., 2006. Survival of the best fit: Exposure to
low-wage countries and the (uneven) growth of U.S. manufacturing plants. Journal of
International Economics 68 (1), 219-237.
[7] Bernard, A.B., Redding, S., Schott, P.K., 2010. Multiple-Product Firms and Product
Switching. American Economic Review 100 (2), 444-448.
[8] Biscourp, P., Kramarz, F., 2007. Employment, skill structure and international trade:
firm-level evidence for France. Journal of International Economics 75, 22-51.
[9] Bloom, N., Draca, M., van Reenen, J., 2008. Trade induced technical change? The impact
of Chinese imports on technology and employment. Mimeo.
[10] Bresnahan, T.F., Brynjolfsson, E., Hitt, L.M., 2002. Information technology, workplace
organization, and the demand for skilled labor: firm-level evidence. Quarterly Journal of
Economics 117 (1), 339-376.
[11] Bustos, P., 2005. The Impact of Trade on Technology and Skill Upgrading Evidence from
Argentina. Mimeo.
26

[12] Castellani, C., Mariotti, I., Piscitello, L., 2008. The impact of outward investments on
parent company’s employment and skill composition: evidence from the Italian case.
Structural Change and Economic Dynamics 19, 81-94.
Review of Economic Studies 77 (2), 595-632.
[13] Doms, M., Dunne, T., Troske, K.R., 1997. Workers, wages and technology. Quarterly
Journal of Economics 112, 253-290.
[14] Eaton J., Kortum, S., and F. Kramarz, 2004, Dissecting Trade: Firms, Industries, and
Export Destinations. American Economic Review Papers and Proceedings 94, May, 150-
154.
[15] Ekholma, K., Midelfart, K.H., 2005. Relative wages and trade-induced changes in tech-
nology. European Economic Review 49 (6), 1637-1663.
[16] Falk, M., Koebel, B.M., 2002. Outsourcing, imports and labour demand. Scandinavian
Journal of Economics 104 (4), 567-586.
[17] Feenstra, R.C., Hanson, G.H., 1996. Globalization, outsourcing and wage inequality.
American Economic Review 86, 240-245.
[18] Feenstra, R.C., Hanson, G.H., 1999. The impact of outsourcing and high-technology capi-
tal on wages: estimates for the United States, 1979-1990. Quarterly Journal of Economics
144 (3), 907-940.
[19] Feenstra, R.C., Hanson, G.H., 2001. Global production sharing and rising inequality: a
survey of trade and wages. NBER Working Paper 8372.
[20] Grossman, G.M., Rossi-Hansberg, E., 2008. Trading tasks: a simple theory of offshoring.
American Economic Review 98 (5), 1987-1997.
[21] Hansson, P., 2005. Skill upgrading and production transfer within Swedish multinationals.
Scandinavian Journal of Economics 107 (4), 673-692.
[22] Head, K., Ries, J., 2002. Offshore production and skill upgrading by Japanese manufac-
turing firms. Journal of International Economics 58, 81-105.
27

[23] Hijzen, A., Gorg, H., Hine, R.C., 2005. International outsourcing and the skill structure
of labour demand in the United Kingdom. Economic Journal 115 (October), 860-878.
[24] Krugman, P., 1995. Growing world trade: causes and consequences. Brookings Papers
on Economic Activity, Vol. 1995, No.1, 25th Anniversary Issue, 327-377.
[25] Lawrence, R.Z., Slaughter, M.J., 1993. International trade and American wages in the
1980s: giant sucking sound or small hiccup? Brookings Papers on Economic Activity
(Microeconomics), Vol.1993, No. 2, 161-226.
[26] Leamer, E.E., 1996. Wage inequality from international competition and technological
change: theory and country experience. American Economic Review 86 (2), Papers and
Proceedings of the Hundredth and Eighth Annual Meeting of the American Economic
Association San Francisco, CA, 309-314.
[27] Levy, F., Murnane, R.J., 1996. With what skills are computers a complement? American
Economic Review 86 (2), Papers and Proceedings of the Hundredth and Eighth Annual
Meeting of the American Economic Association San Francisco, 258-262.
[28] Machin, S., van Reenen, J., 1998. Techonology and changes in skill structure: evidence
from seven OECD countries. Quarterly Journal of Economics 113, 1215-1244.
[29] Rodrik, D., 2006. What is so special about China’s exports? China & World Economy
14 (5), 1-19
[30] Schott, P.K., 2008. The relative sophistication of Chinese exports. Economic Policy, Vol.
23, Issue 53, 5-49.
[31] Verhoogen, E., 2008. Trade, quality upgrading, and wage inequality in the Mexican
manufacturing sector. Quarterly Journal of Economics 123 (2), 489-530.
[32] Wood, A., 1998. Globalisation and the rise in labour market inequalities. Economic Jour-
nal 108, 1463-1482.
28

Table 1: Evolution of dependent variables across manufacturing industries over the period ofanalysis
Employment (FTE) Average firm Share of white collar Share of skilled workerschange (%) exit rate (%) change (percentage) change (percentage)
Nace Industry 96-07 96-05 96-07 96-0715 Food -1.1 4.6 0.2 6.016 Tobacco -35.0 2.4 2.1 8.017 Textile -34.2 4.4 0.2 9.418 Apparel -57.1 6.0 20.7 19.919 Leather product and footwear -43.0 5.7 11.1 12.220 Wood products -0.1 3.7 -7.2 5.721 Paper -11.8 3.9 0.1 3.222 Publishing -13.7 5.1 6.9 22.223 Nuclear 17.8 4.4 14.9 0.524 Chemical 5.9 4.5 8.3 6.225 Rubber and plastic 10.9 3.8 4.8 3.426 Non-metallic mineral -10.7 3.7 1.4 9.527 Basic metal -23.0 4.5 -0.7 5.528 Fabricated metal 11.5 3.6 0.3 5.829 Machinery and equipment -0.4 4.2 0.6 9.330 Office machinery and computers 56.8 5.6 4.1 -1.731 Electrical machinery -19.8 4.9 4.8 10.232 Radio. TV and Comm. Equip. -37.0 6.5 7.8 24.333 Medical and optical instr. 8.1 3.5 8.4 7.334 Motor vehicles -15.4 4.2 -8.5 3.535 Other transp. Equip. 19.5 5.2 13.4 4.936 Furniture and other -24.4 4.4 2.3 9.937 Recycle 14.0 4.8 -1.0 6.3
Total -9.1 4.4 2.9 8.3Notes: 1. Firm exit after 2005 cannot be observed due to its definition.Notes: 2. The share of skilled workers is available only for large firms, i.e. those filing a complete form.
Table 2: Import share of China and other low-wage countries across manufacturing industriesover the period of analysis
Import share (%) Import share(%) Import sharechange
Nace Industry China 1996 BJS 1996 China 2007 BJS 2007 China 96-07 BJS 96-0715 Food 0.1 0.5 0.4 1.0 0.2 0.516 Tobacco 0.0 0.0 0.0 0.1 0.0 0.117 Textile 1.4 4.7 6.0 5.5 4.7 0.818 Apparel 4.2 4.9 21.7 12.0 17.4 7.119 Leather product and footwear 15.9 4.2 32.0 15.2 16.0 11.020 Wood products 0.7 0.3 3.9 0.6 3.2 0.321 Paper 0.0 0.0 0.8 0.0 0.8 0.022 Publishing 0.1 0.0 0.8 0.1 0.7 0.023 Nuclear NA NA NA NA NA NA24 Chemical 0.4 0.1 0.6 0.3 0.2 0.125 Rubber and plastic 0.6 0.3 2.9 0.5 2.3 0.226 Non-metallic mineral 0.3 0.2 3.2 1.0 2.9 0.827 Basic metal 0.3 0.6 3.8 2.5 3.5 1.828 Fabricated metal 0.8 0.1 3.2 0.3 2.5 0.229 Machinery and equipment 0.6 0.0 3.1 0.2 2.5 0.230 Office machinery and computers 1.6 0.0 16.8 0.0 15.1 0.031 Electrical machinery 1.3 0.0 5.6 0.4 4.3 0.332 Radio, TV and Comm. Equip. 3.5 0.0 10.3 0.3 6.9 0.333 Medical and optical instr. 1.8 0.0 3.8 0.4 2.0 0.334 Motor vehicles 0.0 0.0 0.3 0.1 0.3 0.135 Other transp. Equip. 0.4 0.1 5.1 0.5 4.7 0.536 Furniture 3.8 8.3 13.4 13.2 9.6 4.937 Recycle 0 0 0 0 0 0
Total 0.9 0.9 3.0 1.3 2.1 0.4Notes: NA for industry 23 means not available
29

Table 3: Share of outsourcing firms in Belgium manufacturing industries (finished goods)
Share (%) of firms that import finished goods from ChangeNace Industry China 1996 BJS 1996 China 2007 BJS 2007 China 96-07 BJS 96-0715 Food 0.4 0.5 0.6 0.7 0.2 0.216 Tobacco 0.0 7.1 0.0 0.0 0.0 -7.117 Textile 0.8 2.4 4.5 4.2 3.7 1.818 Apparel 3.1 3.5 7.9 6.0 4.8 2.519 Leather product and footwear 7.4 6.7 9.4 5.5 2.0 -1.220 Wood products 0.4 0.7 0.8 0.4 0.4 -0.321 Paper 0.0 0.0 2.4 0.3 2.4 0.322 Publishing 0.4 0.1 0.8 0.3 0.4 0.223 Nuclear 0.0 0.0 0.0 7.0 0.0 7.024 Chemical 2.8 2.4 7.9 3.7 5.9 1.025 Rubber and plastic 0.7 0.9 6.6 1.9 5.1 1.326 Non-metallic mineral 0.2 3 4.5 2.3 4.3 -0.727 Basic metal 2.5 1.9 5.9 4.2 3.4 2.328 Fabricated metal 0.3 0.1 1.0 0.4 0.7 0.329 Machinery and equipment 0.8 1.1 4.5 2.1 3.7 1.030 Office machinery and computers 2.6 1.3 4.5 1.5 1.9 0.231 Electrical machinery 1.7 1.0 9.0 2.8 7.3 1.832 Radio. TV and Comm. Equip. 4.4 2.2 14.0 4.1 9.6 1.933 Medical and optical instr. 0.6 0.4 3.2 1.3 2.6 0.934 Motor vehicles 0.3 0.3 3.9 1.6 3.6 1.335 Other transp. Equip. 1.0 0.0 4.2 2.3 3.2 2.336 Furniture 1.2 0.7 3.8 1.1 2.6 0.437 Recycle 0 0 0 0 0 0
Total 0.8 1.0 2.8 1.4 2.0 0.4
Table 4: Share of outsourcing firms in Belgium manufacturing industries (intermediate goods)
Share (%) of firms that import intermediate goods from ChangeNace Industry China 1996 BJS 1996 China 2007 BJS 2007 China 96-07 BJS 96-0715 Food 1.1 1.1 2.4 1.3 1.3 0.216 Tobacco 14.3 42.9 10.3 51.7 -4.0 8.817 Textile 2.2 11.4 9.4 10.2 7.2 -1.218 Apparel 2.7 2.9 9.3 6.0 6.6 3.119 Leather product and footwear 6.7 4.4 6.3 2.4 -0.4 -2.020 Wood products 0.6 0.3 2.8 0.7 2.2 0.421 Paper 1.9 1.6 6.9 1.4 5.0 -0.222 Publishing 0.6 0.2 1.6 0.2 1.0. 0.023 Nuclear 3.1 0.0 9.3 0.0 6.2 0.024 Chemical 5.6 4.1 15.1 8.4 9.5 4.325 Rubber and plastic 1.3 1.7 10.6 4.8 9.3 3.126 Non-metallic mineral 0.8 2.0 5.9 3.1 5.1 1.127 Basic metal 4.3 2.8 14.1 6.5 9.8 3.728 Fabricated metal 0.5 0.5 3.5 1.0 3.0 0.529 Machinery and equipment 1.2 1.3 6.6 2.4 5.4 1.130 Office machinery and computers 5.2 0.0 11.4 2.3 6.2 2.331 Electrical machinery 2.9 1.3 13.4 5.1 10.5 3.832 Radio. TV and Comm. Equip. 6.0 2.2 20.5 9.9 14.5 7.733 Medical and optical instr. 0.7 0.4 5.0 2.0 4.3 1.634 Motor vehicles 1.2 0.3 7.6 2.6 6.4 2.335 Other transp. Equip. 1.9 1.0 5.0 2.3 3.1 1.336 Furniture 1.3 1.3 3.6 1.3 2.3 0.037 Recycle 0.3 2.4 1.3 1.5 1.0 -0.9
Total 1.4 1.9 5.0 2.5 3.6 0.6
30
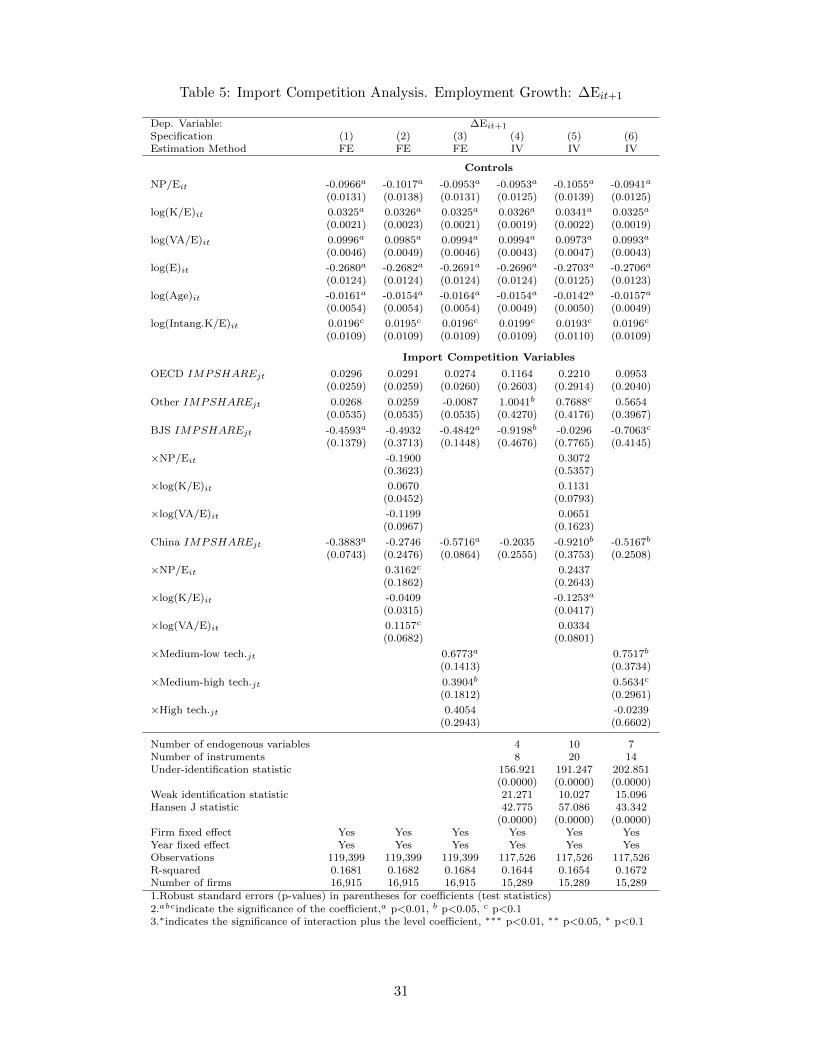
Table 5: Import Competition Analysis. Employment Growth: ∆Eit+1
Dep. Variable: ∆Eit+1
Specification (1) (2) (3) (4) (5) (6)Estimation Method FE FE FE IV IV IV
Controls
NP/Eit -0.0966a -0.1017a -0.0953a -0.0953a -0.1055a -0.0941a
(0.0131) (0.0138) (0.0131) (0.0125) (0.0139) (0.0125)
log(K/E)it 0.0325a 0.0326a 0.0325a 0.0326a 0.0341a 0.0325a
(0.0021) (0.0023) (0.0021) (0.0019) (0.0022) (0.0019)
log(VA/E)it 0.0996a 0.0985a 0.0994a 0.0994a 0.0973a 0.0993a
(0.0046) (0.0049) (0.0046) (0.0043) (0.0047) (0.0043)
log(E)it -0.2680a -0.2682a -0.2691a -0.2696a -0.2703a -0.2706a
(0.0124) (0.0124) (0.0124) (0.0124) (0.0125) (0.0123)
log(Age)it -0.0161a -0.0154a -0.0164a -0.0154a -0.0142a -0.0157a
(0.0054) (0.0054) (0.0054) (0.0049) (0.0050) (0.0049)
log(Intang.K/E)it 0.0196c 0.0195c 0.0196c 0.0199c 0.0193c 0.0196c
(0.0109) (0.0109) (0.0109) (0.0109) (0.0110) (0.0109)
Import Competition Variables
OECD IMPSHAREjt 0.0296 0.0291 0.0274 0.1164 0.2210 0.0953(0.0259) (0.0259) (0.0260) (0.2603) (0.2914) (0.2040)
Other IMPSHAREjt 0.0268 0.0259 -0.0087 1.0041b 0.7688c 0.5654(0.0535) (0.0535) (0.0535) (0.4270) (0.4176) (0.3967)
BJS IMPSHAREjt -0.4593a -0.4932 -0.4842a -0.9198b -0.0296 -0.7063c
(0.1379) (0.3713) (0.1448) (0.4676) (0.7765) (0.4145)
×NP/Eit -0.1900 0.3072(0.3623) (0.5357)
×log(K/E)it 0.0670 0.1131(0.0452) (0.0793)
×log(VA/E)it -0.1199 0.0651(0.0967) (0.1623)
China IMPSHAREjt -0.3883a -0.2746 -0.5716a -0.2035 -0.9210b -0.5167b
(0.0743) (0.2476) (0.0864) (0.2555) (0.3753) (0.2508)
×NP/Eit 0.3162c 0.2437(0.1862) (0.2643)
×log(K/E)it -0.0409 -0.1253a
(0.0315) (0.0417)
×log(VA/E)it 0.1157c 0.0334(0.0682) (0.0801)
×Medium-low tech.jt 0.6773a 0.7517b
(0.1413) (0.3734)
×Medium-high tech.jt 0.3904b 0.5634c
(0.1812) (0.2961)
×High tech.jt 0.4054 -0.0239(0.2943) (0.6602)
Number of endogenous variables 4 10 7Number of instruments 8 20 14Under-identification statistic 156.921 191.247 202.851
(0.0000) (0.0000) (0.0000)Weak identification statistic 21.271 10.027 15.096Hansen J statistic 42.775 57.086 43.342
(0.0000) (0.0000) (0.0000)Firm fixed effect Yes Yes Yes Yes Yes YesYear fixed effect Yes Yes Yes Yes Yes YesObservations 119,399 119,399 119,399 117,526 117,526 117,526R-squared 0.1681 0.1682 0.1684 0.1644 0.1654 0.1672Number of firms 16,915 16,915 16,915 15,289 15,289 15,2891.Robust standard errors (p-values) in parentheses for coefficients (test statistics)2.abcindicate the significance of the coefficient,a p<0.01, b p<0.05, c p<0.13.∗indicates the significance of interaction plus the level coefficient, ∗∗∗ p<0.01, ∗∗ p<0.05, ∗ p<0.1
31

Table 6: Import Competition Analysis. Firm Exit: Deathit+1
Dep. Variable: Deathit+1
Specification (1) (2) (3) (4) (5) (6)Estimation Method FE FE FE IV IV IV
Controls
NP/Eit -0.0008 -0.0012 -0.0010 -0.0005 0.0017 -0.0003(0.0047) (0.0050) (0.0047) (0.0044) (0.0049) (0.0044)
log(K/E)it -0.0040a -0.0027a -0.0039a -0.0040a -0.0031a -0.0040a
(0.0009) (0.0010) (0.0009) (0.0009) (0.0010) (0.0009)
log(VA/E)it -0.0287a -0.0289a -0.0286a -0.0288a -0.0272a -0.0288a
(0.0021) (0.0023) (0.0021) (0.0019) (0.0023) (0.0019)
log(E)it -0.0189a -0.0189a -0.0188a -0.0208a -0.0201a -0.0210a
(0.0047) (0.0047) (0.0047) (0.0043) (0.0043) (0.0043)
log(Age)it 0.0539a 0.0541a 0.0540a 0.0549a 0.0547a 0.0552a
(0.0030) (0.0030) (0.0030) (0.0028) (0.0028) (0.0028)
log(Intang.K/E)it 0.0075c 0.0075c 0.0075c 0.0063 0.0065 0.0060(0.0044) (0.0043) (0.0044) (0.0039) (0.0039) (0.0039)
Import Competition Variables
OECD IMPSHAREjt 0.0102 0.0104 0.0099 0.1614 0.1505 0.1884c
(0.0112) (0.0113) (0.0113) (0.1327) (0.1286) (0.1100)
Other IMPSHAREjt 0.0200 0.0172 0.0270 -0.6189a -0.4346c -0.5234b
(0.0223) (0.0222) (0.0223) (0.2351) (0.2257) (0.2172)
BJS IMPSHAREjt 0.0795 -0.1486 0.0949 0.5927b -0.1735 0.5994b
(0.0631) (0.1609) (0.0654) (0.2748) (0.3381) (0.2432)
×NP/Eit -0.1567 -0.0102(0.1367) (0.2066)
×log(K/E)it -0.0134 -0.0299(0.0249) (0.0402)
×log(VA/E)it -0.0647 -0.1616c
(0.0522) (0.0928)
China IMPSHAREjt 0.0006 -0.0398 0.0310 -0.2470 0.0193 -0.2167(0.0347) (0.1006) (0.0398) (0.1595) (0.1948) (0.1496)
×NP/Eit 0.1223 -0.0881(0.0884) (0.1359)
×log(K/E)it -0.0426b -0.0155(0.0171) (0.0231)
×log(VA/E)it 0.0515 0.0432(0.0324) (0.0430)
×Medium-low tech.jt -0.1621b∗∗ 0.2056(0.0658) (0.1821)
×Medium-high tech.jt 0.0259 0.4140b
(0.0937) (0.1960)
×High tech.jt -0.1340 -0.3244∗
(0.1260) (0.3339)
Number of endogenous variables 4 10 7Number of instruments 8 20 14Under-identification statistic 169.221 225.137 193.770
(0.0000) (0.0000) (0.0000)Weak identification statistic 25.822 12.968 15.826Hansen J statistic 1.395 23.006 3.005
(0.8450) (0.0107) (0.8845)Firm fixed effect Yes Yes Yes Yes Yes YesYear fixed effect Yes Yes Yes Yes Yes YesObservations 116,140 116,140 116,140 114,474 114,474 114,474R-squared 0.0261 0.0263 0.0261 0.0150 0.0200 0.0165Number of firms 17,366 17,366 17,366 15,891 15,891 15,8911.Robust standard errors (p-values) in parentheses for coefficients (test statistics)2.abcindicate the significance of the coefficient,a p<0.01, b p<0.05, c p<0.13.∗indicates the significance of interaction plus the level coefficient, ∗∗∗ p<0.01, ∗∗ p<0.05, ∗ p<0.1
32

Table 7: Firm-Level Outsourcing Analysis. Employment Growth (∆Eit+1) and Firm Exit(Deathit+1)
Dep. Variable ∆Eit+1 ∆Eit+1 ∆Eit+1 Deathit+1 Deathit+1 Deathit+1
Specification (1) (2) (3) (4) (5) (6)Estimation Method FE IV1 IV2 FE IV1 IV2
Controls (Import Competition Variables not Reported)
NP/Eit -0.0939a -0.0903a -0.0916a -0.0012 -0.0037 -0.0040(0.0132) (0.0130) (0.0129) (0.0047) (0.0044) (0.0043)
log(K/E)it 0.0318a 0.0314a 0.0314a -0.0036a -0.0033a -0.0033a
(0.0021) (0.0019) (0.0019) (0.0009) (0.0009) (0.0009)
log(VA/E)it 0.1073a 0.1154a 0.1154a -0.0320a -0.0377a -0.0375a
(0.0050) (0.0051) (0.0051) (0.0023) (0.0022) (0.0022)
log(E)it -0.2711a -0.2827a -0.2821a -0.0194a -0.0252a -0.0237a
(0.0123) (0.0107) (0.0104) (0.0047) (0.0043) (0.0042)
log(Age)it -0.0119b 0.0159b 0.0146b 0.0512a 0.0498a 0.0489a
(0.0055) (0.0064) (0.0061) (0.0030) (0.0034) (0.0032)
log(Intang.K/E)it 0.0184c 0.0067 0.0059 0.0074c 0.0039 0.0049(0.0109) (0.0086) (0.0084) (0.0044) (0.0039) (0.0038)
Firm-Level Outsourcing Variables
OECD OUTFINit 0.0079 -0.0119 -0.0101 -0.0026 0.0603b 0.0639a
(0.0258) (0.0487) (0.0475) (0.0116) (0.0249) (0.0246)
OECD OUTINTit 0.1008a 0.1276a 0.1296a -0.0178b 0.0009 -0.0006(0.0198) (0.0460) (0.0458) (0.0083) (0.0221) (0.0219)
Other OUTFINit 0.0664 0.1284 0.1596 -0.0457 -0.0744 -0.0804(0.0543) (0.1005) (0.0988) (0.0313) (0.0518) (0.0518)
Other OUTINTit 0.1083 0.1860 0.1478 0.0331 -0.0849 -0.0535(0.0979) (0.1817) (0.1777) (0.0382) (0.1301) (0.1256)
BJS OUTFINit -0.0824 0.2898 0.1753 -0.0045 0.0692 0.1147(0.1679) (0.4980) (0.4786) (0.0441) (0.1589) (0.1536)
BJS OUTINTit -0.0863 -0.4877 -0.4760 -0.0457 -0.2105 -0.2258(0.1479) (0.4229) (0.4223) (0.0933) (0.2282) (0.2236)
China OUTFINit -0.3111b -0.3050c -0.3182c -0.1079b -0.1684b -0.1739b
(0.1389) (0.1832) (0.1827) (0.0524) (0.0799) (0.0764)
China OUTINTit 0.0529 -0.0629 -0.0750 -0.0732 0.2885c 0.3152b
(0.1982) (0.2399) (0.2354) (0.0719) (0.1564) (0.1530)
Number of endogenous variables 12 8 12 8Number of instruments 32 24 32 24Under-identification statistic 180.346 30.995 178.640 31.330
(0.0000) (0.0200) (0.0000) (0.0182)Weak identification statistic 5.935 1.181 6.613 1.356Hansen J statistic 57.785 18.620 13.114 10.300
(0.0000) (0.2889) (0.8724) (0.8505)Firm fixed effect Yes Yes Yes Yes Yes YesYear fixed effect Yes Yes Yes Yes Yes YesObservations 118,717 112,490 112,742 115,437 108,919 109,114R-squared 0.1712 0.1660 0.1702 0.0266 0.0213 0.0272Number of firms 16,835 14,692 14,707 17,296 15,158 15,1711.FG indicates finished goods, IG indicates intermediate goods2.Coefficients for industry-level trade variables are not reported3.IV1 use IV’s for both firm- and industry-level imports4.IV2 only use IV’s for firm-level imports and treat industry imports as exogenous5.Firm level imports are measured by imports over turnover6.Robust standard errors (p-values) in parentheses for coefficients (test statistics)7.abcindicate the significance of the coefficient,a p<0.01, b p<0.05, c p<0.1
33

Table 8: Import Competition Analysis. Share of Non-Production Workers: NP/Eit+1
Dep. Variable: NP/Eit+1
Specification (1) (2) (3) (4)Estimation Method FE FE IV IV
Controls
log(K/E)it 0.0016c 0.0016c 0.0015b 0.0016b
(0.0009) (0.0009) (0.0006) (0.0006)
log(VA/E)it -0.0085a -0.0084a -0.0083a -0.0082a
(0.0016) (0.0016) (0.0013) (0.0013)
log(E)it 0.0263a 0.0268a 0.0271a 0.0274a
(0.0044) (0.0044) (0.0031) (0.0031)
log(Age)it -0.0005 -0.0005 -0.0001 -0.0001(0.0027) (0.0027) (0.0020) (0.0020)
log(Intang.K/E)it 0.0112a 0.0114a 0.0115a 0.0116a
(0.0039) (0.0040) (0.0027) (0.0027)
Import Competition Variables
OECD IMPSHAREjt -0.0142 -0.0130 -0.0288 -0.0155(0.0114) (0.0114) (0.1069) (0.0773)
Other IMPSHAREjt -0.0236 -0.0103 -0.0156 -0.0600(0.0228) (0.0228) (0.1681) (0.1577)
BJS IMPSHAREjt 0.1319c 0.1236c -0.0125 -0.0525(0.0688) (0.0703) (0.1749) (0.1537)
China IMPSHAREjt 0.0731b 0.1577a 0.2891a 0.3238a
(0.0357) (0.0445) (0.1118) (0.1065)
×Medium-low tech.jt -0.2514a -0.3949a
(0.0707) (0.1364)
×Medium-high tech.jt -0.3589a∗∗ -0.6805a∗∗∗
(0.1045) (0.1317)
×High tech.jt -0.0477 -0.6550b
(0.1435) (0.2980)
Number of endogenous variables 4 7Number of instruments 8 14Under-identification statistic 158.868 206.188
(0.0000) (0.0000)Weak identification statistic 21.459 15.308Hansen J statistic 4.436 12.855
(0.3502) (0.0757)Firm fixed effect Yes Yes Yes YesYear fixed effect Yes Yes Yes YesObservations 119,316 119,316 117,444 117,444R-squared 0.0195 0.0201 0.0184 0.0190Number of firms 16,889 16,889 15,267 15,2671.Robust standard errors (p-values) in parentheses for coefficients (test statistics)2.abcindicate the significance of the coefficient,a p<0.01, b p<0.05, c p<0.13.∗indicates the significance of interaction plus the level coefficient ∗∗∗, p<0.01,p<0.05, ∗ p<0.1
34

Table 9: Import Competition Analysis. Share of Skilled Workers: S/Eit+1
Dep. Variable: S/Eit+1
Specification (1) (2) (3) (4)Estimation Method FE FE IV IV
Controls
log(K/E)it 0.0199 0.0195 0.0187 0.0186(0.0176) (0.0176) (0.0147) (0.0147)
log(VA/E)it 0.0409 0.0413 0.0449c 0.0452c
(0.0284) (0.0284) (0.0241) (0.0241)
log(E)it 0.2039a 0.2048a 0.2090a 0.2093a
(0.0789) (0.0790) (0.0669) (0.0669)
log(Age)it -0.0461 -0.0457 -0.0561 -0.0527(0.0494) (0.0495) (0.0357) (0.0351)
log(Intang.K/E)it -0.0142 -0.0137 -0.0123 -0.0123(0.0128) (0.0128) (0.0119) (0.0120)
Import Competition Variables
OECD IMPSHAREjt -0.0411 -0.0432 -0.3874 -0.1898(0.0549) (0.0548) (0.3493) (0.2644)
Other IMPSHAREjt -0.1014 -0.1044 -2.2695a -2.3051a
(0.1697) (0.1672) (0.7345) (0.7019)
BJS IMPSHAREjt 0.1998 0.0443 0.6816 0.4830(0.3338) (0.3443) (0.4918) (0.5125)
China IMPSHAREjt 0.5492 0.8636c 1.8586a 2.0796a
(0.3413) (0.5067) (0.4978) (0.5631)
×Medium-low tech.jt -0.0517 0.6849(0.7464) (1.1999)
×Medium-high tech.jt -1.0516b -1.9155a
(0.5347) (0.5485)
×High tech.jt -0.8052 0.2824(0.5413) (1.0544)
Number of endogenous variables 4 7Number of instruments 8 14Under-identification statistic 48.547 64.185
(0.0000) (0.0000)Weak identification statistic 5.755 4.987Hansen J statistic 12.370 23.490
(0.0148) (0.0014)Firm fixed effect Yes Yes Yes YesYear fixed effect Yes Yes Yes YesObservations 20,056 20,056 19,935 19,935R-squared 0.3280 0.3281 0.3188 0.3201Number of firms 2,560 2,560 2,463 2,4631.Robust standard errors (p-values) in parentheses for coefficients (test statistics)2.abcindicate the significance of the coefficient,a p<0.01, b p<0.05, c p<0.13.∗indicates the significance of interaction plus the level coefficient ∗∗∗, p<0.01,p<0.05, ∗ p<0.1
35

Table 10: Firm-Level Outsourcing Analysis. Share of Non-Production (NP/Eit+1) and Shareof Skilled Workers (S/Eit+1)
Dep. Variable NP/Eit+1 NP/Eit+1 NP/Eit+1 S/Eit+1 S/Eit+1 S/Eit+1
Specification (1) (2) (3) (4) (5) (6)Estimation Method FE IV1 IV2 FE IV1 IV2
Controls (Import Competition Variables not Reported)
log(K/E)it 0.0017c 0.0014b 0.0015b 0.0182 0.0136 0.0149(0.0009) (0.0007) (0.0007) (0.0174) (0.0145) (0.0144)
log(VA/E)it -0.0102a -0.0108a -0.0111a 0.0456 0.0553b 0.0494b
(0.0016) (0.0014) (0.0014) (0.0293) (0.0250) (0.0247)
log(E)it 0.0259a 0.0272a 0.0267a 0.2014b 0.2015a 0.1967a
(0.0044) (0.0032) (0.0031) (0.0788) (0.0673) (0.0671)
log(Age)it -0.0030 -0.0031 -0.0040 -0.0410 -0.0441 -0.0353(0.0028) (0.0026) (0.0025) (0.0500) (0.0360) (0.0354)
log(Intang.K/E)it 0.0113a 0.0122a 0.0122a -0.0139 -0.0113 -0.0135(0.0039) (0.0028) (0.0028) (0.0127) (0.0122) (0.0119)
Firm-Level Outsourcing Variables
OECD OUTFINit 0.0460a 0.0990a 0.0928a 0.1440 0.3494b 0.2577c
(0.0128) (0.0208) (0.0202) (0.1053) (0.1621) (0.1553)
OECD OUTINTit -0.0018 0.0112 0.0077 0.1266b 0.4094b 0.3940b
(0.0076) (0.0158) (0.0157) (0.0644) (0.1883) (0.1870)
Other OUTFINit 0.0207 0.1053b 0.1106b -0.0906 -0.0802 -0.2264(0.0298) (0.0493) (0.0493) (0.1141) (0.1830) (0.1835)
Other OUTINTit 0.0770b 0.0043 0.0051 0.1501 -0.0943 0.0675(0.0318) (0.0741) (0.0737) (0.1278) (0.4419) (0.4143)
BJS OUTFINit 0.0627 0.5238b 0.5581b 0.8007 1.5001 1.7324(0.0717) (0.2343) (0.2406) (0.6109) (1.0666) (1.3139)
BJS OUTINTit 0.1106 0.0728 0.0926 0.2988 1.6237c 1.4384(0.0995) (0.1656) (0.1641) (0.3212) (0.8799) (0.8767)
China OUTFINit 0.1074c 0.1658b 0.2029a -0.1443 -0.7165 -0.5608(0.0553) (0.0693) (0.0688) (0.3911) (0.6576) (0.7116)
China OUTINTit 0.1722b 0.2618b 0.2727b -0.0500 -0.4062 -0.4041(0.0721) (0.1100) (0.1075) (0.2636) (0.4605) (0.3915)
Number of endogenous variables 12 8 12 8Number of instruments 32 24 32 24Under-identification statistic 180.203 30.493 77.875 28.208
(0.0000) (0.0230) (0.0000) (0.0426)Weak identification statistic 6.086 1.205 2.700 1.182Hansen J statistic 40.743 35.725 24.555 18.038
(0.0040) (0.0032) (0.2190) (0.3217)Firm fixed effect Yes Yes Yes Yes Yes YesYear fixed effect Yes Yes Yes Yes Yes YesObservations 118,629 112,390 112,643 20,036 19,897 19,921R-squared 0.0204 0.0184 0.0192 0.3296 0.3150 0.3273Number of firms 16,803 14,652 14,666 2,558 2,461 2,4611.FG indicates finished goods, IG indicates intermediate goods2.Coefficients for industry-level trade variables are not reported3.IV1 use IV’s for both firm- and industry-level imports4.IV2 only use IV’s for firm-level imports and treat industry imports as exogenous5.Firm level imports are measured by imports over turnover6.Robust standard errors (p-values) in parentheses for coefficients (test statistics)7.abcindicate the significance of the coefficient,a p<0.01, b p<0.05, c p<0.1
36

Figure 1: Import share of China and other low-wage countries over the period 1996-2007.
Figure 2: Belgian manufacturing employment in full time equivalent (FTE) over the period1996-2007.
37

Figure 3: Share of non-production workers in Belgian manufacturing over the period 1996-2007.
Figure 4: Share of skilled workers in Belgian manufacturing over the period 1996-2007.
38

Figure 5: Share of firms involved in outsourcing of final goods from China and LW countriesin Belgian manufacturing over the period 1996-2007.
Figure 6: Share of firms involved in outsourcing of intermediate goods from China and LWcountries in Belgian manufacturing over the period 1996-2007.
39

Figure 7: Breakdown of NACE industries depending on their technological intensity,
40
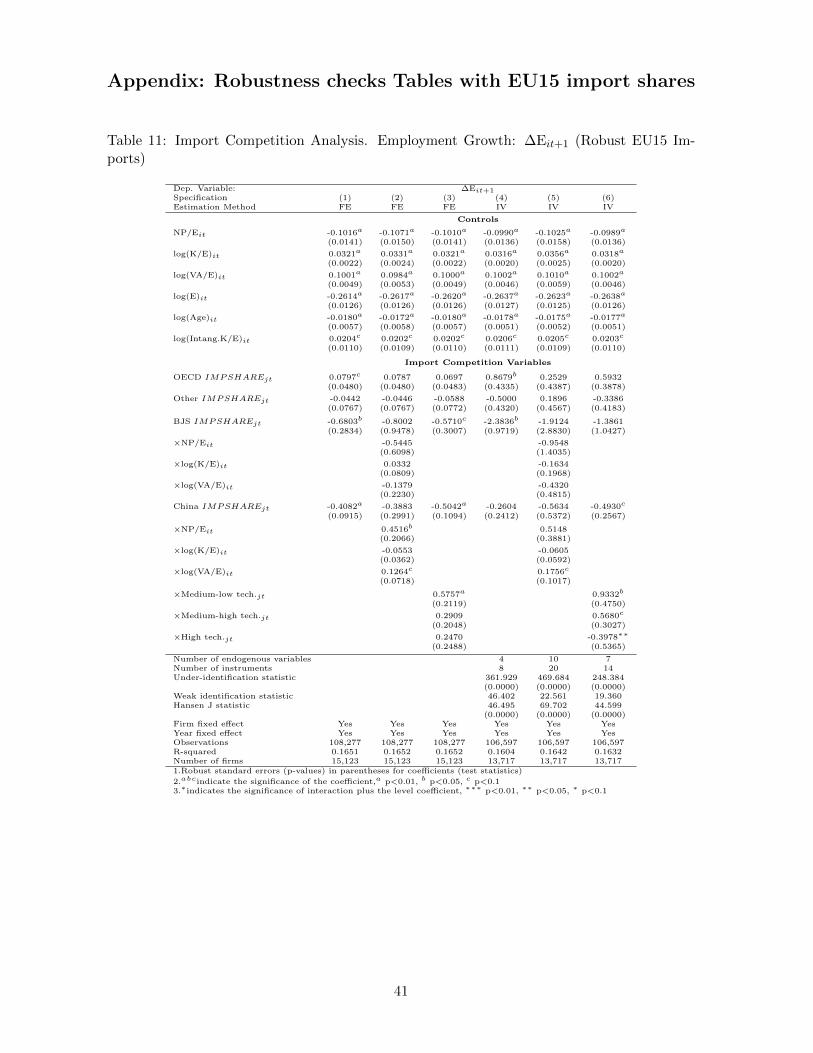
Appendix: Robustness checks Tables with EU15 import shares
Table 11: Import Competition Analysis. Employment Growth: ∆Eit+1 (Robust EU15 Im-ports)
Dep. Variable: ∆Eit+1Specification (1) (2) (3) (4) (5) (6)Estimation Method FE FE FE IV IV IV
Controls
NP/Eit -0.1016a -0.1071a -0.1010a -0.0990a -0.1025a -0.0989a
(0.0141) (0.0150) (0.0141) (0.0136) (0.0158) (0.0136)
log(K/E)it 0.0321a 0.0331a 0.0321a 0.0316a 0.0356a 0.0318a
(0.0022) (0.0024) (0.0022) (0.0020) (0.0025) (0.0020)
log(VA/E)it 0.1001a 0.0984a 0.1000a 0.1002a 0.1010a 0.1002a
(0.0049) (0.0053) (0.0049) (0.0046) (0.0059) (0.0046)
log(E)it -0.2614a -0.2617a -0.2620a -0.2637a -0.2623a -0.2638a
(0.0126) (0.0126) (0.0126) (0.0127) (0.0125) (0.0126)
log(Age)it -0.0180a -0.0172a -0.0180a -0.0178a -0.0175a -0.0177a
(0.0057) (0.0058) (0.0057) (0.0051) (0.0052) (0.0051)
log(Intang.K/E)it 0.0204c 0.0202c 0.0202c 0.0206c 0.0205c 0.0203c
(0.0110) (0.0109) (0.0110) (0.0111) (0.0109) (0.0110)
Import Competition Variables
OECD IMPSHAREjt 0.0797c 0.0787 0.0697 0.8679b 0.2529 0.5932(0.0480) (0.0480) (0.0483) (0.4335) (0.4387) (0.3878)
Other IMPSHAREjt -0.0442 -0.0446 -0.0588 -0.5000 0.1896 -0.3386(0.0767) (0.0767) (0.0772) (0.4320) (0.4567) (0.4183)
BJS IMPSHAREjt -0.6803b -0.8002 -0.5710c -2.3836b -1.9124 -1.3861(0.2834) (0.9478) (0.3007) (0.9719) (2.8830) (1.0427)
×NP/Eit -0.5445 -0.9548(0.6098) (1.4035)
×log(K/E)it 0.0332 -0.1634(0.0809) (0.1968)
×log(VA/E)it -0.1379 -0.4320(0.2230) (0.4815)
China IMPSHAREjt -0.4082a -0.3883 -0.5042a -0.2604 -0.5634 -0.4930c
(0.0915) (0.2991) (0.1094) (0.2412) (0.5372) (0.2567)
×NP/Eit 0.4516b 0.5148(0.2066) (0.3881)
×log(K/E)it -0.0553 -0.0605(0.0362) (0.0592)
×log(VA/E)it 0.1264c 0.1756c
(0.0718) (0.1017)
×Medium-low tech.jt 0.5757a 0.9332b
(0.2119) (0.4750)
×Medium-high tech.jt 0.2909 0.5680c
(0.2048) (0.3027)
×High tech.jt 0.2470 -0.3978∗∗
(0.2488) (0.5365)
Number of endogenous variables 4 10 7Number of instruments 8 20 14Under-identification statistic 361.929 469.684 248.384
(0.0000) (0.0000) (0.0000)Weak identification statistic 46.402 22.561 19.360Hansen J statistic 46.495 69.702 44.599
(0.0000) (0.0000) (0.0000)Firm fixed effect Yes Yes Yes Yes Yes YesYear fixed effect Yes Yes Yes Yes Yes YesObservations 108,277 108,277 108,277 106,597 106,597 106,597R-squared 0.1651 0.1652 0.1652 0.1604 0.1642 0.1632Number of firms 15,123 15,123 15,123 13,717 13,717 13,7171.Robust standard errors (p-values) in parentheses for coefficients (test statistics)
2.abcindicate the significance of the coefficient,a p<0.01, b p<0.05, c p<0.13.∗indicates the significance of interaction plus the level coefficient, ∗∗∗ p<0.01, ∗∗ p<0.05, ∗ p<0.1
41

Table 12: Import Competition Analysis. Firm Exit: Deathit+1 (Robust EU15 Imports)
Dep. Variable: Deathit+1Specification (1) (2) (3) (4) (5) (6)Estimation Method FE FE FE IV IV IV
Controls
NP/Eit -0.0010 -0.0008 -0.0010 -0.0019 -0.0034 -0.0024(0.0050) (0.0054) (0.0050) (0.0046) (0.0054) (0.0046)
log(K/E)it -0.0039a -0.0021b -0.0039a -0.0037a -0.0016 -0.0037a
(0.0010) (0.0011) (0.0010) (0.0009) (0.0012) (0.0009)
log(VA/E)it -0.0281a -0.0287a -0.0281a -0.0282a -0.0303a -0.0283a
(0.0022) (0.0025) (0.0022) (0.0020) (0.0025) (0.0020)
log(E)it -0.0182a -0.0181a -0.0182a -0.0177a -0.0179a -0.0176a
(0.0047) (0.0047) (0.0047) (0.0042) (0.0042) (0.0043)
log(Age)it 0.0523a 0.0526a 0.0523a 0.0526a 0.0530a 0.0523a
(0.0032) (0.0032) (0.0032) (0.0029) (0.0029) (0.0029)
log(Intang.K/E)it 0.0070 0.0069 0.0069 0.0070c 0.0071c 0.0069c
(0.0043) (0.0043) (0.0043) (0.0039) (0.0039) (0.0039)
Import Competition Variables
OECD IMPSHAREjt 0.0073 0.0063 0.0046 -0.1641 0.0034 -0.4062b
(0.0231) (0.0231) (0.0234) (0.2512) (0.2357) (0.2070)
Other IMPSHAREjt -0.0096 -0.0086 -0.0097 0.2426 0.0271 0.3554(0.0250) (0.0251) (0.0250) (0.2441) (0.2403) (0.2531)
BJS IMPSHAREjt 0.1363 -0.1134 0.1591 1.0210 -0.3585 1.8134b
(0.1175) (0.3126) (0.1220) (0.7016) (0.6633) (0.7216)
×NP/Eit -0.4266c 0.7217(0.2542) (0.4604)
×log(K/E)it -0.0443 -0.2514a
(0.0425) (0.0906)
×log(VA/E)it -0.0528 0.2651(0.0903) (0.1626)
China IMPSHAREjt -0.0069 -0.1110 -0.0206 -0.1334 0.1341 -0.3173c
(0.0413) (0.1156) (0.0477) (0.1688) (0.2267) (0.1757)
×NP/Eit 0.1954c -0.2194(0.1005) (0.1729)
×log(K/E)it -0.0510b 0.0265(0.0199) (0.0297)
×log(VA/E)it 0.0538 -0.0383(0.0360) (0.0511)
×Medium-low tech.jt -0.2050c∗∗ -0.1309∗
(0.1091) (0.2178)
×Medium-high tech.jt 0.0810 0.4164b
(0.1050) (0.2070)
×High tech.jt 0.1579 0.6886b∗
(0.1242) (0.3171)
Number of endogenous variables 4 10 7Number of instruments 8 20 14Under-identification statistic 185.995 271.800 174.608
(0.0000) (0.0000) (0.0000)Weak identification statistic 26.614 15.186 13.393Hansen J statistic 13.991 35.103 13.548
(0.0073) (0.0001) (0.0598)Firm fixed effect Yes Yes Yes Yes Yes YesYear fixed effect Yes Yes Yes Yes Yes YesObservations 105,206 105,206 105,206 103,743 103,743 103,743R-squared 0.0261 0.0265 0.0262 0.0238 0.0253 0.0184Number of firms 15,509 15,509 15,509 14,263 14,263 14,2631.Robust standard errors (p-values) in parentheses for coefficients (test statistics)
2.abcindicate the significance of the coefficient,a p<0.01, b p<0.05, c p<0.13.∗indicates the significance of interaction plus the level coefficient, ∗∗∗ p<0.01, ∗∗ p<0.05, ∗ p<0.1
42

Table 13: Firm-Level Outsourcing Analysis. Employment Growth (∆Eit+1) and Firm Exit(Deathit+1): Robust EU15 Imports
Dep. Variable ∆Eit+1 ∆Eit+1 ∆Eit+1 Deathit+1 Deathit+1 Deathit+1Specification (1) (2) (3) (4) (5) (6)Estimation Method FE IV1 IV2 FE IV1 IV2
Controls (Import Competition Variables not Reported)
NP/Eit -0.0991a -0.0961a -0.0988a -0.0011 -0.0046 -0.0039(0.0141) (0.0140) (0.0139) (0.0050) (0.0046) (0.0045)
log(K/E)it 0.0314a 0.0303a 0.0307a -0.0036a -0.0033a -0.0034a
(0.0021) (0.0020) (0.0020) (0.0010) (0.0009) (0.0009)
log(VA/E)it 0.1068a 0.1144a 0.1143a -0.0312a -0.0361a -0.0360a
(0.0053) (0.0054) (0.0054) (0.0024) (0.0023) (0.0023)
log(E)it -0.2647a -0.2776a -0.2759a -0.0185a -0.0223a -0.0225a
(0.0125) (0.0108) (0.0106) (0.0047) (0.0042) (0.0042)
log(Age)it -0.0142b 0.0095 0.0085 0.0496a 0.0482a 0.0481a
(0.0059) (0.0065) (0.0065) (0.0032) (0.0034) (0.0034)
log(Intang.K/E)it 0.0192c 0.0071 0.0065 0.0069 0.0045 0.0046(0.0109) (0.0086) (0.0084) (0.0043) (0.0038) (0.0038)
Firm-Level Outsourcing Variables
OECD OUTFINit 0.0140 -0.0144 -0.0012 -0.0032 0.0570b 0.0578b
(0.0256) (0.0506) (0.0478) (0.0117) (0.0276) (0.0246)
OECD OUTINTit 0.0991a 0.1372a 0.1360a -0.0179b -0.0024 -0.0027(0.0199) (0.0479) (0.0464) (0.0085) (0.0236) (0.0222)
Other OUTFINit 0.0702 0.1791c 0.1625 -0.0438 -0.0805 -0.0790(0.0548) (0.0994) (0.0994) (0.0316) (0.0521) (0.0520)
Other OUTINTit 0.1170 0.1720 0.1748 0.0346 -0.0338 -0.0467(0.1010) (0.1833) (0.1829) (0.0396) (0.1307) (0.1297)
BJS OUTFINit -0.0822 0.1620 0.1316 -0.0053 0.1363 0.1151(0.1683) (0.4635) (0.4718) (0.0446) (0.1586) (0.1535)
BJS OUTINTit -0.0713 -0.4605 -0.4490 -0.0452 -0.2625 -0.2325(0.1470) (0.4220) (0.4223) (0.0934) (0.2236) (0.2242)
China OUTFINit -0.3160b -0.3022c -0.3188c -0.1091b -0.1746b -0.1741b
(0.1345) (0.1815) (0.1816) (0.0522) (0.0777) (0.0757)
China OUTINTit 0.0694 -0.0603 -0.0409 -0.0781 0.2978b 0.2882c
(0.2027) (0.2453) (0.2443) (0.0738) (0.1502) (0.1497)
Number of endogenous variables 12 8 12 8Number of instruments 32 24 32 24Under-identification statistic 443.504 30.742 242.704 31.478
(0.0000) (0.0215) (0.0000) (0.0175)Weak identification statistic 17.830 1.182 11.129 1.363Hansen J statistic 57.689 16.523 18.507 10.233
(0.0000) (0.4171) (0.5541) (0.8542)Firm fixed effect Yes Yes Yes Yes Yes YesYear fixed effect Yes Yes Yes Yes Yes YesObservations 107,684 102,370 102,651 104,595 99,085 99,308R-squared 0.1679 0.1631 0.1668 0.0267 0.0264 0.0272Number of firms 15,050 13,222 13,239 15,447 13,661 13,6761.FG indicates finished goods, IG indicates intermediate goods2.Coefficients for industry-level trade variables are not reported3.IV1 use IV’s for both firm- and industry-level imports4.IV2 only use IV’s for firm-level imports and treat industry imports as exogenous5.Firm level imports are measured by imports over turnover6.Robust standard errors (p-values) in parentheses for coefficients (test statistics)
7.abcindicate the significance of the coefficient,a p<0.01, b p<0.05, c p<0.1
43

Table 14: Import Competition Analysis. Share of Non-Production Workers: NP/Eit+1 (Ro-bust EU15 Imports)
Dep. Variable: NP/Eit+1Specification (1) (2) (3) (4)Estimation Method FE FE IV IV
Controls
log(K/E)it 0.0020b 0.0020b 0.0021a 0.0020a
(0.0009) (0.0009) (0.0007) (0.0007)
log(VA/E)it -0.0060a -0.0059a -0.0059a -0.0058a
(0.0016) (0.0016) (0.0013) (0.0013)
log(E)it 0.0253a 0.0259a 0.0265a 0.0268a
(0.0044) (0.0045) (0.0031) (0.0031)
log(Age)it -0.0030 -0.0029 -0.0024 -0.0024(0.0029) (0.0029) (0.0020) (0.0020)
log(Intang.K/E)it 0.0118a 0.0121a 0.0120a 0.0124a
(0.0039) (0.0040) (0.0028) (0.0027)
Import Competition Variables
OECD IMPSHAREjt -0.0403b -0.0295c -0.5015a -0.2369(0.0174) (0.0175) (0.1866) (0.1580)
Other IMPSHAREjt 0.0269 0.0401c 0.6155a 0.4597b
(0.0226) (0.0230) (0.1945) (0.1785)
BJS IMPSHAREjt 0.2114c 0.1132 0.8957b -0.0124(0.1221) (0.1264) (0.4008) (0.4402)
China IMPSHAREjt 0.1026b 0.1854a 0.1751c 0.3818a
(0.0477) (0.0560) (0.1020) (0.1129)
×Medium-low tech.jt -0.3244a -0.6451a
(0.1132) (0.1614)
×Medium-high tech.jt -0.4286a∗∗ -0.7210a∗∗∗
(0.1215) (0.1368)
×High tech.jt -0.1581 -0.3618(0.1438) (0.2257)
Number of endogenous variables 4 7Number of instruments 8 14Under-identification statistic 339.737 242.889
(0.0000) (0.0000)Weak identification statistic 45.080 19.009Hansen J statistic 17.365 13.431
(0.0016) (0.0623)Firm fixed effect Yes Yes Yes YesYear fixed effect Yes Yes Yes YesObservations 108,217 108,217 106,536 106,536R-squared 0.0172 0.0178 0.0002 0.0118Number of firms 15,101 15,101 13,697 13,6971.Robust standard errors (p-values) in parentheses for coefficients (test statistics)
2.abcindicate the significance of the coefficient,a p<0.01, b p<0.05, c p<0.13.∗indicates the significance of interaction plus the level coefficient ∗∗∗, p<0.01,p<0.05, ∗ p<0.1
44

Table 15: Import Competition Analysis. Share of Skilled Workers: S/Eit+1 (Robust EU15Imports)
Dep. Variable: S/Eit+1Specification (1) (2) (3) (4)Estimation Method FE FE IV IV
Controls
log(K/E)it 0.0216 0.0213 0.0199 0.0199(0.0184) (0.0184) (0.0152) (0.0152)
log(VA/E)it 0.0400 0.0401 0.0409c 0.0397c
(0.0288) (0.0288) (0.0240) (0.0239)
log(E)it 0.2045b 0.2057b 0.2070a 0.2069a
(0.0802) (0.0802) (0.0682) (0.0680)
log(Age)it -0.0460 -0.0448 -0.0548 -0.0493(0.0503) (0.0503) (0.0357) (0.0353)
log(Intang.K/E)it -0.0148 -0.0141 -0.0138 -0.0136(0.0130) (0.0130) (0.0125) (0.0124)
Import Competition Variables
OECD IMPSHAREjt 0.0087 0.0198 -0.4520 -0.4840(0.0673) (0.0683) (0.7754) (0.6540)
Other IMPSHAREjt -0.0075 0.0070 -0.7593 -0.1927(0.0938) (0.0931) (1.1224) (1.0348)
BJS IMPSHAREjt 0.5608 0.4041 3.0185 1.5828(0.5676) (0.6155) (2.2692) (2.1392)
China IMPSHAREjt 0.5951c 0.9952c 0.6074 1.1318c
(0.3165) (0.5407) (0.5813) (0.5879)
×Medium-low tech.jt -0.3621 -2.2835(0.6015) (2.6313)
×Medium-high tech.jt -1.0753c -1.3977b
(0.5562) (0.6107)
×High tech.jt -0.6178 0.7927∗∗∗
(0.5601) (0.6934)
Number of endogenous variables 4 7Number of instruments 8 14Under-identification statistic 180.321 209.659
(0.0000) (0.0000)Weak identification statistic 23.524 18.840Hansen J statistic 9.185 10.193
(0.0566) (0.1779)Firm fixed effect Yes Yes Yes YesYear fixed effect Yes Yes Yes YesObservations 19,602 19,602 19,454 19,454R-squared 0.3287 0.3289 0.3242 0.3261Number of firms 2,505 2,505 2,406 2,4061.Robust standard errors (p-values) in parentheses for coefficients (test statistics)
2.abcindicate the significance of the coefficient,a p<0.01, b p<0.05, c p<0.13.∗indicates the significance of interaction plus the level coefficient ∗∗∗, p<0.01,p<0.05, ∗ p<0.1
45

Table 16: Firm-Level Outsourcing Analysis. Share of Non-Production (NP/Eit+1) and Shareof Skilled Workers (S/Eit+1): Robust EU15 Imports
Dep. Variable NP/Eit+1 NP/Eit+1 NP/Eit+1 S/Eit+1 S/Eit+1 S/Eit+1Specification (1) (2) (3) (4) (5) (6)Estimation Method FE IV1 IV2 FE IV1 IV2
Controls (Import Competition Variables not Reported)
log(K/E)it 0.0021b 0.0019a 0.0018a 0.0199 0.0154 0.0164(0.0009) (0.0007) (0.0007) (0.0182) (0.0151) (0.0150)
log(VA/E)it -0.0072a -0.0074a -0.0078a 0.0447 0.0486c 0.0487c
(0.0017) (0.0015) (0.0015) (0.0296) (0.0249) (0.0249)
log(E)it 0.0251a 0.0265a 0.0256a 0.2019b 0.2003a 0.1967a
(0.0044) (0.0033) (0.0031) (0.0800) (0.0689) (0.0683)
log(Age)it -0.0050c -0.0043c -0.0052b -0.0404 -0.0465 -0.0341(0.0030) (0.0026) (0.0026) (0.0509) (0.0370) (0.0361)
log(Intang.K/E)it 0.0119a 0.0127a 0.0127a -0.0145 -0.0130 -0.0143(0.0039) (0.0029) (0.0028) (0.0129) (0.0125) (0.0121)
Firm-Level Outsourcing Variables
OECD OUTFINit 0.0472a 0.0937a 0.0960a 0.1352 0.3584b 0.2514(0.0129) (0.0215) (0.0204) (0.1077) (0.1745) (0.1588)
OECD OUTINTit -0.0010 0.0233 0.0141 0.1326b 0.3162c 0.4196b
(0.0076) (0.0168) (0.0157) (0.0666) (0.1897) (0.1956)
Other OUTFINit 0.0171 0.0887c 0.1085b -0.0905 -0.2869 -0.2371(0.0299) (0.0497) (0.0495) (0.1155) (0.2024) (0.1862)
Other OUTINTit 0.0741b 0.0011 -0.0034 0.1331 -0.0076 0.0503(0.0324) (0.0720) (0.0749) (0.1361) (0.4589) (0.4558)
BJS OUTFINit 0.0657 0.5211b 0.5762b 0.8196 1.5988 1.7165(0.0725) (0.2359) (0.2438) (0.6256) (1.2021) (1.3042)
BJS OUTINTit 0.1052 0.0908 0.0846 0.2289 1.0330 1.3026(0.0982) (0.1624) (0.1634) (0.3091) (0.8483) (0.8750)
China OUTFINit 0.1135b 0.1893a 0.2137a -0.1392 -0.5321 -0.5248(0.0560) (0.0691) (0.0697) (0.3943) (0.6640) (0.7099)
China OUTINTit 0.1793b 0.3259a 0.3094a -0.0183 -0.1494 -0.2077(0.0728) (0.1090) (0.1067) (0.2994) (0.5057) (0.5063)
Number of endogenous variables 12 8 12 8Number of instruments 32 24 32 24Under-identification statistic 419.407 30.584 171.866 28.319
(0.0000) (0.0224) (0.0000) (0.0413)Weak identification statistic 12.805 1.215 6.098 1.175Hansen J statistic 56.815 36.786 25.862 18.092
(0.0000) (0.0022) (0.1704) (0.3185)Firm fixed effect Yes Yes Yes Yes Yes YesYear fixed effect Yes Yes Yes Yes Yes YesObservations 107,619 102,295 102,577 19,583 19,418 19,469R-squared 0.0182 0.0014 0.0164 0.3304 0.3219 0.3279Number of firms 15,022 13,193 13,209 2,503 2,404 2,4061.FG indicates finished goods, IG indicates intermediate goods2.Coefficients for industry-level trade variables are not reported3.IV1 use IV’s for both firm- and industry-level imports4.IV2 only use IV’s for firm-level imports and treat industry imports as exogenous5.Firm level imports are measured by imports over turnover6.Robust standard errors (p-values) in parentheses for coefficients (test statistics)
7.abcindicate the significance of the coefficient,a p<0.01, b p<0.05, c p<0.1
46

CENTRE FOR ECONOMIC PERFORMANCE Recent Discussion Papers
1037 William Brown David Marsden
Individualisation and Growing Diversity of Employment Relationships
1036 John Van Reenen Does Competition Raise Productivity through Improving Management Quality?
1035 Florence Kondylis Marco Manacorda
School Proximity and Child Labor Evidence from Rural Tanzania
1034 Lars Boerner Albrecht Ritschl
Communal Responsibility and the Coexistence of Money and Credit under Anonymous Matching
1033 Gianluca Benigno Pierpaolo Benigno Salvatore Nisticó
Second-Order Approximation of Dynamic Models with Time-Varying Risk
1032 Gianluca Benigno Chuigang Chen Christopher Otrok Alessandro Rebucci Eric R. Young
Financial Crises and Macro-Prudential Policies
1031 Dennis Novy International Trade without CES: Estimating Translog Gravity
1030 Alex Bryson John Forth
The Evolution of the Modern Worker: Attitudes to Work
1029 Fabrice Defever The Spatial Organization of Multinational Firms
1028 Elhanan Helpman Oleg Itskhoki Stephen Redding
Trade and Labor Market Outcomes
1027 Nicholas Oulton Long Term Implications of the ICT Revolution: Applying the Lessons of Growth Theory and Growth Accounting
1026 Maarten Goos Alan Manning Anna Salomons
Explaining Job Polarization in Europe: the Roles of Technology, Globalization and Institutions
1025 David H. Autor Alan Manning Christopher L. Smith
The Contribution of the Minimum Wage to U.S. Wage Inequality over Three Decades: A Reassessment
1024 Pascal Michaillat Do Matching Frictions Explain Unemployment? Not in Bad Times

1023 Friederike Niepmann Tim Schmidt-Eisenlohr
Bank Bailouts, International Linkages and Cooperation
1022 Bianca De Paoli Hande Küçük-Tuger Jens Søndergaard
Monetary Policy Rules and Foreign Currency Positions
1021 Monika Mrázová David Vines Ben Zissimos
Is the WTO Article XXIV Bad?
1020 Gianluca Benigno Huigang Chen Chris Otrok Alessandro Rebucci Eric Young
Revisiting Overborrowing and its Policy Implications
1019 Alex Bryson Babatunde Buraimo Rob Simmons
Do Salaries Improve Worker Performance?
1018 Radha Iyengar The Impact of Asymmetric Information Among Competing Insurgent Groups: Estimating an ‘Emboldenment’ Effect
1017 Radha Iyengar I’d Rather be Hanged for a Sheep than a Lamb The Unintended Consequences of ‘Three-Strikes’ Laws
1016 Ethan Ilzetzki Enrique G. Mendoza Carlos A. Végh
How Big (Small?) are Fiscal Multipliers?
1015 Kerry L. Papps Alex Bryson Rafael Gomez
Heterogeneous Worker Ability and Team-Based Production: Evidence from Major League Baseball, 1920-2009
1014 Kosuke Aoki Gianluca Benigno Nobuhiro Kiyotaki
Adjusting to Capital Account Liberalization
1013 Luis Garicano Yanhui Wu
A Task-Based Approach to Organization: Knowledge, Communication and Structure
1012 Olivier Marie Police and Thieves in the Stadium: Measuring the (Multiple) Effects of Football Matches on Crime
1011 Erling Barth Alex Bryson Harald Dale-Olsen
Do Higher Wages Come at a Price?
The Centre for Economic Performance Publications Unit Tel 020 7955 7284 Fax 020 7955 7595
Email [email protected] Web site http://cep.lse.ac.uk