imported technology and manufacturing employment in ethiopia
TRANSCRIPT

ORIGINAL PAPER
Imported technology and manufacturing employmentin Ethiopia
Getinet Haile1,4 • Ilina Srour2 • Marco Vivarelli2,3,4
Received: 28 September 2015 / Revised: 26 January 2016 /Accepted: 24 March 2016 /
Published online: 17 May 2016
� The Author(s) 2016. This article is published with open access at Springerlink.com
Abstract There is a dearth of research on the impact of technological change over
employment in least developed countries (LDCs) embarking on globalization and
consequent international technological transfer. Using a panel of 1940 Ethiopian
firms over the period 1996–2004 and deploying GMM-SYS estimates, this paper
aims to establish the role played by trade, FDI and technology in affecting
employment and skills. The results obtained lend support to a labour–augmenting
effect. Moreover, the implemented two-equation dynamic framework provides
evidence of a skill-bias specific to those enterprises with higher share of foreign
ownership and located in the vicinity of the capital city.
Keywords Employment � Skills � Globalization � FDI � Trade � Technologicalchange � Ethiopia
JEL Classifications J21 � O33 � J24
Ilina would like to thank the University of Nottingham for the academic and institutional support she
received during her visit in summer 2013, which made possible undertaking some of the empirical
analysis in this paper. The usual disclaimer applies.
& Getinet Haile
1 University of Nottingham, Jubilee Campus, Wollaton Road, NG8 1BB Nottingham, UK
2 Universita Cattolica del Sacro Cuore, Milano, Piacenza, Italy
3 SPRU, University of Sussex, Brighton, UK
4 Institute for the Study of Labour (IZA), Bonn, Germany
123
Eurasian Bus Rev (2017) 7:1–23
DOI 10.1007/s40821-016-0051-7
1 Introduction
Economic theory acknowledges the key role played by technology in stimulating
economic progress and development. However, the consequences of technological
change and its direct and indirect impacts on the dynamics of labour markets remain
a matter of debate. A large body of literature has studied the effect of technological
progress on employment in developed countries, the leaders in technological
innovation. Developing countries, viewed as followers in terms of technology and
innovation, have also had a significant share of this literature, particularly on the
effect of technology transfers on employment and skill distribution. However, the
impact of technology on labour is much less well-known in the least developed
countries (LDCs) that have liberalized their trade and have opened their economies
to direct technological imports or embodied technological transfers.
Technological progress is very slow in LDCs, and most of them rank poorly on
various international technology and innovation indices such as the Technological
Achievement Index, and the Innovation Capability Index (UNCTAD 2007).
However, as many of these countries have adopted trade liberalisation policies
over the past few decades, they face a major challenge enhancing the knowledge
and technology intensity of their economies to be able to compete in national and
international markets. In a study on technology transfer and skill accumulation in
LDCs, Mayer (2000) shows that, overall, technological integration of LDCs has
increased, though the disparities between the different countries are quite
significant. However, he argues that LDCs need human capital to better exploit
their improved access to technology, as well as instituting adequate economic
policies and supporting institutions that promote modern technology that LDCs can
import.
Within this context, the present paper aims to study the effect of imported
technology on manufacturing employment in Ethiopia over the period 1996–2004.
The paper also investigates the existence of skill biased technological change.
Ethiopia is one of the least developed countries in the world today. It adopted a
national structural adjustment program in 1991 and moved away from an import-
substitution strategy adopting a relatively open trade system. Therefore, it provides
a suitable setting for studying the effect of imported technology on employment and
to test the hypothesis of imported technology and skill bias.
The paper has three main novelties vis-a-vis previous literature in the area.
First, it is one of the few papers studying the impact of trade openness and
technology transfer in an LDC context. Second to our knowledge—it is the first
paper investigating these issues in the Ethiopian context. Third, it deploys an
empirical strategy, which jointly assess the quantitative and qualitative (both
absolute and relative skill bias, see Sect. 5) impact of globalization and
technology transfer.
The rest of the paper is organized into six sections. Section 2 discusses the
relevant literature. Section 3 sheds light on the process of trade liberalization in
Ethiopia and presents some descriptive evidence on the manufacturing sector and its
employment evolution. Section 4 presents the data used in the empirical analysis.
2 Eurasian Bus Rev (2017) 7:1–23
123

Section 5 specifies the empirical model and defines the variables used in the
regression analysis. Section 6 presents and discusses the results obtained before the
final section concludes the paper with a summary of the main findings and their
implications.
2 The literature
Technological change allows producing the same level of output with lower level of
inputs, namely capital and labour. The literature on the complementarity between
technological change and the employment of skilled labour has put forward the
hypothesis of ‘‘skill biased technological change’’ (SBTC), which was initially
proposed by Griliches (1969) and Welch (1970). The hypothesis supports the view
that new technologies—to be implemented effectively and efficiently—require
suitable skills. Berman et al. (1994) provided the earliest evidence on the existence
of strong correlations between within industry skill upgrading and increased
investment in both computer technology and R&D in the US manufacturing sector
between 1979 and 1989. A number of subsequent empirical studies confirmed the
occurrence of a widespread SBTC in the US (see Autor et al. 1998; Katz and Autor
1999); France (Caroli and Van Reenen 2001); Spain (Aguirregabiria and Alonso-
Borrego 2001); Italy (Piva et al. 2005) and other OECD countries (Machin and Van
Reenen 1998). While most of the literature on the employment impacts of
technological change centred on developed economies, recently some attention has
also been devoted to middle-income and low-income developing countries (DCs).
2.1 Innovation and employment
Technological change in DCs is mainly imported and innovation is inherently linked
to trade, foreign direct investments (FDI) and consequent international technology
transfer (Acemoglu 2003; Piva 2003; Keller 2004). Globalization can imply a
substantial technological up-grading in DCs through opening different channels. On
the one hand, a developing country can implement embodied technological change
(ETC) through the importation of ‘‘mature’’ machineries (including second-hand
capital goods, see Barba Navaretti et al. 1998) from more industrialized countries.
On the other hand, a late starter DC can enjoy the ‘‘last comer’’ benefit of jumping
directly on a relatively new technology (Perkins and Neumayer 2005; Mitra and Jha
2015).1
In addition to their direct effect through ETC, imports and FDI inflows may
generate technological spillovers in favour of domestic firms which can absorb new
imported technologies through labour mobility, input–output relationships and
reverse engineering (see Coe and Helpman 1995; Coe et al. 1997). Technological
catch-up may also be induced by exporting to richer countries both through
substituting/replacing outdated technologies in the exporting sectors, and through
1 An example can be the diffusion of mobile telecommunications in Sub-Sahara African countries, where
the traditional telephone networks are largely limited to urban areas.
Eurasian Bus Rev (2017) 7:1–23 3
123

the development of entirely new businesses characterized by process and product
innovations (see Gkypali et al. 2015). The aim here is satisfying a more
sophisticated demand coming from the industrialized countries (‘‘learning by
exporting’’, see Keller 2001; Epifani 2003; Melitz 2003; Yeaple 2005).
All in all, technology transfer in favour of DCs involves productivity gains2
which can be harmful to the local DC’s employment level. In particular, the
dominant role of the imported ETC implying labour-saving process innovation can
drastically reduce the domestic demand for labour. However, as discussed in Taylor
(2004), the final employment outcome depends on the balance between labour
productivity gains and output growth induced by domestic demand, trade and FDI.3
2.2 Skill-biased technological change
From a theoretical perspective both globalization (through the Heckscher-Ohlin
theorem and its Stolper-Samuelson corollary, HOSS hereinafter) and technological
change can be responsible for the observed pattern of increased relative demand for
skilled labour in the developing world. Two processes are supposed to have opposite
effects in this regard (see Lee and Vivarelli 2004, 2006a, b for an extensive
analysis). On the one hand new technologies shift the labour demand in favour of
more skilled workers. On the other hand, the HOSS mechanism predicts that a DC
trading with skill-abundant richer economies should specialize in the production of
unskilled-labour intensive goods, and therefore experience a relative increase in the
demand for unskilled labour.
However, if the HOSS assumption of homogeneous production functions and
identical technologies between countries is relaxed, then international openness may
facilitate technology transfer from industrialized to developing countries. This
implies that globalization and technological change are complementary rather than
alternative mechanisms, resulting in an increase in the demand for skilled workers
(see Lee and Vivarelli 2004, 2006b). Robbins (1996, 2003) and Robbins and
Gindling (1999) call the effect of in-flowing technology resulting from trade
liberalization the ‘‘skill-enhancing trade (SET) hypothesis’’. According to this
hypothesis, trade accelerates the flows of physical capital (and embodied
technology) to the South, inducing rapid adaptation to the skill-intensive technolo-
gies currently used in the North.
While a large body of the literature documented the relevance of the SBTC
hypothesis for advanced countries, there is a dearth of empirical evidence for
developing countries. Berman and Machin (2000, 2004) found evidence that SBTC
has taken place rapidly from the developed world to at least the middle-income
DCs. Meschi and Vivarelli (2009) also found a significant inequality-enhancing
effect of trade with more advanced countries on middle-income DCs, possibly
2 On this the empirical evidence is unequivocal, see, for instance: (Coe and Helpman 1995; Helpman and
Homaister, 1997; Mayer 2000; Schiff and Wang 2006).3 In his study, Taylor (2004) found out that in seven DCs out of eleven, output per capita in the traded
goods sectors grew less rapidly than labour productivity, so implying job losses.
4 Eurasian Bus Rev (2017) 7:1–23
123

related to technological transfer and skill-enhancing trade. Almeida (2009) reached
similar conclusions using firm-level data for East Asia.4
The evidence from country-specific studies also points to the link between trade,
FDI, technology transfer and skill-upgrading. For instance, Hanson and Harrison
(1999), using data on Mexican manufacturing plants, found that firms receiving FDI
acquire technology through licensing agreements or imported materials, and tend to
hire more skilled workers (see also Feenstra and Hanson 1997). Similarly,
Fajnzylber and Fernandes (2009) found that increased levels of international
integration were associated with an increased demand for skilled labour in a cross-
section of Brazilian firms. Gorg and Strobl (2002) analysed a panel of manufac-
turing firms in Ghana over the ’90 s; their estimates revealed that while the purchase
of foreign machinery for technological purposes significantly raised the relative
demand for skilled labour, a greater participation in world markets via exporting
activities was not found to have any effect.
Other studies have instead underlined the skill-enhancing effects of exporting
activity, which makes the adoption of new technologies profitable for exporting
firms (Yeaple 2005), induces quality upgrading (Verhoogen 2008; Fajnzylber and
Fernandes 2009) and offers opportunities to acquire knowledge of international best
practice (Bigsten et al. 2004).
Finally, at least for middle-income DCs, together with imported technologies and
exports, domestic R&D and innovation may play a relevant role, as it is the case for
the most advanced countries. Meschi et al. (2011) showed that SET was an
important factor in explaining the rise of the skilled labour cost share, but together
with domestic R&D. By the same token, Araujo et al. (2011) also found evidence in
support of both the role of SET and domestic technology in determining the skill-
upgrading trend of the Brazilian manufacturing labour force.
As the review in the preceding paragraphs suggest, there is a dearth of empirical
evidence on SBTC and employment effects in the context of low income countries.
The empirical analysis undertaken in this paper attempts to fill this gap by
investigating the SBTC and employment link in the context of Ethiopia. To this end
the paper uses firm-level microdata and dynamic labour demand equations.
3 The data
The study relies on data from the Ethiopian ‘‘Annual Survey of Large and Medium
Scale Manufacturing Industries’’ conducted by the Central Statistical Authority of
Ethiopia. The survey covers 1940 enterprises, and has a total of 7050 observations
for the period between 1996 and 2004. It includes formal private and public
enterprises employing at least 10 employees. The enterprises are classified
according to the ‘‘International Standard Classification’’, ISIC Rev.3. The final
sample used in the empirical analysis comprises only private sector firms that have
4 By the same token, Conte and Vivarelli (2011), using a direct measure of embodied technological
transfer, found that imported skill-biased technological change is one of the determinants of the increase
in the relative demand for skilled workers in DCs.
Eurasian Bus Rev (2017) 7:1–23 5
123

reported to employing both production and administration workers. Firms that were
not monitored for at least two consecutive years were also excluded from the final
sample, since the main regression methodology (see Sect. 5) relies on lagged values
of the regressors for identification.5 Table 8 in the Appendix reports the number of
enterprises retained for the analysis carried out, highlighting the unbalanced nature
of the data used.
The dataset contains a wide range of information about the enterprises generated
from the 8-section survey questionnaire. Information on the type of activity of the
enterprises, their employees and wages, inputs and output volumes, investments and
license fees, and the major problems they face, are included in the dataset. All
monetary variables are expressed in 1996 Birr, the Ethiopian currency, and have
been deflated using GDP and CPI deflators as appropriate. Employment is measured
as the number of workers in each quarter of the Ethiopian year. Total employment
was therefore calculated as the annual average of these quarters. Employment is also
divided into two categories, ‘‘administrative and technical employees’’ and
‘‘production workers’’. The former is defined as the salaried directors and managers,
technicians, superintendents, research workers, draftsmen and designers, engineers,
chemists, architects, accountants, book-keepers, office machine operators, recep-
tionists, sales men, delivery personnel, guards and other office staff. As for the
production workers, they include workers directly engaged in production i.e.,
persons engaged in fabricating, processing, assembling, maintenance, repair,
janitorial, record keeping and other associated activities.
4 The manufacturing sector in Ethiopia
4.1 Trade reform in Ethiopia
Ethiopia’s economy followed an import-substitution regime under the Imperial
government, which lasted until 1974. Foreign capital played a major role in the
process of industrialization during the 1950s up till the 1970s; foreign private (full
or majority) ownership reached 52 % by 1974 with a total of 143 firms (Shiferaw
2005).
The year 1974 marked the end of the monarchy era and the establishment of a
military council (Derg) that adopted Socialist ideology. The regime continued to
operate within the import-substitution strategy. The Derg nationalized all large and
medium private manufacturing enterprises. The management of these enterprises
was assigned to a small number of corporations that controlled prices and output
quantities. Industrialization took place mainly through high tariffs, and the
establishment of a few large enterprises that controlled factor markets and allowed
state owned enterprises to gain preferential access to credit, foreign exchange and
skilled labour. This came in parallel with a weakening of private manufacturing and
the restriction of private investment.
5 This sample selection criterion has led to a reduction in the final sample size vis-a-vis other studies that
have used this dataset, namely, Bigsten et al. (2009), and Bigsten and Gebreyeesus (2007).
6 Eurasian Bus Rev (2017) 7:1–23
123

At the end of the 1980s, Ethiopia began to gradually move to a more market-
oriented economy. With the new Transitional Government of Ethiopia (TGE)
coming to power in 1991, the country’s economic structure underwent major
transformations vis-a-vis the preceding Derg era. The TGE undertook policy reform
steps including privatization, trade opening and market deregulation. In June 1993,
the government launched a structural adjustment program under the auspices of the
World Bank and the African Development Fund. A comprehensive trade reform
followed that aimed at dismantling quantitative restrictions and gradually reducing
the levels of import tariffs and export taxes, as well as non-tariff barriers and import
licensing requirements. Export promotion schemes were introduced. Custom tariffs
were substantially reduced through a six-stage reform implemented between 1993
and 2003. In the first round, the maximum tariff was reduced from 230 to 80 %. The
next rounds led to a further gradual reduction that reached 35 % in 2003 (Bigsten
et al. 2009). In 2001 the Export Trade Duty Incentive Scheme was established. It
included duty draw-backs, vouchers, and bonded manufacturing warehouses, where
exporters are refunded 100 % of any duty paid on raw materials. To further
encourage exporters to acquire foreign technology and expertise, the government
also issued directives in 2004 to reduce taxes and other costs on salaries paid to
foreign experts (Bigsten and Gebreeyesus 2007). Even though the post 1991 period
witnessed significant economic liberalization, it is important to emphasize that the
State continued to play a prominent role in the Ethiopian economy over this period.
Land remains a public property in Ethiopia; and the State still fully controls some
key sectors of the economy such as telecommunication and IT, while it plays a
dominant role in other sectors such as banking, insurance and transportation. The
prevailing development strategy is also spearheaded by the State. Indeed, the growth
performance witnessed in recent years is driven by extensive public sector
investments, particularly in the energy and road transport sectors (see World Bank
2013a, b; IMF 2013).6
Figure 1 shows the GDP share of both exports and imports, which increased as a
result of these changes in the country’s trade policy. Exports increased from 9.3 %
of GDP in 1996 to 14.9 % in 2004, an increase of around 60 %. Imports increased
from 16.3 % in 1993 to 31.6 %, a much a larger increase of 94 %, hence the gap
between exports and imports is increasing. It is worth noting in this respect that ICT
imports’ share of total imports has been increasing rapidly, where ICT imports
formed 5 % of all good imports in 2000 and increased to around 9 % in 2004,
indicating an increasing demand for high technology communication and computing
systems that possibly reflect an upgrading in the production and/or management
processes in the various economic sectors in Ethiopia.
Trade liberalization was accompanied by financial market liberalization and a
large devaluation of the Birr. Since then, the exchange rate has been increasingly
market driven. Most price controls and restrictions on private investments have also
been lifted and a large wage of privatization took place. This has also led to the
increase in FDI inflows as presented in Fig. 2 below.
6 See also recent commentaries by The Economist such as http://www.economist.com/news/middle-east-
and-africa/21584037-government-expands-mobile-phone-network-tightens-its-grip-out-reach.
Eurasian Bus Rev (2017) 7:1–23 7
123

There was a drop in these inflows between 1998 and 2000 as a result of the
Eritrean–Ethiopian war, but they increased rapidly after the end of the conflict and
peaked in 2003–2004 at around $550million.7 Of the FDI projects licensed by 2003,
46.6 % were in manufacturing and processing; 40.7 % in trade, hotels and tourism;
and 12.7 % in agriculture and mining (UNCTAD 2004).
5%
10%
15%
20%
25%
30%
1996 1997 1998 1999 2000 2001 2002 2003 2004
Perc
enta
ge sh
are
of G
DP
Year
Exports Imports
Fig. 1 Ethiopia’s exports and imports of goods and services (% of GDP), Source: World DevelopmentIndicators (WDI)—2013
01
23
45
6
Sha
re o
f GD
P
1996 1998 2000 2002 2004Year
Fig. 2 FDI inflows as percentage of GDP (1996–2004), Source: World Development Indicators (WDI)—2013
7 Figure from UNCTAD stat.
8 Eurasian Bus Rev (2017) 7:1–23
123

4.2 The Ethiopian manufacturing sector: size and employment
Ethiopia’s industrial base remains to be quite small compared to other developing
countries, as well as with respect to other national economic sectors. The GDP share
of the industrial sector’s value added increased from 10.7 % in 1996 to 14.1 % in
2004 as Fig. 3 below depicts.
However, this share is still much lower than sub-Saharan African average of
31.8 % (Bigsten and Gebreeyesus 2007). The share of agriculture in the national
value added has been decreasing steadily, though it still constitutes more than 40 %
of the country’s output value added, while the share of industry and services have
both been rising at similar rates.
The share of manufacturing in GDP is another indicator of the country’s underde-
veloped manufacturing base, which formed an average of only 5.4 % of GDP for the
period 1996–2004, rising from5.13 % in 1996 and reaching a peak in 2001 (5.72 %), and
declining to 5.32 % in 2004.8 Table 1 below reports the distribution of firms across the
two-digit aggregation of the country’s manufacturing sectors. The highest share of firms
is within the food and beverages sector, followed by furniture production.9
Total employment and the share of skilled employment have steadily increased
during the period 1996–2004. This was however happening in parallel with a
decrease in average employment, which reflects a decline in firm size. The share of
skilled workers witnessed a sharp increase from 27.7 % in 1996 to 35.8 % in 1997.
0%
10%
20%
30%
40%
50%
60%
70%
1996 1997 1998 1999 2000 2001 2002 2003 2004
VA sh
are
of G
DP
Agriculture value added Industry value added Services value added
Fig. 3 Value added of Ethiopian economic sectors as percentage of GDP (1996–2004), Source: WorldDevelopment Indicators (WDI), 2013
8 Figures from WDI, 2013.9 The largest output share is also that of the food products and beverages sector. The food, beverages, and
textile sectors make up the largest shares of employment of around 27 % each; thus together accounting
for more than half of manufacturing employment. Contributing to only 9 % of manufacturing output, and
containing more than a quarter of employment, the textile sector seems to remain labour intensive. In
contrast, the tanning and dressing leather contributes almost the same share of output (8.8 %), but
contains only 8 % of labour; therefore, this sector seems to be moving away from traditional labour
intensive production processes and towards more mechanized systems. Similar analysis can also be made
looking at the non-metallic mineral products sector.
Eurasian Bus Rev (2017) 7:1–23 9
123

It has remained more or less stable since then, with some fluctuations around its
1997 level. The overall change in the skill mix may be indicative of the presence or,
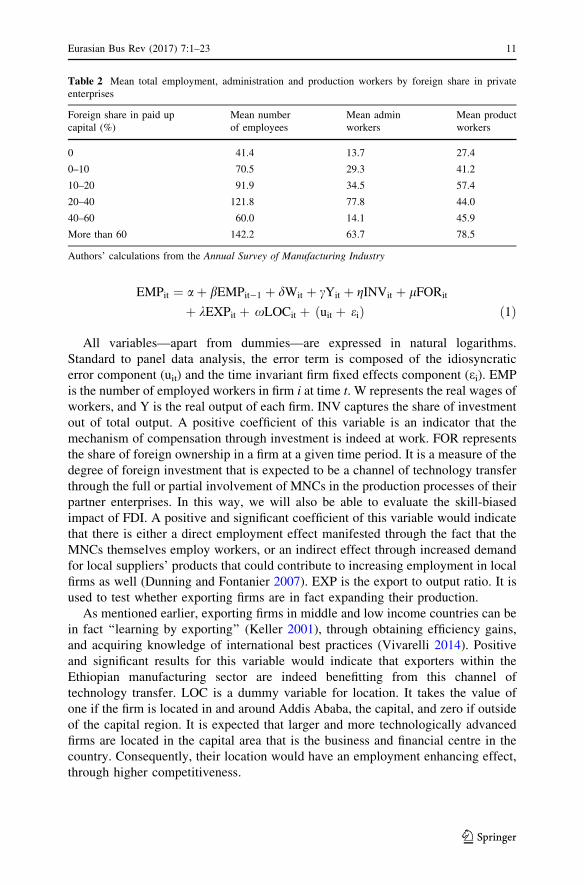
at least, the beginning of skill bias within the manufacturing sector. Higher levels of
total employment seem to be associated with higher shares of foreign ownership in
Ethiopian manufacturing enterprises overall, as can be seen from Table 2 below.
Higher share of foreign ownership is also generally associated with higher average
number of administrative or skilled workers.
5 The empirical model
The starting point of the empirical analysis is a standard demand for labour,
augmented with variables concerning our focus dimensions: technology and
globalization.10 Moreover, relevant costs in labour adjustments and persistence in
the employment evolution call for a dynamic setting (as standard in the literature,
see Arellano and Bond 1991; for a recent application see Lachenmaier and
Rottmann 2011); therefore, a lagged employment variable is added to our demand
for labour, that takes the following final extended form:
Table 1 Distribution of firms by 2 digit ISIC (%)
Manufacturing sector Total
firms
Share of
output
Share of
employment
Food products and beverages 28.5 40.2 27.1
Tobacco products 0.1 3.6 1.1
Textiles 4.3 9.0 27.1
Wearing apparel; dressing and dyeing of fur 3.5 0.7 4.6
Tanning and dressing of leather 7.1 8.8 8.1
Wood and of products of wood and cork 2.4 0.6 1.5
Paper and paper products 0.9 2.4 1.6
Publishing, printing and reproduction of recorded media 6.6 2.8 4.8
Chemicals and chemical products 5.1 6.1 4.4
Rubber and plastics products 3.8 5.1 3.9
Other non-metallic mineral products 11.5 8.4 6.2
Basic metals 1.0 4.5 1.5
Fabricated metal products, except machinery and equipment 6.6 1.7 2.7
Machinery and equipment 1.5 0.1 0.3
Electrical machinery and apparatus. 0.2 0.0 0.1
Motor vehicles, trailers and semi-trailers 1.0 4.6 1.0
Furniture 15.7 1.5 4.1
Total 100.0 100.0 100.0
Authors’ calculations from the Annual Survey of Manufacturing Industry
10 The choice of this specification is consistent with previous empirical literature studying the
employment effects of technological change and assuming a perfect competition setting (see Van Reenen
1997; Conte and Vivarelli 2011).
10 Eurasian Bus Rev (2017) 7:1–23
123
EMPit ¼ aþ bEMPit�1 þ dWit þ cYit þ gINVit þ lFORit
þ kEXPit þ xLOCit þ uit þ eið Þ ð1Þ
All variables—apart from dummies—are expressed in natural logarithms.
Standard to panel data analysis, the error term is composed of the idiosyncratic
error component (uit) and the time invariant firm fixed effects component (ei). EMP
is the number of employed workers in firm i at time t. W represents the real wages of
workers, and Y is the real output of each firm. INV captures the share of investment
out of total output. A positive coefficient of this variable is an indicator that the
mechanism of compensation through investment is indeed at work. FOR represents
the share of foreign ownership in a firm at a given time period. It is a measure of the
degree of foreign investment that is expected to be a channel of technology transfer
through the full or partial involvement of MNCs in the production processes of their
partner enterprises. In this way, we will also be able to evaluate the skill-biased
impact of FDI. A positive and significant coefficient of this variable would indicate
that there is either a direct employment effect manifested through the fact that the
MNCs themselves employ workers, or an indirect effect through increased demand
for local suppliers’ products that could contribute to increasing employment in local
firms as well (Dunning and Fontanier 2007). EXP is the export to output ratio. It is
used to test whether exporting firms are in fact expanding their production.
As mentioned earlier, exporting firms in middle and low income countries can be
in fact ‘‘learning by exporting’’ (Keller 2001), through obtaining efficiency gains,
and acquiring knowledge of international best practices (Vivarelli 2014). Positive
and significant results for this variable would indicate that exporters within the
Ethiopian manufacturing sector are indeed benefitting from this channel of
technology transfer. LOC is a dummy variable for location. It takes the value of
one if the firm is located in and around Addis Ababa, the capital, and zero if outside
of the capital region. It is expected that larger and more technologically advanced
firms are located in the capital area that is the business and financial centre in the
country. Consequently, their location would have an employment enhancing effect,
through higher competitiveness.
Table 2 Mean total employment, administration and production workers by foreign share in private
enterprises
Foreign share in paid up
capital (%)
Mean number
of employees
Mean admin
workers
Mean product
workers
0 41.4 13.7 27.4
0–10 70.5 29.3 41.2
10–20 91.9 34.5 57.4
20–40 121.8 77.8 44.0
40–60 60.0 14.1 45.9
More than 60 142.2 63.7 78.5
Authors’ calculations from the Annual Survey of Manufacturing Industry
Eurasian Bus Rev (2017) 7:1–23 11
123

As the paper also aims to look into the phenomenon of skill bias within the
Ethiopian manufacturing sector, the empirical model is extended to capture this
effect, if present. This is performed through defining a separate labour demand
equation for each group of skilled and unskilled workers. Equation (1) is therefore
expressed for both types of labour through the following form:
USLit ¼ aþ bUSLit�1 þ dUSWit þ cYit þ gINVit þ lFORit þ kEXPitþ xLOCit þ uit þ eið Þ ð2Þ
SLit ¼ aþ bSLit�1 þ dSWit þ cYit þ gINVit þ lFORit þ kEXPitþ xLOCit þ uit þ eið Þ ð3Þ
where USL and SL are the numbers of unskilled and skilled labour, respectively,
measured by the amounts of production vs administrative workers; and USW and
SW are the real wages of unskilled and skilled labour. Table 3 reports some
descriptive statistics of the dependent and independent variables used in all three
regression equations.
The main advantage of using a two-equation setting rather than the standard cost
share unique equation is that it allows for studying relative versus absolute skill
bias. Absolute skill bias would appear when technology and openness related
variables display a positive and significant coefficient for skilled workers and a
negative or not significant coefficient for unskilled workers, while relative skill bias
would appear when the coefficients for both skilled and unskilled workers are
positive and significant but differ in magnitude, with the coefficient for unskilled
workers being lower (this difference turning out to be statistically significant). In
addition, this setting is more informative in exploring the employment dynamics of
the different categories of workers separately.
The presence of firm-specific effects causes a correlation between the lagged
dependent variable (EMP it-1, USLit-1 or SLit-1) and the individual fixed effect ei.Therefore, using the pooled OLS methodology would lead to upwardly biased and
Table 3 Descriptive statistics of regression variables
N Mean Median Min Max Std. dev
Total employment 4038 47 18 2 2759 122.07
Total wage 4035 3725.27 3119.71 32.07 46162.55 2588.93
Output 3986 4,273,111 481,632 3662 268,000,000 14,700,000
Investment/output ratio 4038 0.19 0 0 91.73 1.94
Location dummy 4038 0.64 1 0 1 0.48
Foreign ownership share 4038 0.04 0 0 1 0.18
Export/output ratio 4038 0.02 0 0 1.34 0.13
Production workers 4038 31 12 0 2433 94.78
Wage of production workers 3995 3424.40 2869.03 30.39 26458.86 2247.71
Administrative workers 4038 17 5 0 701 42.35
Wage of administrative workers 3928 4615.09 3457.97 41.26 85169.91 4401.61
12 Eurasian Bus Rev (2017) 7:1–23
123

inconsistent coefficients of the lagged dependent variable, with a larger bias as the
variance of the unobserved effect increases (Hsiao 1986). Furthermore, the dynamic
specification of the model implies that the assumption of strict exogeneity of the
explanatory variables does not hold due to the presence of an endogenous first-order
lagged dependent variable. Obtaining consistent and efficient estimators includes
first transforming the original equations to eliminate the fixed effects and then
applying instrumental variables estimations for the parameter of the lagged
endogenous variable (Halaby 2004). Anderson and Hsiao (1982) have developed a
formulation for obtaining consistent FE-IV estimators by resorting to first
differencing in order to eliminate the unobserved effect, and then two lags and
beyond to instrumentalise the lagged dependent variable. However, more radical
efficiency improvements have been obtained by Arrellano and Bond (1991), using
GMM techniques as an alternative to the Anderson and Hsiao approach. In their
model, the instrument matrix includes all previous level values of the lagged
dependent variable, where they obtain the GMM-DIFF estimator. However, the
GMM-DIFF estimator has been found to be weak in cases when: (1) there is a strong
persistence over time, where the instruments are weakly correlated with the first
difference variables, and (2) cross-sectional variability dominates time variability
(Bond et al. 2001). Blundell and Bond (1998) have then put forward an efficiency
improvement to the GMM-DIFF model by using additional moment conditions and
obtaining the system GMM or GMM-SYS. In particular, they use moment
restrictions of a simultaneous system of first-differenced equations and the
equations in level. In the first-differenced equations they use the lagged level
values of the variables as instruments (similar to the GMM-DIFF estimator), and in
the level equations they use differences as instruments. In the present empirical
study, the GMM-SYS is used since it fits best with the characteristics of the panel
data used and the nature of the empirical model. In particular, our longitudinal data
are characterized by a larger cross-sectional (between variance equal to 1.003) than
time variability (within variance equal to 0.1144) and—as Table 4 below depicts—
by a time persistence that is obvious for all the three dependent variables. These
features of the data are exactly those that make GMM-SYS as preferred to GMM-
DIF (see Blundell and Bond 1998).
Moreover, since our baseline specification (1) may be affected by endogeneity
that goes beyond the lagged dependent variable (for instance, it may well be the case
that wage and employment decisions are jointly and simultaneously adopted, as well
as the output and investment decisions), the GMM-SYS orthogonality procedure
will be applied to all the dependent variables, using one-lagged instruments when
Table 4 Time persistence in the employment time series
Total employment Unskilled workers Skilled workers
AR(1) 0.896***
(0.000)
0.830***
(0.000)
0.860***
(0.000)
***, **, and * indicate the statistical significance at the 1, 5, and 10 %, respectively
Eurasian Bus Rev (2017) 7:1–23 13
123

necessary. Finally, time and sector dummies will be included to control for
unobserved shocks that may affect the variables.
As noted in Sect. 3, the estimation sample used is unbalanced in nature. This
poses some challenges in that some of the data transformations undertaken for the
SYS-GMM may magnify gaps in the data resulting in possibly biased estimators.
However, we provide OLS and FE estimators for proper robustness checks.
6 Results
The results from our empirical analysis are reported in Tables 5, 6 and 7 below.
Table 5 presents the OLS, FE and SYS-GMM estimators for the total employment
equation. Although OLS is expected to result in upward biased estimates in the
presence of firm specific effects and a dynamic specification, it forms an upper
bound for the value of the estimate of lagged endogenous variable obtained in SYS-
GMM. Similarly, the FE results are presented to provide a lower bound for the value
of the mentioned estimator, since the fixed effects regression produces downward
biased results.
Looking at the last column of Table 5, the SYS-GMM shows a positive and
significant value of lagged total employment coefficient, further asserting the
persistence in the time series. The magnitude of this coefficient lies within the upper
and lower bounds set by the OLS and FE estimators, respectively. The total wage
coefficient shows a negative and significant value, which is in line with the expected
sign indicating a negative relationship between labour demand and wages.
The rest of the regressors show positive coefficients reflecting employment-
enhancing effects to varying levels of significance. The output explanatory variable
shows that an expansion in output requires higher levels of employment. Similarly,
the positive sign of the investment variable indicates that as the share of investment
in total output increases, the demand for labour rises. This is a manifestation that at
least part of firms’ profits are being used for expanding their production capacity,
thus the compensation channel via new investments might be at work in the
manufacturing sector of Ethiopia (see Sect. 2). The location dummy variable is
found to be highly significant and suggests that firms located in the capital region
hire more workers vis-a-vis their counterparts in other regions. The Foreign
ownership variable is also found to be weakly significant suggesting that firms with
higher foreign share have a greater tendency to expand. Involvement in exporting
activity is also found to have an employment enhancing effect, albeit being weakly
significant, as can be gathered from the coefficient of the export ratio variable.
In terms of relative magnitude, it appears that the export variable has the highest
impact since its coefficient is of the highest magnitude. However, this effect is
weakly (10 %) significant. The location dummy has the second highest coefficient
and is significant at 1 %.
A number of validity tests have been conducted to check the performance of the
model and robustness of the results. The Wald test was used to test the overall
significance of the independent variables. It rejected the null hypothesis of
insignificant coefficients, thus confirming the joint significance of the variables and
14 Eurasian Bus Rev (2017) 7:1–23
123

the robustness of the overall results. The Hansen test for over-identifying
restrictions, where the null hypothesis is that of adequate instruments, failed to
reject the null, thus confirming the adequacy of the instruments used. In addition,
the Arellano and Bond (AR) test for autocorrelation was performed, which is found
to support the consistency of the GMM estimators using t-2 instruments.
Another question this paper attempts to address is whether differential
employment enhancing effect exists in the allocation of skilled and unskilled
Table 5 Regression results from the total employment equation
Dependent variable: total
employment
OLS FE SYS-
GMM
Lagged total employment 0.710*** 0.160*** 0.352***
(0.0112) (0.0191) (0.0653)
Total wage –0.144*** –0.313*** –0.262*
(0.0171) (0.0223) (0.1450)
Real output 0.177*** 0.184*** 0.372***
(0.0076) (0.0114) (0.0593)
Investment/output ratio 0.00814 –0.0146** 0.0241***
(0.0071) (0.0074) (0.0064)
Location dummy 0.0608*** 0.0521 0.188***
(0.0174) 0.0795) (0.0484)
Foreign ownership share 0.0879** –0.0236 0.170*
(0.0412) (0.0537) (0.0996)
Export/output ratio 0.0161 –0.123 1.165*
(0.0626) (0.1700) (0.5970)
Constant –0.417*** 2.751*** –1.054
(0.1150) (0.2240) (0.9290)
Time dummies Yes Yes Yes
Sector dummies Yes No Yes
Observations 2816 2816 2816
Number of firms 865 865
R-squared 0.855 0.693
Adjusted R-squared 0.853
AR(1) –7.51***
(0.000)
AR(2) 0.896
(0.370)
Wald test chi2 2131***
(0.000)
Hansen test 102.5
(0.439)
Number of instruments 131
Robust standard errors (for coefficients) and p-values (for tests) in brackets
***, **, and * indicate the statistical significance at the 1, 5, and 10 %, respectively
Eurasian Bus Rev (2017) 7:1–23 15
123

Table 6 Regression results from the skill specific employment equations
Dependent variable Unskilled workers Skilled workers
OLS FE SYS-
GMM
OLS FE SYS-
GMM
Lagged production
worker
employment
0.606*** 0.117*** 0.295***
(0.0130) (0.0203) –0.0452
Production worker
wages
–0.232*** –0.334*** –0.448***
(0.0198) (0.0252) (0.0508)
Lagged admin
worker
employment
0.696*** 0.0790*** 0.280***
(0.0125) (0.0209) (0.0547)
Admin worker
wages
–0.0996*** –0.253*** –0.311***
(0.0180) (0.0233) –0.0486
Real output 0.232*** 0.202*** 0.406*** 0.183*** 0.151*** 0.462***
(0.0092) (0.0158) (0.0586) (0.0099) (0.0164) (0.0505)
Investment/output
ratio
0.00652 –0.0143 0.0256*** 0.0228** –0.0117 0.0300***
(0.0095) (0.0106) (0.0088) (0.0103) (0.0110) (0.0065)
Location dummy 0.0469** –0.0855 0.161*** 0.116*** 0.337*** 0.312***
(0.0227) (0.1110) (0.0438) (0.0250) (0.1160) (0.0548)
Foreign ownership
share
0.0913* –0.0365 0.168 0.111* –0.062 0.243**
(0.0540) (0.0753) (0.1160) (0.0585) (0.0782) (0.1230)
Export/output ratio –0.0027 –0.07 1.144* 0.0509 –0.166 1.136
(0.0823) (0.2380) (0.6570) (0.0891) (0.2470) (0.7540)
Constant –0.467*** 2.413*** –0.369 –1.070*** 1.724*** –2.473***
(0.1460) (0.2840) (0.7590) (0.1400) (0.2830) (0.5850)
Time dummies Yes Yes Yes Yes Yes Yes
Sector dummies Yes No Yes Yes No Yes
Observations 2816 2816 2816 2816 2816
Number of firms 865 865
R-squared 0.768 0.572 0.789 0.443
Adjusted R-squared 0.765 0.787
AR(1) –8.227*** –9.661***
(0.000) (0.000)
AR(2) 1.411 1.466
(0.158) (0.143)
Wald test chi2 1384*** 1266***
(0.000) (0.000)
Hansen 122.8 129.1
(0.513) (0.382)
Number of
instruments
154 154
Robust standard errors (for coefficients) and p values (for tests) in brackets
***, **, and * indicate the statistical significance at the 1, 5, and 10 %, respectively
16 Eurasian Bus Rev (2017) 7:1–23
123

labour. Table 6 shows the results of the second set of regressions, where the demand
for labour was studied for skilled labour and unskilled labour separately. As
mentioned earlier, having two equations allows us to observe the relative versus
absolute skill bias, if any.
Looking at the SYS-GMMresults for both unskilled and skilledworkers, the lagged
employment variable is positive and significant for both types of workers. This, as in
the case of total employment, affirms the time persistence of the series. In addition, the
coefficients of both variables lie within the bounds set by OLS and FE results. The
wage explanatory variables are also significant and in line with the expected negative
sign. It is worth noting here that in terms of magnitude, the coefficient of unskilled
workers is higher than that of skilled workers. A possible explanation for this may be
that the demand for unskilled workers is more elastic given the ease with which such
workers can be substituted vis-a-vis their skilled counterparts.
The coefficient of the output variable is positive and significant for both types of
workers, with a slightly higher magnitude for skilled workers. The difference
between these two coefficients however proved not statistically significant (refer to
Table 7). Therefore, no conclusion regarding the presence of a relative skill bias can
be asserted here. The investment variable shows similar results, positive and
significant for both skilled and unskilled labour, with a higher magnitude for skilled
labour. However, also in this case, the t test for the significance of the difference
between the two values is not significant (see Table 7, second row).
Proximity to the capital city is found to increase the demand for skilled labour
more than the demand for unskilled workers (with both the coefficients turning out
highly significant). This difference between the magnitudes of the location variable
is significant at the 95 % level of confidence (see Table 7, third row). Therefore,
location does exhibit a relative skill bias effect in that firms located in the capital
and its vicinity not only hire more workers, but they have the tendency to hire more
skilled workers.
The share of foreign ownership is found to have significant effects only for
skilled workers. Therefore, the employment enhancing effect of foreign ownership
observed in the total employment equation stems mostly from the effect on the
demand for skilled labour.11 This leads us to the conclusion that firms with higher
shares of foreign ownership exhibit an absolute skill bias effect, indicating that the
FDI channel of technology transfer is at work in Ethiopia.
Table 7 t-statistic for
comparing coefficients of the
two equations
***, **, and * indicate the
statistical significance at the 1,
5, and 10 %, respectively
Variable T-statistic p value
Real output 0.724 0.25
investment/output ratio 0.401 0.50
Location dummy 2.152** 0.03
Foreign ownership share 0.444 0.50
Export/output ratio 0.008 0.50
11 The t test for the difference between the two coefficients of this variable is not found to be statistically
significant due to the coefficient for unskilled labour being not significant.
Eurasian Bus Rev (2017) 7:1–23 17
123

The export variable, contrary to expectations pertaining to a possible skill bias, is
found to be barely significant for unskilled labour but insignificant for skilled
labour. This is to say that the positive effect on total employment observed earlier
originates mainly from higher demand for unskilled rather than skilled labour.
Therefore, the process of ‘‘learning by exporting’’ is not obvious in Ethiopia, at least
not for the time period considered, turning out to be characterized by a dominant
role of an HOSS effect, with Ethiopian exports still stemming from traditional and
low-skill intensive manufacturing sectors.
Looking at the results of Table 6 from another perspective, we can analyse
the results of each type of labour separately. For unskilled labour, the variable
that appears to have the highest employment enhancing effect is the export
variable. This indicates that the manufactured goods being exported follow
production techniques that have not (yet) adopted more advanced labour-saving
technologies.
The most prominent contributor to increasing demand for skilled labour appears
to be real output. This however does not necessarily allow us to make conclusions
regarding the technology levels of these expanding firms. As noted earlier, however,
there is evidence of an obvious skill-bias associated with foreign ownership and
with the location in and around the capital city.
The various diagnostic tests showed evidence supporting the robustness of the
results. The Wald test rejected the null of insignificant estimator coefficients for
both unskilled and skilled labour demand equations. The Hansen test never rejected
the null for either of the two equations, asserting the suitability of the instruments
used. The AR tests also supported the overall validity of the model by providing
evidence for a significant negative AR(1) and a non-significant AR(2).
Finally, we replicated our GMM-SYS estimates using the less informative
specification (see the discussion in Sect. 5) with the skilled to unskilled ratio as
dependent variable (see Table 9 in the Appendix). As can be seen, our results about
the skill-biased role of both the foreign ownership and the proximity to the capital
city are strongly confirmed by this auxiliary estimation.
7 Concluding remarks
This paper has conducted empirical investigations to establish the role played by
globalization and technology transfer in determining employment evolution in
the manufacturing sector of Ethiopia. To this end, the paper has studied the
extent to which the level of overall manufacturing employment was determined
by trade, FDI and technology; and if globalization and technology transfer
played a role in instigating SBTC. The empirical analysis relied on manufac-
turing survey data for the period 1996–2004 and deployed alternative
econometric estimators.
The findings in the paper lead to two main conclusions concerning the
characteristics of manufacturing sector employment in Ethiopia. The first main
conclusion pertains to the quantitative effect of globalization on total manufacturing
employment at the firm-level. Specifically, trade and foreign ownership are found to
18 Eurasian Bus Rev (2017) 7:1–23
123

have a labour–augmenting effect. Therefore, no negative employment effects of
globalization are obvious in the Ethiopian manufacturing sector. The investigation
to determine whether the manufacturing sector exhibits the presence of skill-bias
lends some evidence to this effect. In particular, foreign ownership and proximity to
the capital city are found to lead to a higher demand for skilled workers, as opposed
to unskilled ones. The foreign ownership related finding thus suggests two things:
first, the increase in total firm-level employment associated with foreign ownership
stems mostly from the effect of foreign ownership on the demand for skilled labour;
secondly, it lends some support to FDI-linked channels of a SBT transfer being in
operation. The significant effect associated with being located in and around the
capital city may suggest the presence of positive agglomeration effects. It may also
be an indicator of the fact that the capital city and its hinterlands represent better
synergies of infrastructure and technology.
In contrast, involvement in exporting activity is found to lead to higher demand
for unskilled workers. This suggests that the effect of exporting activity on total
firm-level employment is largely the result of its effect on unskilled labour. This
finding is in contrast with the expectation of a possible skill bias involved by a
process of ‘‘learning by exporting’’. However, at least for the time period considered
in this study, it may well be that the Ethiopian manufacturing was still characterized
by a dominant role of an HOSS effect, with exporting still stemming from
traditional and low-skill intensive manufacturing activities.
The finding that FDI is the main channel through which skilled labour is demanded
in the Ethiopian manufacturing may be of some relevance for policy. The current
extensive public sector investment in infrastructural projects may be commendable in
this respect, since availability of adequate infrastructure may be the missing element
needed to attract FDI. On the other hand, the fact that the economy is still dominated by
a State sector that is undertaking extensive investment activities may pose the risk of
crowding-out relatively more technologically advanced FDI. Finally, it is needless to
state that a favourable investment climate that accords the private sector with the
requisite credit and financial infrastructure, among others, is vital in attracting FDI and
the development of the manufacturing sector. Equally, globalization and technology
transfer necessitate an educated and skilled labour force. A skill-shortage would not
only undermine both technological upgrading and manufacturing employment, but it
also risks thwarting the flow of FDI. There is thus a need to also devote particular
attention to education and training policies in Ethiopia.
Open Access This article is distributed under the terms of the Creative Commons Attribution 4.0
International License (http://creativecommons.org/licenses/by/4.0/), which permits unrestricted use, dis-
tribution, and reproduction in any medium, provided you give appropriate credit to the original
author(s) and the source, provide a link to the Creative Commons license, and indicate if changes were
made.
Appendix
Tables 8 and 9.
Eurasian Bus Rev (2017) 7:1–23 19
123

Table 8 The distribution of
enterprises in the estimation
sample
Year No. of establishments
1996 298
1997 394
1998 440
1999 462
2000 465
2001 478
2002 572
2003 639
2004 504
N 4252
Table 9 Regression results using OLS, FE and system-GMM for the ratio of skilled to unskilled workers
Dependent variable:
skilled/unskilled
OLS FE SYS-GMM
Lagged employment
ratio
0.510*** 0.0833*** 0.293***
(0.0759) (0.02390 (0.0674)
Total wage ratio –0.0784*** –0.0609*** –0.103*
(0.0140) (0.016) (0.0601)
Real output 0.00337 0.0107 0.170*
(0.0180) (0.0354) (0.0926)
Investment/output ratio 0.0203*** 0.00494 0.000454
(0.0056) (0.0228) (0.0686)
Location dummy 0.163*** 0.252 0.200***
(0.0472) (0.250) (0.0663)
Foreign ownership
share
0.148 0.163 2.039**
(0.0979) (0.172) (0.937)
Export/output ratio 0.111 –0.077 –0.497
(0.1060) (0.544) (0.624)
Constant 0.578** 0.572 –1.424
(0.2360) (0.521) (1.278)
Time dummies Yes Yes Yes
Sector dummies Yes No Yes
Observations 2863 2863 2863
Number of firms 881
R-squared 0.295 0.019
AR(1) –2.846***
(0.004)
AR(2) 0.944
(0.345)
20 Eurasian Bus Rev (2017) 7:1–23
123

References
Acemoglu, D. (2003). Patterns of skill premia. Review of economic studies, 70, 199–230.
Aguirregabiria, V., & Alonso-Borrego, C. (2001). Occupational structure, technological innovation, and
reorganization of production. Labour Economics, 8, 43–73.
Almeida, R. (2009). Openness and technological innovation in East Asia: have they increased the
demand for skills? (Discussion Paper No 4474). Bonn: Institute for the Study of Labor (IZA).
Anderson, T. W., & Hsiao, C. (1982). Formulation and estimation of dynamic models using panel data.
Journal of Econometrics, 18, 47–82.
Araujo, B. C., Bogliacino, F., & Vivarelli, M. (2011). Technology, trade and skills in Brazil: some
evidence from microdata. CEPAL Review, 105, 157–171.
Arellano, M., & Bond, S. (1991). Some tests of specification for panel data: monte Carlo evidence and an
application to employment equations. Review of Economic Studies, 58, 277–297.
Autor, D., Katz, L., & Krueger, A. (1998). Computing inequality: have computers changed the labor
market? Quarterly Journal of Economics, 113, 1169–1214.
Barba Navaretti, G., Solaga, I., & Takacs, W. (1998). When vintage technology makes sense: matching
imports to skills. Labour, 12, 353–362.
Berman, E., Bound, J., & Griliches, Z. (1994). Changes in the demand for skilled labor within U.S.
manufacturing industries. Quarterly Journal of Economics, 109, 367–398.
Berman, E., & Machin, S. (2000). Skill-Biased technology transfer around the world. Oxford Review of
Economic Policy, 16, 12–22.
Berman, E., & Machin, S. (2004). Globalization, skill-biased technological change and labor demand. In
E. Lee & M. Vivarelli (Eds.), Understanding globalization, employment and poverty reduction (pp.
39–66). New York: Palgrave Macmillan.
Bigsten, A., Collier, P., Dercon, S., Fafchamps, M., Gauthier, B., Gunning, W. J., & Zeuf, A. (2004). Do
African manufacturing firms learn from exporting? Journal of Development Studies, 40, 115–141.
Bigsten, A., & Gebreeyesus, M. (2007). The small, the young and the productive: determinants of
manufacturing firm growth. Ethiopia. Economic Development and Cultural Heritage (University of
Chicago Press), 55, 813–840.
Bigsten, A., Gebreeyesus, M., & Soderbom, M. (2009). Gradual trade liberalization and firm performance
in Ethiopia. Journal of Development Studies, 45, 1594–1614.
Blundell, R., & Bond, S. (1998). Initial conditions and moment restrictions in dynamic panel data models.
Journal of Econometrics, 87, 115–143.
Bond, S., Hoeffler, A., & Temple, J. (2001). GMM estimation of empirical growth models (Discussion
Paper No. 3048). London: Centre for Economic Policy Research.
Caroli, E., & Van Reenen, J. (2001). Skill-biased organizational change? evidence from a panel of British
and French establishments. Quarterly Journal of Economics, 116, 1449–1492.
Coe, D. T., & Helpman, E. (1995). International R&D spillovers. European Economic Review, 39,
859–887.
Coe, D. T., Helpman, E., & Homaister, A. (1997). North-South spillovers. Economic Journal, 107,
134–149.
Table 9 continued
Dependent variable:
skilled/unskilled
OLS FE SYS-GMM
Wald test 190.9***
(0.000)
Hansen 153.8
(0.184)
Number of instruments 169
Robust standard errors (for coefficients) and p values (for tests) in brackets
***, **, and * indicate the statistical significance at the 1, 5, and 10 %, respectively
Eurasian Bus Rev (2017) 7:1–23 21
123
Conte, A., & Vivarelli, M. (2011). Globalization and employment: imported skill biased technological
change in developing countries. Developing Economies, 49, 36–65.
Dunning, J. H., & Fontanier, F. (2007). Multinational enterprises and the new development paradigm:
consequences for host country development. Multinational Business Review, 15, 25–45.
Epifani, P. (2003). Trade liberalization, firm performances and labor market outcomes in the developing
world, what can we learn from micro-level data? Rivista italiana degli economisti (Societa editrice il
Mulino), 3, 455–486.
Fajnzylber, P., & Fernandes, A. (2009). International economic activities and skilled demand: evidence
from Brazil and China. Applied Economics, 41, 563–577.
Feenstra, R. C., & Hanson, G. H. (1997). Foreign direct investment and relative wages: evidence from
Mexico’s maquiladoras. Journal of International Economics, 42, 371–393.
Gkypali, A., Rafailidis, A., & Tsekouras, K. (2015). Innovation and export performance: do young and
mature innovative firms differ? Eurasian Business Review, 5, 397–415.
Gorg, H., & Strobl, E. (2002). Relative wages, openness and skill-biased technological change
(Discussion Papers No. 596) Bonn: Institute for the Study of Labor (IZA).
Griliches, Z. (1969). Capital-skill complementarity. Review of Economics and Statistics, 51, 465–468.
Halaby, N. C. (2004). Panel models in sociological research: theory into practice. Annual Review of
Sociology, 30, 507–544.
Hanson, G., & Harrison, A. (1999). Trade and wage inequality in Mexico. Industrial and Labor Relations
Review, 52, 271–288.
Hsiao, C. (1986). Analysis of panel data. Cambridge: Cambridge University Press.
IMF (2013) The Federal Democratic Republic of Ethiopia (IMF Country Report No. 13/308).
Washington: Author.
Katz, L., & Autor, D. H. (1999). Changes in the wage structure and earnings of inequality. In O.
Ashenfelter & D. Card (Eds.), Handbook of Labor Economics (Vol. 3). Amsterdam: Elsevier.
Keller, W. (2001). International technology diffusion (Working Paper No. 8573). Cambridge,
Massachusetts: National Bureau of Economic Research.
Keller, W. (2004). International technology diffusion. Journal of Economic Literature, 42, 752–782.
Lachenmaier, S., & Rottmann, H. (2011). Effects of innovation on employment: a dynamic panel
analysis. International Journal of Industrial Organization, 29, 210–220.
Lee, E., & Vivarelli, M. (2004). Understanding Globalization, Employment and Poverty Reduction (Eds).
New York: Palgrave Macmillan.
Lee, E., & Vivarelli, M. (2006a). Globalization, Employment, and Income Distribution in Developing
Countries(Eds). New York: Palgrave Macmillan.
Lee, E., & Vivarelli, M. (2006b). The Social Impact of Globalization in Developing Countries.
International Labor Review, 145, 167–184.
Machin, S., & Van Reenen, J. (1998). Technology and changes in skill structure: evidence from seven
OECD countries. Quarterly Journal of Economics, 113, 1215–1244.
Mayer, J. (2000). Globalization, technology transfer and skill accumulation in low-income countries.
Globalization and the obstacles to the successful integration of small vulnerable economies.
Geneva: UNCTAD.
Melitz, M. (2003). The impact of trade on aggregate industry productivity and intra-industry
reallocations. Econometrica, 71, 1695–1725.
Meschi, E., Taymaz, E., & Vivarelli, M. (2011). Trade, technology and skills: evidence from Turkish
microdata. Labour Economics, 18, S60–S70.
Meschi, E., & Vivarelli, M. (2009). Trade and income inequality in developing countries. World
Development, 37, 287–302.
Mitra, A., & Jha, A. K. (2015). Innovation and employment: a firm level study of Indian industries.
Eurasian Business Review, 5, 45–71.
Perkins, R., & Neumayer, E. (2005). International technological diffusion, latecomer advantage and
economic globalization: a multi-technology analysis. Annals of the American Association of
Geographers, 95, 789–808.
Piva, M. (2003). The Impact of Technology Transfer on Employment and Income Distribution in
Developing Countries: A Survey of Theoretical Models and Empirical Studies (Working Paper No.
15). Geneva: International Policy Group, Policy Integration Department of the ILO.
Piva, M., Santarelli, E., & Vivarelli, M. (2005). The skill bias effect of technological and organisational
change: evidence and policy implications. Research Policy, 34, 141–157.
22 Eurasian Bus Rev (2017) 7:1–23
123

Robbins, D. (1996). HOS hits facts: facts win; evidence on trade and wages in the developing World
(Working Paper No. 119). Paris: OECD Development Centre.
Robbins, D. (2003). The impact of trade liberalization upon inequality in developing countries—A review
of theory and evidence (Working Paper No. 13). Geneva: ILO.
Robbins, D., & Gindling, T. H. (1999). Trade liberalization and the relative wages for more-skilled
workers in Costa Rica. Review of Development Economics, 3, 140–154.
Schiff, M., & Wang, Y. (2006). On the quantity and quality of knowledge: The impact of openness and
foreign R&D on North-North and North-South technology spillovers. In B. Hoeckman & B.
S. Javoricik (Eds.), Global integration and technology transfer (pp. 99–112). New York: Palgrave
Macmillan.
Shiferaw, A. (2005). Firm heterogeneity and market selection in Sub-Saharan Africa: does it spur
industrial progress? (Working Papers - General Series 1765019171). The Hague: International
Institute of Social Studies of Erasmus University.
Taylor, L. (2004). External liberalization in Asia, post-socialist Europe and Brazil. In E. Lee & M.
Vivarelli (Eds.), Understanding globalization, employment and poverty reduction (pp. 13–34). New
York: Palgrave Macmillan.
UNCTAD (2004). An investment guide to Ethiopia: opportunities and conditions. Geneva: Author.
UNCTAD (2007). The Least Developed Countries (2007 Report). Geneva: Author.
Van Reenen, J. (1997). Employment and technological innovation: evidence from U.K. manufacturing
firms. Journal of Labor Economics, 15, 255–284.
Verhoogen, E. A. (2008). Trade, quality upgrading, and wage inequality in the Mexican manufacturing
sector. The Quarterly Journal of Economics, 123, 489–530.
Vivarelli, M. (2014). Innovation, employment and skills in advance and developing countries: a survey of
economic literature. Journal of Economic Issues, 48, 123–154.
Welch, F. (1970). Education in production. Journal of Political Economy, 78, 35–59.
World Bank (2013a). Ethiopia public sector reform approach: Building the developmental state—A
review and assessment of the Ethiopian approach to public sector reform (World Bank, Report No:
ACS3695). Washington: Author.
World Bank (2013b). Africa’s Pulse: An analysis of issues shaping Africa’s economic future (World
Bank, the Office of the Chief Economist Report, vol.8). Washington DC, Author.
Yeaple, S. R. (2005). A simple model of firm heterogeneity, international trade and wages. Journal of
International Economics, 65, 1–20.
Eurasian Bus Rev (2017) 7:1–23 23
123