improving energy efficiency in barrick grinding circuits · improving energy efficiency in barrick...
TRANSCRIPT

IMPROVING ENERGY EFFICIENCY IN BARRICK GRINDING CIRCUITS
Lloyd Buckingham
J-F Dupont Bob Blain Chris Brits
Julius Stieger Vancouver, Canada SAG 2011

Barrick Gold Corporation
26 mines world-wide Largest gold producer in the world 7.8 million ounces per year of gold
delivered – 140 million ounces of gold reserve
600 million pounds per year of copper – 17 billion pounds reserve
1 billion ounces of silver reserve.
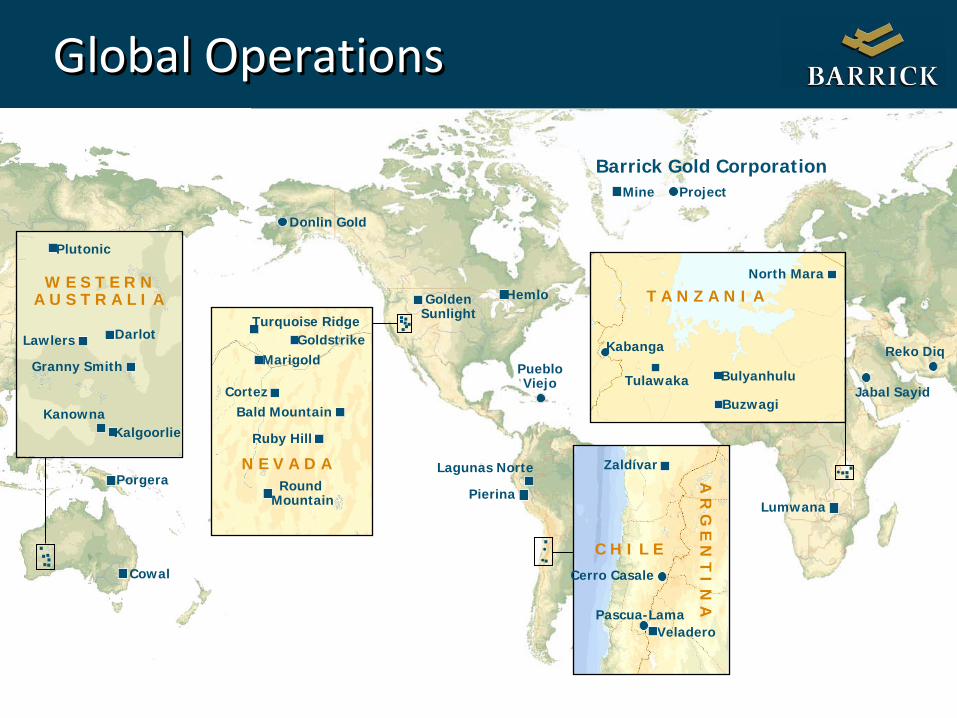
Global Operations
Donlin Gold
Hemlo Golden Sunlight
Lagunas Norte
Pierina
Pueblo Viejo
Porgera
Cowal
Reko Diq
Cerro Casale
Pascua-Lama Veladero
A R
G E N
T I N A
C H I L E
Zaldívar
North Mara
Kabanga
Tulawaka Bulyanhulu
Buzwagi
T A N Z A N I A
Granny Smith
Lawlers
Kanowna
Darlot
Plutonic
Kalgoorlie
W E S T E R N A U S T R A L I A
Round Mountain
Turquoise Ridge Goldstrike
Marigold
Cortez Bald Mountain
Ruby Hill
N E V A D A
Mine Project
Barrick Gold Corporation
Lumwana
Jabal Sayid

Presentation Outline
Barrick’s energy and climate change program
Comminution in terms of the energy footprint
Defining and implementing improvement opportunities
The results and putting it into perspective

51 million gigajoules of energy consumed annually – 1 GJ equals 26 litres of diesel – 1 GJ equals 278 kWh of electricity – Pretty close to a decatherm (million BTU’s)
5 million tonnes of greenhouse gases (CO2 equivalent) generated annually
Barrick Gold Corporation

Climate Change and Energy Perspective
Climate change is recognized as a significant factor in corporate governance
Energy consumption is the principle driver of greenhouse gas (GHG) emissions
Energy accounts for 25 – 30% of direct operating costs each year.
Barrick has targeted improving energy efficiency by 8% through 2012. – Defined as calculated energy savings relative to
“Business as Usual”

Comminution in terms of Energy Footprint
Energy %
Open Pit Mining Underground Mining Comminution Heap Leaching Rest of Process
Energy = Diesel, Electricity,
Propane, Natural Gas, Gasoline, Biofuels,
Explosives, etc.

Seeking Comminution Opportunities
Seek out the under-
performers
Survey the circuits and compare to
expectations

An in-depth analysis
Analyze the grinding circuits for improvement opportunities – Seek to optimize the throughput – Feed crushing – SAG mill operation including breakage
functions and “pumping” capacities – Pebble crushing – Classification – Ball milling

Common Improvement Themes?
There are amazingly few “common themes”
Three mines reviewed in the paper had 16 improvement opportunities amongst them, only one was “common”
•Pebble crushing
Each grinding circuit must be individually studied

Opportunities Were Various
•Improved grinding media
quality
•Reduced ball size in ball mills

Average Cumulative % Passing vs. Particle Size
0.0%
20.0%
40.0%
60.0%
80.0%
100.0%
120.0%
1 10 100 1000 10000 100000
Particle Size (µm)
% P
assi
ng
Fd Fine Liner Discharge Fine Liner Fd Med Liner Discharge Med Liner
•Finer SAG feed crushing
•Increased pebbles and
power draw at the pebble crushers
•Improved classification

•Changes to lifter spacing
•Improved slurry discharge from SAG mills
•Optimized ball mill power
draw
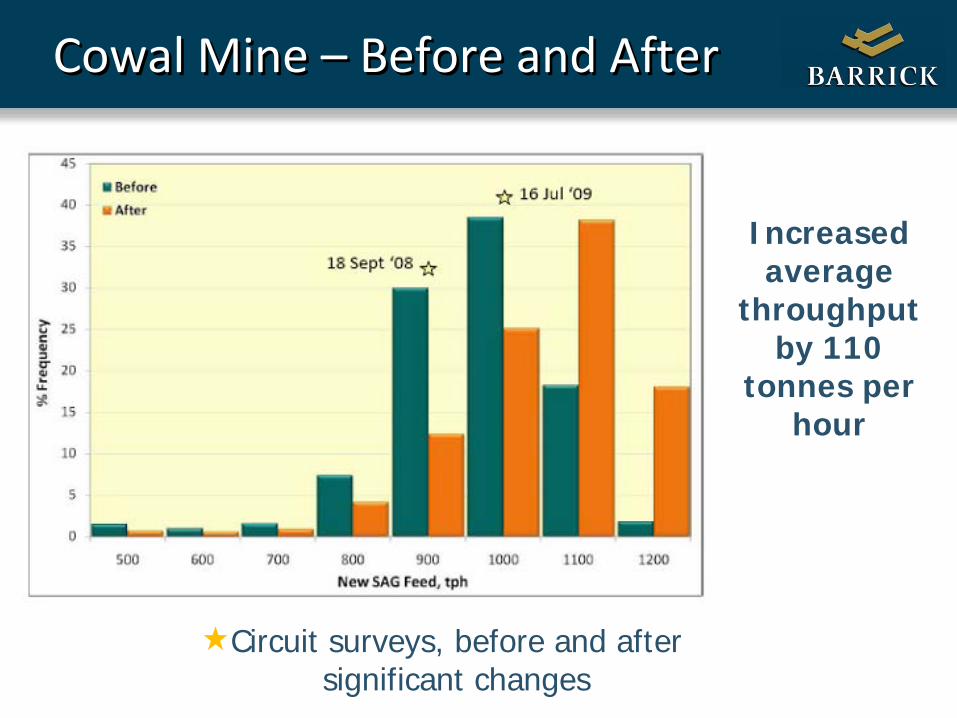
Cowal Mine – Before and After
Circuit surveys, before and after significant changes
Increased average
throughput by 110
tonnes per hour

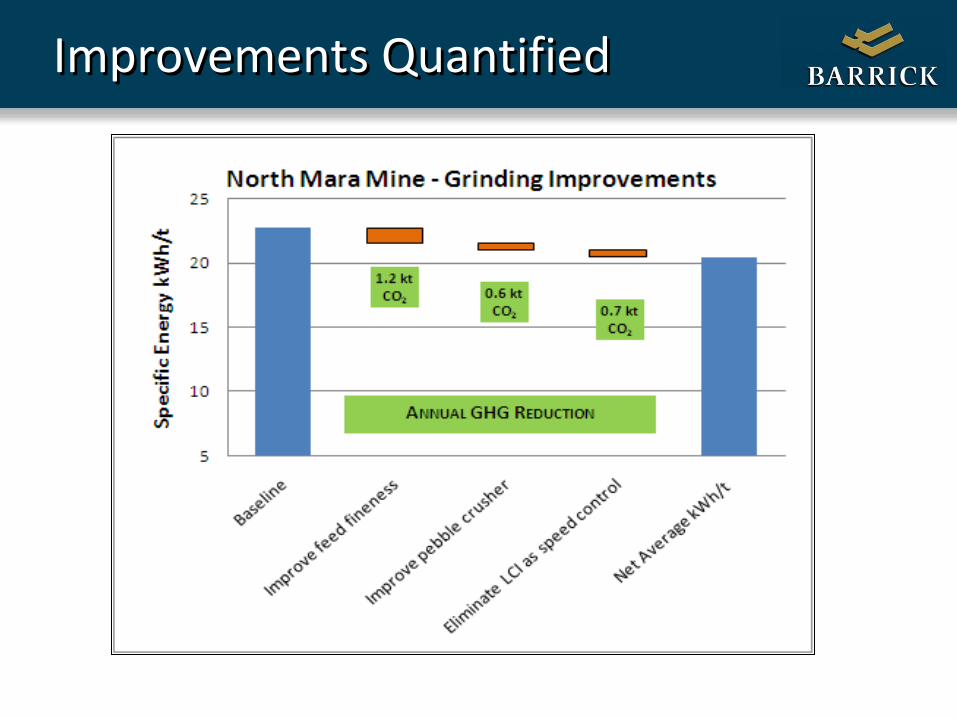
Improvements Quantified

Improvements Quantified

Improvements Quantified

Energy and GHG Reductions from Three Improvement Events 60 million kWh annual savings = 216,000 GJ
– 0.5% net efficiency improvement for Barrick global – Average improvement of 3.7% of the 3 mine sites’ total
energy – Average of 8% improvement of the processor’s footprint
43,000 tonnes of CO2(e) annual reduction – 0.9% net GHG efficiency improvement for Barrick global – Average improvement of 5.3% for 3 mine sites’ total
energy. $5.2 million annual direct electrical savings $1.1 million potential future annual savings with CO2
projected at $25/tonne

Acknowledgements
Barrick Gold A corporation with the enthusiasm to advance efforts
in energy stewardship
Co-authors: • JF Dupont – Detour Gold • Christiaan Brits – African Barrick, North Mara Mine • Julius Stieger - Barrick, Cortez Mine • Bob Blain – Barrick, Cowal Mine