improving image segmentation performance and quantitative
TRANSCRIPT

Improving image segmentation performance andquantitative analysis via a computer-aided gradingmethodology for optical coherence tomography retinalimage analysis
Delia Cabrera DebucUniversity of MiamiMiller School of MedicineBascom Palmer Eye Institute1638 NorthWest 10th AvenueMiami, Florida 33136
Harry M. SalinasMount Sinai School of MedicineOne Gustave L. Levy PlaceNew York, New York 10029
Sudarshan RanganathanUniversity of MiamiMiller School of MedicineBascom Palmer Eye Institute1638 Northwest 10th AvenueMiami, Florida 33136
Erika TátraiSemmelweis UniversityDepartment of Ophthalmology39 Mária StrausseBudapest, 1085 Hungary
Wei GaoMeixiao ShenJianhua WangUniversity of MiamiMiller School of MedicineBascom Palmer Eye Institute1638 Northwest 10th AvenueMiami, Florida 33136
Gábor M. SomfaiSemmelweis UniversityDepartment of Ophthalmology39 Mária StrausseBudapest, 1085 Hungary
Carmen A. PuliafitoUniversity of Southern CaliforniaKeck School of Medicine1975 Zonal Avenue, KAM 500Los Angeles, California 90089
Abstract. We demonstrate quantitative analysis and error correctionof optical coherence tomography �OCT� retinal images by using acustom-built, computer-aided grading methodology. A total of 60 Stra-tus OCT �Carl Zeiss Meditec, Dublin, California� B-scans collectedfrom ten normal healthy eyes are analyzed by two independent grad-ers. The average retinal thickness per macular region is comparedwith the automated Stratus OCT results. Intergrader and intragraderreproducibility is calculated by Bland-Altman plots of the mean dif-ference between both gradings and by Pearson correlation coeffi-cients. In addition, the correlation between Stratus OCT and ourmethodology-derived thickness is also presented. The mean thicknessdifference between Stratus OCT and our methodology is 6.53 �mand 26.71 �m when using the inner segment/outer segment �IS/OS�junction and outer segment/retinal pigment epithelium �OS/RPE� junc-tion as the outer retinal border, respectively. Overall, the median ofthe thickness differences as a percentage of the mean thickness is lessthan 1% and 2% for the intragrader and intergrader reproducibilitytest, respectively. The measurement accuracy range of the OCT retinalimage analysis �OCTRIMA� algorithm is between 0.27 and 1.47 �mand 0.6 and 1.76 �m for the intragrader and intergrader reproducibil-ity tests, respectively. Pearson correlation coefficients demonstrateR2�0.98 for all Early Treatment Diabetic Retinopathy Study �ETDRS�regions. Our methodology facilitates a more robust and localizedquantification of the retinal structure in normal healthy controls andpatients with clinically significant intraretinal features. © 2010 Society ofPhoto-Optical Instrumentation Engineers. �DOI: 10.1117/1.3470116�
Keywords: optical coherence tomography; retinal image analysis; segmentation;image processing.Paper 09520R received Nov. 21, 2009; revised manuscript received May 4, 2010;accepted for publication Jun. 3, 2010; published online Aug. 9, 2010.
1 Introduction
Optical coherence tomography �OCT� is a relatively new im-aging modality that can generate high-resolution and high-
contrast cross sectional images of thin layers of biologicaltissue.1 This imaging system is based on the principle of op-tical low-coherence interferometry that measures the echotime delay and intensity of backscattered light and thus re-solves the position of reflective or optical backscattering siteswithin a tissue sample.1,2 To use OCT to quantitatively evalu-
1083-3668/2010/15�4�/046015/12/$25.00 © 2010 SPIE
Address all correspondence to: Delia Cabrera DeBuc, Ph.D, University of Mi-ami, Miller School of Medicine, Bascom Palmer Eye Institute, 1638 Northwest10th Avenue, Miami, Florida 33136. Tel: 305-482-4376; Fax: 305-326-6547.E-mail: [email protected]
Journal of Biomedical Optics 15�4�, 046015 �July/August 2010�
Journal of Biomedical Optics July/August 2010 � Vol. 15�4�046015-1
Downloaded From: https://journals.spiedigitallibrary.org/journals/Journal-of-Biomedical-Optics on 27 Nov 2021Terms of Use: https://journals.spiedigitallibrary.org/terms-of-use
ate structural changes in the retina caused by a number ofsevere eye diseases, a segmentation-based determination ofthe thicknesses of the different intraretinal layers is required.Segmentation is an important component of OCT data pro-cessing, in which different intraretinal layers are identifiedand separated from each other. There are two main drawbackswith automated segmentation approaches. The first is that dis-eased retinal structure can vary substantially among patients.The structural disruption observed in these patients often pro-duces artifacts to segmentation results. The other main draw-back originates from inaccuracies in the data acquisition sys-tems due to the noisy speckle field superimposed on imagedstructures. Consequently, the intervention of a human operatoris often needed to correct the segmentation result manually. Inaddition, an optimal user interface is usually lacking in theimaging applications of OCT devices to carefully review seg-mentation results and correct them if required. As a result,parameter outputs of some commercial OCT systems are of-ten used without caution in retinal examinations by the oph-thalmic community.
Computer-aided manual correction of OCT segmentationcan be useful for correcting thickness measurements in caseswith errors of automated retinal boundary detection, and canalso be useful for quantitative analysis of clinically relevantfeatures, such as the volume of subretinal fluid and intraretinalfluid-filled regions.3 It is well known that detection algorithmsfail when the retinal structure is disrupted by fluid accumula-tion, which can lead to inaccurate measurements of retinalthickness. Thus, there is a need for developing efficient, user-friendly software tools that will supplement accurate auto-mated boundary detection algorithms to generate more precisesegmentation of the various cellular layers of the retina. Forinstance, an interactive procedure could be activated, bymeans of which the user edits the segmentation directly orprovides extra information to reconfigure the computationalpart. If the result generated by the computational part iswrong, the user can correct it directly using a manual editor.
The commercial Stratus OCT �Carl Zeiss Meditec, Dublin,California� software has a measurement capability limited tothickness calculation of the macula and retinal nerve fiberlayer �RNFL�. Thus, quantitative information on intraretinallayers is not provided by this instrument. This limitation in theStratus OCT system has stimulated interest in developing seg-mentation algorithms to better detect the local changes in theretinal structure.3–18 In addition, the quantification providedby this system is often imprecise because of erroneous detec-tion of the inner and outer borders of the retina.19–21 As aresult, potentially useful quantitative information is not ex-tracted by the current commercial Stratus OCT. In an effort toprovide additional retinal quantifications along with accurateautomatic/semiautomatic detection, various computer-aidedgrading procedures have been introduced.3–18 Specifically, wedeveloped a computer-aided grading methodology for OCTretinal image analysis �OCTRIMA� that is an interactive,user-friendly stand-alone application for analyzing StratusOCT retinal images. The OCTRIMA methodology integratesa denoising and edge enhancement technique along with asegmentation algorithm previously developed by CabreraFernández, Salinas, and Puliafito.6 The denoising and edgeenhancement techniques are part of a novel preprocessing stepthat facilitates better automatic segmentation results. In addi-
tion, the semiautomatic segmentation correction tool of OCT-RIMA minimizes segmentation errors generated during theOCTRIMA’s automatic segmentation process, significantly re-ducing the need for manual error corrections. It also givesquantitative information of intraretinal structures, and facili-tates the analysis of other retinal features that may be of di-agnostic and prognostic value, such as morphology andreflectivity.13,19,21
In this work we aim to describe the correlation betweenStratus OCT and OCTRIMA-derived thickness data, alongwith the intergrader and intragrader reproducibility of OCT-RIMA segmentation using a set of data describedpreviously.22 In addition, we describe how this tool correctserroneous automatic segmentation results, and also demon-strate the applicability of OCTRIMA to images obtained bythird and fourth generation OCT devices.
2 Materials and Methods2.1 Data Collection to be StudiedThe study conducted in this work was approved by the Insti-tutional Review Board in our institutions. The research ad-hered to the tenets set forth in the declaration of Helsinki. AllStratus OCT study cases were obtained using the radial linesprotocol �1024 samples�512 A-scans per B-scan� on asingle Stratus OCT instrument �version 4.0 software�. AllStratus OCT scans were taken at the macula. In addition, allsubjects scanned with the Stratus OCT unit underwent visualacuity testing with refraction and a complete slit-lamp exami-nation. Informed consent was obtained from each subject.
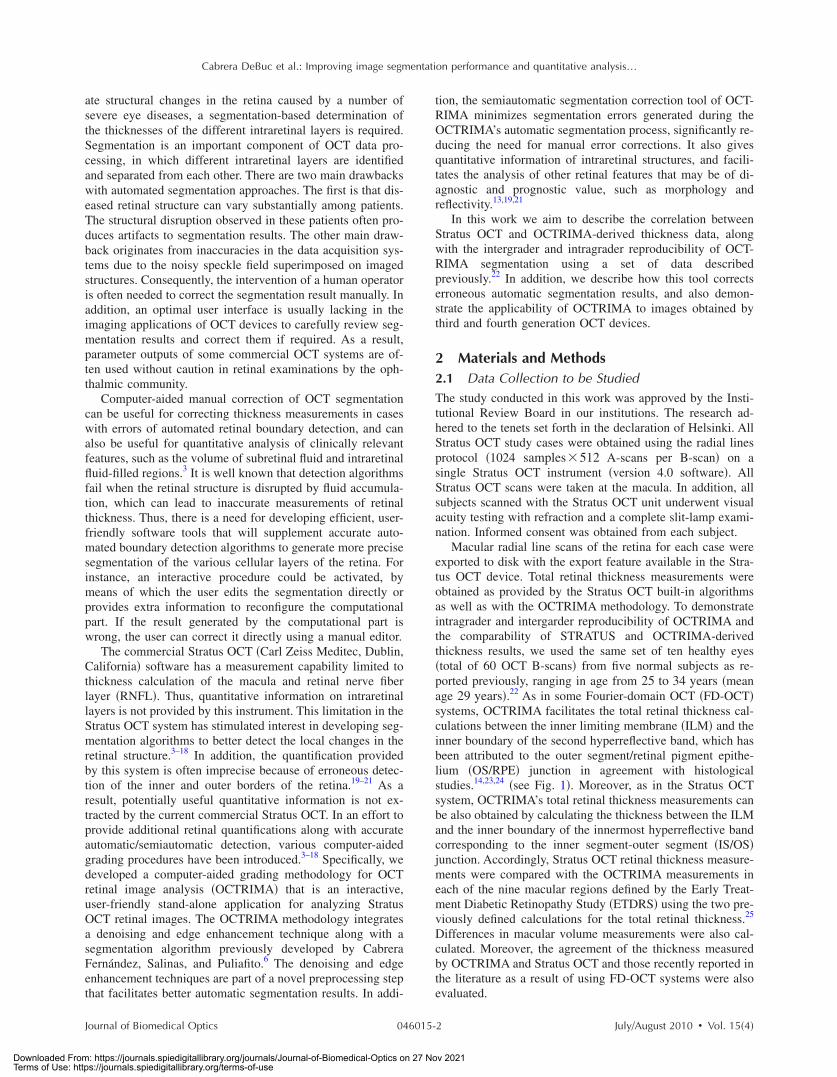
Macular radial line scans of the retina for each case wereexported to disk with the export feature available in the Stra-tus OCT device. Total retinal thickness measurements wereobtained as provided by the Stratus OCT built-in algorithmsas well as with the OCTRIMA methodology. To demonstrateintragrader and intergarder reproducibility of OCTRIMA andthe comparability of STRATUS and OCTRIMA-derivedthickness results, we used the same set of ten healthy eyes�total of 60 OCT B-scans� from five normal subjects as re-ported previously, ranging in age from 25 to 34 years �meanage 29 years�.22 As in some Fourier-domain OCT �FD-OCT�systems, OCTRIMA facilitates the total retinal thickness cal-culations between the inner limiting membrane �ILM� and theinner boundary of the second hyperreflective band, which hasbeen attributed to the outer segment/retinal pigment epithe-lium �OS/RPE� junction in agreement with histologicalstudies.14,23,24 �see Fig. 1�. Moreover, as in the Stratus OCTsystem, OCTRIMA’s total retinal thickness measurements canbe also obtained by calculating the thickness between the ILMand the inner boundary of the innermost hyperreflective bandcorresponding to the inner segment-outer segment �IS/OS�junction. Accordingly, Stratus OCT retinal thickness measure-ments were compared with the OCTRIMA measurements ineach of the nine macular regions defined by the Early Treat-ment Diabetic Retinopathy Study �ETDRS� using the two pre-viously defined calculations for the total retinal thickness.25
Differences in macular volume measurements were also cal-culated. Moreover, the agreement of the thickness measuredby OCTRIMA and Stratus OCT and those recently reported inthe literature as a result of using FD-OCT systems were alsoevaluated.
Cabrera DeBuc et al.: Improving image segmentation performance and quantitative analysis…
Journal of Biomedical Optics July/August 2010 � Vol. 15�4�046015-2
Downloaded From: https://journals.spiedigitallibrary.org/journals/Journal-of-Biomedical-Optics on 27 Nov 2021Terms of Use: https://journals.spiedigitallibrary.org/terms-of-use
Complementary cases with clinically significant intrareti-nal features from Stratus OCT were also collected only fordemonstration purposes of the image segmentation perfor-mance and error correction using OCTRIMA. Particularly,these cases included a patient with mild nonproliferative dia-betic retinopathy without macular edema and a patient withneovascular age-related macular degeneration. In both cases,the macular radial lines protocol was used. Moreover, to es-tablish the feasibility of OCTRIMA for analyzing imagesfrom advanced OCT imaging systems, two image sets fromtwo different FD-OCT systems were also analyzed with OCT-RIMA. One set of images was obtained from the BioptigenSpectral Domain Ophthalmic Imaging System �Bioptigen In-corporated, Research Triangle Park, North Carolina�, whilethe other set was scanned by a custom-developed ultrahighFD-OCT adapted from our anterior segment OCT system with�3-�m axial resolution. The system configurations for thesetwo FD-OCT systems have been detailed elsewhere.26,27
2.2 Computer-Aided Optical Coherence TomographyGrading Method
The method used for OCT image analysis �OCTRIMA� wasdeveloped using the Matlab graphical user interface designenvironment tool. The OCTRIMA methodology essentiallyprovides dual functionality by combining image enhancement
and denoising of Stratus OCT images along with automaticsegmentation of the various cellular layers of the retina. Moredetails of the segmentation and preprocessing process can befound in Cabrera Fernández, Salinas, and Puliafito,6 and Sali-nas and Cabrera Fernández.28 Moreover, OCTRIMA has thecapability to perform calculations based on measured valuesof corrected thickness, and reflectance of the various cellularlayers of the retina and the whole macula.
OCTRIMA also facilitates semiautomatic correction ofdiscontinuities in each detected boundary after automated seg-mentation, along with manual error correction using directvisual evaluation of the detected boundaries. Particularly, themethodology allows the operator to utilize simple computermouse clicks to fix various boundaries in each of the six radialline OCT B-scans by using predefined corrective functions�see Fig. 2�. These errors are mainly due to both the presenceof high reflectivity regions in the inner retina, and loss ofretinal structure information in local regions along the retinalcross section, as visualized by the commercial OCT system.Since normative data for OCT analysis are crucial to comparevarious treatment strategies, OCTRIMA facilitates normativedata from healthy controls and also allows the user to generatea new norm using healthy or pathological subjects. The OCT-RIMA’s norm is based on data from 74 healthy subjects�35�13 years� as described previously.22 In addition, OCT-
Fig. 1 OCTRIMA screenshot showing the segmentation results for an OCT B-scan obtained from a healthy normal eye. The layers have beenlabeled as: ILM �inner limiting membrane�, RNFL �retinal nerve fiber layer�, GCL+IPL complex �ganglion cell layer and inner plexiform layer�, INL�inner nuclear layer�, OPL �outer plexiform layer�, ONL �outer nuclear layer�, OS �outer segment of photoreceptors�, and retinal pigment epitheliallayer �RPE�. We note that the sublayer labeled as ONL is actually enclosing the external limiting membrane �ELM� and IS, but in the standard10-�m resolution OCT image this thin membrane cannot be visualized clearly, making the segmentation of the IS difficult. Thus this layerclassification is our assumption and does not reflect the actual anatomic structure. Also, observe that since there is no significant luminancetransition between GCL and IPL, the outer boundary of the GCL layer is difficult to visualize in the Stratus OCT image shown. Thus, a combinedGCL+IPL layer is preferable.
Cabrera DeBuc et al.: Improving image segmentation performance and quantitative analysis…
Journal of Biomedical Optics July/August 2010 � Vol. 15�4�046015-3
Downloaded From: https://journals.spiedigitallibrary.org/journals/Journal-of-Biomedical-Optics on 27 Nov 2021Terms of Use: https://journals.spiedigitallibrary.org/terms-of-use

RIMA provides a standardized method for reporting changesin thickness as a percentage of total possible change based onnormative OCT data.29
2.3 Statistical MethodsThe coefficients of reproducibility were calculated using themethods outlined by Bland and Altman for each of the aver-aged thickness measurements obtained for the total retina andintraretinal layers.30,31 The coefficients of reproducibility werecomputed from the standard deviations �SDs� of the differ-ences between measurements made by each grader. The sta-tistical analysis was performed using the software packageSPSS version 16 �SPSS Incorporated, Chicago, Illinois�.
3 Results3.1 Comparison of Stratus OCT Thickness
Measurements and Optical CoherenceTomography Retinal Image Analysis ThicknessMeasurements
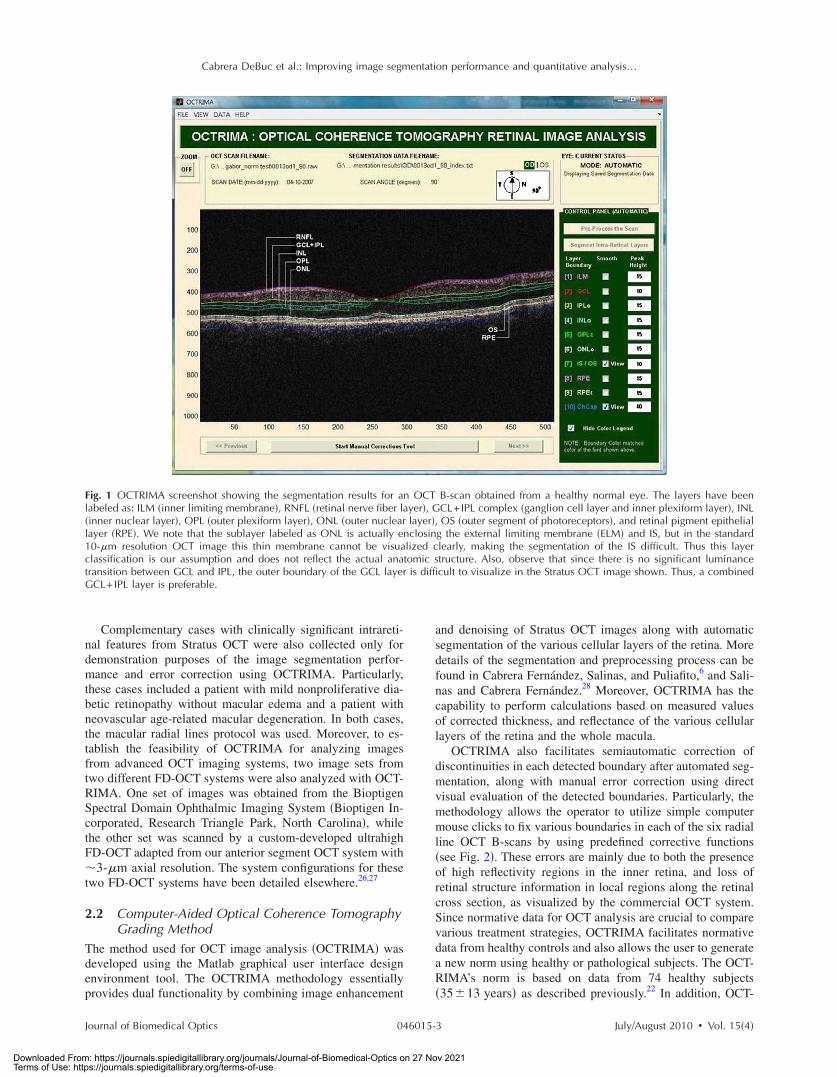
In contrast to Stratus OCT thickness calculations, OCTRIMAmeasurements of total retinal thickness were obtained usingtwo different assumptions for the outer retinal boundary: 1.the inner boundary of the innermost hyperreflective band cor-responding to the IS/OS junction �as defined in Stratus OCT�,and 2. the inner border of the second hyperreflective band,assumed to be the OS/RPE junction. We note that the firstassumption allows a fair comparison between the automatedresults of Stratus OCT and OCTRIMA algorithms for the con-vention used by the Stratus OCT algorithms. Table 1 showsthe level of agreement between OCTRIMA and Stratus OCTmeasurements when the two different outer retinal border as-sumptions are applied on the same Stratus OCT images. Pear-son correlation coefficients demonstrated R2�0.98 for allETDRS regions �data not shown�.
When OCTRIMA calculations used the conventionadopted by Stratus OCT �i.e., inner border of the innermosthyperreflective band as the outer retinal border�, the meanthickness difference was 6.53 �m, which corresponded to 3%of the measured Stratus OCT retinal thickness. Measurementsin the foveal central region �R1�, inferior inner region �R4�,and, nasal, inferior, and temporal outer �R7, R8, and R9� re-gions showed the greatest disagreement between the OCT-RIMA and Stratus algorithms. Particularly, the mean differ-
ence included only 4% �except in R8� of the measured valueobtained by the Stratus OCT algorithms. As expected, thefoveal center point �FCP� measurements demonstrated bestagreement, because no interpolation is required for these cal-culations �data not shown�. Moreover, total macular volume, ameasure derived from thickness in all data points of themacula, was 3% higher by OCTRIMA compared to StratusOCT results, also supporting an average difference of 3% inthickness measurements. In contrast, when OCTRIMA calcu-lations used the inner border of the second hyperreflectiveband �i.e., OS/RPE junction� as the outer retinal border, themean thickness difference corresponded to 11% of the mea-sured Stratus OCT retinal thickness. Similarly, the mean dif-ference for the foveal region �R1� included only 17% of themeasured value obtained by the Stratus OCT algorithms.Moreover, the mean difference results for the superior, nasal,inferior, and temporal inner and outer regions of the macula�R2 through R9� included 8 to 12% of the Stratus OCT mea-surements �see Table 1�. Correspondingly, total macular vol-ume was 10% higher by OCTRIMA compared to Stratus OCTresults, also supporting an average difference of 10% in thick-ness measurements.
3.2 Intragrader and Intergrader Reproducibilityof Thickness Measurements
As a result of scanning a total of ten healthy eyes, a total of 60OCT B-scans were collected and analyzed by two indepen-dent experienced graders �G1 and G2�. Moreover, to assessthe overall performance of the OCTRIMA software, the aver-age �between the two graders� retinal thickness in each of thenine ETDRS regions obtained by OCTRIMA analysis wascompared with the automated Stratus OCT results. All scansin the study had a signal strength of 9 or 10. Algorithm per-formance was visually evaluated by the experienced gradersto detect segmentation errors. Criteria for algorithm error in-cluded evident disruption of the detected boundary �e.g.,small peaks, linear and curve offsets�, and/or detected bound-ary jumping to and from different anatomical structures �i.e.,false segmentation�. The average number of manual correc-tions needed per scan was three. The inner nuclear layer �INL�and outer plexiform layer �OPL� were the layers that requiredmost of the manual corrections.
Table 2 shows the reproducibility attained by one grader�G2� after analyzing each of the ten eyes at two separate times�intragrader test, one week interval between analyses� usingOCTRIMA software. Thickness measurements �mean�SD�of the total retina and intraretinal layers are also shown inTable 2. The coefficient of reproducibility �CR� obtained forthe thickness measurements was less than 0.2% for the totalretina, less than 0.4% for the ONL, and less than 3% for theremaining layers. Overall, the median of the thickness differ-ences as a percentage of the mean thickness was less than 1%.According to our results, the measurement accuracy of theOCTRIMA algorithm ranged between 0.27 to 1.47 �m �seeTable 2�. Excellent intragrader agreement could be observedin the Bland-Altman plots of the mean difference betweenboth grading sessions for each of the calculated intraretinallayer thicknesses �see Fig. 3�.
Table 3 shows the level of agreement between the twograders �intergrader reproducibility test, i.e., G1 versus G2�
Fig. 2 Flowchart showing the classification of segmentation errors andtheir corresponding manual corrective functions.
Cabrera DeBuc et al.: Improving image segmentation performance and quantitative analysis…
Journal of Biomedical Optics July/August 2010 � Vol. 15�4�046015-4
Downloaded From: https://journals.spiedigitallibrary.org/journals/Journal-of-Biomedical-Optics on 27 Nov 2021Terms of Use: https://journals.spiedigitallibrary.org/terms-of-use
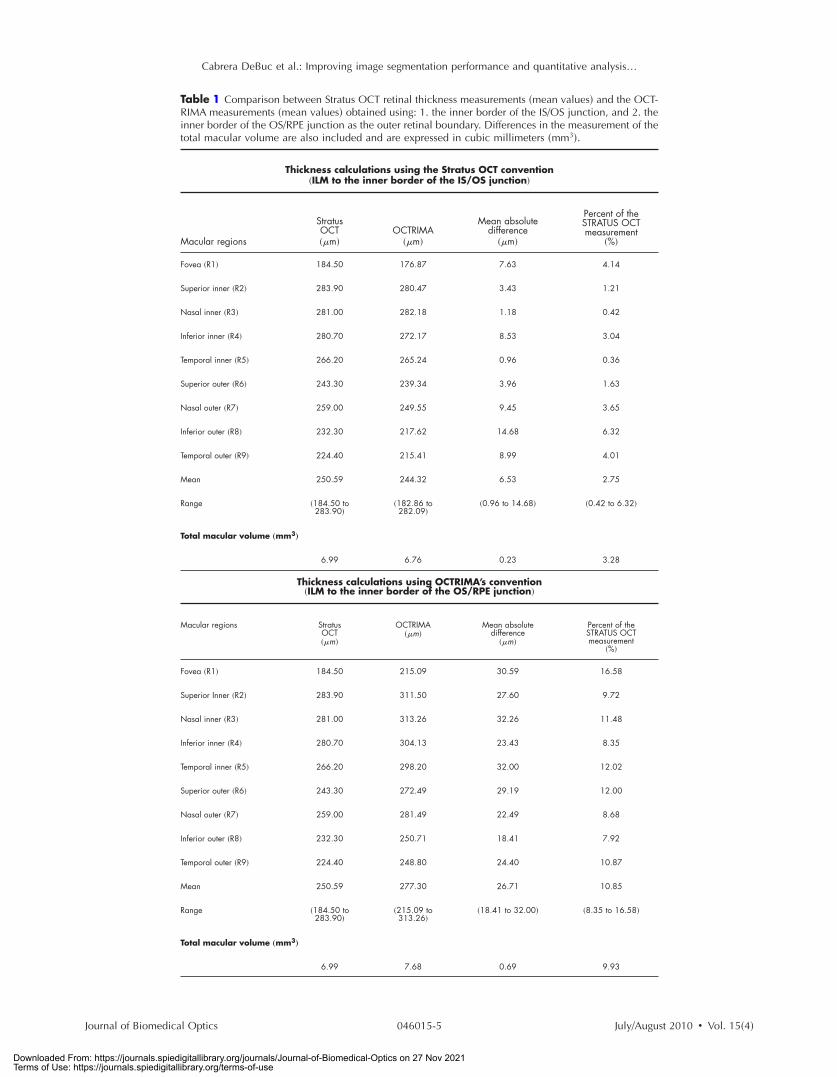
Table 1 Comparison between Stratus OCT retinal thickness measurements �mean values� and the OCT-RIMA measurements �mean values� obtained using: 1. the inner border of the IS/OS junction, and 2. theinner border of the OS/RPE junction as the outer retinal boundary. Differences in the measurement of thetotal macular volume are also included and are expressed in cubic millimeters �mm3�.
Thickness calculations using the Stratus OCT convention�ILM to the inner border of the IS/OS junction�
Macular regions
StratusOCT��m�
OCTRIMA��m�
Mean absolutedifference
��m�
Percent of theSTRATUS OCTmeasurement
�%�
Fovea �R1� 184.50 176.87 7.63 4.14
Superior inner �R2� 283.90 280.47 3.43 1.21
Nasal inner �R3� 281.00 282.18 1.18 0.42
Inferior inner �R4� 280.70 272.17 8.53 3.04
Temporal inner �R5� 266.20 265.24 0.96 0.36
Superior outer �R6� 243.30 239.34 3.96 1.63
Nasal outer �R7� 259.00 249.55 9.45 3.65
Inferior outer �R8� 232.30 217.62 14.68 6.32
Temporal outer �R9� 224.40 215.41 8.99 4.01
Mean 250.59 244.32 6.53 2.75
Range �184.50 to283.90�
�182.86 to282.09�
�0.96 to 14.68� �0.42 to 6.32�
Total macular volume „mm3…
6.99 6.76 0.23 3.28
Thickness calculations using OCTRIMA’s convention�ILM to the inner border of the OS/RPE junction�
Macular regions StratusOCT��m�
OCTRIMA��m�
Mean absolutedifference
��m�
Percent of theSTRATUS OCTmeasurement
�%�
Fovea �R1� 184.50 215.09 30.59 16.58
Superior Inner �R2� 283.90 311.50 27.60 9.72
Nasal inner �R3� 281.00 313.26 32.26 11.48
Inferior inner �R4� 280.70 304.13 23.43 8.35
Temporal inner �R5� 266.20 298.20 32.00 12.02
Superior outer �R6� 243.30 272.49 29.19 12.00
Nasal outer �R7� 259.00 281.49 22.49 8.68
Inferior outer �R8� 232.30 250.71 18.41 7.92
Temporal outer �R9� 224.40 248.80 24.40 10.87
Mean 250.59 277.30 26.71 10.85
Range �184.50 to283.90�
�215.09 to313.26�
�18.41 to 32.00� �8.35 to 16.58�
Total macular volume „mm3…
6.99 7.68 0.69 9.93
Cabrera DeBuc et al.: Improving image segmentation performance and quantitative analysis…
Journal of Biomedical Optics July/August 2010 � Vol. 15�4�046015-5
Downloaded From: https://journals.spiedigitallibrary.org/journals/Journal-of-Biomedical-Optics on 27 Nov 2021Terms of Use: https://journals.spiedigitallibrary.org/terms-of-use

using the OCTRIMA software. The coefficient of reproduc-ibility obtained for the thickness measurements was less than0.5% for the total retina, less than 0.7% for the ONL, and lessthan 5% for the remaining layers. According to our results, themeasurement accuracy of our algorithm ranged between0.6 to 1.76 �m �see Table 3�. Overall, the median of thethickness differences as a percentage of the mean thicknesswas less than 2%.
3.3 Image Segmentation Performance and ErrorCorrection Using Optical CoherenceTomography Retinal Image Analysis
Illustrative cases of diseases with subretinal anomalies andrepresentative intraretinal boundary detection errors areshown in Figs. 4–6. Compared to a free-hand correctionwhere curves are manually drawn, OCTRIMA’s manual cor-rective functions facilitate the correction of segmentation er-rors using less reviewing time. The advantage is based on thefact that OCTRIMA manual correction is performed after thesemiautomatic correction of errors, which reduces signifi-cantly the time required to redraw the curves.
3.3.1 Mild nonproliferative diabetic retinopathywithout macular edema
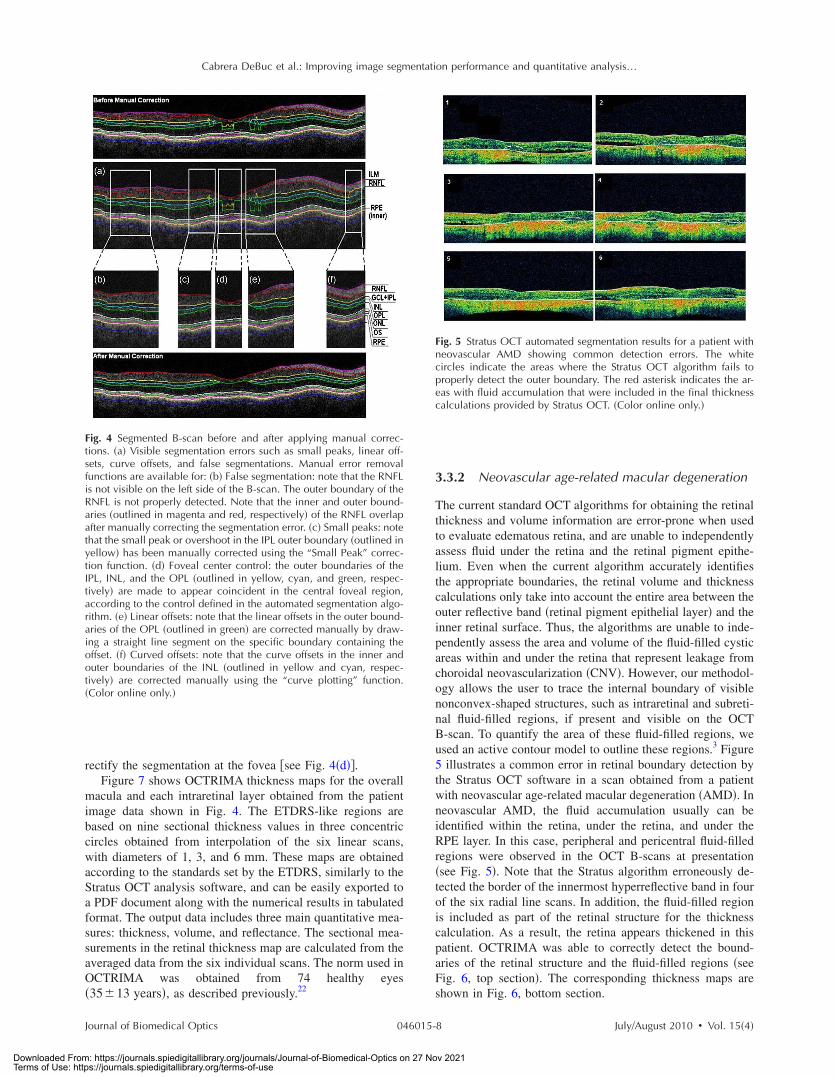
Figure 4 shows an OCTRIMA segmented B-scan before andafter applying manual corrections. In this study case, the rep-resentative B-scan was taken from a set of images obtainedfor a diabetic patient with mild nonproliferative diabetic ret-inopathy without macular edema �male, 59 years old�. Char-acteristic intraretinal boundary detection errors such as smallpeaks, linear offsets, curve offsets, and false segmentationsare illustrated in Fig. 4�a�. False segmentation refers to thefalsely detected inner and/or outer boundaries of an intrareti-nal layer. This particular error is most commonly found dur-ing the RNFL’s outer border detection. Specifically, there are
certain cases in which the true anatomical thickness of theRNFL layer �or some regions of the RNFL layer� might benegligible. In other cases, one side of the RNFL layer is com-pletely invisible in the OCT image, like for example in thetemporal part of a horizontal B-scan �see Fig. 4�b��. In suchcases, a correction is required to overlap the inner and outerboundaries of the RNFL layer in the regions of negligiblethickness �see Figs. 4�c� and 4�d��. However, sometimes theboundary detection algorithm fails in such specific cases whenlocalized bright spots of high intensity appear on some re-gions of the RNFL layer, and falsely displays the outer bound-ary of the RNFL layer as a result of the peak search algorithm,which looks for zero crossings in the structure. Hence, theRNFL outer boundary must be manually corrected to appearoverlapped on the inner boundary in the invisible part of thelayer. As can be seen in Fig. 4�b�, the ILM boundary on theinner side of the RNFL is detected but no boundary is de-tected on the outer left side, since the RNFL is not visible onthis �temporal� side for this particular scan, whereas theRNFL is bright and clearly visible on the right �nasal� side ofthe scan �see Figs. 4�a� and 4�b��. Figure 4�c� shows themanually corrected outer boundary of the IPL �outlined inyellow� using the “small peak” corrective function of themanual correction software tool, which removes the over-shoots or undershoots in the individual boundaries.
These are also parts of a boundary that form a straight linesegment, but are incorrectly detected as a peak or an elevatedor depressed line segment by the automated segmentation al-gorithm. This detection error is classified as a linear offset. Toresolve this class of error, the user has to manually select twopoints to draw a straight line segment on the specific bound-ary containing the offset. For example, a straight line segmentwas manually drawn to correct the linear offset in the outerboundary of the OPL �see the boundary outlined in green inFig. 4�e��. Figure 4�f� shows the manual corrections for the
Table 2 Intragrader reproducibility using OCTRIMA. *Mean thickness value averaged across all teneyes. We note that the mean thickness value is a result of averaging the uninterpolated thickness mea-surements at every A-scan location for all six B-scans of all ten eyes. **This value is calculated bysubtracting OCTRIMA thickness measurement obtained during the first grading from the OCTRIMA thick-ness measurement obtained during the second grading for each eye by the same grader G2, and thentaking the absolute value. †Median of the differences between measurements expressed as a percentageof mean thickness across all ten eyes.
Meanthickness
�grader 1���m�
Meanthickness
�grader 2���m�
*Meanthickness±
SD��m�
**Meanabsolute
difference��m�
†Median ofdifference/
meanthickness
�%�CR
��m�CR�%�
RNFL 40.76 40.76 40.76±1.39 0.17 0.22 0.47 1.16
GCL+IPL 72.65 72.79 72.72±7.14 0.43 0.43 1.47 2.03
INL 34.30 34.50 34.40±1.25 0.25 0.56 0.50 1.45
OPL 32.64 32.62 32.63±0.62 0.22 0.52 0.57 1.76
ONL 88.37 88.35 88.36±4.98 0.10 0.08 0.27 0.30
Totalretina
280.50 280.63 280.56±12.39 0.21 0.07 0.46 0.17
Cabrera DeBuc et al.: Improving image segmentation performance and quantitative analysis…
Journal of Biomedical Optics July/August 2010 � Vol. 15�4�046015-6
Downloaded From: https://journals.spiedigitallibrary.org/journals/Journal-of-Biomedical-Optics on 27 Nov 2021Terms of Use: https://journals.spiedigitallibrary.org/terms-of-use
inner and outer boundaries of the INL �outlined in yellow andcyan, respectively� that had segmentation errors as a result ofcurve offsets �see Fig. 4�a��. Curve offset is a term given tothe curved portion of a boundary that has not been recognizedas a curve, but instead has been incorrectly segmented as anelevated or depressed curve. Curve offsets have been rectifiedusing a function based on a customized contour model origi-nally introduced to identify nonconvex shapes in OCTimages.3 This function allows the user to select multipleclosely spaced points that will be joined to trace a curve andremove the offset. Figure 4�f� shows the result of the “curveplotting” function applied to correct the inner and outerboundaries of the INL �outlined in yellow and cyan, respec-tively�.
Additionally, an OCTRIMA predefined control is also inplace for the inner retinal layers �RNFL, ganglion cell, andinner plexiform layer complex �GCL+IPL� and INL� andOPL in a 1.5-mm-diam zone in the fovea, where retinal re-flections are minimally visible.6 The control forces the ILM,the inner and outer side of the GCL+IPL complex, and theouter side of the INL and OPL to be coincident in this region�see Fig. 4�a��. Sometimes, small peaks appear at the periph-ery of this controlled foveal region. In such a case, it appearsthat the coincident layers deviate from the true foveal visibleboundary and need to be corrected so that they overlap in theperiphery of the controlled foveal region. Thus, the “overlap”function of the manual correction software tool is useful to
Fig. 3 Bland-Altman plots of the the mean difference between both gradings for each intraretinal layer thickness calculated by the same grader intwo separate occasions using OCTRIMA. Mean layer thickness for each subject is plotted against the difference in layer thickness between the twograding procedures. Solid lines show the mean of the differences between the two gradings, while dashed lines represent the CR values.
Cabrera DeBuc et al.: Improving image segmentation performance and quantitative analysis…
Journal of Biomedical Optics July/August 2010 � Vol. 15�4�046015-7
Downloaded From: https://journals.spiedigitallibrary.org/journals/Journal-of-Biomedical-Optics on 27 Nov 2021Terms of Use: https://journals.spiedigitallibrary.org/terms-of-use
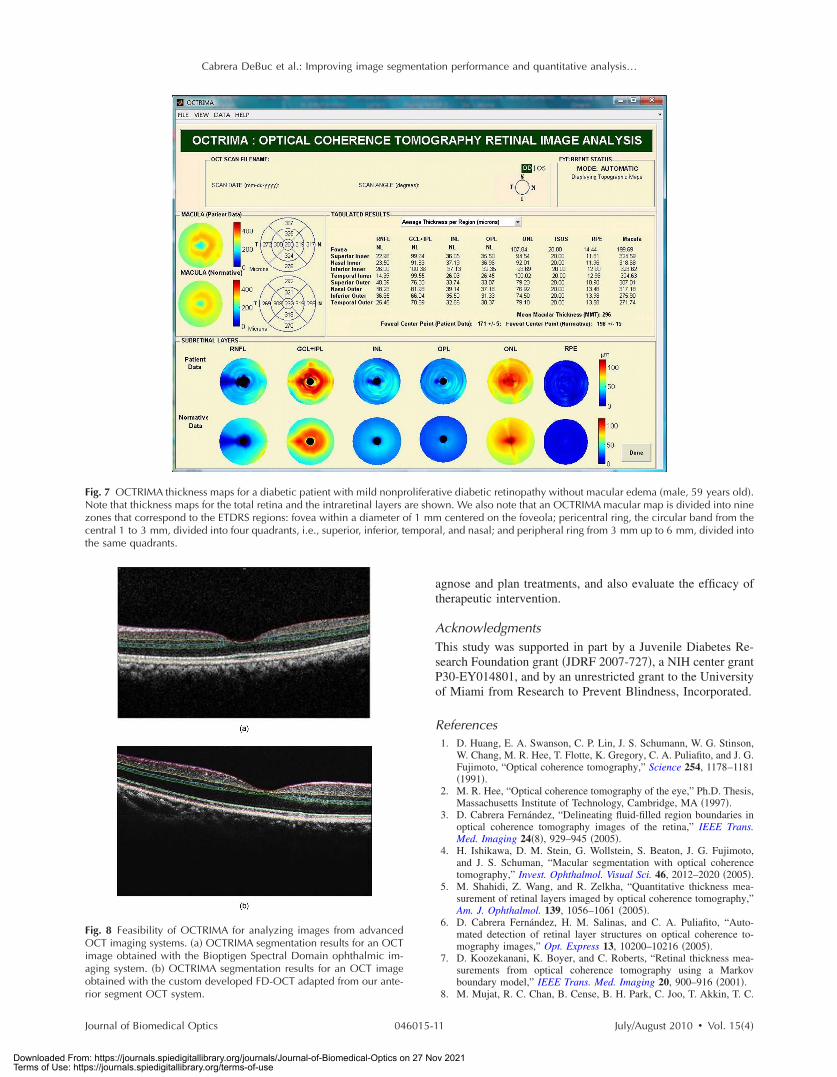
rectify the segmentation at the fovea �see Fig. 4�d��.Figure 7 shows OCTRIMA thickness maps for the overall
macula and each intraretinal layer obtained from the patientimage data shown in Fig. 4. The ETDRS-like regions arebased on nine sectional thickness values in three concentriccircles obtained from interpolation of the six linear scans,with diameters of 1, 3, and 6 mm. These maps are obtainedaccording to the standards set by the ETDRS, similarly to theStratus OCT analysis software, and can be easily exported toa PDF document along with the numerical results in tabulatedformat. The output data includes three main quantitative mea-sures: thickness, volume, and reflectance. The sectional mea-surements in the retinal thickness map are calculated from theaveraged data from the six individual scans. The norm used inOCTRIMA was obtained from 74 healthy eyes�35�13 years�, as described previously.22
3.3.2 Neovascular age-related macular degeneration
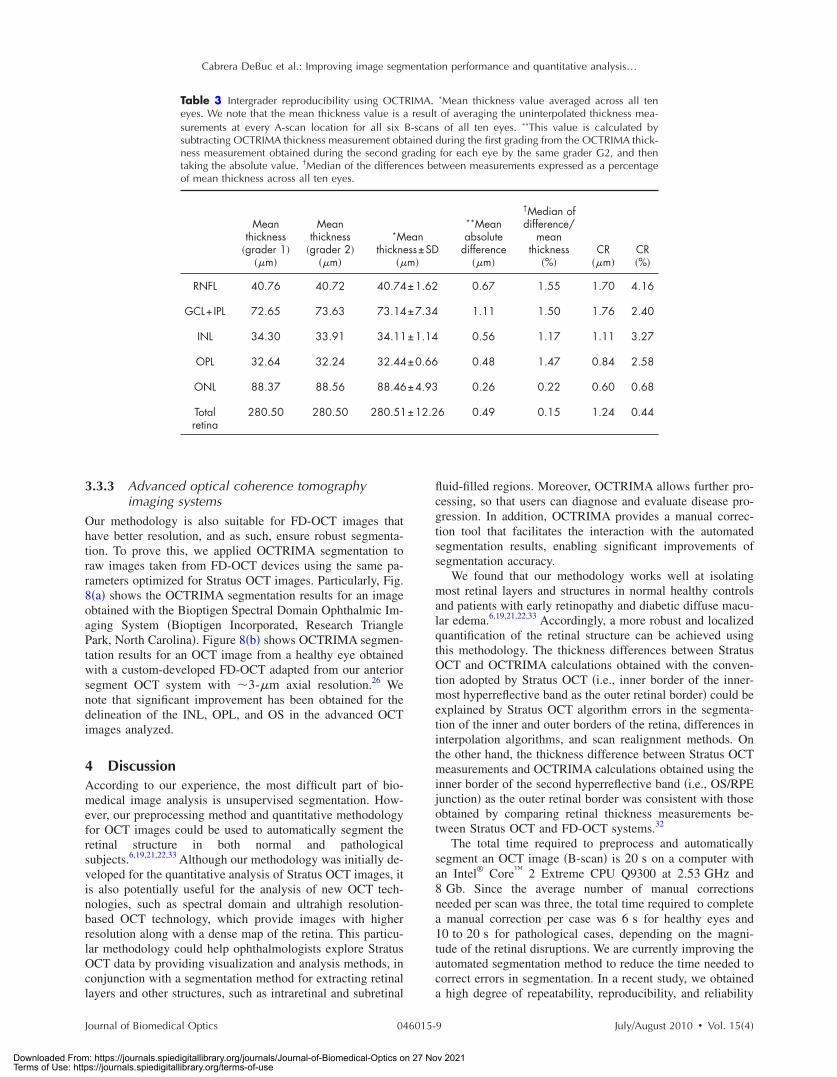
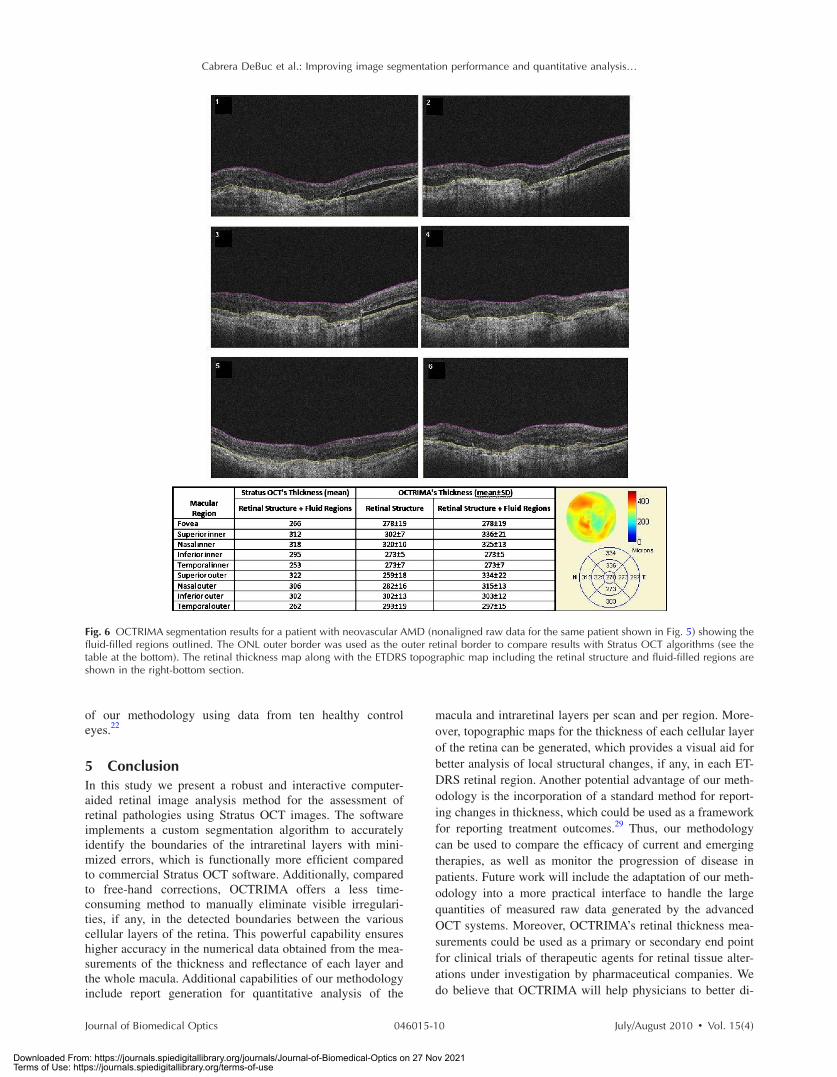
The current standard OCT algorithms for obtaining the retinalthickness and volume information are error-prone when usedto evaluate edematous retina, and are unable to independentlyassess fluid under the retina and the retinal pigment epithe-lium. Even when the current algorithm accurately identifiesthe appropriate boundaries, the retinal volume and thicknesscalculations only take into account the entire area between theouter reflective band �retinal pigment epithelial layer� and theinner retinal surface. Thus, the algorithms are unable to inde-pendently assess the area and volume of the fluid-filled cysticareas within and under the retina that represent leakage fromchoroidal neovascularization �CNV�. However, our methodol-ogy allows the user to trace the internal boundary of visiblenonconvex-shaped structures, such as intraretinal and subreti-nal fluid-filled regions, if present and visible on the OCTB-scan. To quantify the area of these fluid-filled regions, weused an active contour model to outline these regions.3 Figure5 illustrates a common error in retinal boundary detection bythe Stratus OCT software in a scan obtained from a patientwith neovascular age-related macular degeneration �AMD�. Inneovascular AMD, the fluid accumulation usually can beidentified within the retina, under the retina, and under theRPE layer. In this case, peripheral and pericentral fluid-filledregions were observed in the OCT B-scans at presentation�see Fig. 5�. Note that the Stratus algorithm erroneously de-tected the border of the innermost hyperreflective band in fourof the six radial line scans. In addition, the fluid-filled regionis included as part of the retinal structure for the thicknesscalculation. As a result, the retina appears thickened in thispatient. OCTRIMA was able to correctly detect the bound-aries of the retinal structure and the fluid-filled regions �seeFig. 6, top section�. The corresponding thickness maps areshown in Fig. 6, bottom section.
Fig. 4 Segmented B-scan before and after applying manual correc-tions. �a� Visible segmentation errors such as small peaks, linear off-sets, curve offsets, and false segmentations. Manual error removalfunctions are available for: �b� False segmentation: note that the RNFLis not visible on the left side of the B-scan. The outer boundary of theRNFL is not properly detected. Note that the inner and outer bound-aries �outlined in magenta and red, respectively� of the RNFL overlapafter manually correcting the segmentation error. �c� Small peaks: notethat the small peak or overshoot in the IPL outer boundary �outlined inyellow� has been manually corrected using the “Small Peak” correc-tion function. �d� Foveal center control: the outer boundaries of theIPL, INL, and the OPL �outlined in yellow, cyan, and green, respec-tively� are made to appear coincident in the central foveal region,according to the control defined in the automated segmentation algo-rithm. �e� Linear offsets: note that the linear offsets in the outer bound-aries of the OPL �outlined in green� are corrected manually by draw-ing a straight line segment on the specific boundary containing theoffset. �f� Curved offsets: note that the curve offsets in the inner andouter boundaries of the INL �outlined in yellow and cyan, respec-tively� are corrected manually using the “curve plotting” function.�Color online only.�
Fig. 5 Stratus OCT automated segmentation results for a patient withneovascular AMD showing common detection errors. The whitecircles indicate the areas where the Stratus OCT algorithm fails toproperly detect the outer boundary. The red asterisk indicates the ar-eas with fluid accumulation that were included in the final thicknesscalculations provided by Stratus OCT. �Color online only.�
Cabrera DeBuc et al.: Improving image segmentation performance and quantitative analysis…
Journal of Biomedical Optics July/August 2010 � Vol. 15�4�046015-8
Downloaded From: https://journals.spiedigitallibrary.org/journals/Journal-of-Biomedical-Optics on 27 Nov 2021Terms of Use: https://journals.spiedigitallibrary.org/terms-of-use
3.3.3 Advanced optical coherence tomographyimaging systems
Our methodology is also suitable for FD-OCT images thathave better resolution, and as such, ensure robust segmenta-tion. To prove this, we applied OCTRIMA segmentation toraw images taken from FD-OCT devices using the same pa-rameters optimized for Stratus OCT images. Particularly, Fig.8�a� shows the OCTRIMA segmentation results for an imageobtained with the Bioptigen Spectral Domain Ophthalmic Im-aging System �Bioptigen Incorporated, Research TrianglePark, North Carolina�. Figure 8�b� shows OCTRIMA segmen-tation results for an OCT image from a healthy eye obtainedwith a custom-developed FD-OCT adapted from our anteriorsegment OCT system with �3-�m axial resolution.26 Wenote that significant improvement has been obtained for thedelineation of the INL, OPL, and OS in the advanced OCTimages analyzed.
4 DiscussionAccording to our experience, the most difficult part of bio-medical image analysis is unsupervised segmentation. How-ever, our preprocessing method and quantitative methodologyfor OCT images could be used to automatically segment theretinal structure in both normal and pathologicalsubjects.6,19,21,22,33 Although our methodology was initially de-veloped for the quantitative analysis of Stratus OCT images, itis also potentially useful for the analysis of new OCT tech-nologies, such as spectral domain and ultrahigh resolution-based OCT technology, which provide images with higherresolution along with a dense map of the retina. This particu-lar methodology could help ophthalmologists explore StratusOCT data by providing visualization and analysis methods, inconjunction with a segmentation method for extracting retinallayers and other structures, such as intraretinal and subretinal
fluid-filled regions. Moreover, OCTRIMA allows further pro-cessing, so that users can diagnose and evaluate disease pro-gression. In addition, OCTRIMA provides a manual correc-tion tool that facilitates the interaction with the automatedsegmentation results, enabling significant improvements ofsegmentation accuracy.
We found that our methodology works well at isolatingmost retinal layers and structures in normal healthy controlsand patients with early retinopathy and diabetic diffuse macu-lar edema.6,19,21,22,33 Accordingly, a more robust and localizedquantification of the retinal structure can be achieved usingthis methodology. The thickness differences between StratusOCT and OCTRIMA calculations obtained with the conven-tion adopted by Stratus OCT �i.e., inner border of the inner-most hyperreflective band as the outer retinal border� could beexplained by Stratus OCT algorithm errors in the segmenta-tion of the inner and outer borders of the retina, differences ininterpolation algorithms, and scan realignment methods. Onthe other hand, the thickness difference between Stratus OCTmeasurements and OCTRIMA calculations obtained using theinner border of the second hyperreflective band �i.e., OS/RPEjunction� as the outer retinal border was consistent with thoseobtained by comparing retinal thickness measurements be-tween Stratus OCT and FD-OCT systems.32
The total time required to preprocess and automaticallysegment an OCT image �B-scan� is 20 s on a computer withan Intel® Core™ 2 Extreme CPU Q9300 at 2.53 GHz and8 Gb. Since the average number of manual correctionsneeded per scan was three, the total time required to completea manual correction per case was 6 s for healthy eyes and10 to 20 s for pathological cases, depending on the magni-tude of the retinal disruptions. We are currently improving theautomated segmentation method to reduce the time needed tocorrect errors in segmentation. In a recent study, we obtaineda high degree of repeatability, reproducibility, and reliability
Table 3 Intergrader reproducibility using OCTRIMA. *Mean thickness value averaged across all teneyes. We note that the mean thickness value is a result of averaging the uninterpolated thickness mea-surements at every A-scan location for all six B-scans of all ten eyes. **This value is calculated bysubtracting OCTRIMA thickness measurement obtained during the first grading from the OCTRIMA thick-ness measurement obtained during the second grading for each eye by the same grader G2, and thentaking the absolute value. †Median of the differences between measurements expressed as a percentageof mean thickness across all ten eyes.
Meanthickness
�grader 1���m�
Meanthickness
�grader 2���m�
*Meanthickness±SD
��m�
**Meanabsolute
difference��m�
†Median ofdifference/
meanthickness
�%�CR
��m�CR�%�
RNFL 40.76 40.72 40.74±1.62 0.67 1.55 1.70 4.16
GCL+IPL 72.65 73.63 73.14±7.34 1.11 1.50 1.76 2.40
INL 34.30 33.91 34.11±1.14 0.56 1.17 1.11 3.27
OPL 32.64 32.24 32.44±0.66 0.48 1.47 0.84 2.58
ONL 88.37 88.56 88.46±4.93 0.26 0.22 0.60 0.68
Totalretina
280.50 280.50 280.51±12.26 0.49 0.15 1.24 0.44
Cabrera DeBuc et al.: Improving image segmentation performance and quantitative analysis…
Journal of Biomedical Optics July/August 2010 � Vol. 15�4�046015-9
Downloaded From: https://journals.spiedigitallibrary.org/journals/Journal-of-Biomedical-Optics on 27 Nov 2021Terms of Use: https://journals.spiedigitallibrary.org/terms-of-use
of our methodology using data from ten healthy controleyes.22
5 ConclusionIn this study we present a robust and interactive computer-aided retinal image analysis method for the assessment ofretinal pathologies using Stratus OCT images. The softwareimplements a custom segmentation algorithm to accuratelyidentify the boundaries of the intraretinal layers with mini-mized errors, which is functionally more efficient comparedto commercial Stratus OCT software. Additionally, comparedto free-hand corrections, OCTRIMA offers a less time-consuming method to manually eliminate visible irregulari-ties, if any, in the detected boundaries between the variouscellular layers of the retina. This powerful capability ensureshigher accuracy in the numerical data obtained from the mea-surements of the thickness and reflectance of each layer andthe whole macula. Additional capabilities of our methodologyinclude report generation for quantitative analysis of the
macula and intraretinal layers per scan and per region. More-over, topographic maps for the thickness of each cellular layerof the retina can be generated, which provides a visual aid forbetter analysis of local structural changes, if any, in each ET-DRS retinal region. Another potential advantage of our meth-odology is the incorporation of a standard method for report-ing changes in thickness, which could be used as a frameworkfor reporting treatment outcomes.29 Thus, our methodologycan be used to compare the efficacy of current and emergingtherapies, as well as monitor the progression of disease inpatients. Future work will include the adaptation of our meth-odology into a more practical interface to handle the largequantities of measured raw data generated by the advancedOCT systems. Moreover, OCTRIMA’s retinal thickness mea-surements could be used as a primary or secondary end pointfor clinical trials of therapeutic agents for retinal tissue alter-ations under investigation by pharmaceutical companies. Wedo believe that OCTRIMA will help physicians to better di-
Fig. 6 OCTRIMA segmentation results for a patient with neovascular AMD �nonaligned raw data for the same patient shown in Fig. 5� showing thefluid-filled regions outlined. The ONL outer border was used as the outer retinal border to compare results with Stratus OCT algorithms �see thetable at the bottom�. The retinal thickness map along with the ETDRS topographic map including the retinal structure and fluid-filled regions areshown in the right-bottom section.
Cabrera DeBuc et al.: Improving image segmentation performance and quantitative analysis…
Journal of Biomedical Optics July/August 2010 � Vol. 15�4�046015-10
Downloaded From: https://journals.spiedigitallibrary.org/journals/Journal-of-Biomedical-Optics on 27 Nov 2021Terms of Use: https://journals.spiedigitallibrary.org/terms-of-use
agnose and plan treatments, and also evaluate the efficacy oftherapeutic intervention.
AcknowledgmentsThis study was supported in part by a Juvenile Diabetes Re-search Foundation grant �JDRF 2007-727�, a NIH center grantP30-EY014801, and by an unrestricted grant to the Universityof Miami from Research to Prevent Blindness, Incorporated.
References1. D. Huang, E. A. Swanson, C. P. Lin, J. S. Schumann, W. G. Stinson,
W. Chang, M. R. Hee, T. Flotte, K. Gregory, C. A. Puliafito, and J. G.Fujimoto, “Optical coherence tomography,” Science 254, 1178–1181�1991�.
2. M. R. Hee, “Optical coherence tomography of the eye,” Ph.D. Thesis,Massachusetts Institute of Technology, Cambridge, MA �1997�.
3. D. Cabrera Fernández, “Delineating fluid-filled region boundaries inoptical coherence tomography images of the retina,” IEEE Trans.Med. Imaging 24�8�, 929–945 �2005�.
4. H. Ishikawa, D. M. Stein, G. Wollstein, S. Beaton, J. G. Fujimoto,and J. S. Schuman, “Macular segmentation with optical coherencetomography,” Invest. Ophthalmol. Visual Sci. 46, 2012–2020 �2005�.
5. M. Shahidi, Z. Wang, and R. Zelkha, “Quantitative thickness mea-surement of retinal layers imaged by optical coherence tomography,”Am. J. Ophthalmol. 139, 1056–1061 �2005�.
6. D. Cabrera Fernández, H. M. Salinas, and C. A. Puliafito, “Auto-mated detection of retinal layer structures on optical coherence to-mography images,” Opt. Express 13, 10200–10216 �2005�.
7. D. Koozekanani, K. Boyer, and C. Roberts, “Retinal thickness mea-surements from optical coherence tomography using a Markovboundary model,” IEEE Trans. Med. Imaging 20, 900–916 �2001�.
8. M. Mujat, R. C. Chan, B. Cense, B. H. Park, C. Joo, T. Akkin, T. C.
Fig. 7 OCTRIMA thickness maps for a diabetic patient with mild nonproliferative diabetic retinopathy without macular edema �male, 59 years old�.Note that thickness maps for the total retina and the intraretinal layers are shown. We also note that an OCTRIMA macular map is divided into ninezones that correspond to the ETDRS regions: fovea within a diameter of 1 mm centered on the foveola; pericentral ring, the circular band from thecentral 1 to 3 mm, divided into four quadrants, i.e., superior, inferior, temporal, and nasal; and peripheral ring from 3 mm up to 6 mm, divided intothe same quadrants.
Fig. 8 Feasibility of OCTRIMA for analyzing images from advancedOCT imaging systems. �a� OCTRIMA segmentation results for an OCTimage obtained with the Bioptigen Spectral Domain ophthalmic im-aging system. �b� OCTRIMA segmentation results for an OCT imageobtained with the custom developed FD-OCT adapted from our ante-rior segment OCT system.
Cabrera DeBuc et al.: Improving image segmentation performance and quantitative analysis…
Journal of Biomedical Optics July/August 2010 � Vol. 15�4�046015-11
Downloaded From: https://journals.spiedigitallibrary.org/journals/Journal-of-Biomedical-Optics on 27 Nov 2021Terms of Use: https://journals.spiedigitallibrary.org/terms-of-use
Chen, and J. F. de Boer, “Retinal nerve fiber layer thickness mapdetermined from optical coherence tomography images,” Opt. Ex-press 13, 9480–9491 �2005�.
9. M. Szkulmowski, M. Wojtkowski, B. Sikorski, T. Bajraszewski, V. J.Srinivasan, A. Szkulmowska, J. J. Kaluzny, J. G. Fujimoto, and A.Kowalczyk, “Analysis of posterior retinal layers in spectral opticalcoherence tomography images of the normal retina and retinal pa-thologies,” J. Biomed. Opt. 12�4�, 041207 �2007�.
10. M. Baroni, P. Fortunato, and A. L. Torre, “Towards quantitativeanalysis of retinal features in optical coherence tomography,” Med.Eng. Phys. 29, 432–441 �2007�.
11. E. Gotzinger, M. Pircher, W. Geitzenauer, C. Ahlers, B. Baumann, S.Michels, U. Schmidt-Erfurth, and C. K. Hitzenberger, “Retinal pig-ment epithelium segmentation by polarization sensitive optical coher-ence tomography,” Opt. Express 16, 16410–16422 �2008�.
12. C. A. Toth, S. Farsiu, S. J. Chiu, A. A. Khanifar, and J. A. Izatt,“Automatic Drusen segmentation and characterization in spectral do-main optical coherence tomography �SDOCT� images of AMD eyes,”Invest. Ophthalmol. Visual Sci. 49, E-Abstract 5394 �2008�.
13. D. Cabrera Fernández, G. M. Somfai, E. Tátrai, S. Ranganathan, D.C. Yee, M. Ferencz, and W. E. Smiddy, “Potentiality of intraretinallayer segmentation to locally detect early retinal changes in patientswith diabetes mellitus using optical coherence tomography,” Invest.Ophthalmol. Visual Sci. 49, E-Abstract 2751 �2008�.
14. C. Ahlers, C. Simader, W. Geitzenauer, G. Stock, P. Stetson, S. Dast-malchi, and U. Schmidt-Erfurth, “Automatic segmentation in three-dimensional analysis of fibrovascular pigment epithelial detachmentusing high-definition optical coherence tomography,” Br. J. Oph-thamol. 92, 197–203 �2008�.
15. T. Fabritius, S. Makita, M. Miura, R. Myllyla, and Y. Yasuno, “Au-tomated segmentation of the macula by optical coherence tomogra-phy,” Opt. Express 17�18�, 15659–15669 �2009�.
16. M. Garvin, M. Abramoff, R. Kardon, S. Russell, X. Wu, and M.Sonka, “Intraretinal layer segmentation of macular optical coherencetomography images using optimal 3-D graph search,” IEEE Trans.Med. Imaging 27�10�, 1495–1505 �2008�.
17. A. R. Fuller, R. J. Zawadzki, S. Choi, D. F. Wiley, J. S. Werner, andB. Hamann, “Segmentation of three-dimensional retinal image data,”IEEE Trans. Vis. Comput. Graph. 13�6�, 1719–1726 �2007�.
18. S. Joeres, J. W. Tsong, P. G. Updike, A. T. Collins, L. Dustin, A. C.Walsh, P. W. Romano, and S. R. Sadda, “Reproducibility of quanti-tative optical coherence tomography subanalysis in neovascular age-related macular degeneration,” Invest. Ophthalmol. Visual Sci. 48,4300–4307 �2007�.
19. G. M. Somfai, E. Tátrai, S. Ranganathan, and D. Cabrera Fernández,“Age-related changes in macular structure among young and middle-aged healthy subjects assessed by OCT image segmentation,” Invest.Ophthalmol. Visual Sci. 49, E-Abstract 3214 �2008�.
20. S. R. Sadda, S. Joeres, Z. Wu, P. Updike, P. Romano, A. T. Collins,and A. C. Walsh, “Error correction and quantitative subanalysis ofoptical coherence tomography data using computer-assisted grading,”
Invest. Ophthalmol. Visual Sci. 48, 839–848 �2007�.21. W. Gao, S. Ranganathan, E. Tátrai, G. M. Somfai, and D. Cabrera
Fernández, “Development of a graphic user interface as an additionaltool of diagnostic differentiation of retinal tissue using optical coher-ence tomography,” Invest. Ophthalmol. Visual Sci. 49, E-Abstract1891 �2008�.
22. D. Cabrera DeBuc, G. M. Somfai, S. Ranganathan, E. Tátrai, M.Ferencz, and C. A. Puliafito, “Reliability and reproducibility ofmacular segmentation using a custom-built OCT retinal image analy-sis software,” J. Biomed. Opt. 14�6�, 064023 �2009�.
23. G. S. Hageman, M. F. Marmor, X. Y. Yao, and L. V. Johnson “Theinterphotoreceptor matrix mediates primate retinal adhesion,” Arch.Ophthalmol. 113, 655–660 �1995�.
24. R. A. Costa, M. Skaf, L. A. S. Melo Jr., D. Calucci, J. A. Cardillo, J.C. Castro, D. Huang, and M. Wojtkowski, “Retinal assessment usingoptical coherence tomography,” Prog. Retin Eye Res. 25, 325–353,�2006�.
25. Early Treatment Diabetic Retinopathy Study Research Group, “Earlytreatment diabetic retinopathy study design and baseline patient char-acteristics, ETDRS Report 7,” Ophthalmology 98, 741–756 �1991�.
26. Q. Chen, J. Wang, A. Tao, M. Shen, S. Jiao, and F. Lu, “Ultra-highresolution measurement by Optical coherence tomography of dy-namic tear film changes on contact lenses,” Invest. Ophthalmol. Vi-sual Sci. 51, 1988–1993 �2010�.
27. A. W. Scott, S. Farsiu, L. B. Enyedi, D. K. Wallace, and C. A. Toth,“Imaging the infant retina with handheld spectral domain OCT,” Am.J. Ophthalmol. 147�2�, 364–373 �Feb. 2009�.
28. H. M. Salinas and D. Cabrera Fernández, “Comparison of PDE-basednonlinear anisotropic diffusion approaches for image enhancementand denoising in optical coherence tomography,” IEEE Trans. Med.Imaging 26�6�, 761–71, �2007�.
29. A. Chan and J. S. Duker, “A standardized method for reportingchanges in macular thickness using OCT,” Arch Ophthalmol. 123,939–943 �2007�.
30. British Standards Institution, “Accuracy �trueness and precision� ofmeasurement methods and results: basic methods for the determina-tion of repeatability and reproducibility of a standard measurementmethod,” BS ISO 5725 part 2, British Standards Institution, London�1994�.
31. J. M. Bland and D. G. Altman, “Statistical methods for assessingagreement between two methods of clinical measurement,” Lancet 1,307–310 �1986�.
32. U. E. Wolf-Schnurrbusch, L. Ceklic, C. K. Brinkmann, M. Iliev, M.Frey, S. P. Rothenbuehler, V. Enzmann, and S. Wolf, “Macular thick-ness measurements in healthy eyes using six different optical coher-ence tomography instruments,” Invest. Ophthalmol. Visual Sci. 50,3432–3437 �2009�.
33. G. M. Somfai, E. Tátrai, M. Ferencz, C. A. Puliafito, and D. CabreraFernández, “Quantifying retinal layer thickness changes in eyes withdiabetic diffuse macular edema using optical coherence tomography,”Invest. Ophthalmol. Visual Sci. 48, E-Abstract 1426 �2007�.
Cabrera DeBuc et al.: Improving image segmentation performance and quantitative analysis…
Journal of Biomedical Optics July/August 2010 � Vol. 15�4�046015-12
Downloaded From: https://journals.spiedigitallibrary.org/journals/Journal-of-Biomedical-Optics on 27 Nov 2021Terms of Use: https://journals.spiedigitallibrary.org/terms-of-use