improving team effectiveness - pmi southern maryland chapter
TRANSCRIPT

Improving Team EffectivenessJason Dunn
PMI Southern Maryland Chapter
October Luncheon – Wednesday, October 25, 2017

Jason Dunn has spent nearly 30 years in project environments,
17 in Information Technology. He has served many differentroles on projects from the Project Manager, Change Manager,
Business Analyst, and Tester.
He has personally managed small to medium-sized projects
(>$30MM) and been part of project teams for very large projects (>$300MM).
In addition, he has worked with many Fortune100 companies to improve their project management maturity and processes, as well as their overall organizational effectiveness. As
part of this work, he has stood up PMOs as well as assessed and improved existing PMOs.
Currently, he is a Director at Freddie Mac for the Enterprise PMO’s PM Community team. His
organization is focused on improving PM maturity via training, coaching, mentoring and support. He is a PMP, Six Sigma Black Belt, CSM, CSPO, and certified Kanban practitioner.
Guest Speaker – Jason Dunn
2

Many factors contribute to project success, or the lack thereof
More importantly, project success, to a large degree, can be predicted, relatively early in the project’s life cycle
The trick is knowing what measures to use for those predictions
There are many predictors, such as the quality of definition at the end of planning, team integration, the risk quotient, use of new technology, etc.
Team Health is one metric that can be used to “predict” the potential for success or failure of a project
Most importantly, it is one of the PM’s duties to keep watch over and take efforts to improve team health
But how are you supposed to do that?
Introduction to the Topic
3

Show why team health is important
Provide information on what drives team health
Provide an understanding of how a PM can improve team health
Provide information that the PM can use to assess their team’s health
Objectives of this Session
44

Key Questions – What is the relationship between:
1) Processes and Behaviors and 2) Outcomes and Behaviors?
Many studies have been conducted on
this linkage
More information is needed on these
linkages
5

Project Relationship Model
Functional Management and
Stakeholders
Business Representation
Project Team Team Health
PM Style
Senior Management
Relationship SoupBusiness Sponsor
Project Manager
6

Study conducted in 2008/2009 for consortium of 65 multinational companies
Companies such as Chrysler, Chase, Dow Chemical, Newmont Refining, DeBeers, etc.
“Participants”:
610 project team members (excluding Project Managers) and 153 Project managers
240 Projects
Project costs ranged from $450K to $170MM with a median cost of $9MM and a mean Cost of $16MM
Most projects in the US and Canada and with slightly more than a third spread across Europe, Asia, and Australia
Questionnaire
80 questions for core project team members
90 questions for project managers
80 common questions with 10 additional questions provided to PMs that aimed at understanding their interests, experience, training, etc.
Study Background
7

Questions Led to the Development of Indices for the Major Focus Areas
Questions / responses were aggregated and specific indices were calculated based on the responses from each team member and then averaged across the project
For example, the Team Behavior Index is average of six Likert Scale statements, such as the following statements:
Team members were proactive in helping each other conduct the project
There was good constructive communication amongst team members
1 2 3 4 5
Strongly Agree Strongly Disagree No Opinion
0
1 2 3 4 5Good Poor
The resulting Team Behavior Index is:
8

Indices Developed as Part of the Study
• Behavior
• Beliefs
Team
• Leadership
• Networking
Project Manager
• Process
• Objectives
• Success
Project
• Sponsorship
• Stakeholder Alignment
Senior Project Leadership
and Stakeholders
9

Location of the project
Size of the project
Overall experience of the PM
Not a significant driver
Overall experience of the team members
Length of time that the team has been together
Although, this factor did result in a bimodal distributions for the Team Process and Behavior metrics
What Didn’t Matter
10

Teams Generally Have a Good Perception of Whether a Project Will be Successful*
11
1
2
3
4
5
1 2 3 4 5Good
Poor
Te
am
Su
cc
es
s In
de
x
Project Success Index
Pr>|t| <0.006
Poor
*As measured at the end of Planning 11
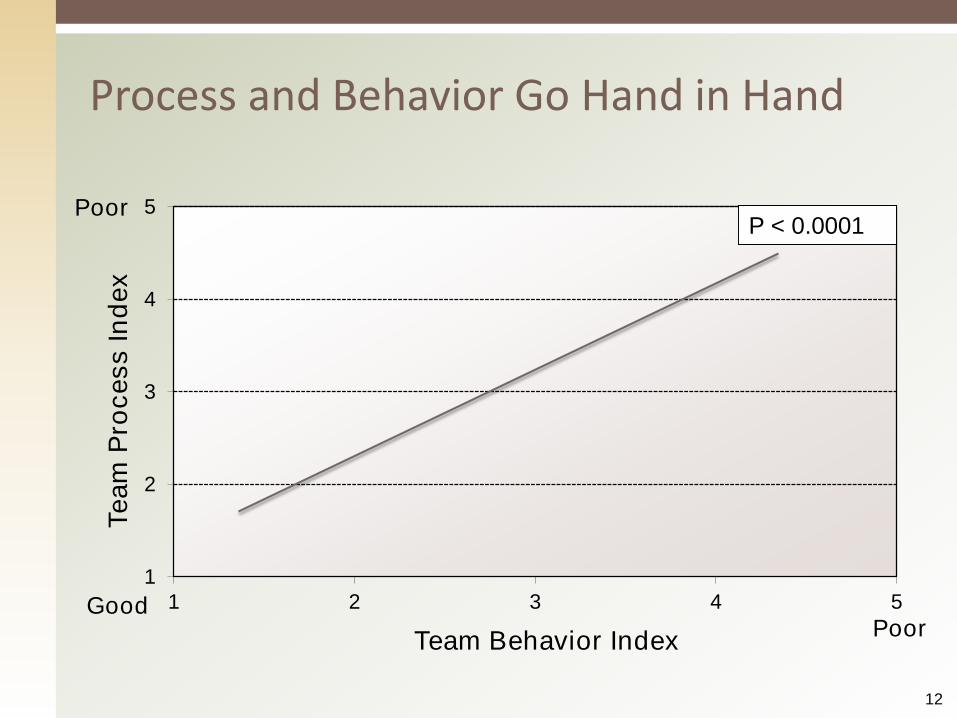
Process and Behavior Go Hand in Hand
1
2
3
4
5
1 2 3 4 5
Te
am
Pro
ce
ss
In
de
x
Team Behavior Index
P < 0.0001
Good
Poor
Poor
12

Focus on Process Requires Balance
Too Little
Freedom = Chaos
Too Much
Rigidity = Automatons
• Set clear objectives and let teams determine approach• Monitor to assess support needs• Foster open communication and responsibility/accountability
Both styles promote low team health
13

Senior Manager Support Appears to Strongly Impact Team Behavior
1
2
3
4
5
1 2 3 4 5
Team
Beh
avio
r In
dex
Senior Project Leadership Index
GoodPoor
P < 0.0001Poor
14

Many Factors Affect Team Health and Behavior
• Clarity of Objectives
• Goal Achievability
• Stakeholder Accountability
• Business/User Involvement
• Sponsor Support
• Belief in the Process
• Faith in Leadership
• PM Reputation
• PM Trust
• Team Trust
• Team Skills
• Communication
• Cooperation/Conflict
• Process adherence15

0.6
0.8
1
1.2
1.4
1 2 3 4 5
Co
st
Perf
orm
an
ce I
nd
ex
Team Behavior Index
Industry Average
Team Behavior Affects Many Indices and, Therefore, Cost
P < 0.06
Good Poor
Worse
Better
16

1
2
3
4
5
1 2 3 4 5
Clear Objectives Are Linked to Better Process Understanding and Use
Good Poor
Pro
ject
Ob
jecti
ves I
nd
ex
Team Process Index
Pr>|t| <0.003Poor
17

1
2
3
4
5
1 2 3 4 5 6
PM Leadership Correlates with Stakeholder Support and Alignment
Good Poor
Sta
keh
old
er
Ali
gn
men
t
Ind
ex
PM Leadership Index
P = 0.009
Poor
18

0.6
0.8
1.0
1.2
1.4
1 2 3 4 5
Sch
ed
ule
Perf
orm
an
ce I
nd
ex
Project Manager Networking Index
Project Manager Networking Focus Is Linked to Delivery Speed – Planning and Execution Phases
Good Poor
P = 0.009
Industry Average
Slower
Faster
19
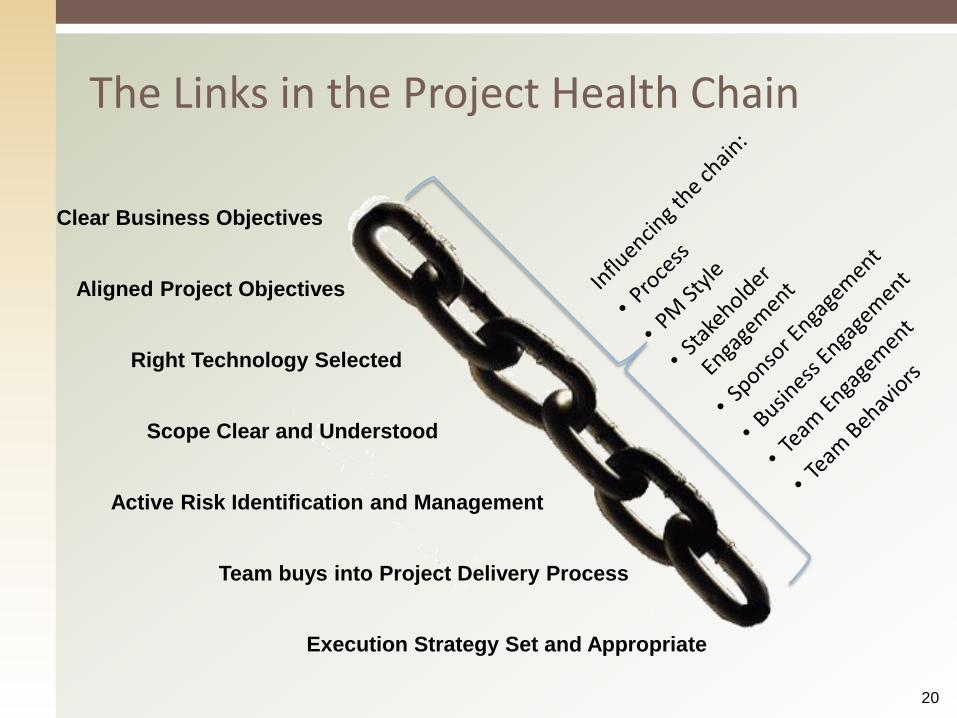
The Links in the Project Health Chain
Clear Business Objectives
Aligned Project Objectives
Right Technology Selected
Active Risk Identification and Management
Scope Clear and Understood
Team buys into Project Delivery Process
Execution Strategy Set and Appropriate
20

Are There Degrees of Project Health?
21
Project Success Index
1 2 3 4 5 6 7
100% of these
projects had at least
one index in the
Project Health Chain
with a less than
average score
88% of these
projects had no
elements of the
Project Health Chain
with a less than
average score
Very Successful
Very Unsuccessful
As a driver of project success, project health tends to be bi-modal
If any
link is
unsound,
the
project is
likely to
fail
21

Drivers
• Sponsorship
• Process
• Senior Leadership
• Stakeholders
Influencers
• PM Leadership
• Team Behavior
• Objectives
• Networking
Outcomes
• Stakeholder Alignment
• Project Performance
• Customer Satisfaction
The Project Health Chain
22

• Demonstrate leadership by driving the process, creating accountability and building trust
• Focus on outcomes and the drivers of those outcomes
• Define your expectations for the team
• Reward performance in a balanced way
PM Leadership
• Engage sponsors early
• Discuss what is important to the sponsor
• Discuss sponsor role and PM / Sponsor interaction model
• Provide information on what you think the challenges will be for the project and seek business input
Sponsorship
• Ensure that team members understand their roles and responsibilities
• Outline the process and key success measures clearly at project kick off (or as early as possible)
• Review scope and progress regularly
• Actively manage risks
Process
What Can PMs Do -- Drivers?
23

• Assess behavior – particularly, communication
• Look for warning signs of conflict
• Ask questions privately
• Gauge team’s belief in process and goals
Team Behavior
• Obtain clear business objectives before moving forward
• Ensure that project objectives and approach are aligned with business objectives
• Ensure that the team understands project drivers
• Discuss trade-off decision making
Objectives
• Network as early as possible (and consistently)
• Establish networks across several levels in business and stakeholder groups
• Involve stakeholder groups in team discussions
• Encourage team networking and mentor appropriately
Networking
What Can PMs Do -- Influencers?
24

Team Health Can Be Influenced
25
Team Confidence and Health
Stakeholder acknowledgement and engagement
Clear business understanding and good participation
Proper approach to key design questions
Clarity of scope and management of change
Identification and management of risks
Encouraging open communication
Resolving conflict openly and quickly
Delivering on commitments
Using networking tactics early and consistently
Addressing skills and capabilities

Team health is important and is the PM’s responsibility to monitor and support
Team health is driven by many factors
Understanding the drivers and influencers provides a starting point for the PM to improve team health
It is also the PM’s role to educate all other parties in the Project Relationship Model as to their impact on team health
As well as their influence on overall project success
The PM needs to have a way to assess the team’s health in an open (i.e., non-confrontational) way
Once team health goes bad, PMs need to focus on fixing the issues causing the health problems
You may need help to do this
Session Recap
26
Team health questionnaires have been provided as part of this session
You need to decide how you implement them for your team(s)
Be transparent
About your motives, the process, the results and the actions
Respect confidentially in order to get a good gauge on the health of your team
Be very willing to discuss issues that might arise with your team’s scores
With the understanding that you, as a leader, have to set the tone
Start the process early
Fixing team health is a very difficult process, if it is allowed to fester
Potential Path(s) Forward
27

Questions
Minions is a trademark and copyright of Universal Studios. Licensed by Universal Studios Licensing LLC. All rights reserved.

Appendix
29

An effective Project Manager needs to be a leader
Fostering Collaboration is a Leadership Competency
These skill sets require the PM to:
Create an environment of openness, collaboration and high morale among team members and stakeholders
Encourage participation and involvement of others
Acknowledge everyone’s contributions
Show commitment to teamwork by acting as a team player and encouraging others to do the same
Align personal activities and priorities toward increasing likelihood of achieving project goals
Improving Leadership Skills
30

Explanations of Indices
31
• Quality of communication
• Conflict resolution capability
• Confidence in each other
Team Behavior Index
• Clarity of objectives
• Stability of objectives
• Alignment of objectives
Project Objectives Index
• Faith in the PM to be a sufficient leader
• Faith in PM to resolve issues in the team
• Trust in the PM to keep commitmentsPM Leadership
• Project Manager communicates well with stakeholders
• Project Manager has influence over stakeholders
• Stakeholders and Senior Project Leadership respect the Project Manager
PM Networking Index
• Stakeholders generally support the project
• Stakeholder needs are clear
• Stakeholder needs are aligned with the project’s drivers
Stakeholder Alignment Index

• Senior Project Leadership is active and assists the project
• Senior Leadership listens to the project team
• Senior Leadership sets realistic expectationsSponsorship Index
• Met cost and schedule estimates (+/- 10%)
• Scored better than average on Customer Satisfaction
• Scored better than average on cost and schedule competitiveness
Project Success Index
• Expects the project to be a successful project
• Has a realistic cost and schedule estimate
• Customer will like the solutionTeam Success Index
• Reflects the absolute cost of a project vis-à-vis a comparable project delivering a similar scope of work
• Values less than 1.0 reflect better performance
Cost Performance Index
• Reflects the absolute schedule, for Phases 1 and 2, of a project vis-à-vis a comparable project delivering a similar scope of work
• Values less than 1.0 reflect better performance
Schedule Performance Index
Explanations of Indices (cont.)
32