in-cell selectivity profiling of serine protease inhibitors by activity-based proteomics*ds
TRANSCRIPT

In-cell Selectivity Profiling of Serine ProteaseInhibitors by Activity-based Proteomics*□S
Ludovic C. J. Gillet‡, Kenji Namoto‡, Alexandra Ruchti§, Sjouke Hoving§,Danielle Boesch‡, Bruno Inverardi§, Dieter Mueller§, Michele Coulot¶,Patrick Schindler¶, Patrick Schweigler‡, Anna Bernardi‡, and Shirley Gil-Parrado‡�
Activity-based proteomics is a methodology that is usedto quantify the catalytically active subfraction of enzymespresent in complex mixtures such as lysates or livingcells. To apply this approach for in-cell selectivity profilingof inhibitors of serine proteases, we designed a novelactivity-based probe (ABP). This ABP consists of (i) afluorophosphonate-reactive group, directing the probetoward serine hydrolases or proteases and (ii) an alkynefunctionality that can be specifically detected at a laterstage with an azide-functionalized reporter group througha Cu(I)-catalyzed coupling reaction (“click chemistry”).This novel ABP was shown to label the active site ofseveral serine proteases with greater efficiency than apreviously reported fluorophosphonate probe. More im-portantly, our probe was cell-permeable and achievedlabeling of enzymes within living cells with efficiency sim-ilar to that observed for the corresponding lysate fraction.Several endogenous serine hydrolases whose activitieswere detected upon in-cell labeling were identified bytwo-dimensional gel and MS analyses. As a proof of prin-ciple, cell-permeable inhibitors of an endogenous serineprotease (prolyl endopeptidase) were assessed for theirpotency and specificity in competing for the in situ label-ing of the selected enzyme. Altogether these results opennew perspectives for safety profiling studies in uncover-ing potential cellular “side effects” of drugs (unanticipatedoff-target inhibition or activation) that may be overlookedby standard selectivity profiling methods. Molecular &Cellular Proteomics 7:1241-1253, 2008.
Activity-based proteomics, in comparison with classicgenomics and proteomics approaches, has been speciallydevised to enable the detection of active enzymes. Such amethodology is of particular relevance for example in theprotease field where only a subfraction of the total enzymepool (having undergone successive translocation, post-trans-lational modifications, and proteolytic activation and havingescaped binding of endogenous inhibitors) effectively partic-
ipates in the cellular processes. To profile enzymatic activitiesin biological samples, activity-based proteomics relies onsmall reactive marker molecules called activity-based probes(ABPs),1 which covalently and specifically label the accessibleactive sites of catalytic enzymes (1–3). So far, several directedand non-directed ABPs have been described that allow themonitoring of more than 20 enzyme classes (for extensivereviews, see Refs. 2–5).
The detection of the population of active enzymes is ofprimary relevance for biological and in particular for pharma-ceutical research because it could lead to the discovery ofnew targets for drug development. Indeed by comparing theactivity profile of enzymes under physiological versus patho-logical conditions (e.g. of normal cells versus parasite-in-fected cells (6) or versus cancer cells (7–11)), several groupshave identified up-regulated active enzymes potentially in-volved in the development and/or the maintenance of givenpathological conditions.
Another underexploited potential of activity-based pro-teomics is its application to assess the selectivity of enzymeinhibitors (12–16). In comparison with the standard approachthat consists of measuring the potency of an inhibitor inconsecutive in vitro assays against a limited number of puri-fied recombinant enzymes, activity-based proteomics allowsthe simultaneous selectivity profiling of inhibitors against thewhole set of labeled enzymes endogenously present in com-plex proteomes (cell or tissue extracts (12–16), living cells (14,17–20), or animals (17, 18, 21)) by quantifying the decrease oflabeling of those enzymes upon preincubation with the inhibi-tors. Again such an approach would be of particular relevancefor the protease field because overlooked off-target inhibitioncould result in unforeseen side effects, contributing to the failureof protease inhibitors in clinical trials (for a review about chal-lenges in the discovery of protease inhibitors, see Ref. 22).
In this study, we aimed to use the activity-based proteom-ics approach for in-cell selectivity profiling of inhibitors of
From the ‡Center for Proteomic Chemistry/Expertise Platform Pro-teases, §Developmental and Molecular Pathways, and ¶BiologicsCenter, Novartis Institutes for BioMedical Research, CH-4002Basel, Switzerland
Received, October 17, 2007, and in revised form, February 29, 2008Published, MCP Papers in Press, March 24, 2008, DOI 10.1074/
mcp.M700505-MCP200
1 The abbreviations used are: ABP, activity-based probe; FP, flu-orophosphonate; KLK7, kallikrein 7; PEP, prolyl endopeptidase; Z,benzyloxycarbonyl; AMC, 7-amino-4-methylcoumarin; DPBS, Dul-becco’s PBS; TCEP, tris(carboxyethyl)phosphine; 1D, one-dimen-sional; 2D, two-dimensional; S/N, signal-to-noise ratio; ACTH, adre-nocorticotropic hormone; C.I., confidence interval; PMF, peptidemass fingerprint; DPP, dipeptidyl-peptidase.
Research
© 2008 by The American Society for Biochemistry and Molecular Biology, Inc. Molecular & Cellular Proteomics 7.7 1241This paper is available on line at http://www.mcponline.org
by guest on April 10, 2019
http://ww
w.m
cponline.org/D
ownloaded from

serine proteases because the role of these enzymes in dis-ease conditions (e.g. dipeptidyl-peptidase 4 (DPP4) in type 2diabetes (22) or NS3 protease in hepatitis C virus infection(23)) has led to increasing interest in this protease family asimportant targets for drug discovery. For our purpose, thefluorophosphonate (FP) probe seemed of particular interestbecause it has been reported to be a very specific covalentmodifier of the active site serine residue of a large number ofserine hydrolases, including serine proteases (7, 10, 13, 16,24–27). Moreover the usefulness of this probe for selectivityprofiling of reversible inhibitors has already been validated byin vitro studies (13, 16). Nevertheless the reported FP probesgenerally carry a bulky reporter group (avidin (13, 24) or fluo-rescent moieties (24–26)) that might limit active site accessi-bility and cell permeability. To our knowledge, the use of FPprobes for in situ labeling of serine hydrolases has not yetbeen reported. Here we present the design and preparation ofa reporter-free fluorophosphonate ABP carrying an alkynefunctionality (FP-alkyne). This novel FP-alkyne probe wasshown to achieve efficient in situ labeling of enzymatic activ-ities within living cells and proved to be a valuable tool toassess in-cell selectivity profiling of serine protease inhibitors.
EXPERIMENTAL PROCEDURES
Synthesis of the Alkyne Probe—The procedures for the synthesis ofthe FP-alkyne serine hydrolase probe (1) and of the azide-fluoresceinreporter (3) are provided in the supplemental data. The FP-fluoresceinprobe (2) was prepared as reported previously (13, 25).
Recombinant Proteins and Antibody—Recombinant human prokal-likrein 7 (pro-KLK7) was purchased from R&D Systems and wasactivated according to the manufacturer’s protocol. Other recombi-nant proteases used in this study were kindly provided by the groupof Bernd Gerhartz (Expertise Platform Proteases, Novartis Institutesfor Biomedical Research). Anti-prolyl endopeptidase (anti-PEP) poly-clonal antibody and rabbit anti-goat peroxidase conjugate were pur-chased from Novus Biologicals and Rockland, respectively.
IC50 Determination by in Vitro Fluorescence Assay—The enzymaticassays were performed at 22 °C in a 384-well plate (Cliniplate Black,Labsystems) in 30 �l of the following reaction buffer: 50 mM Tris/HCl,pH 7.4, 50 mM NaCl, 5 mM EDTA, 0.05% (w/v) CHAPS, and 0.1%BSA. In a typical experiment, 10 �l of enzyme (PEP, 30 pM finalconcentration) was preincubated with 10 �l of inhibitor (0–30 �M finalconcentration) for 1 h before adding a 10-�l solution of the peptidicsubstrate Z-Gly-Pro-AMC (30 �M final concentration, Bachem). Theresidual enzymatic activity was determined by measuring the hydrol-ysis rate of the fluorescent substrate after 1-h incubation on an Ultramicrotiter plate reader (Tecan) equipped with a 350/500-nm filter pair.The IC50 was calculated from the dose-response plot of percentage ofenzymatic inhibition as a function of inhibitor concentration using thenon-linear regression analysis software XLfit (version 4.2, ID BusinessSolutions Ltd. (IDBS)).
Labeling of Recombinant Proteins—The labeling reactions weretypically performed in 30 �l of Dulbecco’s PBS (DPBS; pH 8) upon 1-hincubation of the recombinant enzymes (DPP4, 0.4 �M; DPP8, 0.2 �M;DPP9, 0.6 �M; PEP, 10 �M; and pro-KLK7/activated KLK7, 0.4 �M)with 10 �M FP-alkyne (1) or 50 �M FP-fluorescein (2). The detection ofthe FP-alkyne-labeled enzymes was then achieved using click chem-istry essentially as described previously (28) by adding the followingstock solutions in the following order: 0.6 �l of azide-fluorescein (10mM in DMSO), 0.6 �l of tris(carboxyethyl)phosphine (TCEP; 25 mM
freshly prepared in water), 1.8 �l of ligand synthesized as describedpreviously (29) (1.7 mM in tert-butyl alcohol/DMSO), and 0.6 �l ofCuSO4 (50 mM in water). After 1-h incubation in the dark, the reactionswere then quenched with 7 �l of 5� SDS sample buffer, separated by1D electrophoresis on precast Novex 4–20% Tris-glycine gradientgels (Invitrogen) according to the manufacturer’s protocol. The 1Dgels were scanned on a FluorImager SI (Vistra Fluorescence). Largerscale labeling of KLK7 (100 �l at 3.5 �M in DPBS) was essentiallyperformed as described above with and without the click chemistrystep. The excess of reagents was then removed by size exclusionchromatography on Zeba desalting spin columns (Pierce), and theeluted samples were concentrated on a SpeedVac. The samples weretaken up in 25 �l of CH3CN:H2O:HCOOH (45:45:10) for direct nano-ESI measurement (see below) or denatured (RapiGest SF protocol,Waters) and trypsinized (sequencing grade modified trypsin, Pro-mega) for nano-LC-MS or ESI-MS/MS analysis (see supplementaldata for experimental details on the MS analyses).
Direct Nano-ESI Measurement on Intact, Full-length KLK7—TheMS analysis was performed on a QSTAR Pulsar hybrid quadrupoletime-of-flight mass spectrometer equipped with a nanospray ionsource (SCIEX/Applied Biosystems). The samples were diluted 10times in CH3CN:H2O (1:1) supplemented with 0.1% HCOOH andloaded into palladium/gold-coated borosilicate needles (Proxeon).The needle was adjusted in front of the orifice, and the sprayingprocess was started by applying a voltage difference (from 900 to1300 V). MS spectra were acquired by scanning over the 1000–3000m/z range in 1 s and accumulating 500 spectra (multichannel analysismode). Declustering potentials in the orifice were set as follows:declustering potential, 100 V; and focusing potential, 300 V. Theacquired spectra were deconvoluted using the Bayesian protein re-construct program, part of the Bioanalyst QS 1.0 program (SCIEX/Applied Biosystems). Relative quantitation between the different ionspecies was performed using the area of the selected peaks.
Cell Culture and Lysate Preparation—CaCo2 human colon colorec-tal adenocarcinoma cells were purchased from LGC Promochem andcultured until achieving 80–90% confluence in Dulbecco’sEagle’s�GlutaMAX-1 (Invitrogen) medium containing 10% fetal bo-vine serum. For protein identification purposes upon in-cell labeling,typically five T175 cell dishes (Corning) were incubated with a 10 �M
concentration of the probe for 1 h at 37 °C and washed three timeswith DPBS before harvesting. The pelleted cells were rinsed twicemore with DPBS and taken up in 500 �l of DPBS before proceedingto the lysis. For in-cell IC50 determination, typically seven T75 celldishes (Corning) were preincubated each with a different concentra-tion of the inhibitor of interest (or with DMSO for the mock control) at37 °C for 1.5 h before the addition of the probe (10 �M) and incubatingfor an additional 1 h. Washing and harvesting were then performed asindicated above, and the final cell pellet was taken up in 80 �l ofDPBS before proceeding to the lysis. The lysis was achieved by threeconsecutive freeze-and-thaw cycles over dry ice. The lysates werecentrifuged at 70,000 � g for 1 h. The resulting supernatants, corre-sponding to the crude cytoplasmic extracts, were assessed for pro-tein concentration on an ND-1000 spectrophotometer (NanoDrop) at280 nm and yielded a typical protein recovery of 5–20 mg/ml persample. The lysates were eventually frozen at �80 °C at this stage orprocessed directly to the next step.
Click Chemistry and Sample Preparation—The protein concentra-tion of the different samples was normalized to 5 mg/ml for proteinidentification or 1 mg/ml for IC50 determination. The click chemistryreaction was performed in DPBS in a final volume of 150 �l essentiallyas described previously (28) by adding in the following order: 1.5 �l ofazide fluorescein (10 mM), 3 �l of TCEP (25 mM freshly prepared), 9 �lof ligand (29) (1.7 mM in tert-butyl alcohol/DMSO), and 3 �l of CuSO4
(50 mM). After 1-h incubation at room temperature in the dark, a
In-cell Selectivity Profiling of Serine Protease Inhibitors
1242 Molecular & Cellular Proteomics 7.7
by guest on April 10, 2019
http://ww
w.m
cponline.org/D
ownloaded from

standard methanol/chloroform precipitation was directly performedon the samples to yield almost quantitative recovery of the proteinswith concomitant removal of most excess non-reacted fluorescein.The air-dried precipitate was then redissolved in 150 �l of Rabilloudloading buffer (30) for 2D gel analysis.
Gel Electrophoresis—2D gel electrophoresis was performed ac-cording to previously reported protocols (31, 32). Briefly the firstdimension separation was performed using either pH 4–7 linear or pH3–11 non-linear IPG strips (GE Healthcare) of 7 cm (for competitionexperiments and IC50 determinations; e.g. Figs. 5 and 6 and supple-mental Fig. S6) or 24 cm (for spot picking and protein identification;e.g. Fig. 4 and supplemental Table T1, exp1–2). The IPG strips (pH4–7) were directly rehydrated overnight with the samples resus-pended in 150 or 450 �l of Rabilloud buffer for the smaller 7-cm orlarger 24-cm strips, respectively. The IEF (pH 4–7) was performedwith a Multiphor II unit (GE Healthcare) at 20 °C. For the smaller 7-cmstrips, the following voltage profile was used: linear increase from 0 to300 V in 1 min, 300 V for 0.5 h, linear increase to 2000 V in 1 h, and2000 V for 3 h until a total focusing time of about 7300 V-h wasreached. For the larger 24-cm strips, the following voltage profile wasused: linear increase from 0 to 300 V in 1 min, 300 V for 3 h, linearincrease to 3500 V in 5 h, and 3500 V until a total focusing time ofabout 70–80 kV-h was reached. For the 24-cm-long pH 3–11 non-linear IPG strips (e.g. supplemental Table T1, exp3), the samples wereprepared in 150 �l of Rabilloud buffer as usual. The strips wererehydrated in 480 �l of DeStreak rehydration solution supplementedwith 1% IPG buffer (GE Healthcare). The sample was then applied byanodic cup loading on an Ettan IPGphor 3 operated under the follow-ing voltage profile: direct start at a constant 150 V for 2 h (for thesample to enter the cup), constant 300 V for 2 h, constant 500 V for2 h, linear increase to 1000 V in 4.5 h, linear increase to 10,000 V in4.5 h, and constant 10,000 V for 2 h until a total focusing time of about50,000 V-h. After electrofocusing, the IPG strips were finally equili-brated as described previously (32). The second dimension (SDS-PAGE) separation was performed on 12% polyacrylamide gels on aDodeca cell system (Bio-Rad). Gel electrophoresis was started at5–10 mA (for the proteins to enter the gel) and further run at a constantcurrent of 18 mA at 15 °C until the bromphenol blue ran out. The gelswere then immediately scanned for the fluorescein signal (excitation,480 nm; emission, 520 nm; voltage, 400–500 V) on a Typhoon 9400(Amersham Biosciences/GE Healthcare). The resulting image fileswere analyzed with ImageQuant (version 5, GE Healthcare) and even-tually aligned with the TT900 module of the SameSpots software(version 2, Nonlinear Dynamics). The gels were eventually blotted onInvitrolon PVDF membranes (Invitrogen) for PEP detection (e.g. Fig. 5,A and B, insets) or directly stained and processed for spot picking asdescribed hereafter.
In-gel Protein Digestion and Sample Preparation—For spot picking,the gels were fixed and stained with Coomassie Blue G-250 (32). Thescanned picture of the Coomassie-stained gel was aligned and over-laid with the previous fluorescein scan with Photoshop CS (Adobe).The spots of the fluorescently labeled enzymes were located relativeto defined Coomassie-stained references, excised, and digested in-gel with modified porcine trypsin (Promega) (31, 33). The resultingtryptic peptides were extracted with 5% formic acid, purified onZipTips (Millipore) from which they were eluted with 2 �l of �-cyano-4-hydroxycinnamic acid matrix (5 mg/ml in 50% CH3CN, 0.1% TFA in2 mM NH4H2PO4 containing two internal MS standards at 50 fmol/�l;see below), and directly spotted on an ABI 4700 MALDI 100-well plateby a Genesis ProTeam 150 system (Tecan).
Protein Identification by MALDI-TOF MS and MS/MS—MALDIspots were analyzed using the Applied Biosystems 4700 ProteomicsAnalyzer (Applied Biosystems) in automated, combined MS andMS/MS mode. Both MS and MS/MS data were acquired with a
neodymium-doped yttrium aluminium garnet (Nd:YAG) laser with a200-Hz repetition rate; 2000 shots were accumulated for each spec-trum in MS mode, and 5000 shots were accumulated for each of upto six selected precursor ions in MS/MS mode. Peak list-generatingsoftware used was 4000 Series Explorer (version 3.0 RC1 (November28, 2004), Applied Biosystems). For peptide mass fingerprints, mini-mal signal-to-noise ratio (S/N) for peak detection was set to 12, localnoise width was 50 m/z, and minimum peak width was one bin;resolution was set to 20,000 at m/z 1300; and only monoisotopicpeaks were labeled. For MS/MS spectra, minimal S/N for peak de-tection was set to 4, local noise width was 50 m/z, and minimum peakwidth was one bin; resolution was set to 12,000 at m/z 2000; and onlymonoisotopic peaks were labeled with cluster area S/N optimizationon and S/N threshold set to 4. MS spectra were in a first stepcalibrated externally with a standard mixture of five peptides (des-Arg1-bradykinin, [M � H]� 904.468; angiotensin I, [M � H]� 1296.685;[Glu1]fibrinopeptide B, [M � H]� 1570.677; ACTH-(1–17), [M � H]�
2093.086; and ACTH-(18–39), [M � H]� 2465.198 Da) and in a sec-ond step internally with fragments of trypsin (108–115, [M � H]�
842.509; and 58–77, [M � H]� 2211.104 Da) and/or two referencepeptides ([His32,Leu34]neuropeptide Y-(32–36), [M � H]� 743.442;and ACTH-(18–39), [M � H]� 2465.198 Da) admixed to the matrix (50fmol/�l). For calibration peak detection and application minimal S/Nwas set to 25, mass tolerance was set to 0.8 Da, and minimumnumber of peaks to match was set to 3. For MS/MS, the most intenseprecursor ions with a signal-to-noise ratio �25 were selected afterexclusion of common background signals (mass tolerance, �0.2 Da)derived from a blank sample treated with trypsin. The mass rangebelow m/z 900 was excluded because the respective peptides were ingeneral too short for an unambiguous protein assignment. Adductmass ranges excluded for MS/MS selection were �14, �22, �17,and �18 with a tolerance of �0.03 Da. MS/MS mode was operatedwith 1 keV, and products of metastable decomposition at elevatedlaser power were detected. MS/MS data were calibrated using defaultinstrument calibration, which was updated before measurement ofsample sets.
Database Search—Database searches (UniRef100 database,3,926,270 sequences; taxonomy, human; 89,881 sequences; Novem-ber 28, 2006) were performed using the Mascot search engine (ver-sion 1.9.05, Matrix Science) integrated in GPS Explorer (version 3.5;part of the ABI 4700 Proteomics Analyzer). With few exceptions (seesupplemental Table T1), the search was restricted to human taxon-omy because all samples were derived from human cell lines. Finalsearch results were obtained by combining the GPS Explorer resultsof combined MS and MS/MS searches as well as results from indi-vidual MS/MS and peptide mass fingerprint searches. As enzyme,trypsin was specified with one missed cleavage allowed in MS andthree missed cleavages allowed in MS/MS search. Mass tolerancewas 20 ppm in MS search, and precursor mass tolerance was 40 ppmin MS/MS searches; fragment ion mass accuracy in MS/MS was setto 0.8 Da. In MS/MS search the mass range from 69 to 50 Da beloweach precursor mass was taken into account. For peptide massfingerprint searches the masses of the internal calibrants and oftrypsin fragments were excluded (see supplemental Table T3). Peakdensity was filtered to 50 peaks in a 200-Da window. Carbamidom-ethylation of cysteines was specified as a fixed modification, andoxidation of methionine and protein N-terminal acetylation werespecified as variable modifications; oxidation of tryptophan and de-amidation of asparagine were considered as additional variable mod-ifications in MS/MS search only. With one exception (sample 70;protein-disulfide isomerase A4 precursor; best ion score, 95%), onlyproteins within a confidence interval �98% (protein score C.I. percentand/or best ion score C.I. percent) as provided from GPS Explorersoftware were considered as being primarily identified (see supple-
In-cell Selectivity Profiling of Serine Protease Inhibitors
Molecular & Cellular Proteomics 7.7 1243
by guest on April 10, 2019
http://ww
w.m
cponline.org/D
ownloaded from

mental Table T1). Confidence intervals based on normal probabilitydistribution mathematics provide “scores” that are independent ofdatabase size; they are listed for individual MS/MS hits (best ion scoreC.I. percent; supplemental Table T1), for combined MS/MS hits (totalion score C.I. percent; supplemental Table T1), and for combinedpeptide mass fingerprint (PMF) and MS/MS results (protein score C.I.percent; supplemental Table T1). For PMF results only, the proteinscore C.I. percent is the crucial value (see for example supplementalTable T1, sample 68, dipeptidyl-peptidase 3). For proteins with scoresat the lower end, the final identification was based on manual verifi-cation of fragment assignment and a manual check for correct frag-ment ion intensity distributions in the relevant MS/MS spectra. Thisincluded for example a check for pronounced C-terminal cleavage ataspartic acid residues in arginine-containing peptide ions, examina-tion of preferred N-terminal cleavage at proline especially for lysine-terminated peptide ions, and a check for appropriate neutral losses(e.g. loss of methanesulfenic acid from peptide ions containing oxi-dized methionine). Furthermore charge retention at the most basicfragments was taken as an additional indication for correct assign-ment of N- or C-terminal ion series. In cases where peptides matchedto similar protein sequences, the top scoring proteins are reported(see supplemental Table T1). In the case of protein groups, the
accession numbers of all group members are listed. For eachprotein identified, the number of unique peptides together with theirsequences and scores are compiled in supplemental Table T1. Forsingle peptide-based identifications, detailed data are listed in sup-plemental Table T2, including sequence, precursor ion mass, andscoring data. The corresponding MS/MS spectra were plotted (seeSingle peptide-based identifications-MS/MS spectra section in thesupplemental data). For the identification based on peptide massfingerprint only, the corresponding annotated MS spectrum to-gether with other relevant data is also included in the supplementaldata.
RESULTS AND DISCUSSION
Click Chemistry Serine Hydrolase Probe: Design, Prepara-tion, and Labeling Characterization—To achieve specific andefficient labeling of serine hydrolases in intact cells, a novelactivity-based probe was designed, combining an FP-reactivegroup with a polyethylene glycol linker and an alkyne func-tionality (FP-alkyne (1), Fig. 1A). The presence of the alkynefunctionality could then be detected in a later step upon a
FIG. 1. Design and labeling mechanism of the fluorophosphonate probes used in this study. A, chemical structures of the FP-alkyne(1) and FP-fluorescein (2) serine hydrolase probes (the synthesis schemes, preparation protocols, and characterizations of the FP-alkyne (1)and azide-fluorescein (3) are provided in the supplemental data). B, labeling mechanism of the FP-alkyne on the catalytic serine residue of theactive site of serine hydrolases; the FP-alkyne-labeled enzymes are detected in a second stage upon specific click chemistry reaction of thealkyne functionality with the azide-fluorescein (3) reporter molecule in the presence of CuSO4, TCEP as reducing agent, and tris(triazolyl)amine(“ligand”) (29).
In-cell Selectivity Profiling of Serine Protease Inhibitors
1244 Molecular & Cellular Proteomics 7.7
by guest on April 10, 2019
http://ww
w.m
cponline.org/D
ownloaded from

Cu(I)-catalyzed Huisgen [3 � 2] cycloaddition (“click chemis-try”) reaction (34) with an azide-functionalized fluorescentgroup (azide-fluorescein (3), Fig. 1B) as described elsewhere(17, 18, 20, 35). The choice to introduce the alkyne rather thanthe azide functionality on the probe was based on severalchemical considerations: although azide-functionalized mole-cules seem compatible with in vivo labeling conditions (17, 18,36–38), the chemical propensity of azides to undergo reduc-tion into amines might be of concern. This is especially true ifa trypsin digestion (requiring preliminary denaturation, reduc-tion, and alkylation steps) of the labeled proteome fractionprior to the click chemistry reaction is envisaged. Moreover aprevious extensive activity-based proteomics study has al-ready compared both alternatives for a phenyl sulfonate esterprobe (18). A significantly lower level of background labeling(resulting in an improved signal-to-noise ratio and in in-creased detection sensitivity) was obtained when the alkyneprobe was used in combination with an azide fluorescentreporter. This observation was also recently supported byothers (39).
To compare the labeling efficiency of this novel click chem-istry serine hydrolase probe we also prepared a previouslycharacterized fluorescein-derivatized fluorophosphonate probe(FP-fluorescein (2), Fig. 1B), which is claimed to presentsuperior labeling properties than the originally reported bio-tinylated fluorophosphonate probes (25). It is noteworthy thatthe chemical synthesis of the FP-alkyne probe turned out tobe much more challenging than that of the FP-fluorescein.The former readily hydrolyzed in less than 2 days even whenkept under its neat form at �20 °C, whereas the latter re-
mained perfectly stable under the same conditions (data notshown). This instability issue was solved by immediately di-luting the freshly prepared FP-alkyne probe with the properamount of anhydrous DMSO to yield a 100 mM stock solutionthat was kept frozen at �20 °C. Although no obvious chem-ical explanation can account for this enhanced hydrolysisrate, it is tempting to speculate that the fluorescein moietypresent in the FP-fluorescein probe might refold on the flu-orophosphonate functionality, thereby preventing excessivehydrolysis in aqueous solution.
A comparison of the labeling efficiencies achieved by thetwo probes was performed on recombinant proteins (dipep-tidyl-peptidases 4, 8, and 9 and prolyl endopeptidase) as wellas on CaCo2 cell lysate (Fig. 2A). Although the detection ofthe enzyme activity with the FP-alkyne requires a two-stepreaction (Fig. 1B), namely consecutive labeling of the catalyticserine residue of the enzyme and click chemistry couplingreaction to introduce the fluorescein reporter group, the over-all labeling efficiency with the FP-alkyne probe was 5- to over30-fold higher for all samples tested (Fig. 2A) even though theFP-alkyne probe was used in lower concentrations than theFP-fluorescein (10 versus 50 �M, respectively, yielding optimallabeling under our conditions). Those enhanced labeling ca-pabilities could be attributed either to the smaller size of theFP-alkyne probe, which might result in increased accessibilityto the labeling sites, or to an overall higher reactivity of theprobe, which correlates with the higher hydrolysis tendencyobserved in aqueous solutions as mentioned above. More-over the absence of reporter group on the FP-alkyne probemight prevent unspecific hydrophobic protein binding that
FIG. 2. Comparison of the labeling efficiencies of the fluorophosphonate probes toward recombinant enzymes and CaCo2 celllysate. A, the labeling of recombinant DPP4 (0.4 �M), DPP8 (0.2 �M), DPP9 (0.6 �M), and PEP (10 �M) as well as CaCo2 whole lysate (1 mg/ml)was performed with 10 �M FP-alkyne followed by click chemistry reaction or with 50 �M FP-fluorescein. B, the labeling of recombinant KLK7(0.4 �M) before (pro-KLK7) and after (KLK7-activated) proteolytic activation with thermolysin was performed with 10 �M FP-alkyne followed byclick chemistry reaction or with 50 �M FP-fluorescein. The fluorescence intensities of the labeled enzymes were calculated relative to theFP-fluorescein labeling of each enzyme separately. a, the fluorescence signal of PEP labeled with FP-alkyne was saturated; therefore theunderestimated ratio is indicated. b, the fluorescence intensities of five independent CaCo2 enzymes were compared upon labeling withthe FP-fluorescein or with the FP-alkyne; therefore the range of fluorescence intensity ratios is indicated.
In-cell Selectivity Profiling of Serine Protease Inhibitors
Molecular & Cellular Proteomics 7.7 1245
by guest on April 10, 2019
http://ww
w.m
cponline.org/D
ownloaded from

could potentially occur with the large fluorescein moiety of theFP-fluorescein probe. Additional experiments confirmed thatthe FP-alkyne probe labeled only the active form of KLK7 butnot the non-processed inactive zymogen (Fig. 2B) or theactive enzyme preincubated with a reversible inhibitor (sup-plemental Fig. S1).
Finally an extensive characterization of the labeling by theFP-alkyne probe was attempted by MS analysis. At the intact,full-length protein level, the deconvoluted nano-ESI profilerevealed the expected molecular weight for the labeled KLK7with one unique FP-alkyne probe molecule reacted per KLK7protein (Fig. 3). By comparing ratios of the peaks of themodified versus non-modified enzymes, the labeling effi-ciency of KLK7 by the FP-alkyne probe could be estimated toreach 80%. A tryptic digest of the labeled KLK7 enzyme wasalso analyzed by nano-LC-MS/MS and revealed that only theactive site peptide of KLK7 was specifically labeled with theFP-alkyne probe (see the Mascot report, supplemental Fig.S2). A detailed analysis of the fragmentation patterns of thelabeled peptide was performed by direct nano-ESI-MS/MSand confirmed that the modification occurred on the catalyticserine of the active site (supplemental Fig. S3). It is worthmentioning that the signal of the labeled active site peptidecould never be detected after click chemistry reaction with theazide-fluorescein (data not shown), although it is not clearwhether those discrepancies may be attributed to a partiallycomplete click chemistry reaction (supplemental Fig. S4) or tointrinsically poorer ionization properties of the labeled peptidedue to the presence of the negatively charged fluoresceinmoiety. Those MS characterizations validated the specificlabeling properties of the FP-alkyne probe toward the activesite serine residue of KLK7. Altogether these labeling results
demonstrate the value of the FP-alkyne probe to detect, withhigh sensitivity, the presence of active serine hydrolases byperforming covalent labeling of the accessible site of thoseenzymes.
In-cell and In-lysate Labeling of Serine Hydrolases—Nextwe compared the ability of the FP-alkyne and the FP-fluores-cein probes to perform in situ labeling of enzymes within livingCaCo2 cells. The CaCo2 colon adenocarcinoma cell line wasselected because it is a well established model system tostudy transport (absorption/efflux) and pharmacokinetics ofdrugs in development (40, 41). Analysis by 1D gel electro-phoresis of the CaCo2 proteomes labeled in cell or in lysatewith the FP-alkyne probe (Fig. 4A) indicated that both in-lysate labeling and in-cell labeling were comparable in termsof quantitative (as indicated by the similar fluorescence inten-sities of lanes 4 and 1) and qualitative detection of enzymaticactivity patterns (similar 9–10 bands of labeled enzymes de-tectable both in lanes 4 and 1). On the contrary, the FP-fluorescein probe could not cross the cell membrane andcould not achieve in situ labeling of cytoplasmic enzymeseven at the highest concentrations tested (Fig. 4A, lane 5). Toassess the efficiency of the in situ labeling with FP-alkyne, alysate fraction from the in-cell labeling was reincubated withthe probe prior to the click chemistry reaction (Fig. 4A, lane 3).This relabeling experiment yielded only a marginal increase ofenzyme labeling (Fig. 4A, compare lanes 3 and 4), suggestingthat in-cell labeling with the FP-alkyne probe had alreadyalmost reached completion under the conditions used here.Kinetic characterization of in-cell labeling showed that the insitu labeling was complete in less than 1 h of incubation withan optimal concentration of 10 �M FP-alkyne added to the cellsupernatant (data not shown). Finally it is worth mentioning
FIG. 3. Deconvoluted nano-ESI MSspectrum of recombinant kallikrein 7labeled with the FP-alkyne probe. Themass of the labeled recombinant KLK7enzyme matches the addition of one FP-alkyne probe molecule per protein(24,436 � 282 � 19 � 1 � 24,698 Da;see Fig. 1B). The ratio of the peak areassuggests a labeling yield of about80%. cps, counts/s; MCA, multichan-nel analysis.
In-cell Selectivity Profiling of Serine Protease Inhibitors
1246 Molecular & Cellular Proteomics 7.7
by guest on April 10, 2019
http://ww
w.m
cponline.org/D
ownloaded from

that the labeling of most of the enzymes could be efficientlycompeted with PMSF (data not shown), a known broad spec-trum serine protease inhibitor, indicating again the specificityof the FP-alkyne labeling at the active site of those enzymes.Altogether these results demonstrate that the FP-alkyneprobe is cell-permeable and achieved in situ labeling of theaccessible active sites of cellular enzymes with almost thesame efficiency as that obtained in lysate.
To gain better resolution in the separation of the labeledenzymes, the in-lysate (Fig. 4B, fluorescein signal colored inred) and in-cell (Fig. 4C, fluorescein signal colored in green)labeled CaCo2 samples were analyzed by 2D gel electro-phoresis: the overlaid picture (Fig. 4D) confirmed a very similarquantitative labeling of the enzymes that is independent ofwhether the labeling occurred in situ or after cell disruption.Interestingly some enzyme activities were only detectableupon in-cell labeling (Fig. 4D, green circles), suggesting thatthose enzymes either lost their active conformation or wereplaced in the presence of endogenous inhibitors during thelysis process as happens for the calpain-calpastatin complexupon purification (42) for instance. Similar discrepancies indetection of enzymatic activities have also been reported byformer activity-based proteomics studies, such as for cathep-sin L whose labeling was lost upon lysate preparation (43, 44).Conversely the labeling of some other enzymes occurredexclusively in the lysate fraction and not in the intact cells (Fig.4D, red circles). This appearance/recovery of enzyme activityin the lysate fractions might result from the de novo proteo-lytic processing of zymogens upon mixing of proteases ofseparate cellular compartments or from the disruption of theenzyme-endogenous inhibitor complexes, which were asso-ciated within living cells, upon dilution during the lysis proc-ess. Altogether these results emphasize the biological rele-vance of the in-cell labeling that provides the most authenticdepiction of enzymatic activities present within living cells.This novel cell-permeable FP-alkyne probe represents, in thisrespect, a clear improvement over the previously reportedserine hydrolase probes.
MALDI-TOF MS identification was performed on the in-celland in-lysate labeled CaCo2 enzymes resolved by 2D gelelectrophoresis and yielded a list of proteins that is providedin supplemental Table T1. It is worth mentioning that theidentification confidence was higher compared with directnano-LC-MS-based analysis because of the fact that theproteomes were separated by 2D electrophoresis and that thespots of the labeled enzymes were physically picked fromthe 2D gels. The hits were thus further validated by the cor-relation of the expected molecular weight and pI with theobserved values according to the 2D gel spot migration.Therefore, even proteins identified from a single peptide hitconfirmed by MS/MS were considered as reliably identifiedcandidates. Nevertheless because no probe-based enrich-ment process was performed prior to 2D gel electrophoresisand MS identification, it is likely that some of the identified
proteins do not represent actual covalent adducts with theprobe. Rather they may represent abundant proteins thatco-migrate with the actual FP-alkyne-labeled targets (as canbe foreseen by the overall intensity of the Coomassie Blueprotein staining overlaid on the fluorescence scan of the 2Dgel in Fig. 4E). As a typical example, the identification of theenzyme spots, circled in red (Fig. 4, D and E), that werespecifically labeled in the lysate was hampered by the pres-ence of non-relevant co-migrating highly abundant proteins,e.g. 14-3-3 protein � or glutathione S-transferase Omega 1;see supplemental Table T1. Therefore, we elected to restrictour analysis of potential targets (listed in Table I) to enzymesclearly belonging to the serine hydrolase class and to en-zymes already identified by former activity-based proteomicsstudies using other FP probes on rodent (13, 16, 24, 26) orhuman (7, 27, 45) cell lysates or tissue extracts. This validatesthe use of our novel FP-alkyne probe for the in situ detectionof serine hydrolase activities in living cells. The identificationof the same enzymes across various human cell lines (breast(7, 27), prostate (45), and colon (our data)), suggests also thatthose enzymes might be ubiquitously expressed and shouldtherefore be regarded as potentially critical off-targets whenassessing the specificity of inhibitors.
Although the number of identifications, 14 validated for-merly cross-referenced enzymes with FP reactivity (Table I)and more than 30 potentially new labeled proteins (highlightedin red in supplemental Table T1), lies in the range of what hadbeen obtained so far (between seven identifications by gel(13) and 57 identifications by MS-based multidimensionalprotein identification technology (27)), only three validatedserine proteases were identified in this study. Several factorscould account for this low identification rate. First, the totalnumber of serine hydrolases encoded by the human genomemay greatly exceed the number of serine proteases (46).Second, the potentially deleterious digesting properties ofproteases might imply both an overall lower expression ofthose enzymes compared with hydrolases as well as a tighterregulation of their activities. Third, a large number of serineproteases are secreted or membrane-associated. Becausethese subcellular fractions were not analyzed in this study,this could explain the biased identification rate toward theserine hydrolases versus proteases. This latter shortcoming isin part due to inherent limitations of 2D gel electrophoresis,which remains unpractical for the analysis of large hydro-phobic proteins (membrane proteins typically). Also the re-course to 2D gel may have restricted our protease identifi-cation capacities in terms of sensitivity. Indeed and despitethe higher sensitivity achievable by fluorescence labeling ofthe enzymes compared with total protein staining methods(Coomassie Blue or silver staining), the limited dynamicrange of the fluorescence scanner seems to have restrictedour detection to the labeled enzymes of high abundanceonly (about 50 spots were clearly and reproducibly identifi-able on the 2D gels).
In-cell Selectivity Profiling of Serine Protease Inhibitors
Molecular & Cellular Proteomics 7.7 1247
by guest on April 10, 2019
http://ww
w.m
cponline.org/D
ownloaded from
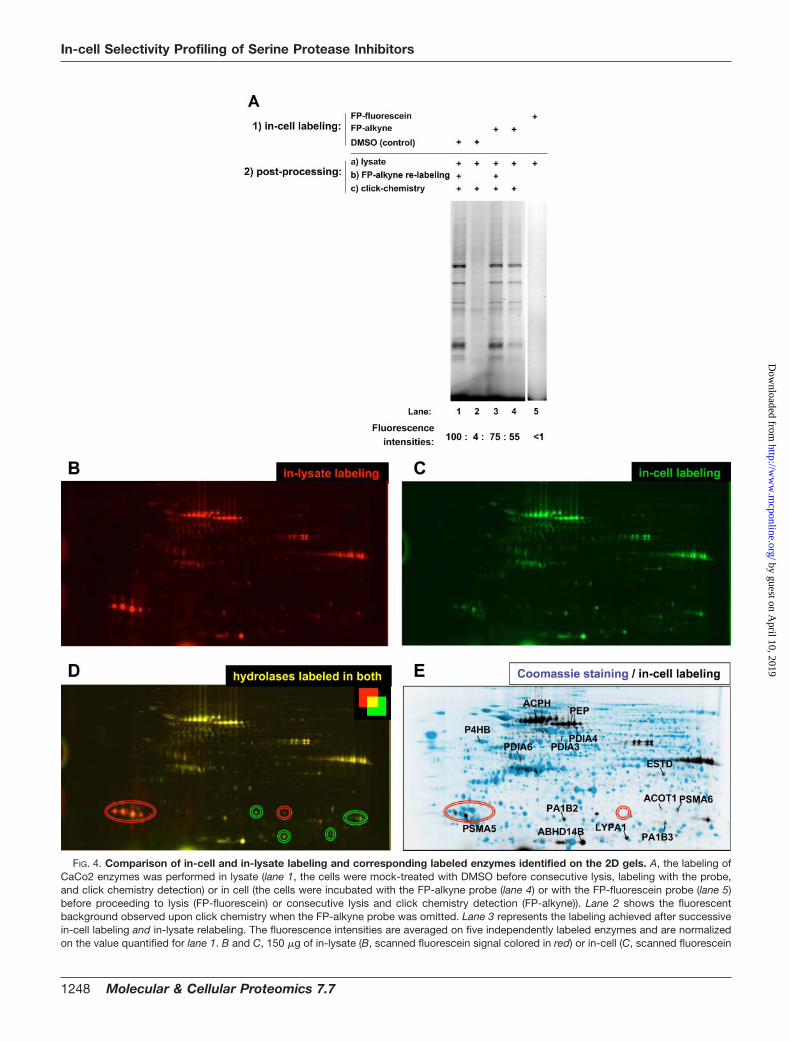
FIG. 4. Comparison of in-cell and in-lysate labeling and corresponding labeled enzymes identified on the 2D gels. A, the labeling ofCaCo2 enzymes was performed in lysate (lane 1, the cells were mock-treated with DMSO before consecutive lysis, labeling with the probe,and click chemistry detection) or in cell (the cells were incubated with the FP-alkyne probe (lane 4) or with the FP-fluorescein probe (lane 5)before proceeding to lysis (FP-fluorescein) or consecutive lysis and click chemistry detection (FP-alkyne)). Lane 2 shows the fluorescentbackground observed upon click chemistry when the FP-alkyne probe was omitted. Lane 3 represents the labeling achieved after successivein-cell labeling and in-lysate relabeling. The fluorescence intensities are averaged on five independently labeled enzymes and are normalizedon the value quantified for lane 1. B and C, 150 �g of in-lysate (B, scanned fluorescein signal colored in red) or in-cell (C, scanned fluorescein
In-cell Selectivity Profiling of Serine Protease Inhibitors
1248 Molecular & Cellular Proteomics 7.7
by guest on April 10, 2019
http://ww
w.m
cponline.org/D
ownloaded from
Although switching to an enrichment process and/or to agel-free approach would probably increase the number ofidentified labeled enzymes, 2D gel electrophoresis remains apowerful separation technique to monitor the extent of label-
ing of the detected enzymatic activities even in these highlycomplex proteome samples. In particular, in-gel fluorescencereadout provides a direct, rapid, and accurate quantificationof the labeling of enzymes, as will be shown hereafter, espe-
signal colored in green) labeled CaCo2 samples were separated on 2D gels by consecutive electrofocusing on 7-cm-long, linear pH 4–7 stripsfollowed by electrophoresis on a 12% polyacrylamide gel. D, overlaid picture of the two previous gels; the enzymes more than 10 times labeledin lysate or in cell only are circled in red and green, respectively. D, overlaid picture of the fluorescent scan of the in-cell labeled enzymaticactivities (C; fluorescein signal colored in black here) and the corresponding total protein Coomassie Blue staining of the gel (in blue). Theunambiguously identified labeled enzymes (reported in Table I) are directly annotated at their relevant position on the picture. ACPH, acylaminoacid-releasing enzyme; ESTD, esterase D.
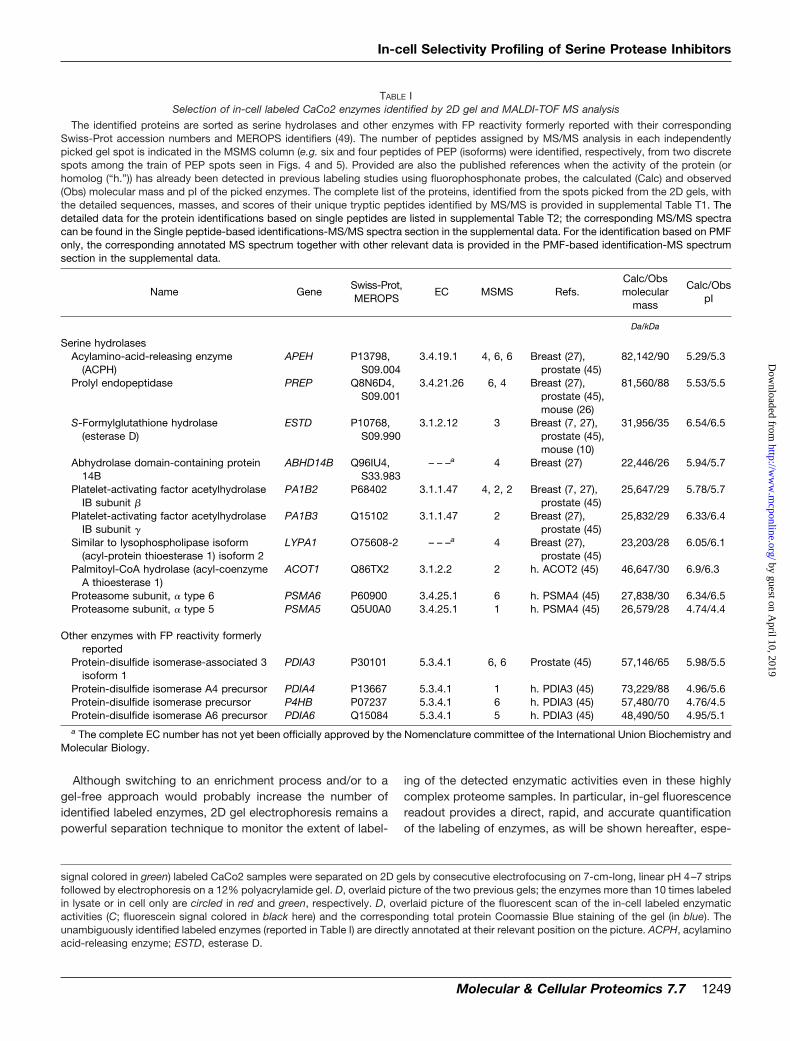
TABLE ISelection of in-cell labeled CaCo2 enzymes identified by 2D gel and MALDI-TOF MS analysis
The identified proteins are sorted as serine hydrolases and other enzymes with FP reactivity formerly reported with their correspondingSwiss-Prot accession numbers and MEROPS identifiers (49). The number of peptides assigned by MS/MS analysis in each independentlypicked gel spot is indicated in the MSMS column (e.g. six and four peptides of PEP (isoforms) were identified, respectively, from two discretespots among the train of PEP spots seen in Figs. 4 and 5). Provided are also the published references when the activity of the protein (orhomolog (“h.”)) has already been detected in previous labeling studies using fluorophosphonate probes, the calculated (Calc) and observed(Obs) molecular mass and pI of the picked enzymes. The complete list of the proteins, identified from the spots picked from the 2D gels, withthe detailed sequences, masses, and scores of their unique tryptic peptides identified by MS/MS is provided in supplemental Table T1. Thedetailed data for the protein identifications based on single peptides are listed in supplemental Table T2; the corresponding MS/MS spectracan be found in the Single peptide-based identifications-MS/MS spectra section in the supplemental data. For the identification based on PMFonly, the corresponding annotated MS spectrum together with other relevant data is provided in the PMF-based identification-MS spectrumsection in the supplemental data.
Name GeneSwiss-Prot,MEROPS
EC MSMS Refs.Calc/Obsmolecular
mass
Calc/ObspI
Da/kDa
Serine hydrolasesAcylamino-acid-releasing enzyme
(ACPH)APEH P13798,
S09.0043.4.19.1 4, 6, 6 Breast (27),
prostate (45)82,142/90 5.29/5.3
Prolyl endopeptidase PREP Q8N6D4,S09.001
3.4.21.26 6, 4 Breast (27),prostate (45),mouse (26)
81,560/88 5.53/5.5
S-Formylglutathione hydrolase(esterase D)
ESTD P10768,S09.990
3.1.2.12 3 Breast (7, 27),prostate (45),mouse (10)
31,956/35 6.54/6.5
Abhydrolase domain-containing protein14B
ABHD14B Q96IU4,S33.983
– – –a 4 Breast (27) 22,446/26 5.94/5.7
Platelet-activating factor acetylhydrolaseIB subunit �
PA1B2 P68402 3.1.1.47 4, 2, 2 Breast (7, 27),prostate (45)
25,647/29 5.78/5.7
Platelet-activating factor acetylhydrolaseIB subunit �
PA1B3 Q15102 3.1.1.47 2 Breast (27),prostate (45)
25,832/29 6.33/6.4
Similar to lysophospholipase isoform(acyl-protein thioesterase 1) isoform 2
LYPA1 O75608-2 – – –a 4 Breast (27),prostate (45)
23,203/28 6.05/6.1
Palmitoyl-CoA hydrolase (acyl-coenzymeA thioesterase 1)
ACOT1 Q86TX2 3.1.2.2 2 h. ACOT2 (45) 46,647/30 6.9/6.3
Proteasome subunit, � type 6 PSMA6 P60900 3.4.25.1 6 h. PSMA4 (45) 27,838/30 6.34/6.5Proteasome subunit, � type 5 PSMA5 Q5U0A0 3.4.25.1 1 h. PSMA4 (45) 26,579/28 4.74/4.4
Other enzymes with FP reactivity formerlyreported
Protein-disulfide isomerase-associated 3isoform 1
PDIA3 P30101 5.3.4.1 6, 6 Prostate (45) 57,146/65 5.98/5.5
Protein-disulfide isomerase A4 precursor PDIA4 P13667 5.3.4.1 1 h. PDIA3 (45) 73,229/88 4.96/5.6Protein-disulfide isomerase precursor P4HB P07237 5.3.4.1 6 h. PDIA3 (45) 57,480/70 4.76/4.5Protein-disulfide isomerase A6 precursor PDIA6 Q15084 5.3.4.1 5 h. PDIA3 (45) 48,490/50 4.95/5.1a The complete EC number has not yet been officially approved by the Nomenclature committee of the International Union Biochemistry and
Molecular Biology.
In-cell Selectivity Profiling of Serine Protease Inhibitors
Molecular & Cellular Proteomics 7.7 1249
by guest on April 10, 2019
http://ww
w.m
cponline.org/D
ownloaded from

cially when those enzymes are expressed in multiple isoforms,which might be problematic to resolve individually by anMS-based method.
In-cell and In-lysate Selectivity Profiling of Inhibitors of Ser-ine Proteases (e.g. PEP)—Among the identified proteins, theprolyl endopeptidase serine protease (Swiss-Prot accessionnumber P48147) was selected for a proof of concept experi-ment of in-cell selectivity profiling by activity-based proteom-ics. Although its exact physiological role remains unclear, itsability to process bioactive neuropeptides in vitro suggeststhat PEP may be involved in cognitive functions and neuro-logical disorders (for reviews, see Refs. 47 and 48). First, thepresence of PEP in the CaCo2 cells was confirmed by West-ern blotting the 2D gels (Fig. 5A and B, insets). Second, an insitu competition of labeling was attempted by preincubatingthe CaCo2 cells with a nanomolar in-house reversible inhibitorof PEP (Inhibitor A; in vitro IC50 � 3 nM) prior to in-cell labelingwith the FP-alkyne probe (Fig. 5B). The experiments resultedin complete disappearance of the fluorescent signals of thelabeled PEP enzyme (Fig. 5, A and B, compare the circledspots of PEP), demonstrating (i) that labeling of PEP with theFP-alkyne probe could be efficiently competed by the inhibi-tor even in the presence of a saturating excess of probecompared with the inhibitor (e.g. 10 �M FP-alkyne versus 50nM Inhibitor A; Fig. 6A) and (ii) that the inhibitor could thuspenetrate the cell membrane to achieve potent in situ inhibi-tion of PEP activity.
To validate the use of activity-based proteomics for in situquantification of inhibitor potency (IC50), a similar competitionof labeling was achieved with seven different concentrationsof the inhibitor either (i) on lysates by preincubating CaCo2cell lysate fractions with the inhibitor prior to the labeling or (ii)in situ upon preincubation of the CaCo2 cells with the inhibitor
before performing in-cell labeling and lysis. Each tested con-dition required separate migration on as many 2D gels andresulted in competition of the in-gel fluorescence of the inhib-ited enzyme (e.g. Fig. 6, circled spots of PEP). In-gel fluores-cence quantification of those labeled spots led to accuratedetermination of percentage of inhibition, which was plottedas classical dose-response curves and resulted in the follow-ing IC50 values (Fig. 6): 4 and 30 nM for in-cell and in-lysateIC50, respectively (average of two independent IC50 determi-nations). It should be stressed that the IC50 determined bycompetition of the in-cell labeling of enzymes integrates pa-rameters such as cell permeability of the inhibitor, compart-mental distribution, local endogenous target/off-target en-zyme concentration, and cellular metabolic regulationmechanisms (detoxification/efflux). These factors are totallyoverlooked by in-lysate or in vitro IC50 determination, al-though they critically affect the local effective concentration ofthe inhibitor in vivo and may result in shifts in potencies if theinhibitor is co-localized with its primary target or withoff-targets.
Here the 2D gel uncovers its potential by the possibility topinpoint the multiple isoforms of the labeled enzymes. Onecould imagine the case of an inhibitor that would compete forthe labeling of a specific isoform of an enzyme and not theother ones. Such an isoform-specific inhibition would bevery difficult if not impossible to study by regular MS-basedanalysis if that specific peptide carrying the modification(e.g. phosphorylation or glycosylation) could not be identi-fied by MS.
Our data also indicate that IC50 values of reversible inhibi-tors can be determined even under saturating labeling condi-tions. Indeed competition experiments performed at varioustime points prior to and after labeling completion did not result
FIG. 5. In situ competition of PEP la-beling detected by in-cell labelingwith the FP-alkyne probe. A–D, 2D gelanalyses of the CaCo2 enzymatic activ-ities detected upon in-cell labeling ofmock-treated cells (A) or of cells prein-cubated for 1.5 h with 5 �M Inhibitor A(B), 10 �M Inhibitor B (C), or 100 �M
Inhibitor C (D) prior to in-cell labeling.Excerpts from Western blot analyseswith the anti-PEP antibody confirmingthe presence of similar amounts of PEPare shown in insets in A and B. The spottrains corresponding to the PEP iso-forms are circled. The spot train of thenewly labeled enzymatic activity appear-ing upon preincubation with 100 �M In-hibitor C is indicated with an arrow in D.
In-cell Selectivity Profiling of Serine Protease Inhibitors
1250 Molecular & Cellular Proteomics 7.7
by guest on April 10, 2019
http://ww
w.m
cponline.org/D
ownloaded from

in a significant variation of the IC50 estimation (supplementalFig. S5). Although this result might sound counterintuitiveconsidering the potential displacement of the reversible inhib-itor-enzyme equilibrium expected upon continuous covalenttrapping of the free enzyme fraction by the probe as noted
elsewhere (13, 16), several explanations could account forthis. First, the fluorophosphonate probe labels kinetically theenzymes in a “reactivity-driven” manner (Fig. 1B), but it doesnot possess any significant intrinsic binding capabilities, andthus it cannot displace bound inhibitors from the enzyme.
FIG. 6. In-lysate and in-cell IC50 determination for PEP Inhibitor A. 2D gel separation of in-cell (A) and in-lysate (B) competition of labelingexperiments with the indicated concentrations of Inhibitor A is shown. Shown are excerpts of the 2D gels depicting the fluorescently labeledspots of PEP (spot train on the right side, circled in green) and of acylamino-acid-releasing enzyme (spot train on the left side). For accuratein-gel fluorescence quantification, see the recommendations in supplemental Fig. S6.
In-cell Selectivity Profiling of Serine Protease Inhibitors
Molecular & Cellular Proteomics 7.7 1251
by guest on April 10, 2019
http://ww
w.m
cponline.org/D
ownloaded from

Second, it seems that in the case of potent (e.g. nanomolar)inhibitors, presenting a high binding affinity and a low disso-ciation constant (Ki), the interval under which the inhibitorcould quit the inhibitor-enzyme complex and leave de novofree active enzyme in solution would not allow enough time forthe probe to access the enzyme and perform active sitelabeling. Considering that different enzymes are labeled withdifferent kinetics (16) and to optimize the signal-to-noise ratiofor the IC50 estimation, we suggest to perform the selectivityprofiling experiments under complete labeling conditionswhen the Ki of the inhibitor is the only variable that wouldthen directly correlate to the observed competition of label-ing with the probe. In all cases, even taking into account apotential inhibitor-enzyme equilibrium displacement, thedetermined IC50 value would be rather overestimated (i.e.appearing worse than it is in reality) but would still be ofsignificance to compare relative in situ inhibition on thesame target.
To confirm that our in-cell selectivity profiling methodologyis indeed of general use, the same experiments were repeatedwith less potent (micromolar) inhibitors of PEP (Inhibitor B (invitro IC50 � 1.9 �M) and Inhibitor C (in vitro IC50 � 1.2 �M)).Although the competition of labeling with these two inhibitorsdid not reach absolute completion at the inhibitor concentra-tions tested (Fig. 5, C and D, circled spots for PEP), thedecrease of PEP labeling was reproducible and could bequantified to yield accurate IC50 determinations (1.4 and 7 �M
for Inhibitor B and Inhibitor C, respectively; average of twoindependent IC50 determinations; supplemental Fig. S6).
Interestingly although we were specifically looking for thedisappearance of spots to assess the specificity of thoseinhibitors, to our surprise, a newly labeled train of spots sud-denly appeared upon incubation of 100 �M Inhibitor C (Fig.5D, spots indicated with an arrow). This de novo appearanceof enzymatic activity was completely unexpected becauseinhibitors are supposed to compete for the labeling of off-target enzymes. This effect was exclusively observed uponcompetition of the in-cell labeling and could not be repro-duced upon in-lysate competition of labeling (data notshown), implying that the “inhibitor” induced its peculiar ac-tivation effect through a pathway that is functional under invivo conditions only. The detailed study of the mode of actionof Inhibitor C falls beyond the scope of this study, but it will beof particular interest to determine whether this substanceexhibits its effect by inhibiting an extra factor, which is in-volved otherwise in the usual down-regulation of the enzyme,or by inducing the expression (or activation) of that newlyappearing active enzyme through a completely unanticipatedpathway. Nevertheless this striking result highlights again thevalue of the FP-alkyne activity-based probe to assess in-cellselectivity profiling of inhibitors and paves new ways for un-derstanding “side effects” of drugs that would have beenotherwise completely overlooked by standard inhibitionmeasurement by in vitro fluorescent assays.
In summary, we developed a novel activity-based probethat achieves labeling of serine hydrolases within complexproteomes and performs efficient in situ labeling of enzymaticactivities within living cells. Because of the accuracy of 2D gelfluorescence quantification, this probe can be used to monitorin situ the relative activity levels of enzymes, and as a proof ofprinciple, the potencies of several PEP inhibitors were com-pared in living CaCo2 cells and lysates. The possibility tomonitor simultaneously individual activities of several mem-bers of an enzyme family in living cells opens new perspec-tives in the drug discovery process and offers the opportunityto assess the potency and selectivity of inhibitors towardentire families of related enzymes simultaneously in one singleexperiment under highly physiological conditions (on endog-enous active enzymes at their relevant localization and con-centration within their natural environment in intact cells).Finally our study uncovers unforeseen aspects of in-cellsafety profiling by activity-based proteomics where an inhib-itor will not only be profiled for off-target inhibition potency butwill also be assessed for potential off-target activation, aneffect that would be impossible to discover with other in vitroprofiling methods.
Acknowledgments—We are grateful to Francois Gessier and GaryKsander (Global Discovery Chemistry, Novartis) for the gift of the PEPinhibitors. We also thank Julian Woelcke, Jorg Eder, Aengus MacSweeney, Richard Sedrani, and Lorenz Mayr (Expertise Platform Pro-teases, Novartis) for critical reading of the manuscript as well as theother members of the Platform for the stimulating discussions aboutthe project. Finally we acknowledge Prof. Christopher Overall foruseful advice and comments throughout the course of this study.
* This work was supported by the Novartis Institutes for BioMedicalResearch, Education Office, and Expertise Platform Proteases. Thecosts of publication of this article were defrayed in part by the pay-ment of page charges. This article must therefore be hereby marked“advertisement” in accordance with 18 U.S.C. Section 1734 solely toindicate this fact.
□S The on-line version of this article (available at http://www.mcponline.org) contains supplemental material.
� To whom correspondence should be addressed: Center for Pro-teomic Chemistry/Expertise Platform Proteases, Novartis Insts. forBioMedical Research, Fabrikstrasse 16-2.72.2, CH-4002 Basel,Switzerland. Tel.: 41-61-6962485; Fax: 41-61-6968132; E-mail:[email protected].
REFERENCES
1. Jeffery, D. A., and Bogyo, M. (2003) Chemical proteomics and its applica-tion to drug discovery. Curr. Opin. Biotechnol. 14, 87–95
2. Speers, A. E., and Cravatt, B. F. (2004) Chemical strategies for activity-based proteomics. Chembiochem 5, 41–47
3. Evans, M. J., and Cravatt, B. F. (2006) Mechanism-based profiling ofenzyme families. Chem. Rev. 106, 3279–3301
4. Saghatelian, A., and Cravatt, B. F. (2005) Assignment of protein function inthe postgenomic era. Nat. Chem. Biol. 1, 130–142
5. Fonovic, M., and Bogyo, M. (2007) Activity based probes for proteases:applications to biomarker discovery, molecular imaging and drugscreening. Curr. Pharm. Des. 13, 253–261
6. Greenbaum, D. C., Baruch, A., Grainger, M., Bozdech, Z., Medzihradszky,K. F., Engel, J., DeRisi, J., Holder, A. A., and Bogyo, M. (2002) A role forthe protease falcipain 1 in host cell invasion by the human malariaparasite. Science 298, 2002–2006
In-cell Selectivity Profiling of Serine Protease Inhibitors
1252 Molecular & Cellular Proteomics 7.7
by guest on April 10, 2019
http://ww
w.m
cponline.org/D
ownloaded from

7. Jessani, N., Liu, Y., Humphrey, M., and Cravatt, B. F. (2002) Enzyme activityprofiles of the secreted and membrane proteome that depict cancer cellinvasiveness. Proc. Natl. Acad. Sci. U. S. A. 99, 10335–10340
8. Adam, G. C., Sorensen, E. J., and Cravatt, B. F. (2002) Proteomic profilingof mechanistically distinct enzyme classes using a common chemotype.Nat. Biotechnol. 20, 805–809
9. Adam, G. C., Sorensen, E. J., and Cravatt, B. F. (2002) Trifunctional chem-ical probes for the consolidated detection and identification of enzymeactivities from complex proteomes. Mol. Cell. Proteomics 1, 828–835
10. Jessani, N., Humphrey, M., McDonald, W. H., Niessen, S., Masuda, K.,Gangadharan, B., Yates, J. R., III, Mueller, B. M., and Cravatt, B. F. (2004)Carcinoma and stromal enzyme activity profiles associated with breasttumor growth in vivo. Proc. Natl. Acad. Sci. U. S. A. 101, 13756–13761
11. Saghatelian, A., Jessani, N., Joseph, A., Humphrey, M., and Cravatt, B. F.(2004) Activity-based probes for the proteomic profiling of metallopro-teases. Proc. Natl. Acad. Sci. U. S. A. 101, 10000–10005
12. Greenbaum, D., Medzihradszky, K. F., Burlingame, A., and Bogyo, M.(2000) Epoxide electrophiles as activity-dependent cysteine proteaseprofiling and discovery tools. Chem. Biol. 7, 569–581
13. Kidd, D., Liu, Y., and Cravatt, B. F. (2001) Profiling serine hydrolase activ-ities in complex proteomes. Biochemistry 40, 4005–4015
14. Greenbaum, D., Baruch, A., Hayrapetian, L., Darula, Z., Burlingame, A.,Medzihradszky, K. F., and Bogyo, M. (2002) Chemical approaches forfunctionally probing the proteome. Mol. Cell. Proteomics 1, 60–68
15. Greenbaum, D. C., Arnold, W. D., Lu, F., Hayrapetian, L., Baruch, A.,Krumrine, J., Toba, S., Chehade, K., Bromme, D., Kuntz, I. D., andBogyo, M. (2002) Small molecule affinity fingerprinting. A tool for enzymefamily subclassification, target identification, and inhibitor design. Chem.Biol. 9, 1085–1094
16. Leung, D., Hardouin, C., Boger, D. L., and Cravatt, B. F. (2003) Discoveringpotent and selective reversible inhibitors of enzymes in complex pro-teomes. Nat. Biotechnol. 21, 687–691
17. Speers, A. E., Adam, G. C., and Cravatt, B. F. (2003) Activity-based proteinprofiling in vivo using a copper(I)-catalyzed azide-alkyne [3 � 2] cycload-dition. J. Am. Chem. Soc. 125, 4686–4687
18. Speers, A. E., and Cravatt, B. F. (2004) Profiling enzyme activities in vivousing click chemistry methods. Chem. Biol. 11, 535–546
19. Evans, M. J., Saghatelian, A., Sorensen, E. J., and Cravatt, B. F. (2005)Target discovery in small-molecule cell-based screens by in situ pro-teome reactivity profiling. Nat. Biotechnol. 23, 1303–1307
20. Salisbury, C. M., and Cravatt, B. F. (2007) Activity-based probes for pro-teomic profiling of histone deacetylase complexes. Proc. Natl. Acad. Sci.U. S. A. 104, 1171–1176
21. Joyce, J. A., Baruch, A., Chehade, K., Meyer-Morse, N., Giraudo, E., Tsai,F. Y., Greenbaum, D. C., Hager, J. H., Bogyo, M., and Hanahan, D. (2004)Cathepsin cysteine proteases are effectors of invasive growth and an-giogenesis during multistage tumorigenesis. Cancer Cell 5, 443–453
22. Turk, B. (2006) Targeting proteases: successes, failures and future pros-pects. Nat. Rev. Drug Discov. 5, 785–799
23. Goudreau, N., and Llinas-Brunet, M. (2005) The therapeutic potential ofNS3 protease inhibitors in HCV infection. Expert Opin. Investig. Drugs 14,1129–1144
24. Liu, Y., Patricelli, M. P., and Cravatt, B. F. (1999) Activity-based proteinprofiling: the serine hydrolases. Proc. Natl. Acad. Sci. U. S. A. 96,14694–14699
25. Patricelli, M. P., Giang, D. K., Stamp, L. M., and Burbaum, J. J. (2001) Directvisualization of serine hydrolase activities in complex proteomes usingfluorescent active site-directed probes. Proteomics 1, 1067–1071
26. Okerberg, E. S., Wu, J., Zhang, B., Samii, B., Blackford, K., Winn, D. T.,Shreder, K. R., Burbaum, J. J., and Patricelli, M. P. (2005) High-resolutionfunctional proteomics by active-site peptide profiling. Proc. Natl. Acad.Sci. U. S. A. 102, 4996–5001
27. Jessani, N., Niessen, S., Wei, B. Q., Nicolau, M., Humphrey, M., Ji, Y., Han,W., Noh, D. Y., Yates, J. R., III, Jeffrey, S. S., and Cravatt, B. F. (2005) Astreamlined platform for high-content functional proteomics of primaryhuman specimens. Nat. Methods 2, 691–697
28. Weerapana, E., Speers, A. E., and Cravatt, B. F. (2007) Tandem orthogonalproteolysis-activity-based protein profiling (TOP-ABPP)—a generalmethod for mapping sites of probe modification in proteomes. Nat.
Protoc. 2, 1414–142529. Wang, Q., Chan, T. R., Hilgraf, R., Fokin, V. V., Sharpless, K. B., and Finn,
M. G. (2003) Bioconjugation by copper(I)-catalyzed azide-alkyne [3 � 2]cycloaddition. J. Am. Chem. Soc. 125, 3192–3193
30. Rabilloud, T. (1998) Use of thiourea to increase the solubility of membraneproteins in two-dimensional electrophoresis. Electrophoresis 19,758–760
31. Hoving, S., Gerrits, B., Voshol, H., Muller, D., Roberts, R. C., and vanOostrum, J. (2002) Preparative two-dimensional gel electrophoresis atalkaline pH using narrow range immobilized pH gradients. Proteomics 2,127–134
32. Hoving, S., Voshol, H., and van Oostrum, J. (2005) Using ultra-zoom gelsfor high-resolution two-dimensional polyacrylamide gel electrophoresis,in The Proteomics Protocols Handbook (Walker, J. M., ed) pp. 151–165,University of Hertfordshire, Hatfield, Herts, UK
33. Voshol, H., Brendlen, N., Muller, D., Inverardi, B., Augustin, A., Pally, C.,Wieczorek, G., Morris, R. E., Raulf, F., and van Oostrum, J. (2005)Evaluation of biomarker discovery approaches to detect protein biomar-kers of acute renal allograft rejection. J. Proteome Res. 4, 1192–1199
34. Rostovtsev, V. V., Green, L. G., Fokin, V. V., and Sharpless, K. B. (2002) Astepwise Huisgen cycloaddition process: copper(I)-catalyzed regioselec-tive “ligation” of azides and terminal alkynes. Angew. Chem. Int. Ed.Engl. 41, 2596–2599
35. Sieber, S. A., Niessen, S., Hoover, H. S., and Cravatt, B. F. (2006) Pro-teomic profiling of metalloprotease activities with cocktails of active-siteprobes. Nat. Chem. Biol. 2, 274–281
36. Saxon, E., and Bertozzi, C. R. (2000) Cell surface engineering by a modifiedStaudinger reaction. Science 287, 2007–2010
37. Kiick, K. L., Saxon, E., Tirrell, D. A., and Bertozzi, C. R. (2002) Incorporationof azides into recombinant proteins for chemoselective modification bythe Staudinger ligation. Proc. Natl. Acad. Sci. U. S. A. 99, 19–24
38. Sawa, M., Hsu, T. L., Itoh, T., Sugiyama, M., Hanson, S. R., Vogt, P. K., andWong, C. H. (2006) Glycoproteomic probes for fluorescent imaging offucosylated glycans in vivo. Proc. Natl. Acad. Sci. U. S. A. 103,12371–12376
39. Hsu, T. L., Hanson, S. R., Kishikawa, K., Wang, S. K., Sawa, M., and Wong,C. H. (2007) Alkynyl sugar analogs for the labeling and visualization ofglycoconjugates in cells. Proc. Natl. Acad. Sci. U. S. A. 104, 2614–2619
40. Sun, D., Yu, L. X., Hussain, M. A., Wall, D. A., Smith, R. L., and Amidon,G. L. (2004) In vitro testing of drug absorption for drug ‘developability’assessment: forming an interface between in vitro preclinical data andclinical outcome. Curr. Opin. Drug Discov. Dev. 7, 75–85
41. Imai, T. (2006) Human carboxylesterase isozymes: catalytic properties andrational drug design. Drug Metab. Pharmacokinet. 21, 173–185
42. Hood, J. L., Brooks, W. H., and Roszman, T. L. (2004) Differential compart-mentalization of the calpain/calpastatin network with the endoplasmicreticulum and Golgi apparatus. J. Biol. Chem. 279, 43126–43135
43. Goulet, B., Baruch, A., Moon, N. S., Poirier, M., Sansregret, L. L., Erickson,A., Bogyo, M., and Nepveu, A. (2004) A cathepsin L isoform that is devoidof a signal peptide localizes to the nucleus in S phase and processes theCDP/Cux transcription factor. Mol. Cell 14, 207–219
44. Sadaghiani, A. M., Verhelst, S. H., Gocheva, V., Hill, K., Majerova, E.,Stinson, S., Joyce, J. A., and Bogyo, M. (2007) Design, synthesis, andevaluation of in vivo potency and selectivity of epoxysuccinyl-basedinhibitors of papain-family cysteine proteases. Chem. Biol. 14, 499–511
45. Everley, P. A., Gartner, C. A., Haas, W., Saghatelian, A., Elias, J. E., Cravatt,B. F., Zetter, B. R., and Gygi, S. P. (2007) Assessing enzyme activitiesusing stable isotope labeling and mass spectrometry. Mol. Cell. Pro-teomics 6, 1771–1777
46. Casida, J. E., and Quistad, G. B. (2005) Serine hydrolase targets of organ-ophosphorus toxicants. Chem.-Biol. Interact 157–158, 277–283
47. Rosenblum, J. S., and Kozarich, J. W. (2003) Prolyl peptidases: a serineprotease subfamily with high potential for drug discovery. Curr. Opin.Chem. Biol. 7, 496–504
48. Gass, J., and Khosla, C. (2007) Prolyl endopeptidases. CMLS Cell. Mol. LifeSci. 64, 345–355
49. Rawlings, N. D., Morton, F. R., and Barrett, A. J. (2006) MEROPS: thepeptidase database. Nucleic Acids Res. 34, D270–D272
In-cell Selectivity Profiling of Serine Protease Inhibitors
Molecular & Cellular Proteomics 7.7 1253
by guest on April 10, 2019
http://ww
w.m
cponline.org/D
ownloaded from