in-cylinder pressure measurement and...
TRANSCRIPT
Engine Testing and Instrumentation 1
In-Cylinder Pressure Measurement and Analysis
Engine Testing and Instrumentation 2
Purposes of In-Cylinder Pressure Measurement
• Monitor max combustion pressure
• IMEP measurement
• Knock analysis
• Cycle-to-cycle variation
• Heat release analysis
• Ignition timing (ignition delay)
Engine Testing and Instrumentation 3
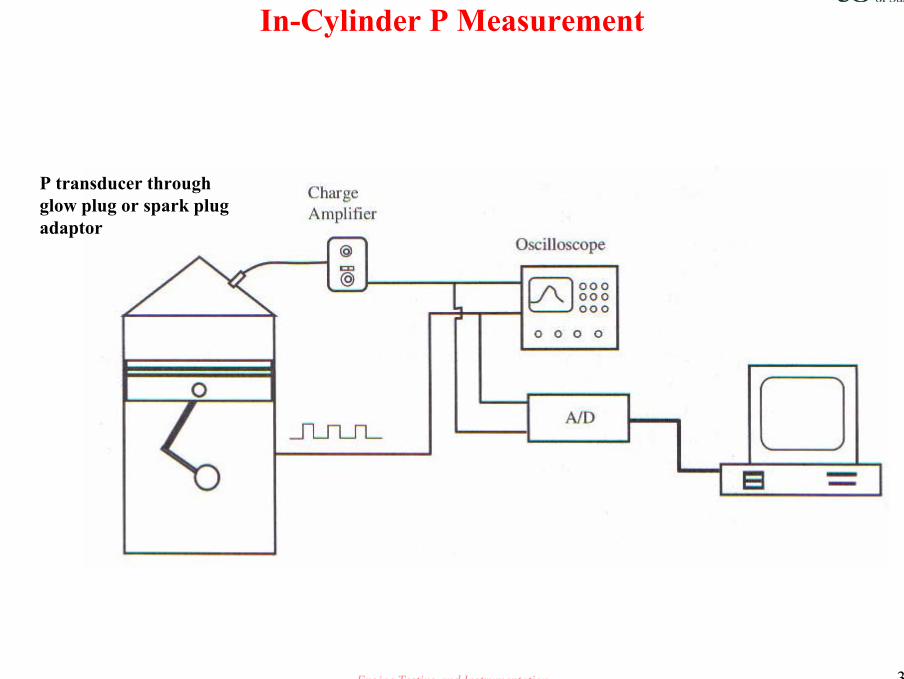
In-Cylinder P Measurement
P transducer through glow plug or spark plug adaptor
Engine Testing and Instrumentation 4
Max Pressure Monitor
• Design limit
• For total peak power
Engine Testing and Instrumentation 5
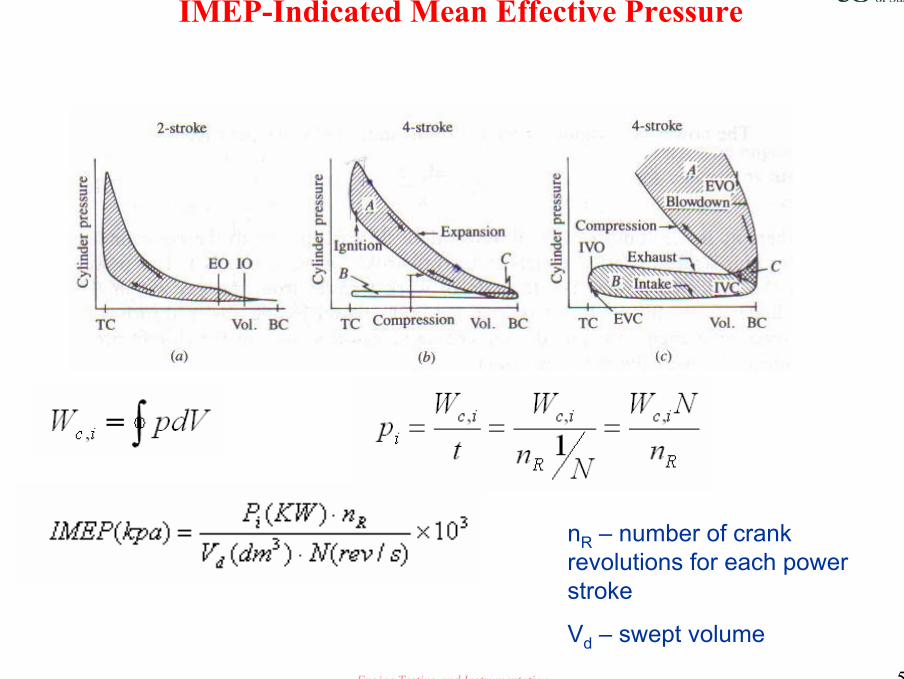
IMEP-Indicated Mean Effective Pressure
nR – number of crank revolutions for each power stroke
Vd – swept volume
Engine Testing and Instrumentation 6
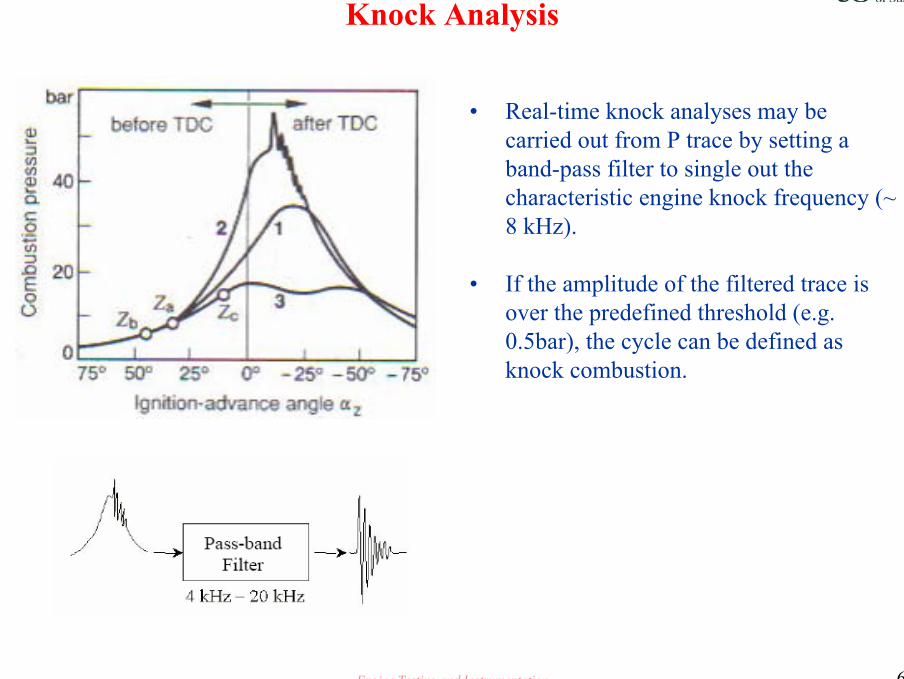
Knock Analysis
• Real-time knock analyses may be carried out from P trace by setting a band-pass filter to single out the characteristic engine knock frequency (~ 8 kHz).
• If the amplitude of the filtered trace is over the predefined threshold (e.g. 0.5bar), the cycle can be defined as knock combustion.
Engine Testing and Instrumentation 7
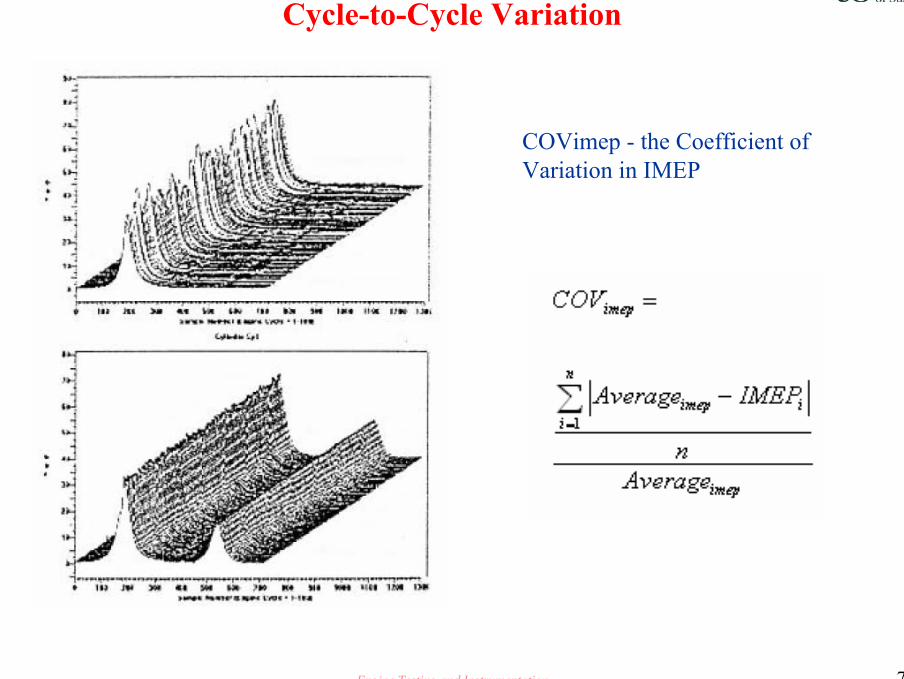
Cycle-to-Cycle Variation
COVimep - the Coefficient of Variation in IMEP
Engine Testing and Instrumentation 8
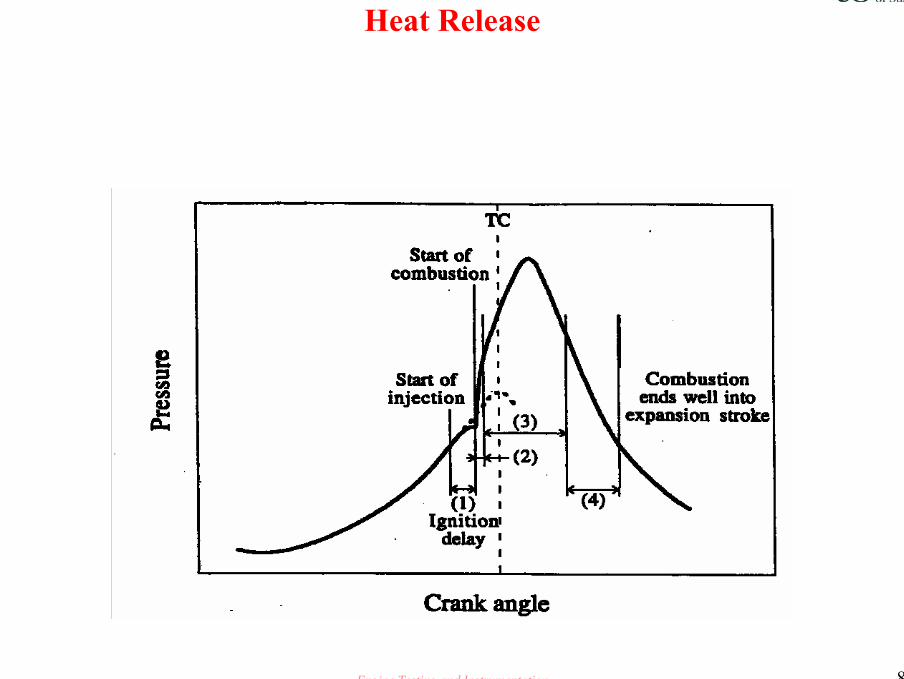
Heat Release
Engine Testing and Instrumentation 9
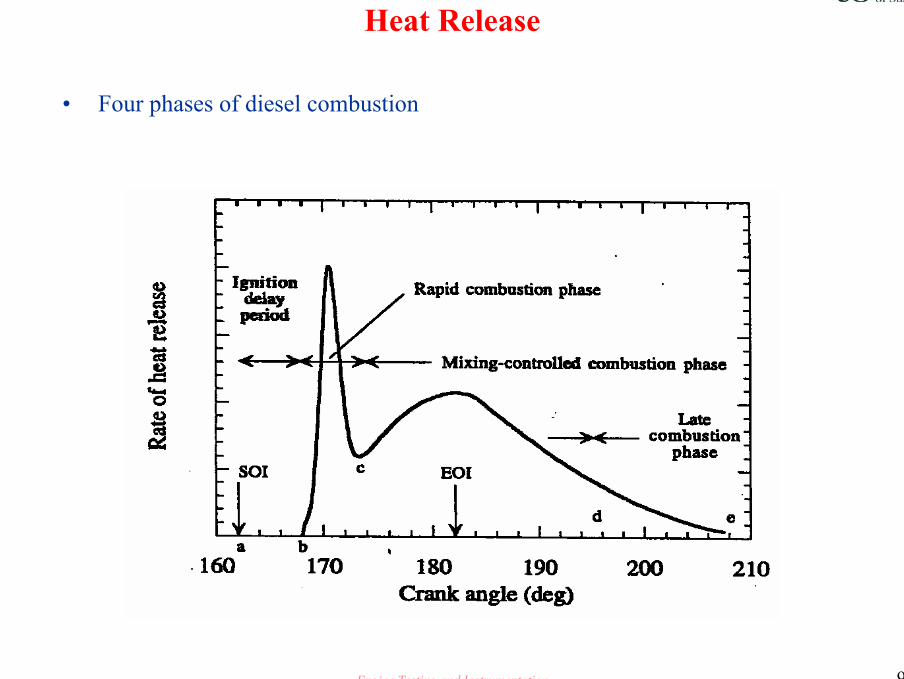
Heat Release
• Four phases of diesel combustion
Engine Testing and Instrumentation 10
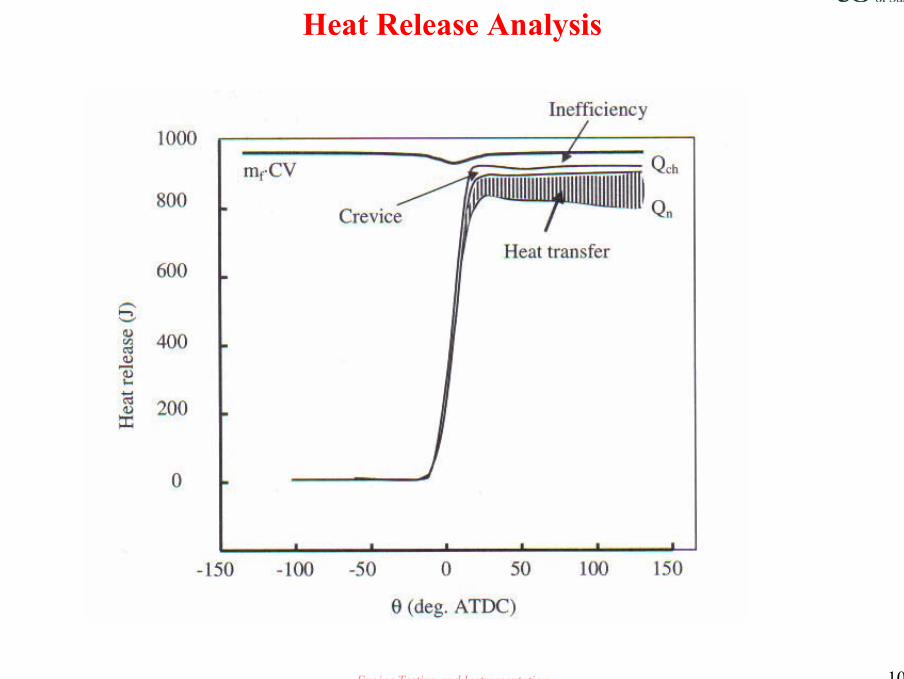
Heat Release Analysis
Engine Testing and Instrumentation 11
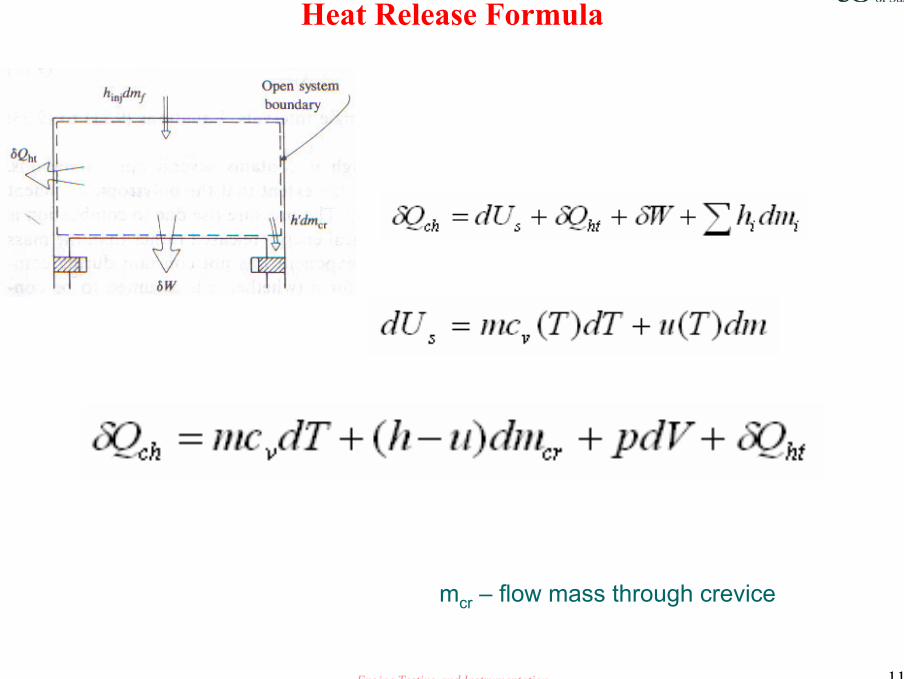
Heat Release Formula
mcr – flow mass through crevice
Engine Testing and Instrumentation 12
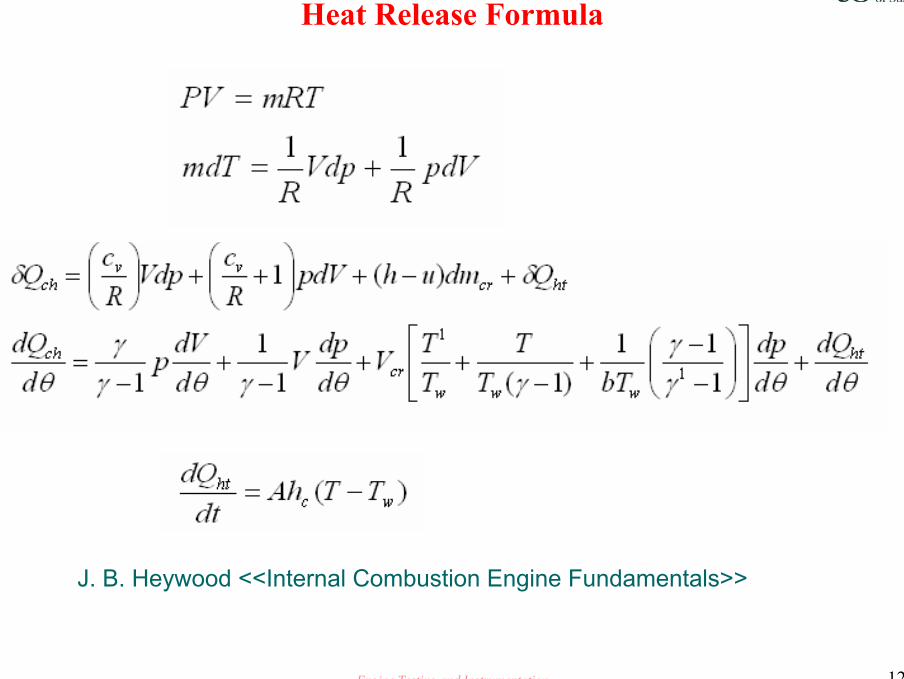
Heat Release Formula
J. B. Heywood <<Internal Combustion Engine Fundamentals>>
Engine Testing and Instrumentation 13
Ignition Timing
• Ignition delay for diesel and SI ignition engines
• Auto-ignition timing for HCCI

Engine Testing and Instrumentation 14
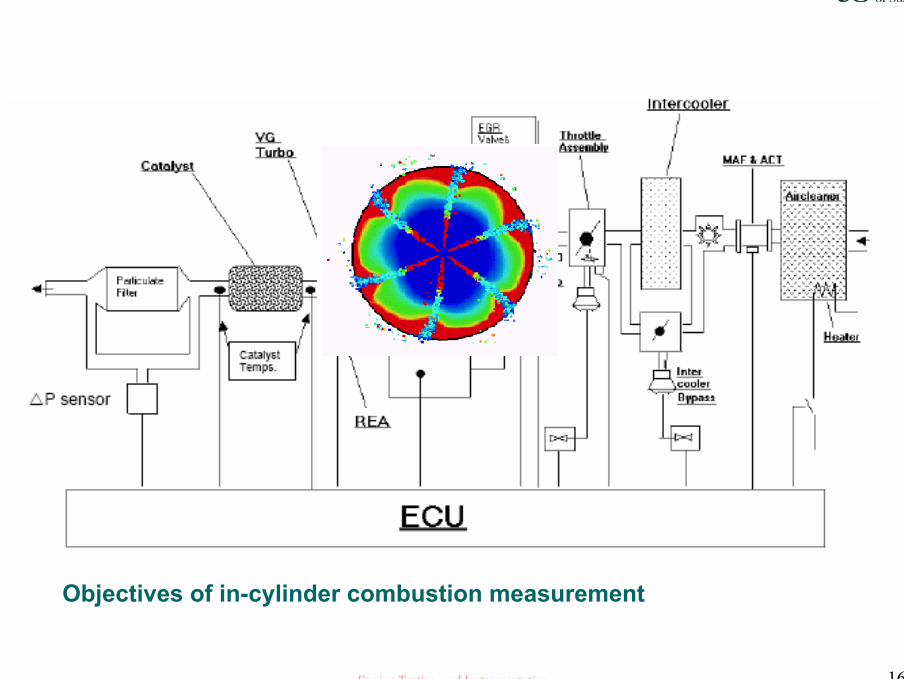
Objectives of in-cylinder combustion measurement

Engine Testing and Instrumentation 15
Objectives of in-cylinder combustion measurement
Engine Testing and Instrumentation 16
Objectives of in-cylinder combustion measurement
Engine Testing and Instrumentation 17
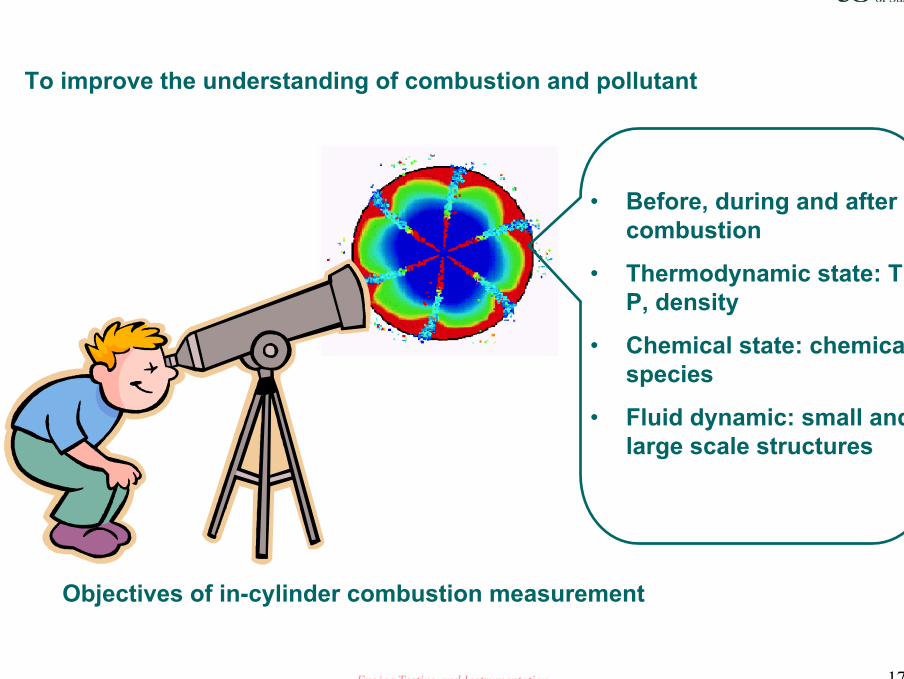
• Before, during and after combustion
• Thermodynamic state: T, P, density
• Chemical state: chemical species
• Fluid dynamic: small and large scale structures
Objectives of in-cylinder combustion measurement
To improve the understanding of combustion and pollutant
Engine Testing and Instrumentation 18
Methods of in-cylinder combustion measurement
• Physical probes: in-cyl pressure, fast gas sampling valve, FID
• Optical diagnostics:
• Classical: direct photography, absorption and emission spectroscopy, schlieren/shadowgraphy
• Modern diagnostics: LDV, PIV, laser particle sizer, LIF, Raman scattering, Rayleigh Scattering…
Engine Testing and Instrumentation 19
In-cylinder flow field measurement
• Introduction• LDA/LDV – Laser Doppler Anemometry/Velocimetry• PIV – Particle Image Velocimetry• Summary
Engine Testing and Instrumentation 20
Introduction
• In-cylinder flow plays a vital role for mixture formation and combustion performance, particularly for direct injection engines (GDI, Diesel).
• Both large scale fluid motion (swirl and tumble flows) and small scale turbulent flow field are employed in the optimization of combustion and emissions.
• In-cylinder flow measurement are important for the detailed study of fundamental in-cylinder flow processes and their interaction with combustion.
• The control of in-cylinder flow is achieved primarily through the design inlet ports, the cylinder head and piston crown geometry.
• CFD predictions always require experimental validation in new application.
Engine Testing and Instrumentation 21
Possible measurement methods for in-cylinder flow
• Single point:
Hot-Wire Anemometry (HWA): continuous records, not flow direction, needs careful calibration
LDA/LDV: non-intrusive, independent of fluid properties, seeding needed
• Whole field (2D, seeding needed, instantaneous record, cycle resolved):
Particle Tracking Velocimetry (PTW): high speed imaging
PIV: high spatial resolution
Engine Testing and Instrumentation 22
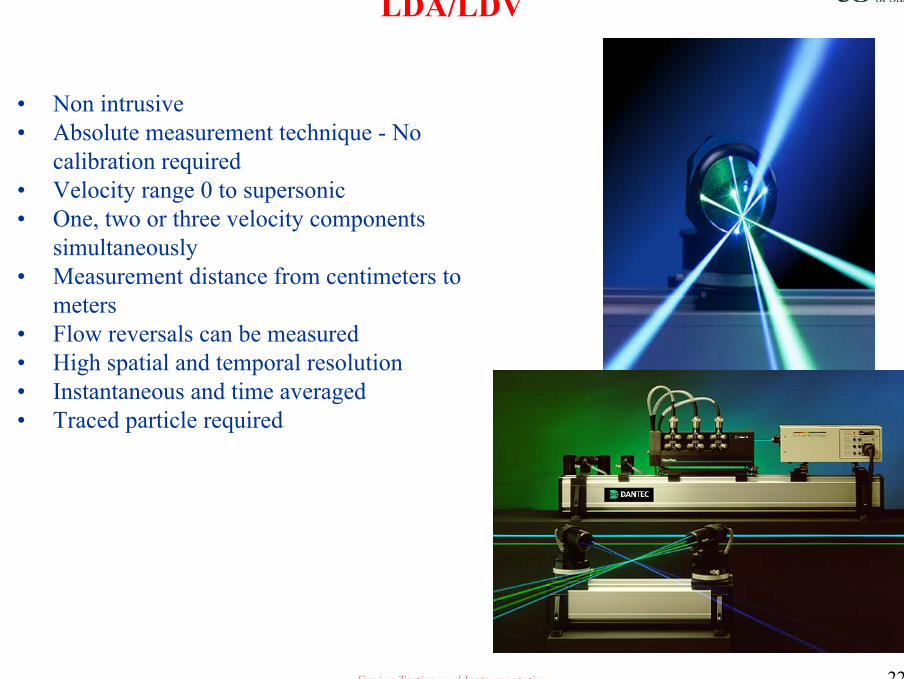
LDA/LDV
• Non intrusive • Absolute measurement technique - No
calibration required • Velocity range 0 to supersonic • One, two or three velocity components
simultaneously • Measurement distance from centimeters to
meters • Flow reversals can be measured • High spatial and temporal resolution • Instantaneous and time averaged • Traced particle required
Engine Testing and Instrumentation 23
LDA
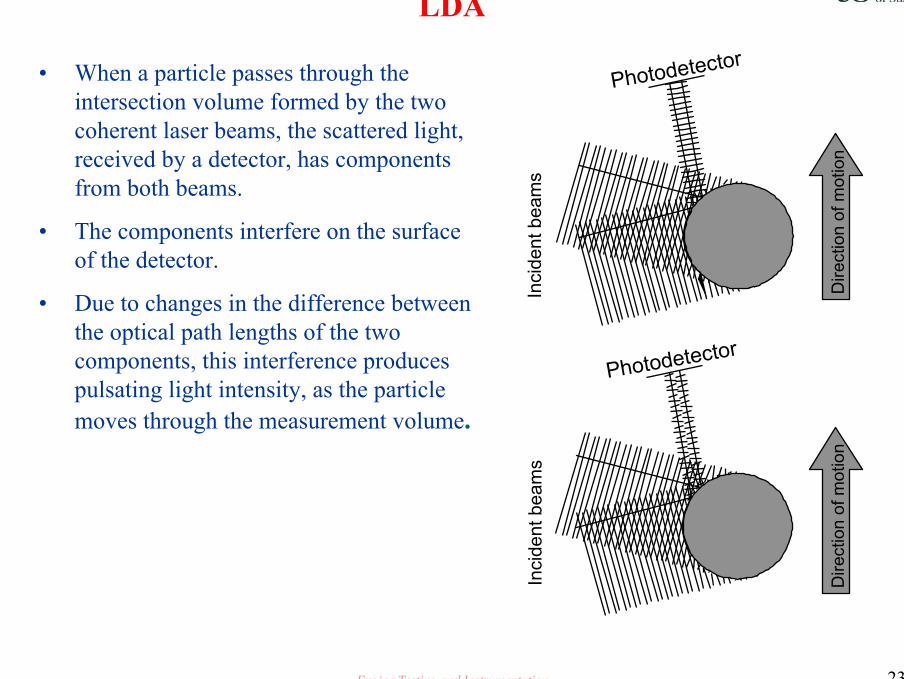
• When a particle passes through the intersection volume formed by the two coherent laser beams, the scattered light, received by a detector, has components from both beams.
• The components interfere on the surface of the detector.
• Due to changes in the difference between the optical path lengths of the two components, this interference produces pulsating light intensity, as the particle moves through the measurement volume.
Photodetector
Inci
dent
bea
ms
Dire
ctio
n of
mot
ion
Inci
dent
bea
ms
Photodetector
Dire
ctio
n of
mot
ion

Engine Testing and Instrumentation 24
LDA/LDV
Flow with particles
d (known)
Velocity = distance/time
t (measured)
Signal
Time
LaserBraggCell backscattered light
measuring volume
Detector
Processor
Principle

Engine Testing and Instrumentation 25
LDA
• Focused laser beams intersect and form the measurement volume
• Plane wave fronts: beam waist in the plane of intersection
• Interference in the plane of intersection• Pattern of bright and dark stripes/planes

Engine Testing and Instrumentation 26
LDA
Dantec System
Engine Testing and Instrumentation 27
LDA
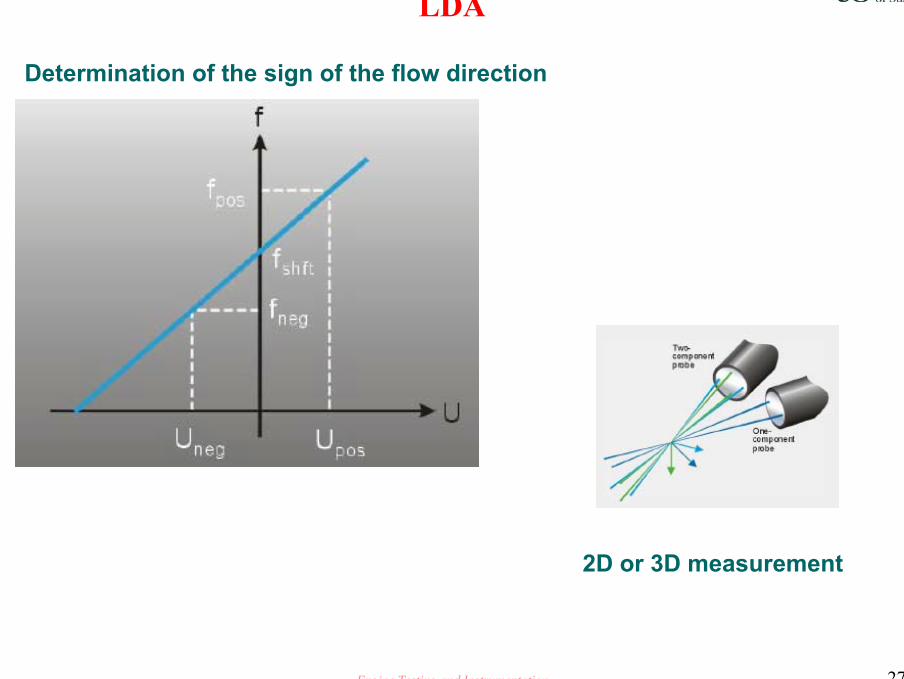
Determination of the sign of the flow direction
2D or 3D measurement

Engine Testing and Instrumentation 28
LDA
LDV Measurement in a production engine – using fiber probe
Engine Testing and Instrumentation 29

Engine Testing and Instrumentation 30
Seeding particles
• Liquids often contain sufficient natural seeding, whereas gases must be seeded in most cases.
• Ideally, the particles should be small enough to follow the flow, yet large enough to scatter sufficient light to obtain a good signal-to-noise ratio at the photo-detector output.
• Typically the size range of particles is between 1 um and 10 um. The particle material can be solid (powder) or liquid (droplets).
Engine Testing and Instrumentation 31
Measurement considerations
• Seeding
• Laser beam arrangement
• Signal receiving and processing
• Data analysis
Engine Testing and Instrumentation 32
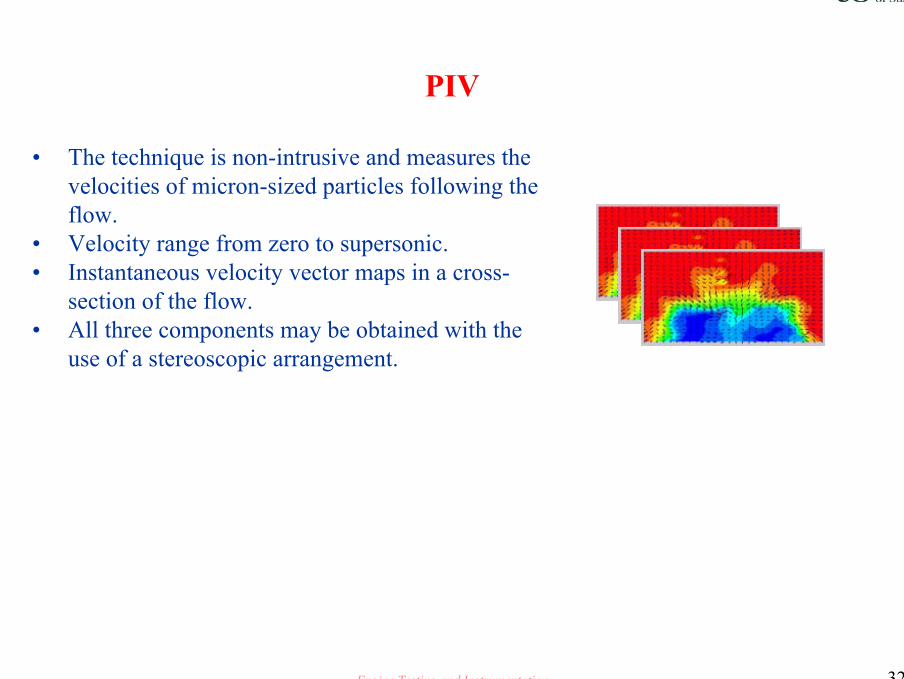
PIV
• The technique is non-intrusive and measures the velocities of micron-sized particles following the flow.
• Velocity range from zero to supersonic.• Instantaneous velocity vector maps in a cross-
section of the flow.• All three components may be obtained with the
use of a stereoscopic arrangement.
Engine Testing and Instrumentation 33
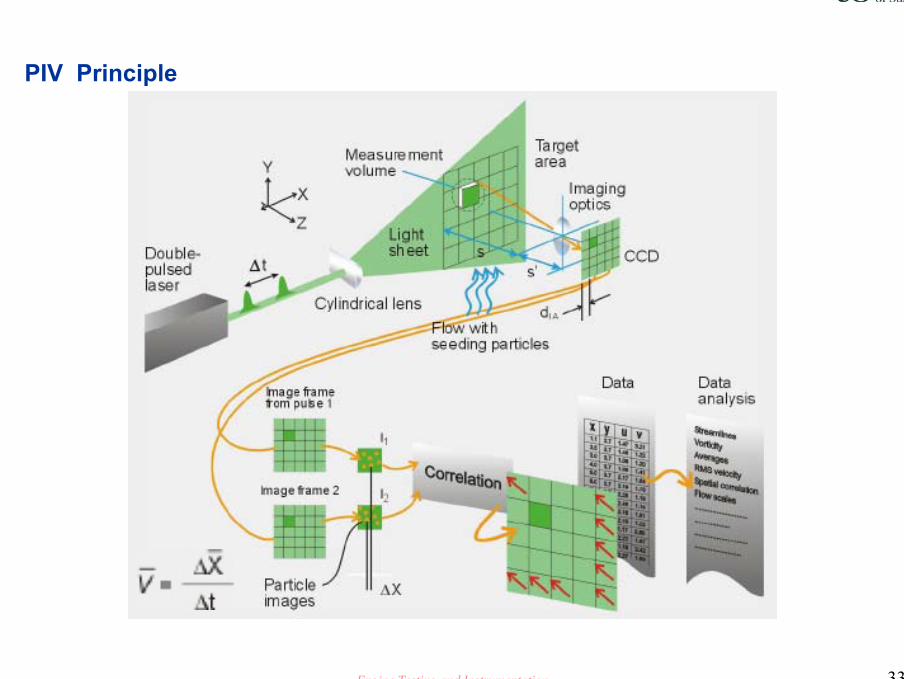
PIV Principle
Engine Testing and Instrumentation 34
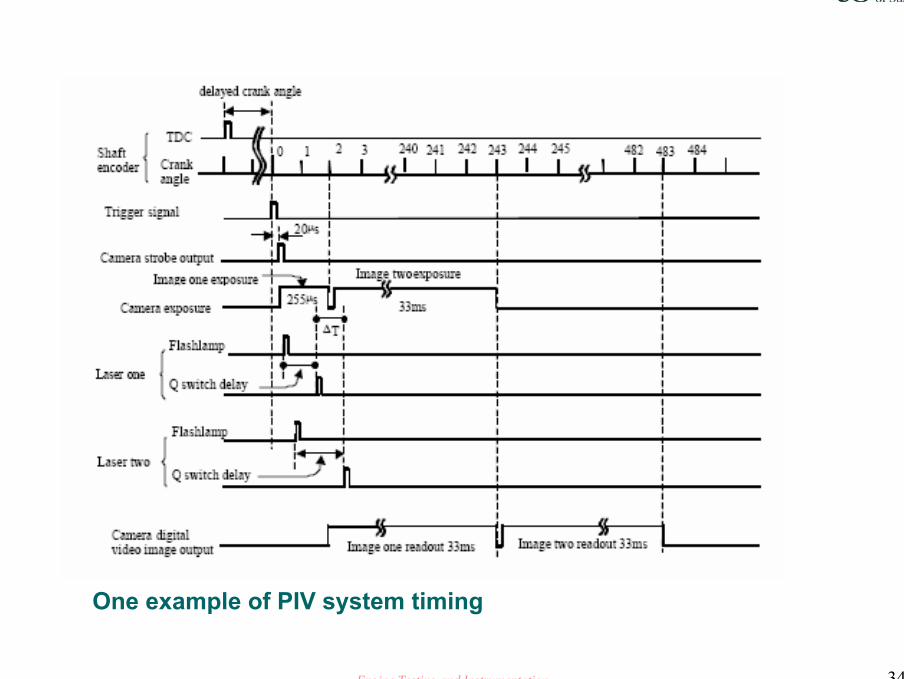
One example of PIV system timing

Engine Testing and Instrumentation 35
• The velocity vectors are derived from sub-sections of the target area of the particle-seeded flow by measuring the movement of particles between two light pulses
• The flow is illuminated in the target area with a light sheet.The camera lens images the target area onto the CCD array of a digital camera. The CCD is able to capture each light pulse in separate image frames.Once a sequence of two light pulses is recorded, the images are divided into small subsections called inter-rogation areas (IA). The interrogation areas from each image frame, I1 and I2, are cross-correlated with each other, pixel by pixel.
• The correlation produces a signal peak, identifying the common particle displacement, DX. An accurate measure of the displacement - and thus also the velocity - is achieved with sub-pixel interpolation.
Engine Testing and Instrumentation 36
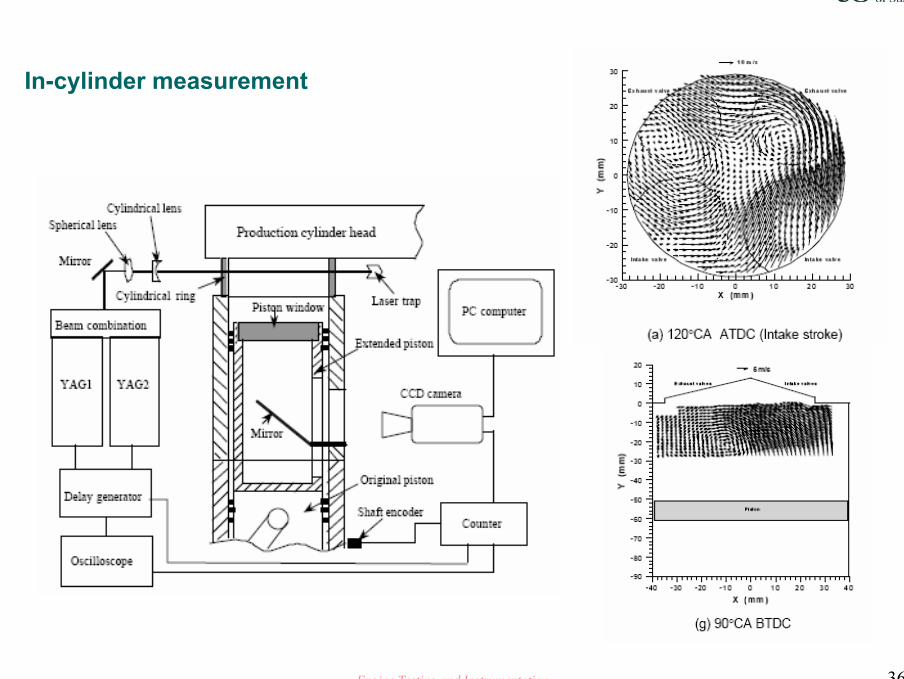
In-cylinder measurement
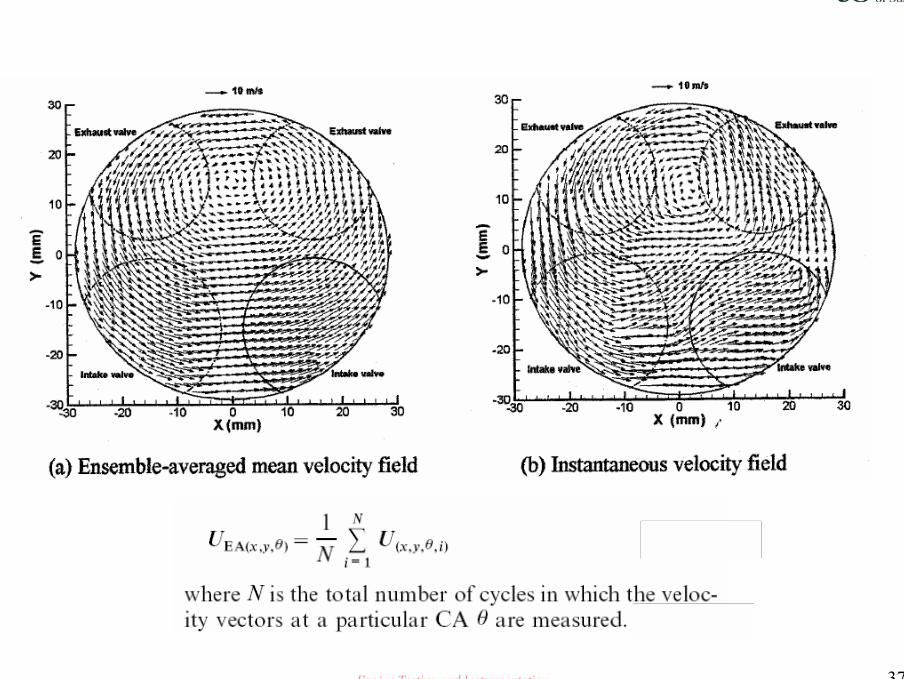
Engine Testing and Instrumentation 37
Engine Testing and Instrumentation 38
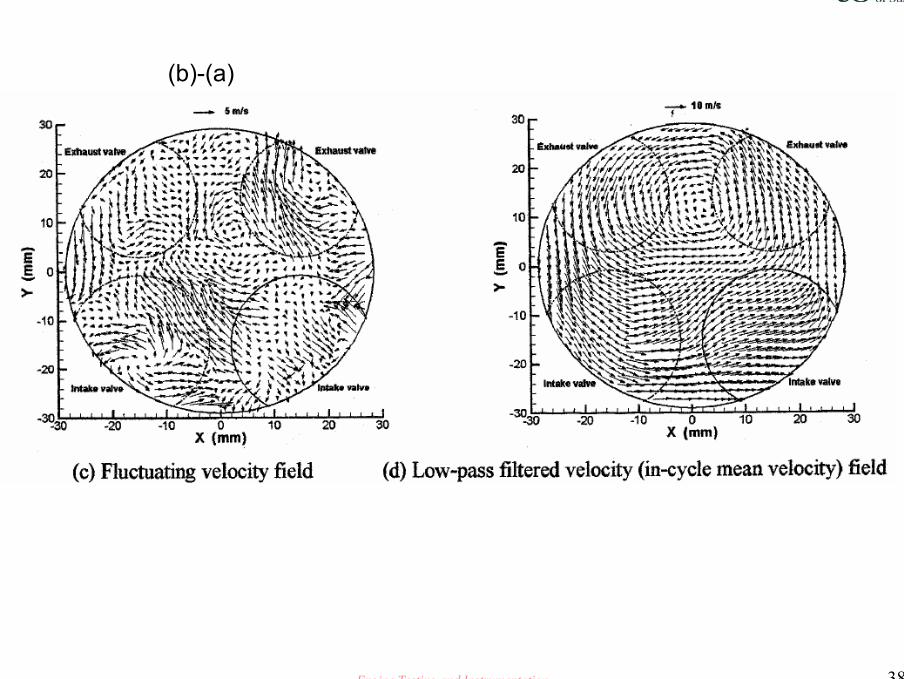
(b)-(a)

Engine Testing and Instrumentation 39
Engine Testing and Instrumentation 40
Engine Testing and Instrumentation 41
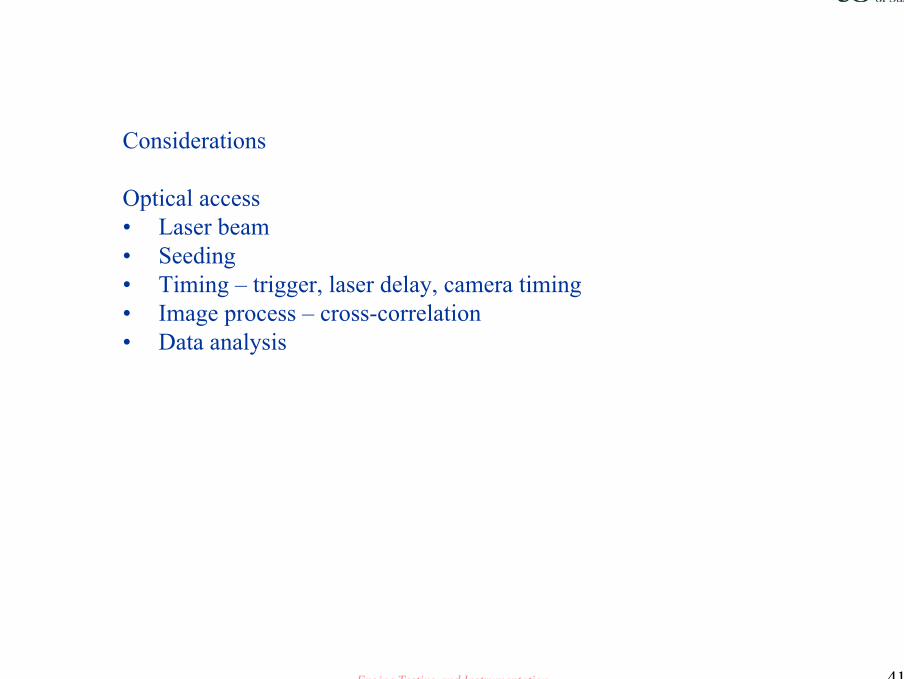
Considerations
Optical access• Laser beam• Seeding• Timing – trigger, laser delay, camera timing• Image process – cross-correlation• Data analysis
Engine Testing and Instrumentation 42
In-cylinder visualization and combustion analysis: before combustion II
• In-cylinder fuel and mixture measurement• Laser particle sizer based on Fraunhofer Diffraction Method• Fuel droplet sizing and velocity measurement by a Phase Doppler
Analyser (PDA)• 2D fuel distribution measurement by PLIF • Simultaneous visualisation of fuel vapour and liquid fuel by LIEF• summary
* Questionnaire for the course
In-cylinder visualization and combustion analysis: during and after combustion
Engine Testing and Instrumentation 43
Before Combustion IIIn-cylinder fuel and mixture measurement
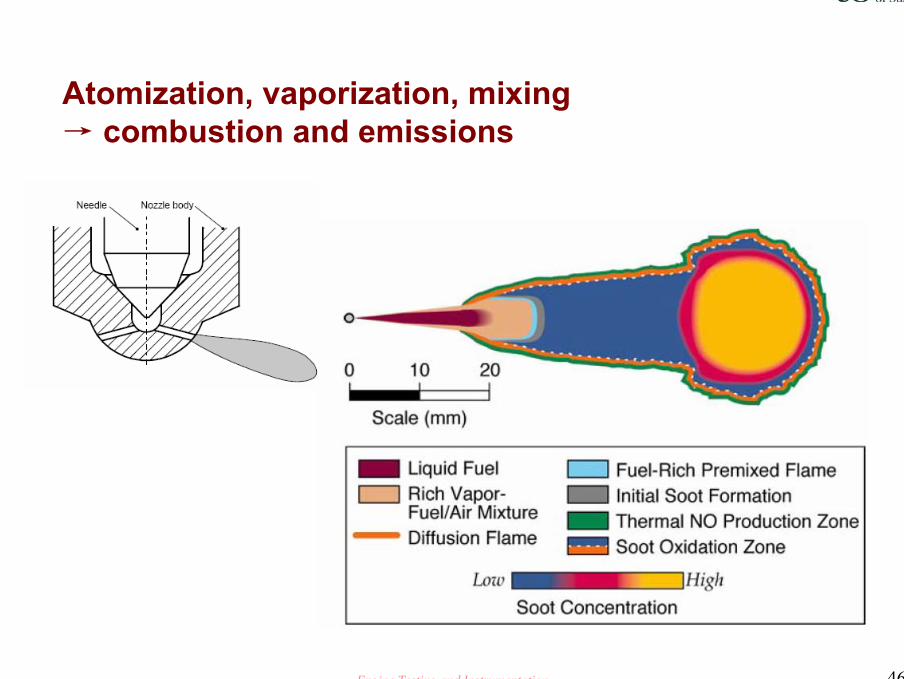
• From liquid fuel to air/fuel mixture which is suitable for combustion, there is a process including injection, automization, vaporization and mixing.
• Fuel atomization, vaporization and mixing process with air directly affect the engine combustion process and performance.
• Mixture preparation and mixture distribution information are important for understanding and optimizing combustion systems, particularly for GDI, diesel combustion, HCCI combustion.
• Fuel/Air ratio is also important for maintaining 3-way catalyst working condition.
Engine Testing and Instrumentation 44
• In-cylinder fuel measurement by FID (Flame Ionization Detector) and high-speed sampling valve
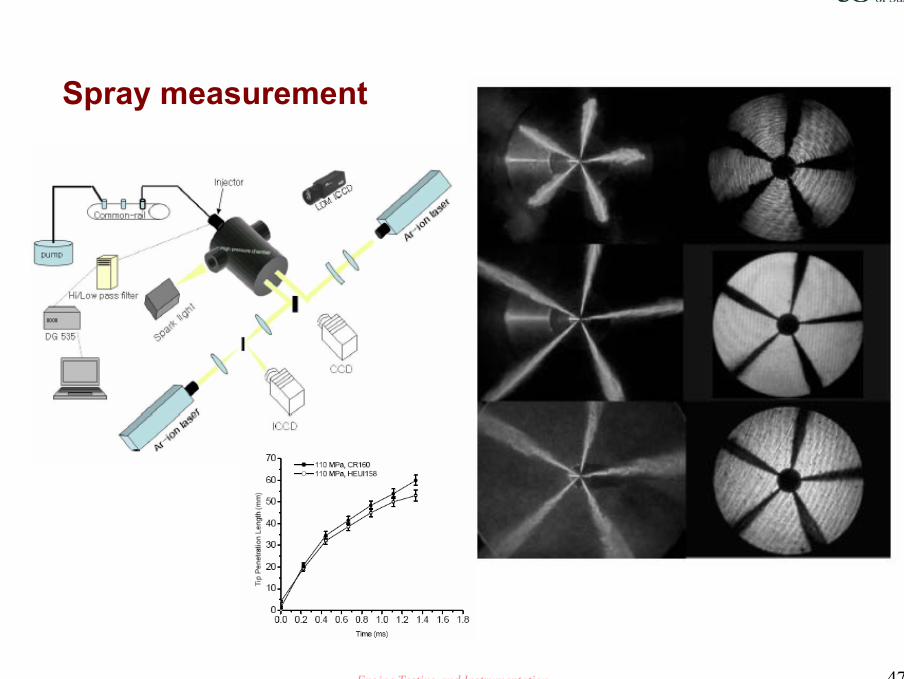
• Spray structure measurement by direct imaging methods or LIF
• Fuel droplet sizing by the Fraunhofer Diffraction Method
• Droplet sizing and velocity measurement by a PDA (Phase Doppler Analyser)
• Fuel droplet velocity measurement by LDV (air entrainment)
• 2D fuel distribution by PLIF (Planar Laser Induced Fluorescence)
• Simultaneous Visualisation of fuel vapour and liquid fuel by LIEF (Laser Induced Exciplex Fluorescence)
Possible methods
Engine Testing and Instrumentation 45
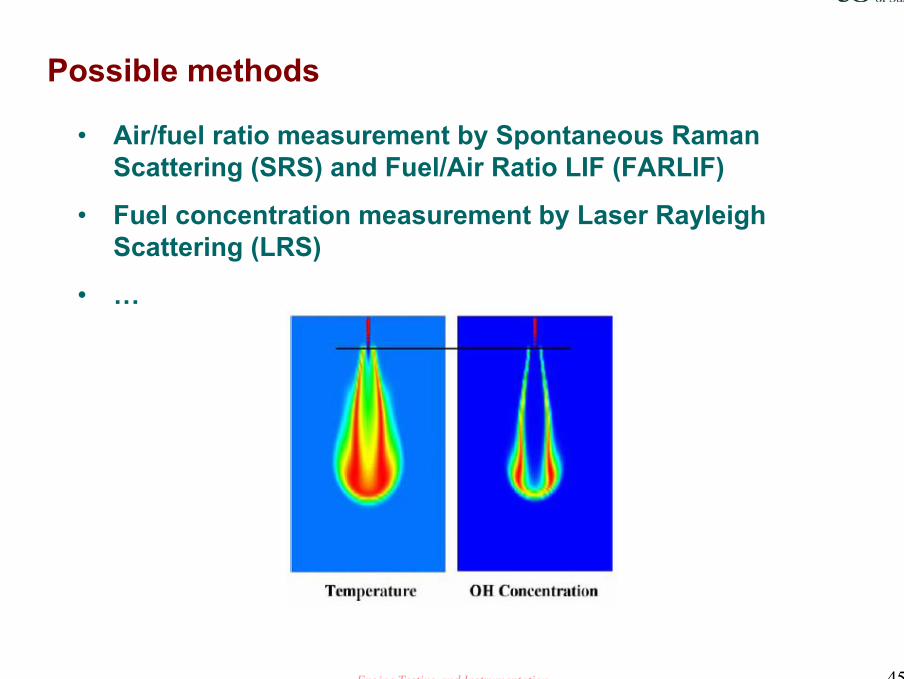
• Air/fuel ratio measurement by Spontaneous Raman Scattering (SRS) and Fuel/Air Ratio LIF (FARLIF)
• Fuel concentration measurement by Laser Rayleigh Scattering (LRS)
• …
Possible methods
Engine Testing and Instrumentation 46
Atomization, vaporization, mixing → combustion and emissions
Engine Testing and Instrumentation 47
Spray measurement
Engine Testing and Instrumentation 48
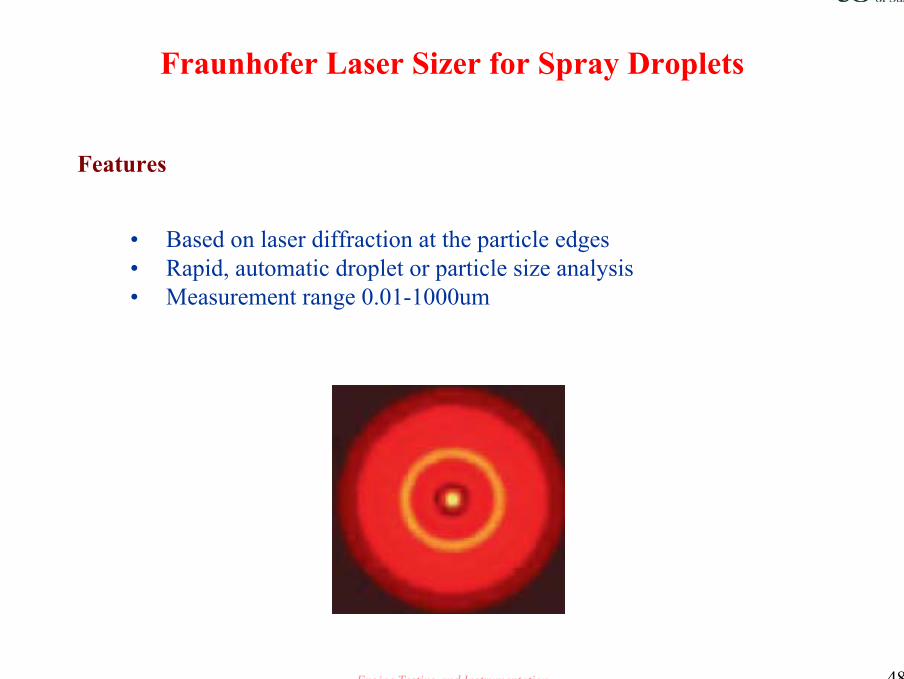
Fraunhofer Laser Sizer for Spray Droplets
• Based on laser diffraction at the particle edges• Rapid, automatic droplet or particle size analysis• Measurement range 0.01-1000um
Features
Engine Testing and Instrumentation 49
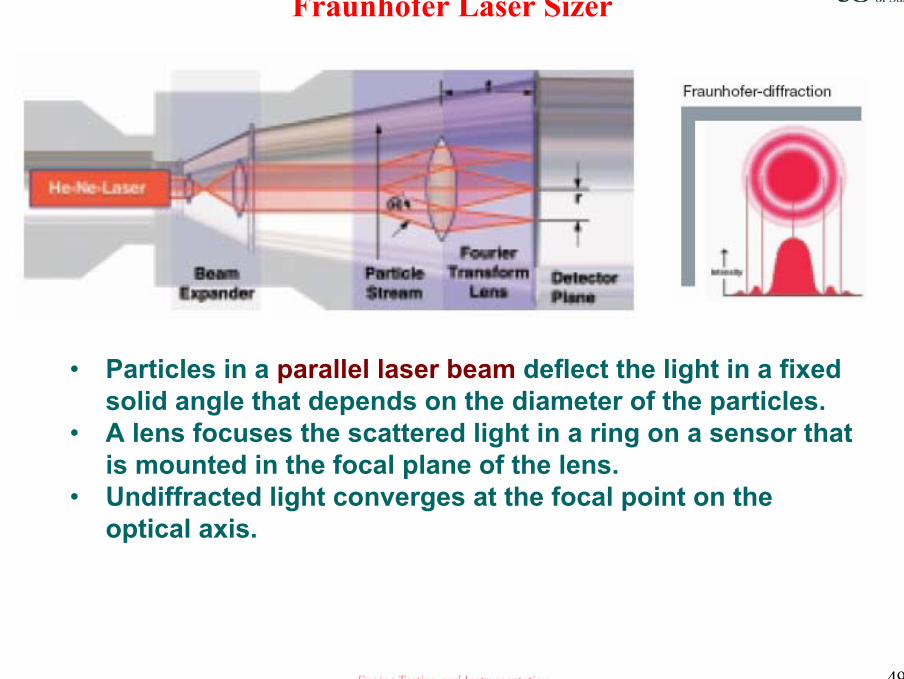
Fraunhofer Laser Sizer
• Particles in a parallel laser beam deflect the light in a fixed solid angle that depends on the diameter of the particles.
• A lens focuses the scattered light in a ring on a sensor that is mounted in the focal plane of the lens.
• Undiffracted light converges at the focal point on the optical axis.
Engine Testing and Instrumentation 50
Fraunhofer Laser Sizer• Applies only to fully opaque particles and small
diffraction angle.• If a light beam with a specific wavelength encounters a
particle, the particle performs electromagnetic oscillations in the same frequency as the stimulating light – regardless of the relationship of the light wavelength to the particle diameter and the refractive index of the particles and medium.
• The particle is tuned to the reception of specific wavelengths and re-emits the energy like a relay station within a defined spatial angle distribution.
• According to the theory, multiple oscillation states of varying probabilities are possible and there exists a relationship between the optically effective cross section and particle size, light wavelength and the refractive index of the particles and medium.
Engine Testing and Instrumentation 51
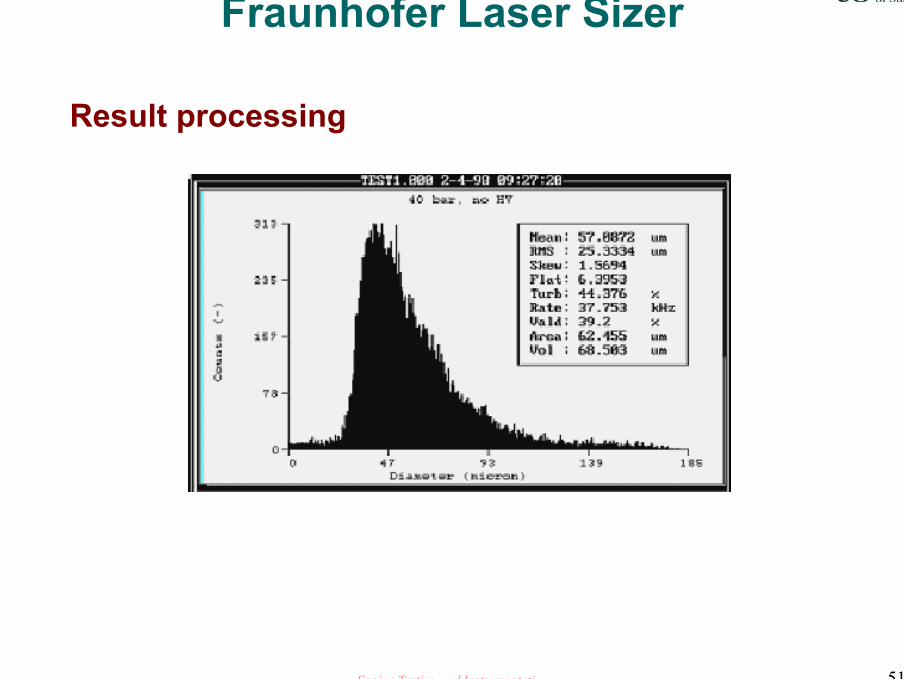
Fraunhofer Laser Sizer
Result processing
Engine Testing and Instrumentation 52
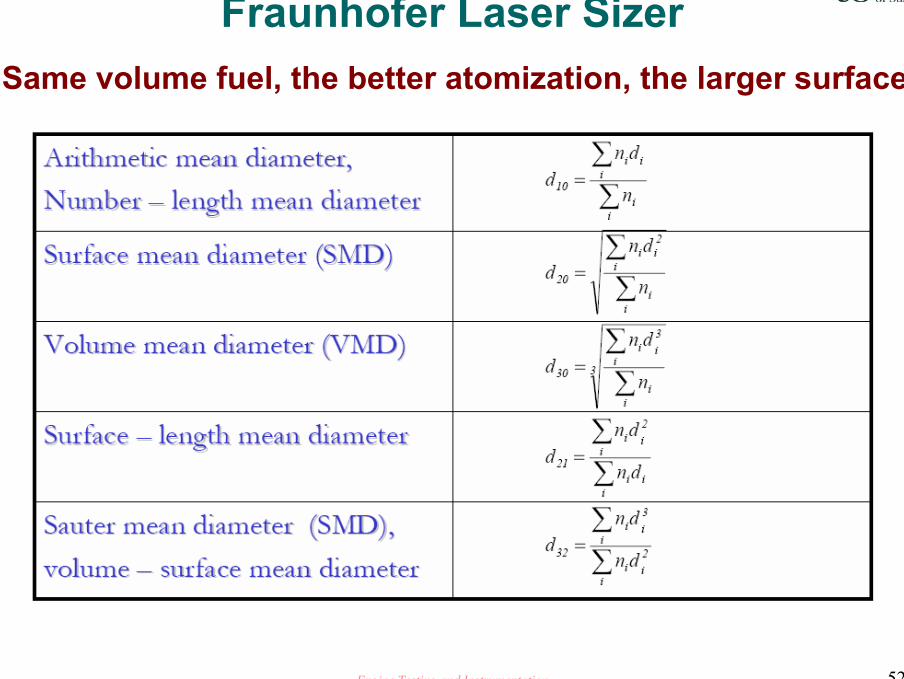
Fraunhofer Laser SizerSame volume fuel, the better atomization, the larger surface
Engine Testing and Instrumentation 53
Fraunhofer Laser Sizer
Considerations
• Optical access• Laser beam• Timing – trigger and delay• Data analysis
Engine Testing and Instrumentation 54
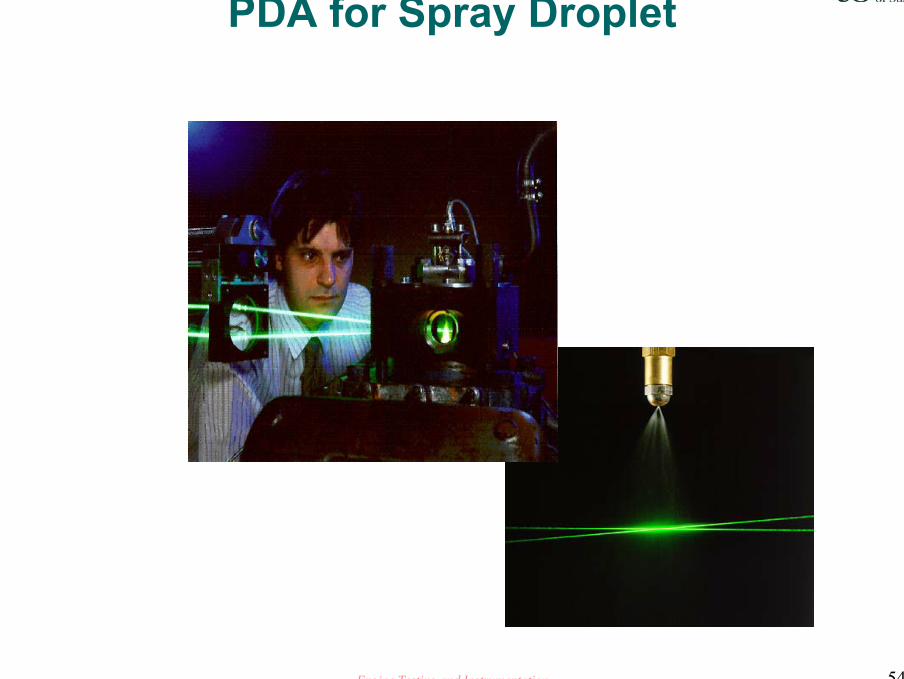
PDA for Spray Droplet
Engine Testing and Instrumentation 55
PDA
• Extension of the LDA principle• Simultaneous measurement of velocity (up to 3
components) and size of spherical particles as well as mass flux, concentration etc.
• Non-intrusive measurement (optical technique)• Absolute measurement technique (no
calibration required)• Very high accuracy• Very high spatial resolution (small measurement
volume)
General features
Engine Testing and Instrumentation 56
PDA
• Optical access to the measurement area (usually from two directions)
• Sphericity of particles (droplets, bubbles, solids)• Homogeneity of particle medium
(slight inhomogeneities may be tolerated if the concentration of the inhomogeneities is low and if the size of the inhomogeneities is much smaller than the wavelength used)
• Refractive indices of the particle and the continuous medium must usually be known
• Particle size between ca. 0.5 µm and several millimetres• Max. particle number concentration is limited
Preconditions for the application
Engine Testing and Instrumentation 57
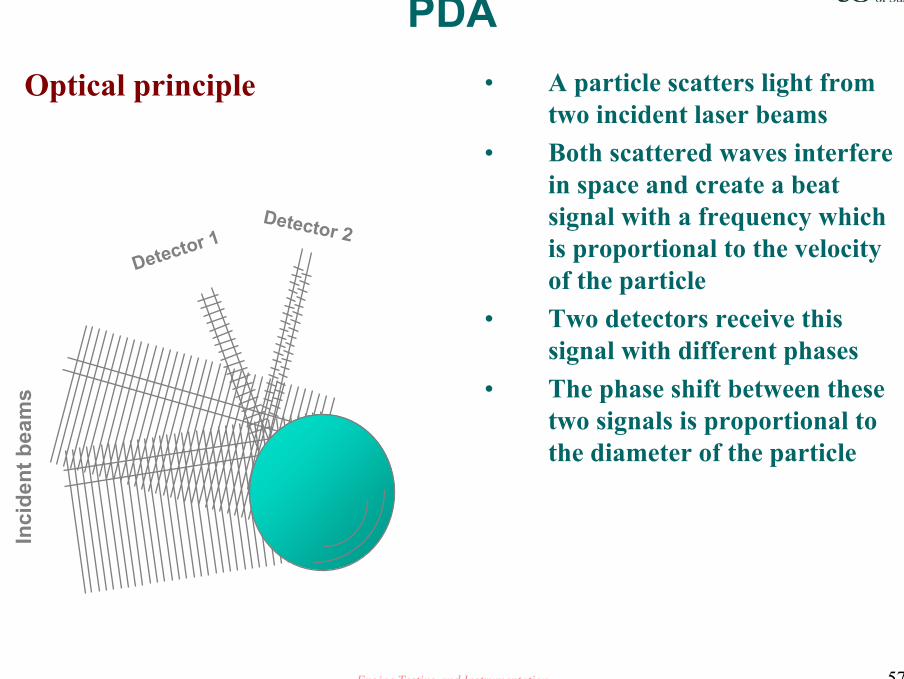
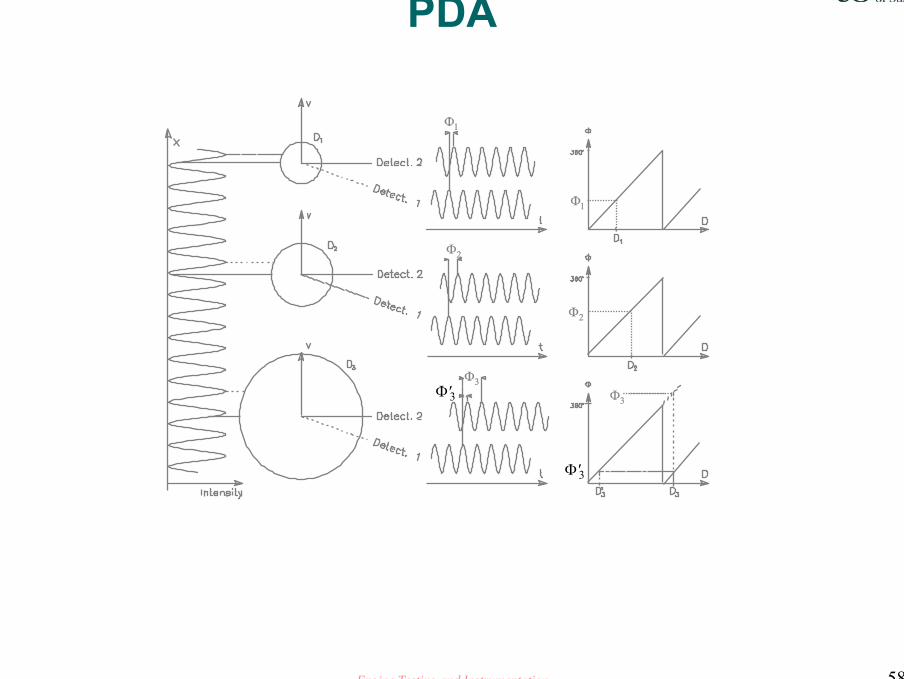
PDA• A particle scatters light from
two incident laser beams• Both scattered waves interfere
in space and create a beat signal with a frequency which is proportional to the velocity of the particle
• Two detectors receive this signal with different phases
• The phase shift between these two signals is proportional to the diameter of the particle
Inci
dent
bea
ms
Detector 1Detector 2
Optical principle
Engine Testing and Instrumentation 58
PDA
Φ1
Φ1
Φ2
Φ2
Φ3
Φ3
′Φ3
′Φ3
Engine Testing and Instrumentation 59
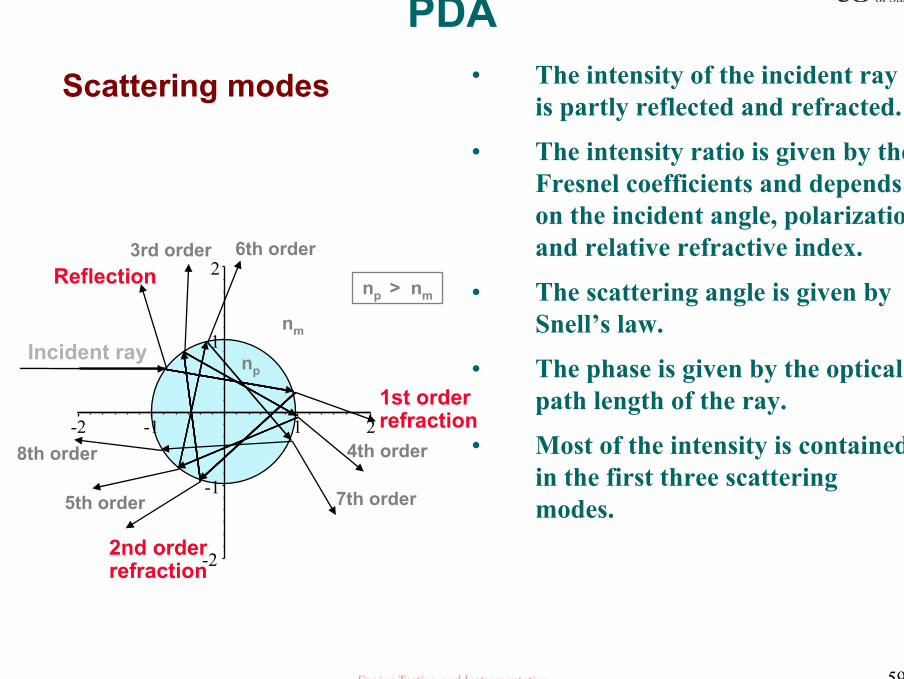
PDA• The intensity of the incident ray
is partly reflected and refracted.
• The intensity ratio is given by the Fresnel coefficients and depends on the incident angle, polarization and relative refractive index.
• The scattering angle is given by Snell’s law.
• The phase is given by the optical path length of the ray.
• Most of the intensity is contained in the first three scattering modes.
-2
1st order refraction
-1
1
2
-2 -1 1 2
Incident ray
Reflection
2nd orderrefraction
3rd order
4th order
5th order
6th order
7th order
8th order
np
nm
np > nm
Scattering modes

Engine Testing and Instrumentation 60
PDA
Light scattering by droplets and bubbles
-2
-1
1
2
-2 -1 1 2
-2
-1
1
2
-2 -1 1 2
Water droplet in air Air bubble in water
Engine Testing and Instrumentation 61
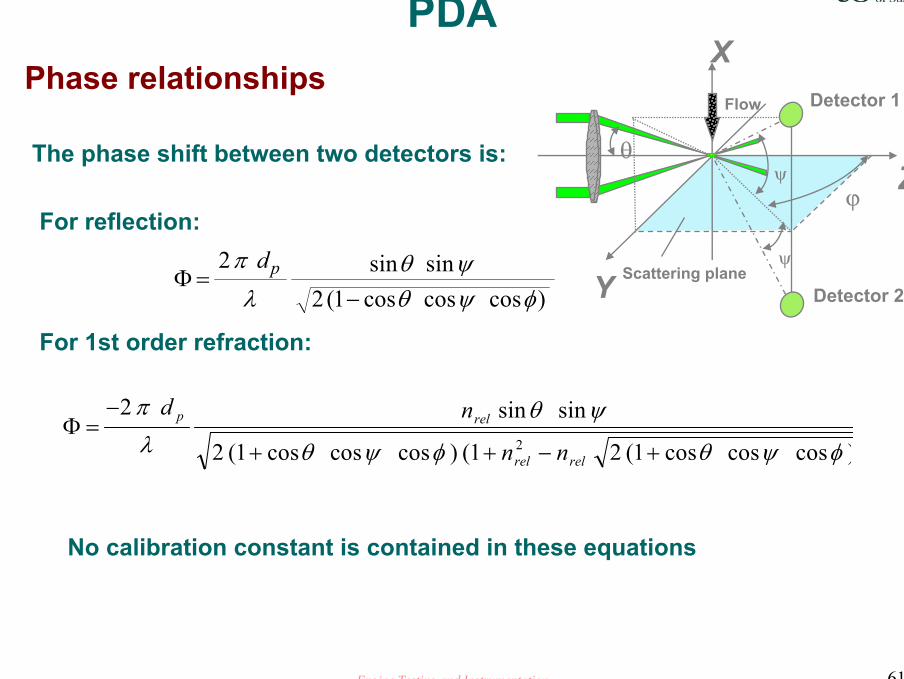
PDAPhase relationships
The phase shift between two detectors is:
Φ=−
22 1
π
λθ ψθ ψ φ
dp sin sin( cos cos cos )
For reflection:
For 1st order refraction:
Φ =−
+ + − +
2
2 1 1 2 12
πλ
θ ψ
θ ψ φ θ ψ φ
d n
n n
p rel
rel rel
sin sin
( cos cos cos ) ( ( cos cos cos )
No calibration constant is contained in these equations
X
Y
ϕ
Detector 1
Detector 2Scattering plane
Flow
Zθ
ψ
ψ
Engine Testing and Instrumentation 62
PDA
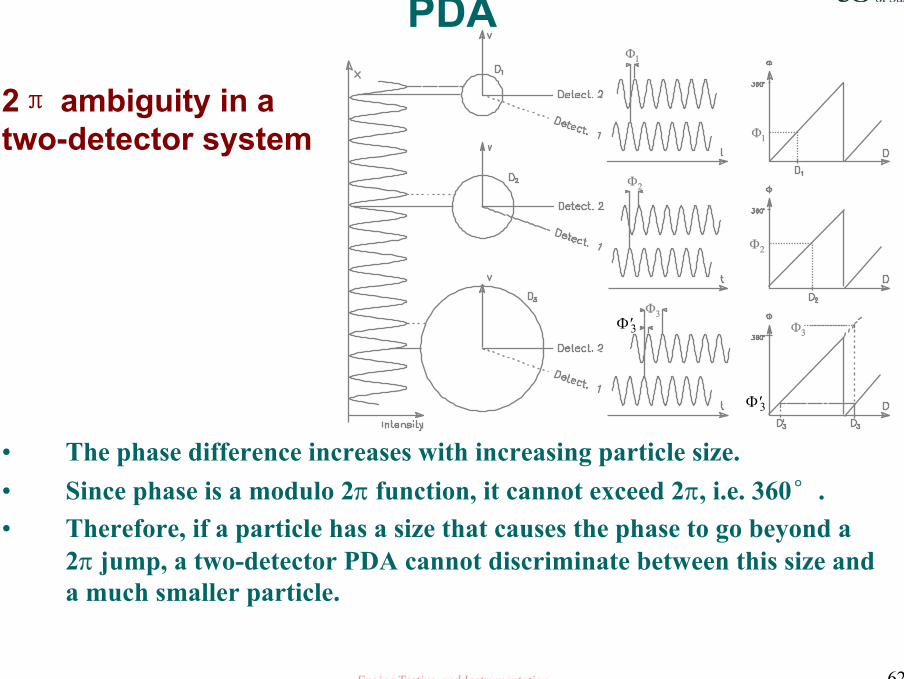
2π ambiguity in a two-detector system
• The phase difference increases with increasing particle size.• Since phase is a modulo 2π function, it cannot exceed 2π, i.e. 360°. • Therefore, if a particle has a size that causes the phase to go beyond a
2π jump, a two-detector PDA cannot discriminate between this size and a much smaller particle.
Φ1
Φ1
Φ2
Φ2
Φ3
Φ3
′Φ3
′Φ3

Engine Testing and Instrumentation 63
PDA3-detector set-up
• Overcoming the 2π ambiguity• Increasing the measurable size range• Maintaining a high measurement resolution
ψ
ϕ
Detector 1Detector 3
Detector 2
dmax
Φ
Φ1-2
Φ1-3
360°
0 ddmeas.
Φ 1-2 Φ 1-3
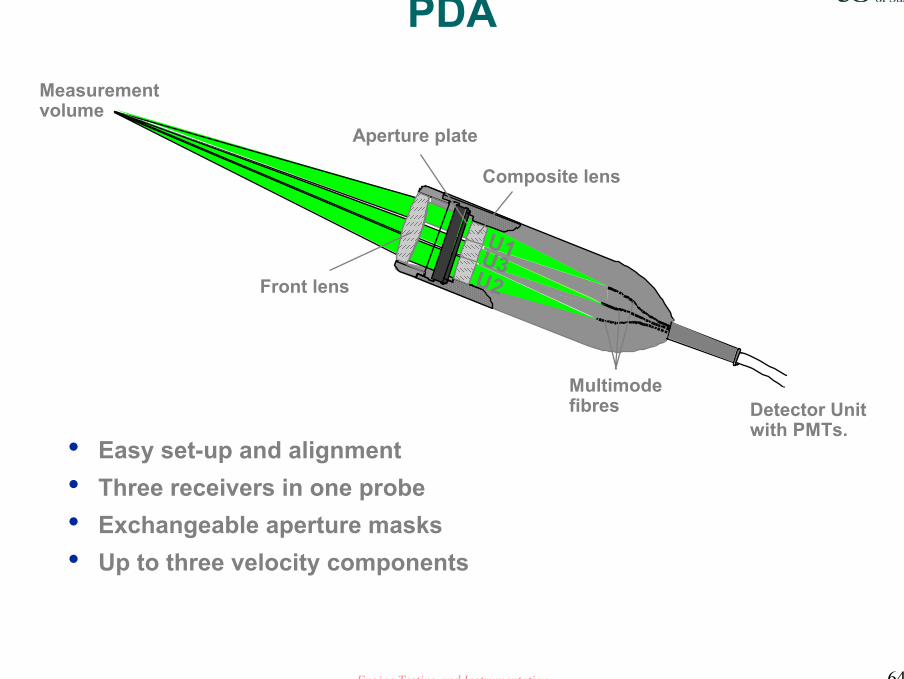
Engine Testing and Instrumentation 64
PDA
U1U2Front lens
Composite lens
Aperture plate
Measurementvolume
Multimodefibres Detector Unit
with PMTs.
U3
• Easy set-up and alignment• Three receivers in one probe• Exchangeable aperture masks• Up to three velocity components
Engine Testing and Instrumentation 65
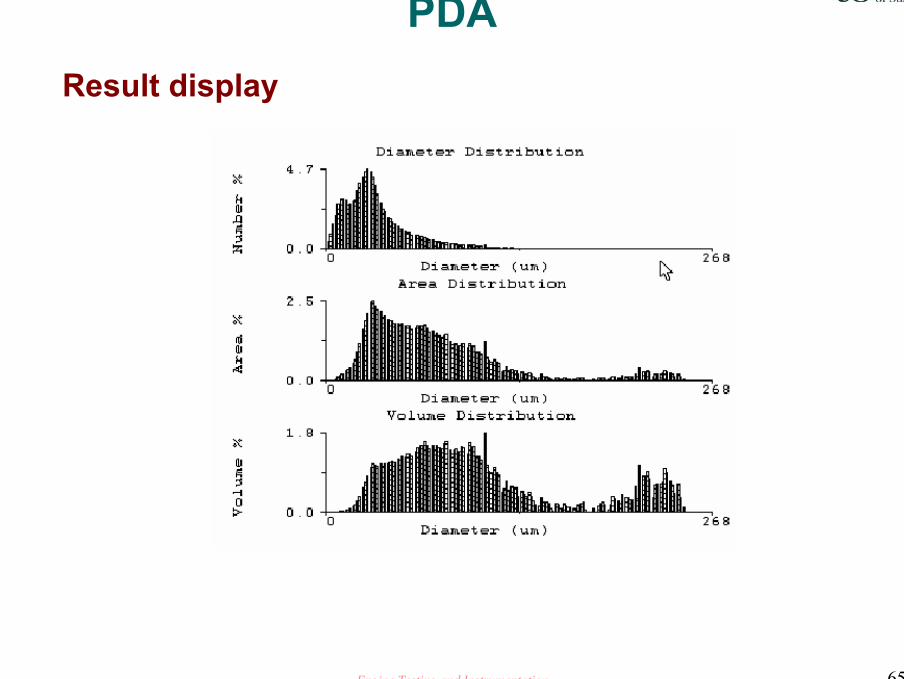
PDAResult display
Engine Testing and Instrumentation 66
PDA
• The temporal modulation is related to the velocity of the droplet, while the spatial frequency is related to the droplet size
Engine Testing and Instrumentation 67
LIF for Fuel Concentration
• 2D fuel concentration inside fuel spray or of in-cylinder air/fuel mixture
• Using fluorescence of fuel or fluorescent dopantexcited by a laser sheet
• LIF also available for other species concentration (NO, HC, O2…), and also available for in-cylinder temperature
• Specific wavelength laser is required for different measurement
Engine Testing and Instrumentation 68
LIF for Fuel Concentration
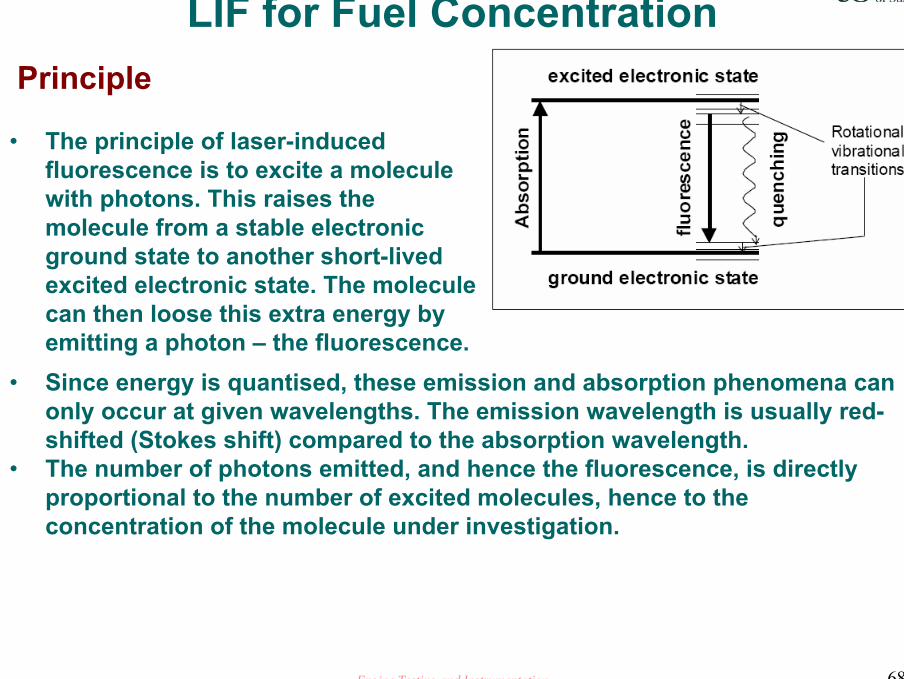
• Since energy is quantised, these emission and absorption phenomena can only occur at given wavelengths. The emission wavelength is usually red-shifted (Stokes shift) compared to the absorption wavelength.
• The number of photons emitted, and hence the fluorescence, is directly proportional to the number of excited molecules, hence to the concentration of the molecule under investigation.
• The principle of laser-induced fluorescence is to excite a molecule with photons. This raises the molecule from a stable electronic ground state to another short-lived excited electronic state. The molecule can then loose this extra energy by emitting a photon – the fluorescence.
Principle
Engine Testing and Instrumentation 69
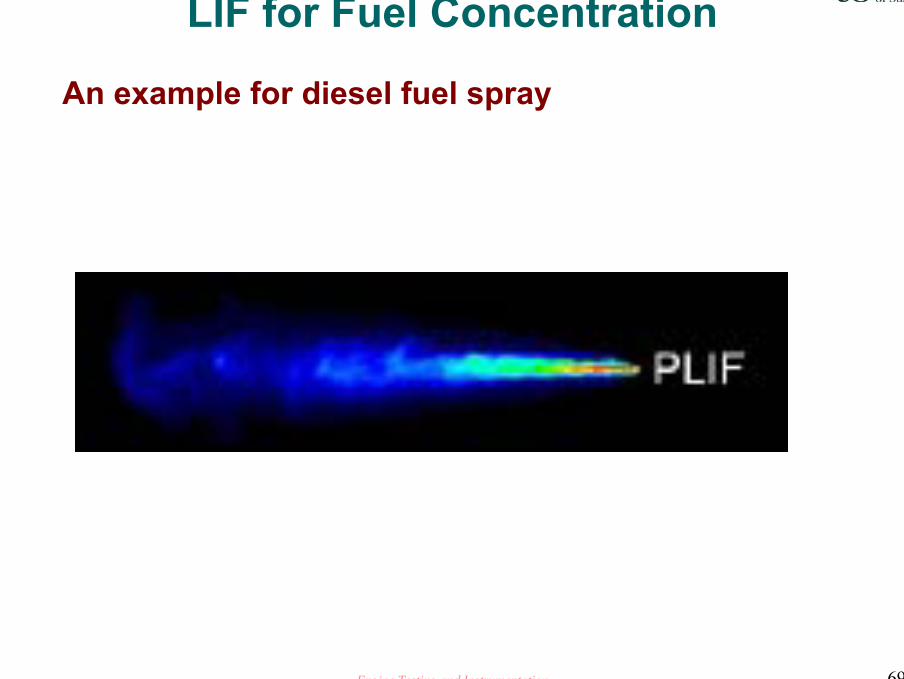
An example for diesel fuel spray
LIF for Fuel Concentration
Engine Testing and Instrumentation 70
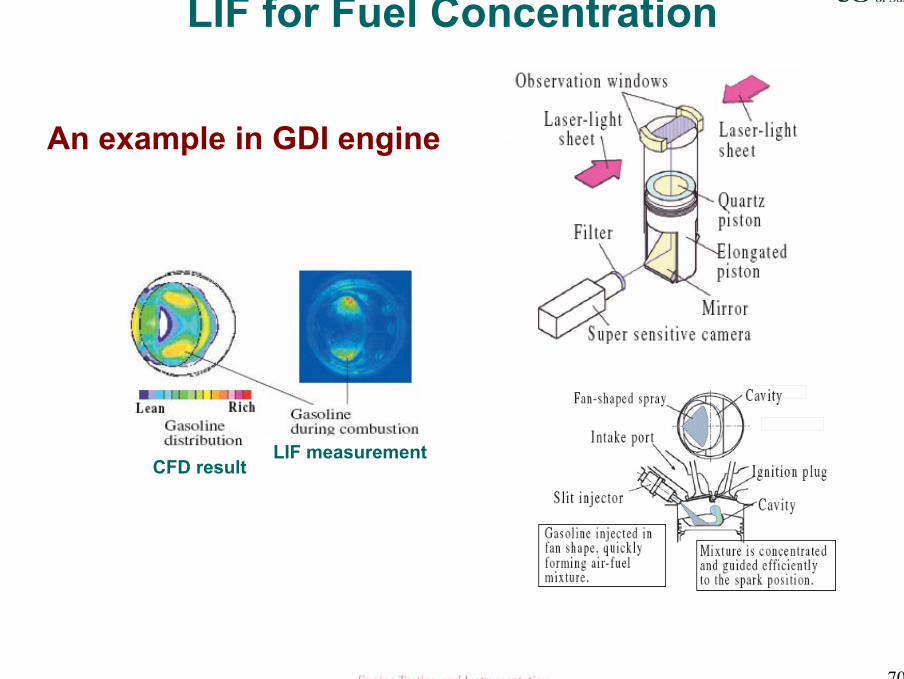
LIF for Fuel Concentration
LIF measurementCFD result
An example in GDI engine
Engine Testing and Instrumentation 71
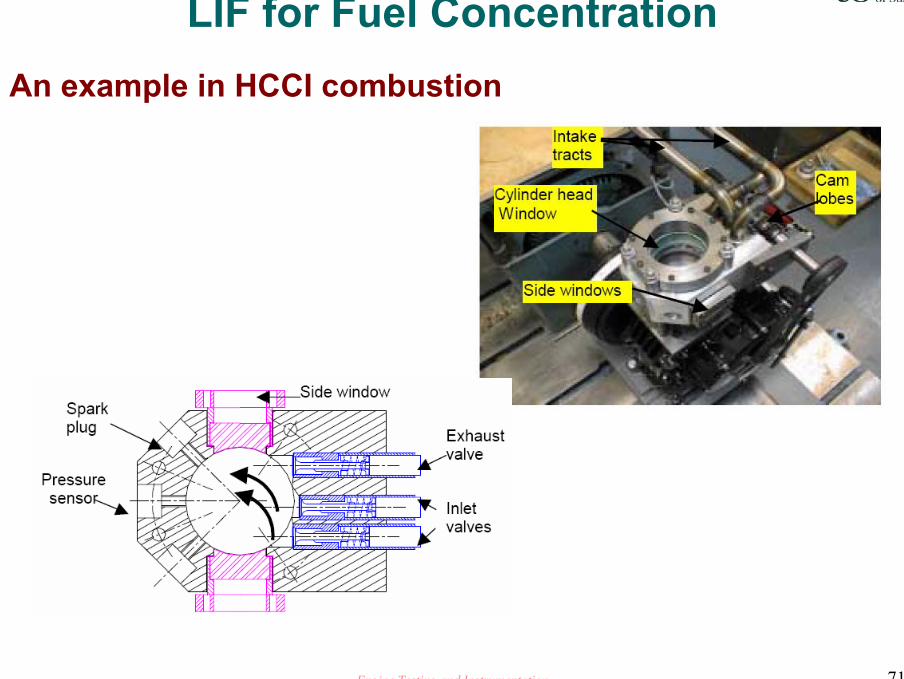
LIF for Fuel ConcentrationAn example in HCCI combustion
Engine Testing and Instrumentation 72
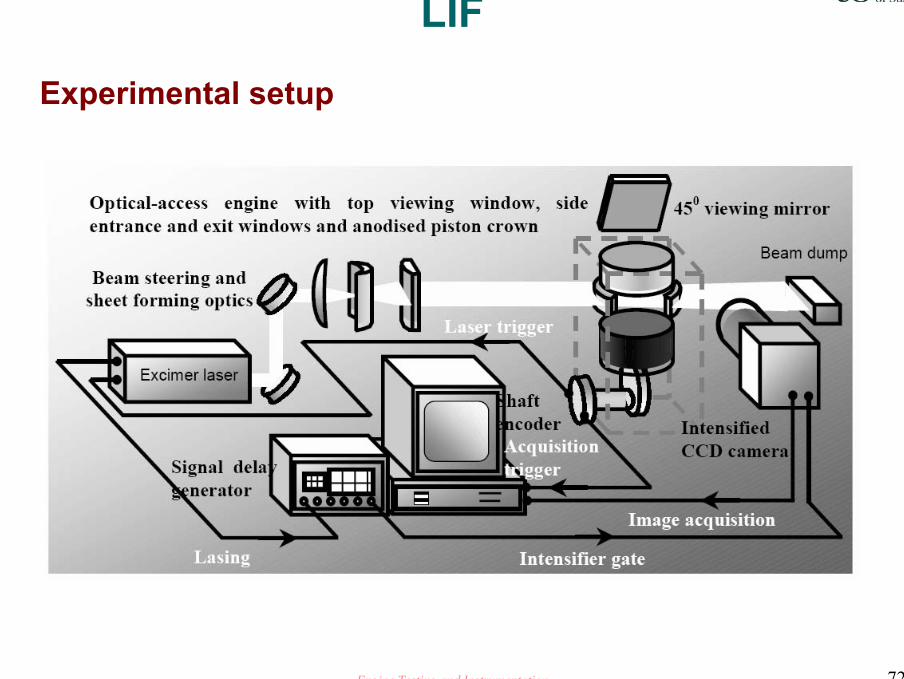
LIF
Experimental setup
Engine Testing and Instrumentation 73
LIF
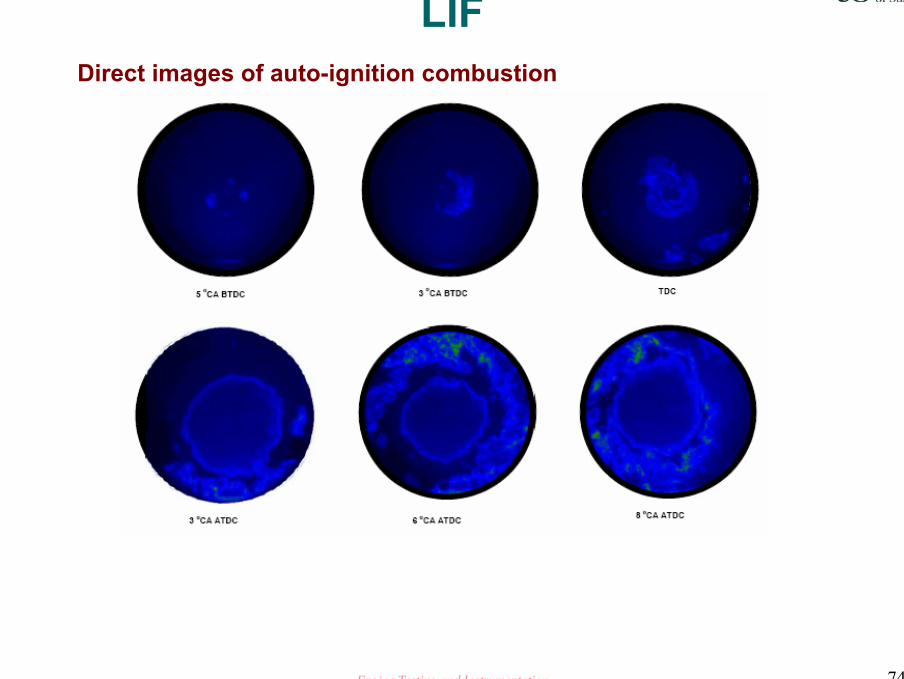
• 3-pentanone (fluorescence dopant) was added to iso-octane fuel and introduced as a premixed charge by means of the PFI injectors.
• A background image was recorded for each PLIF measurement, after the fuel injection had been switched off for a few seconds to allow any remaining fuel in the inlet tract to be completely purged.
Engine Testing and Instrumentation 74
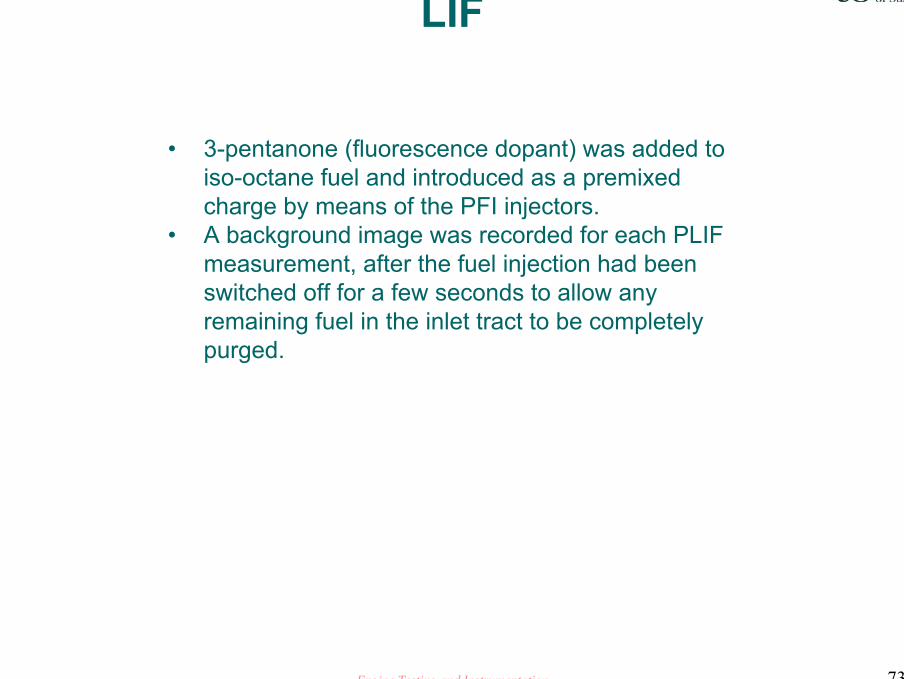
LIFDirect images of auto-ignition combustion

Engine Testing and Instrumentation 75
LIFPLIF images of fuel concentration distribution

Engine Testing and Instrumentation 76
LIFPLIF images of fuel concentration distribution and auto-ignition combustion
Engine Testing and Instrumentation 77
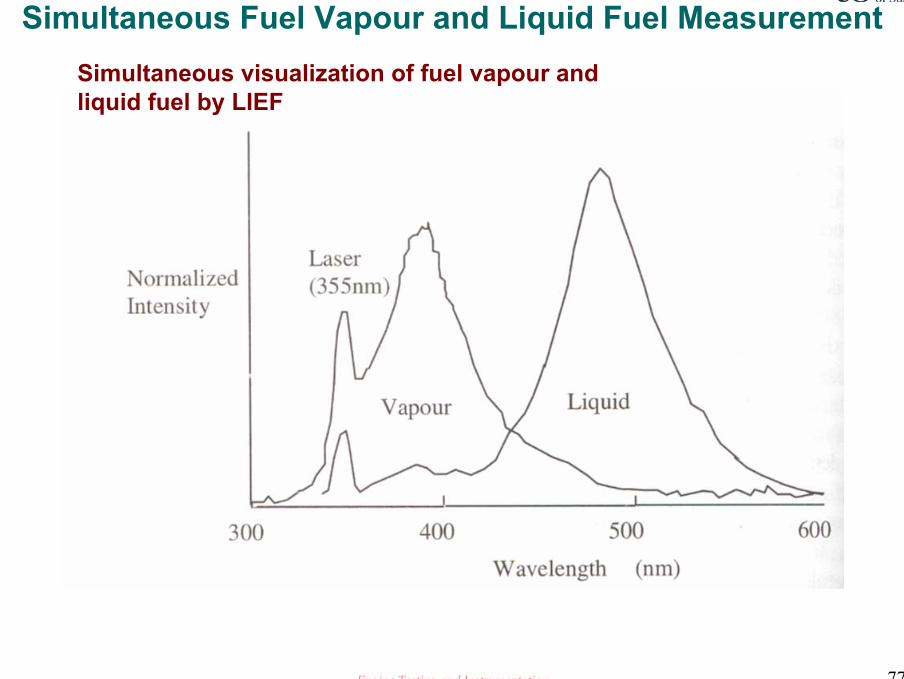
Simultaneous visualization of fuel vapour and liquid fuel by LIEF
Simultaneous Fuel Vapour and Liquid Fuel Measurement

Engine Testing and Instrumentation 78
An example for diesel fuel spray
LIF for Fuel Concentration
Engine Testing and Instrumentation 79
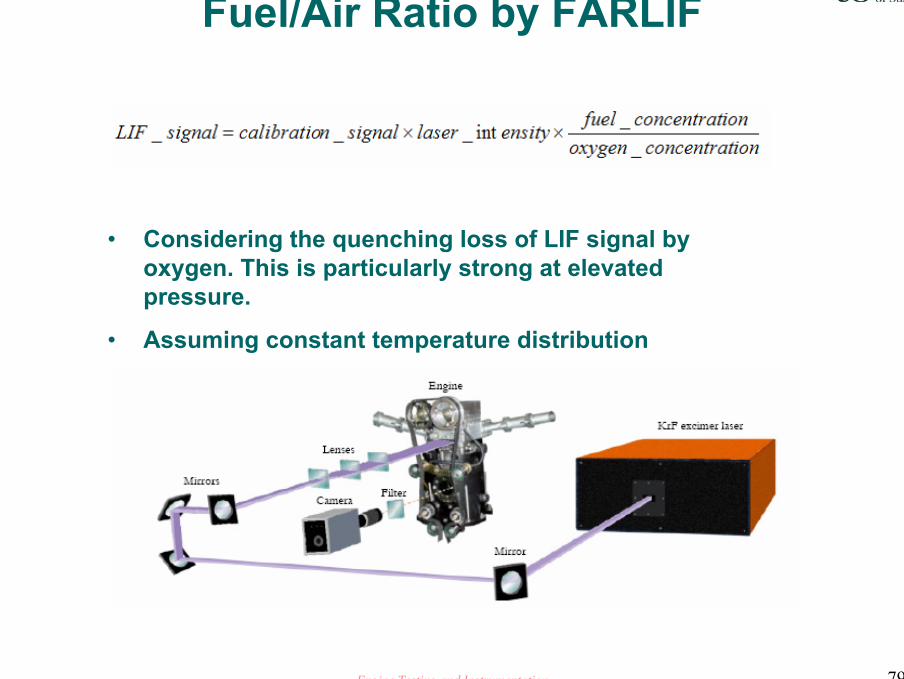
Fuel/Air Ratio by FARLIF
• Considering the quenching loss of LIF signal by oxygen. This is particularly strong at elevated pressure.
• Assuming constant temperature distribution
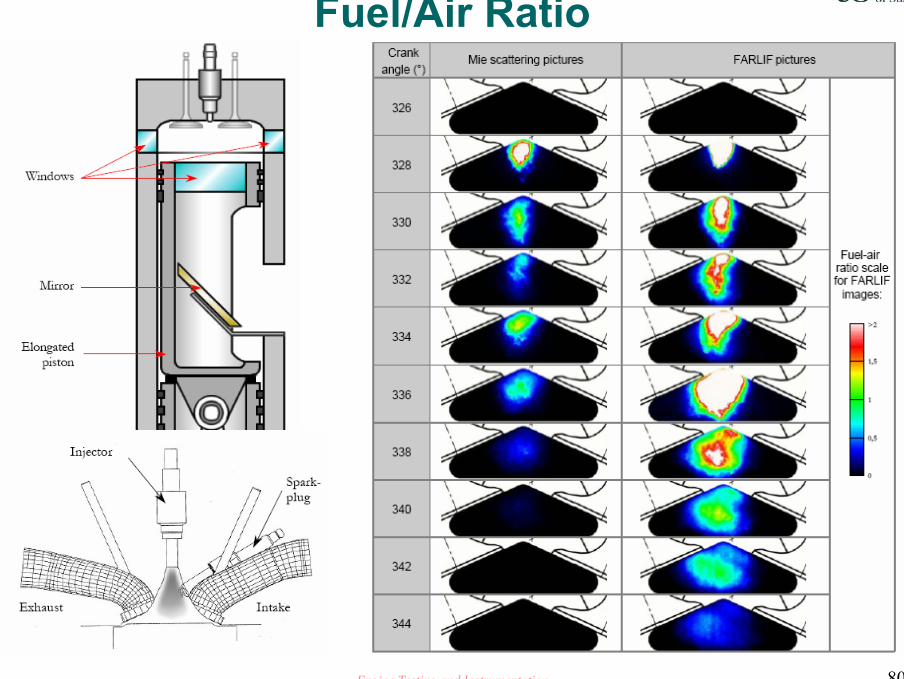
Engine Testing and Instrumentation 80
Fuel/Air Ratio
Engine Testing and Instrumentation 81
SummaryFor in-cylinder fuel and mixture measurement
• Some introductions
• Laser droplet sizing by Fraunhofer diffraction method
• Droplet sizing and velocity measurement by PDA
• Fuel concentration by LIF
• Simultaneous fuel vapour and liquid fuel measurement by LIEF
• Fuel/air ratio by LIF

Engine Testing and Instrumentation 82
In-cylinder visualization and combustion analysis: during and after combustion
• Introduction• Combustion and flame visualisation• Soot measurement (two-colour method)• Combustion T measurement (PLIF and CARS)• Visualisation of combustion species • Summary
Engine Testing and Instrumentation 83
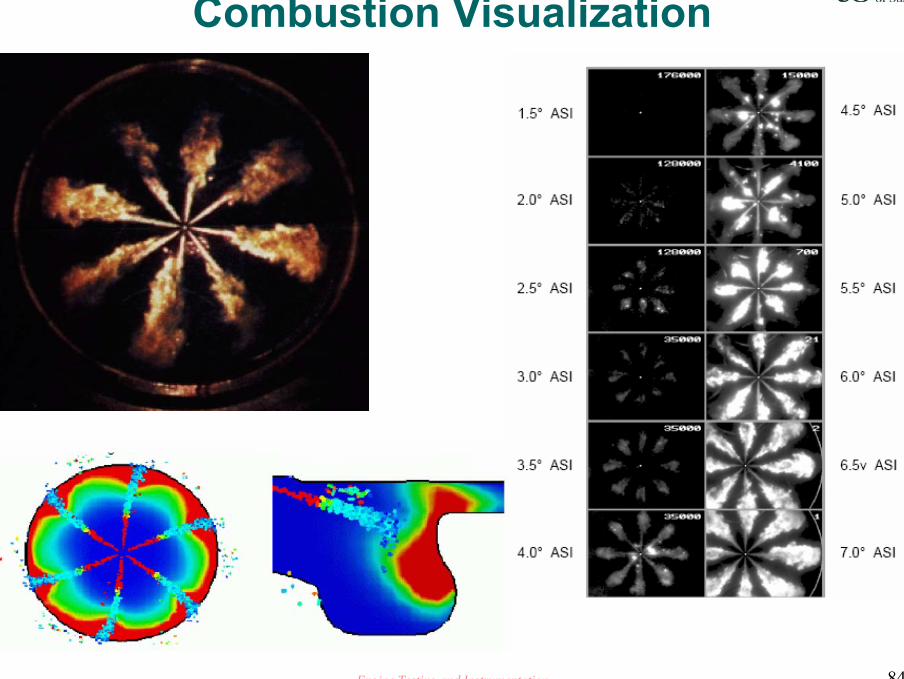
Combustion Visualization
• Direct visualization of combustion and flame propagation if the flame is luminous.
• To observe those non-luminous events (spray, flow field), schlieren/shadowgraph can be used (for density changes) with a high-intensity lamp or a laser as the light source
• High-speed camera (recent year, high-speed video camera, up 20,000 frame/s)
• Optical access is needed on the test engine.
Engine Testing and Instrumentation 84
Combustion Visualization
Engine Testing and Instrumentation 85
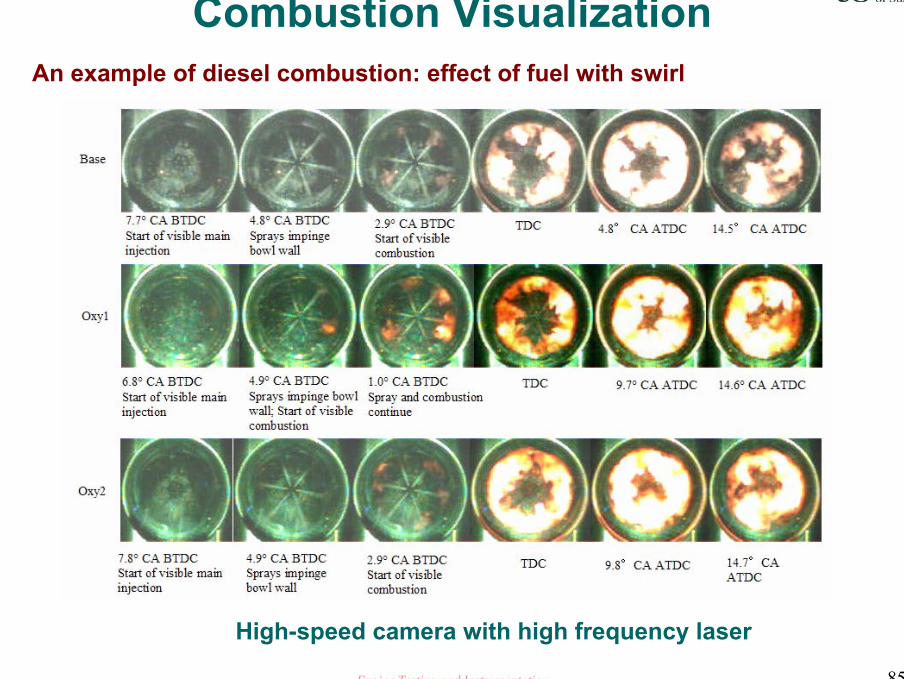
High-speed camera with high frequency laser
Combustion VisualizationAn example of diesel combustion: effect of fuel with swirl
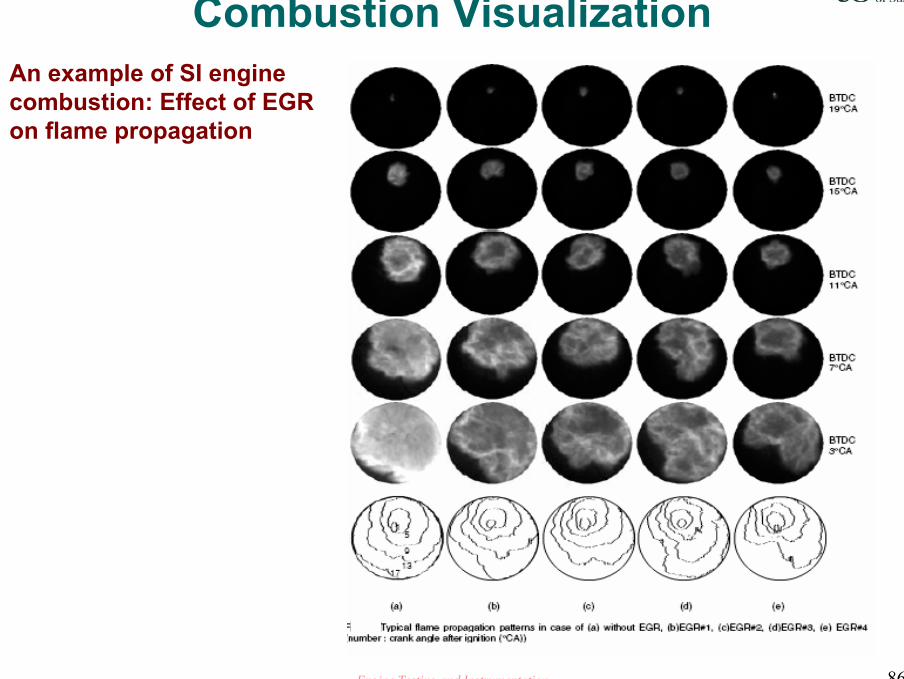
Engine Testing and Instrumentation 86
Combustion VisualizationAn example of SI engine combustion: Effect of EGR on flame propagation
Engine Testing and Instrumentation 87
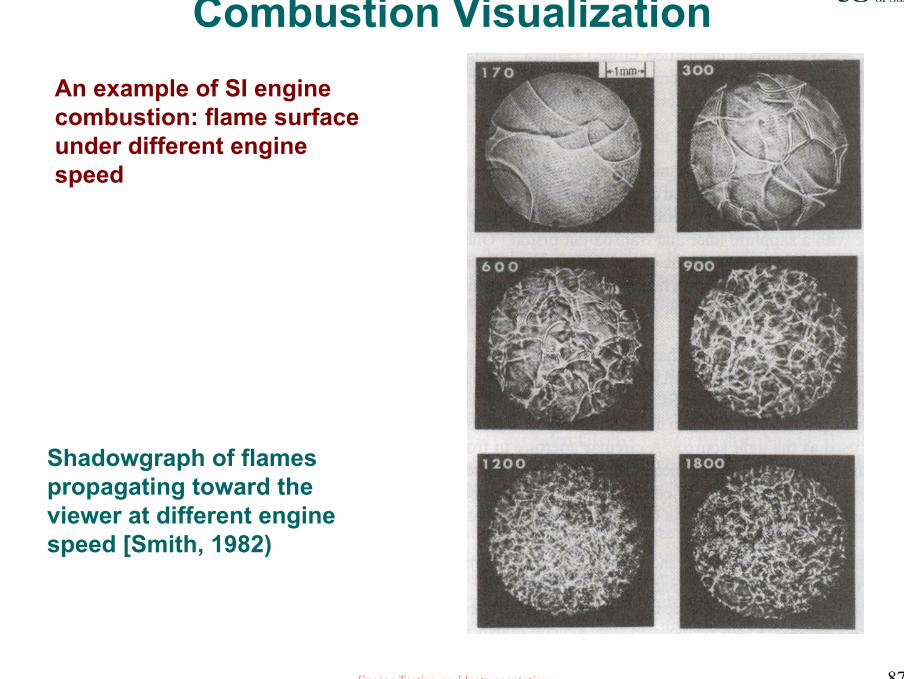
Shadowgraph of flames propagating toward the viewer at different engine speed [Smith, 1982)
Combustion VisualizationAn example of SI engine combustion: flame surface under different engine speed
Engine Testing and Instrumentation 88
Two-Colour Method
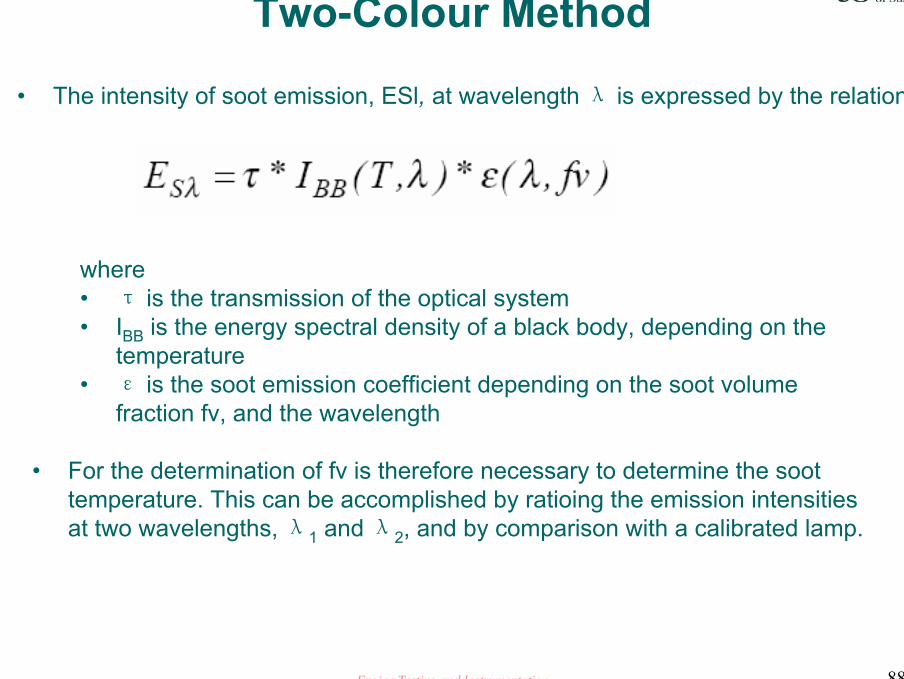
• The intensity of soot emission, ESl, at wavelength λ is expressed by the relation:
where • τ is the transmission of the optical system• IBB is the energy spectral density of a black body, depending on the
temperature• ε is the soot emission coefficient depending on the soot volume
fraction fv, and the wavelength
• For the determination of fv is therefore necessary to determine the soot temperature. This can be accomplished by ratioing the emission intensities at two wavelengths, λ1 and λ2, and by comparison with a calibrated lamp.
Engine Testing and Instrumentation 89
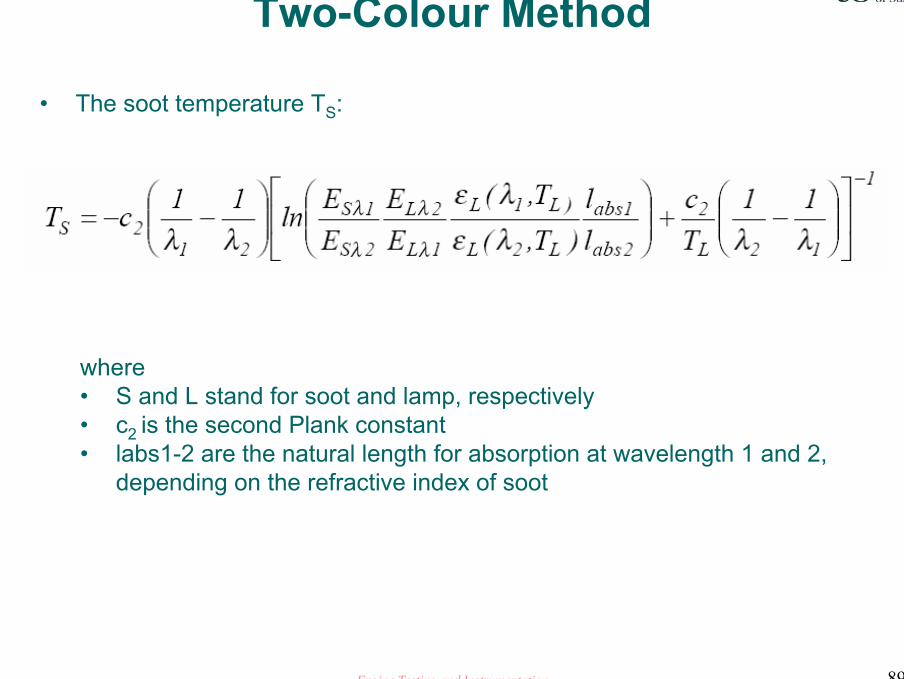
where • S and L stand for soot and lamp, respectively• c2 is the second Plank constant • labs1-2 are the natural length for absorption at wavelength 1 and 2,
depending on the refractive index of soot
Two-Colour Method
• The soot temperature TS:
Engine Testing and Instrumentation 90
Two-Colour Method
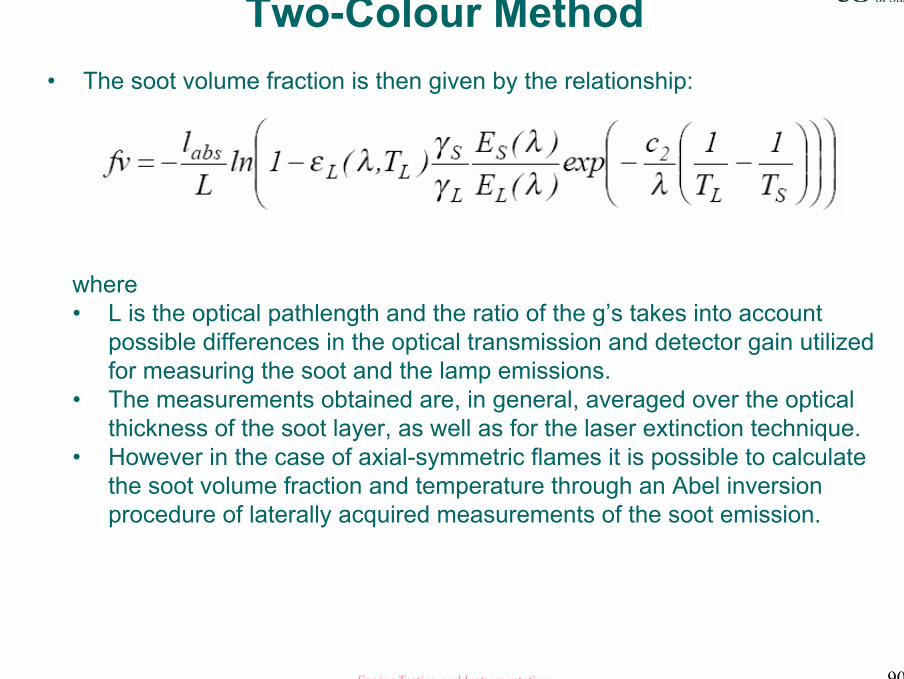
where • L is the optical pathlength and the ratio of the g’s takes into account
possible differences in the optical transmission and detector gain utilized for measuring the soot and the lamp emissions.
• The measurements obtained are, in general, averaged over the optical thickness of the soot layer, as well as for the laser extinction technique.
• However in the case of axial-symmetric flames it is possible to calculate the soot volume fraction and temperature through an Abel inversion procedure of laterally acquired measurements of the soot emission.
• The soot volume fraction is then given by the relationship:
Engine Testing and Instrumentation 91
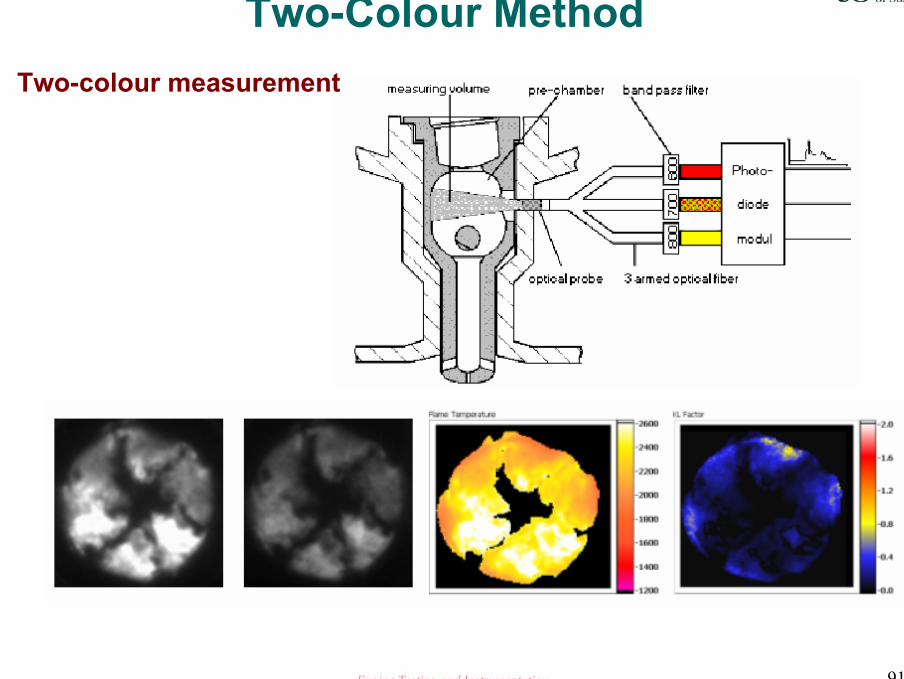
Two-Colour MethodTwo-colour measurement
Engine Testing and Instrumentation 92
In-Cylinder Combustion T Measurement
• Compared to pressure, the heat transfer is so slow, so the T distribution in the cylinder is always not uniform once the combustion starts. (sharp T gradient between burned and unburned gases)
• The effect of T on NO is significant. (1700K)
• Using in-cylinder pressure traces, the average in-cylinder temperature can be estimated. But it will give a significant error for NO formation information with this estimated average temperature.
• Thermocouples lack the necessary time response, it can not be used for in-cylinder temperature measurement.
Engine Testing and Instrumentation 93
In-Cylinder Combustion T Measurement
• Velocity-of-sound method
• Spontaneous Raman Scattering (SRS)
• Laser Rayleigh Scattering
• CARS (Coherent Anti-stokes Raman Scattering)
• 2D PLIF
Methods
Engine Testing and Instrumentation 94
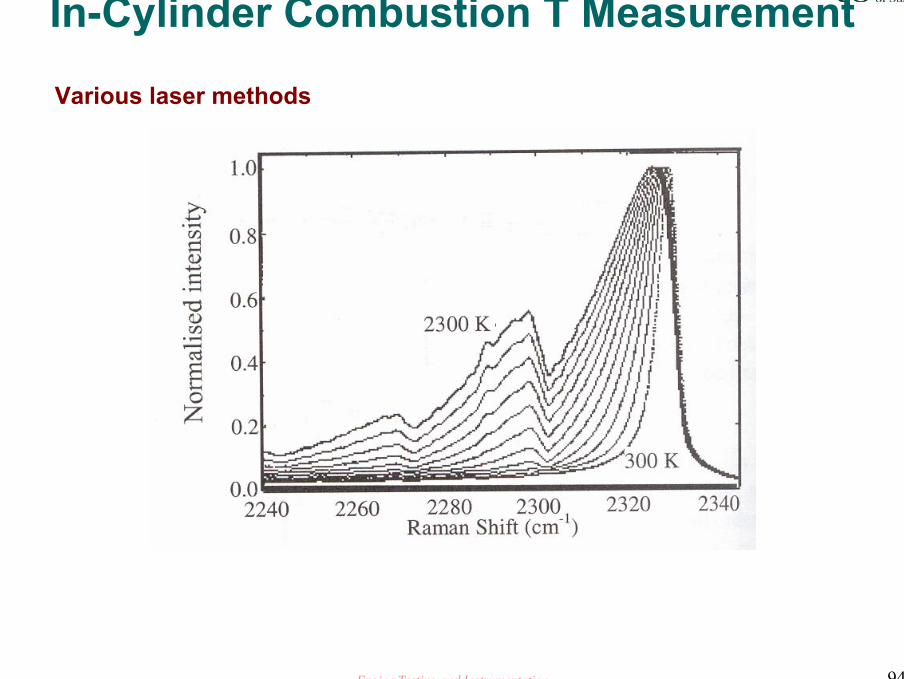
In-Cylinder Combustion T Measurement
Various laser methods
Engine Testing and Instrumentation 95
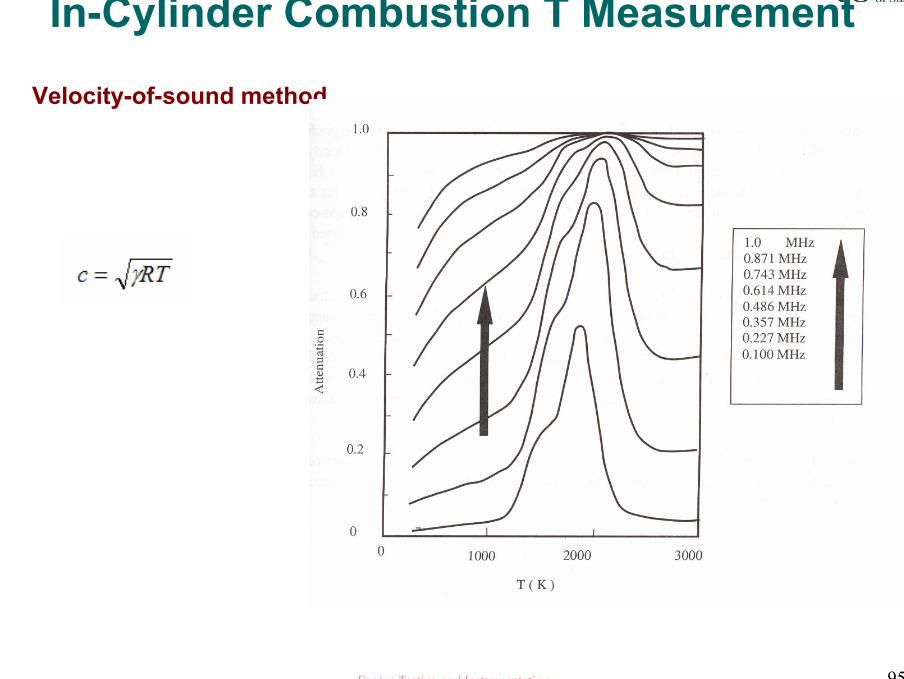
In-Cylinder Combustion T Measurement
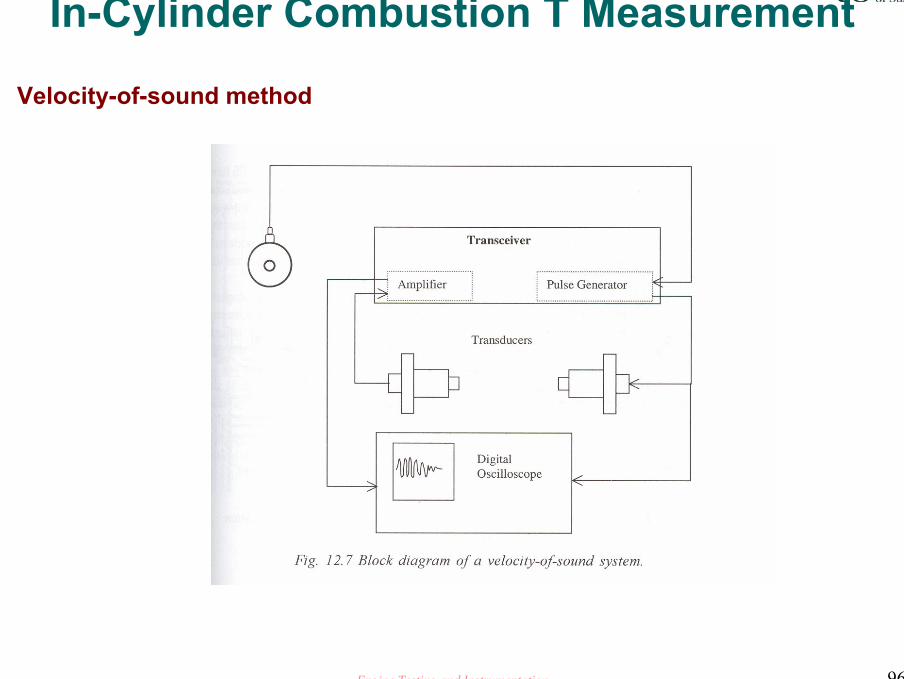
Velocity-of-sound method
Engine Testing and Instrumentation 96
In-Cylinder Combustion T Measurement
Velocity-of-sound method
Engine Testing and Instrumentation 97
Visualization of Combustion Species
• Before and after ignition, how about EGR rate in the cylinder? after combustion how those reactions take place?
• Reasonable combustion speed: pressure increase rate, combustion temperature for emissions
• To avoid knocking combustion

Engine Testing and Instrumentation 98
Visualization of Combustion Species
• Fast FID (HC, residual gas rate)
• Sampling techniques
• Various LIF for combustion species (OH, NO, O2, CH2O…)
Methods
Engine Testing and Instrumentation 99
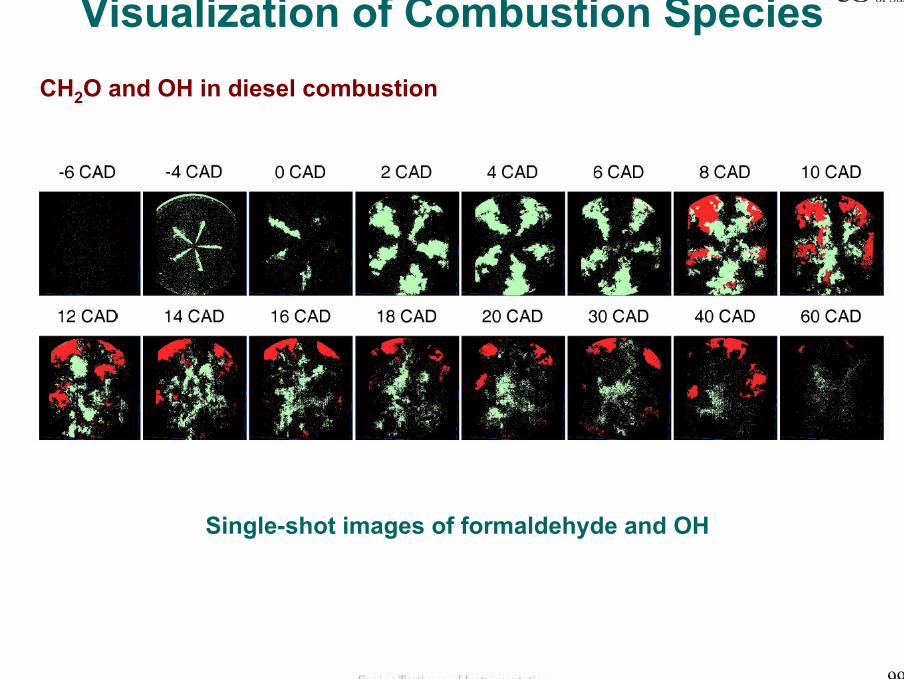
Single-shot images of formaldehyde and OH
Visualization of Combustion SpeciesCH2O and OH in diesel combustion
Engine Testing and Instrumentation 100
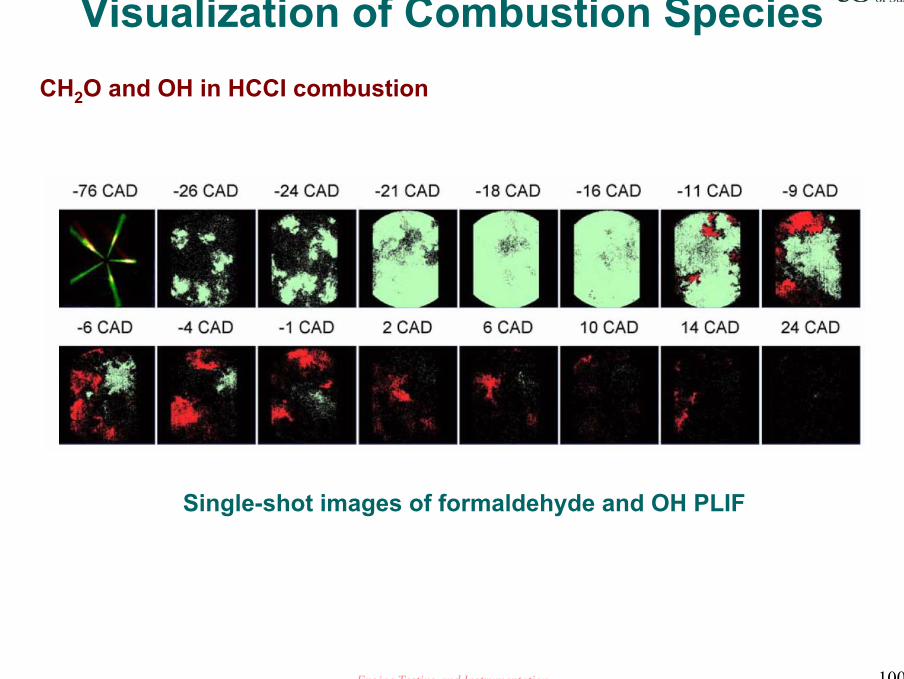
Visualization of Combustion Species
Single-shot images of formaldehyde and OH PLIF
CH2O and OH in HCCI combustion
Engine Testing and Instrumentation 101
Cylinder Pressure Measurement
Hardware• Calibrated Transducer• High Impedance Cable• Charge Amplifier• Encoder• Digitiser
Engine Testing and Instrumentation 102
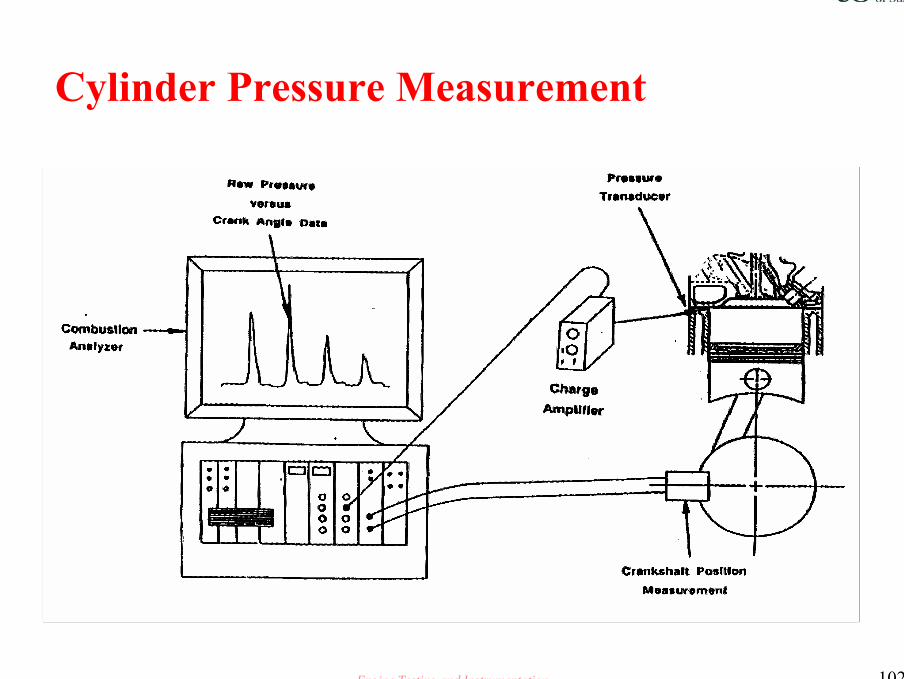
Cylinder Pressure Measurement
Engine Testing and Instrumentation 103
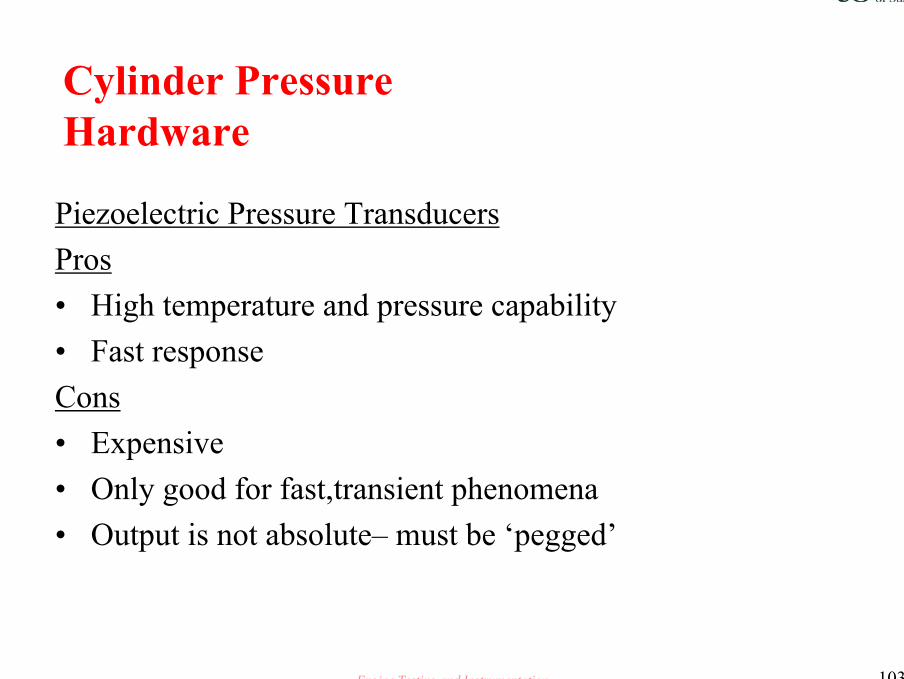
Cylinder Pressure Hardware
Piezoelectric Pressure TransducersPros• High temperature and pressure capability• Fast responseCons• Expensive• Only good for fast,transient phenomena• Output is not absolute– must be ‘pegged’
Engine Testing and Instrumentation 104
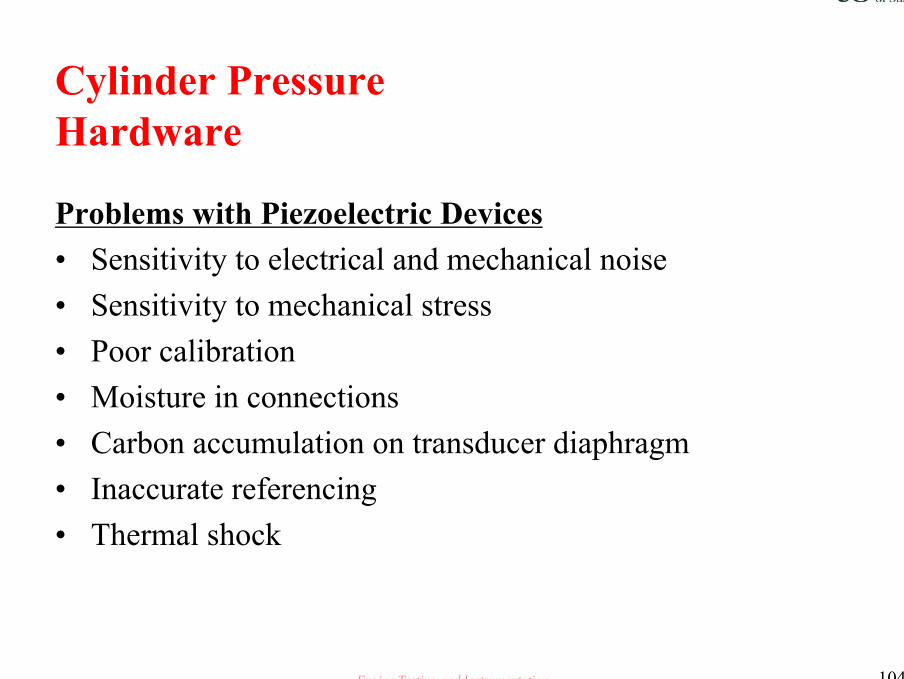
Cylinder Pressure Hardware
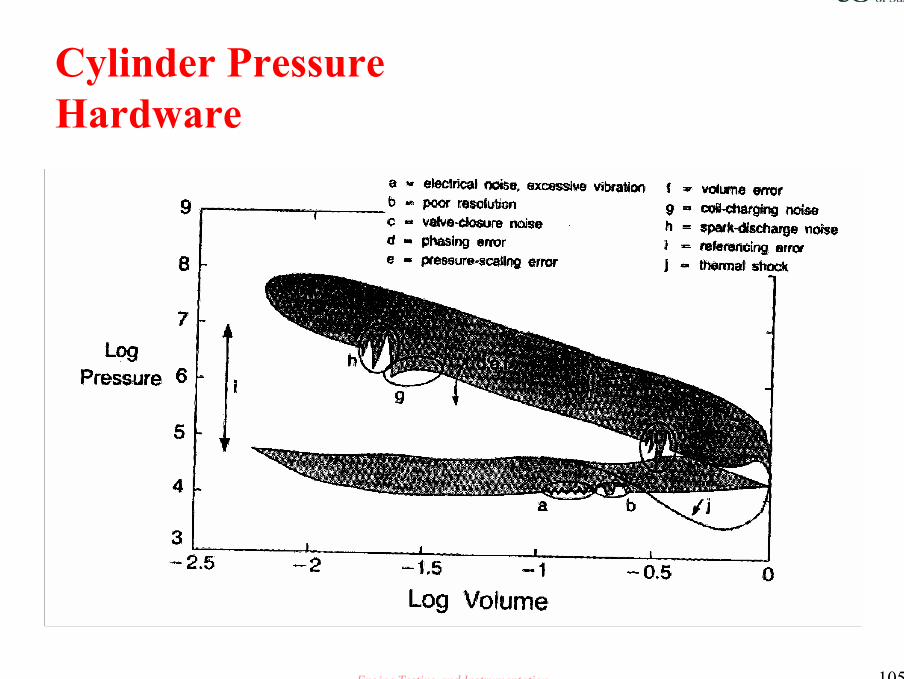
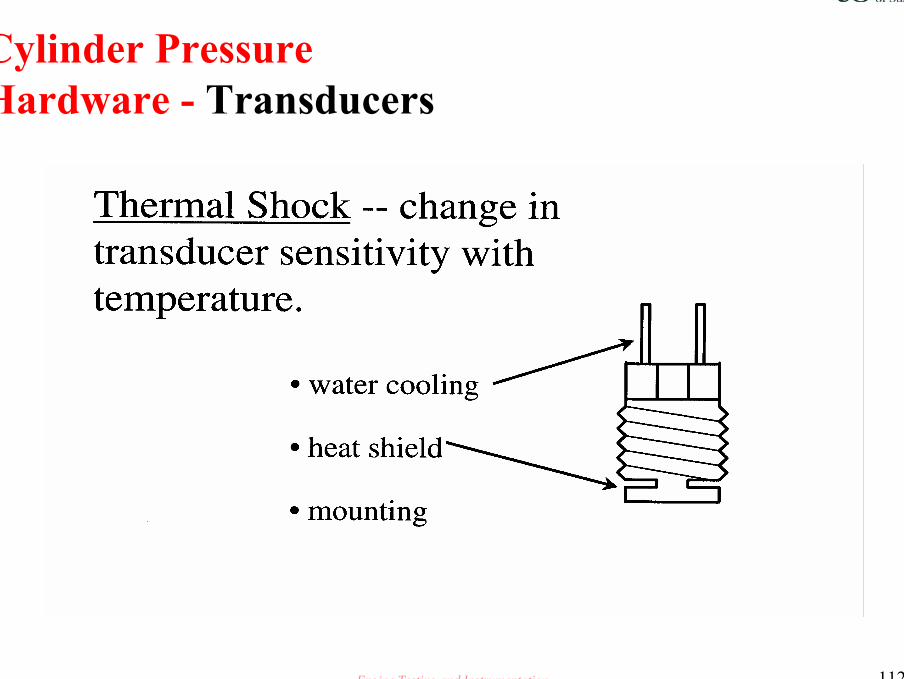
Problems with Piezoelectric Devices• Sensitivity to electrical and mechanical noise• Sensitivity to mechanical stress• Poor calibration• Moisture in connections• Carbon accumulation on transducer diaphragm• Inaccurate referencing• Thermal shock
Engine Testing and Instrumentation 105
Cylinder Pressure Hardware
Engine Testing and Instrumentation 106
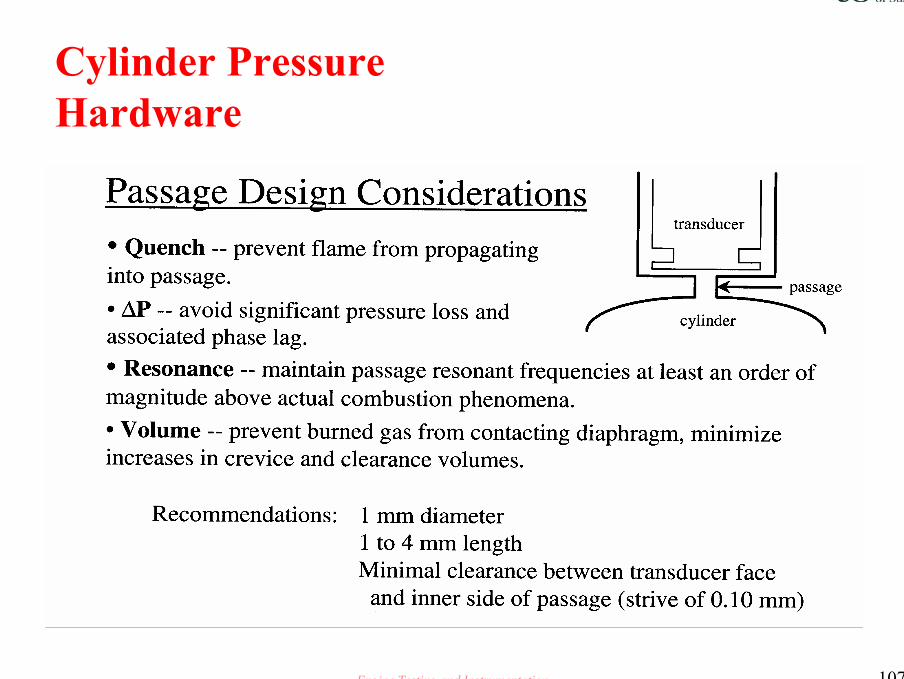
Cylinder Pressure Hardware
Mounting Considerations• Mounting:flush mounting avoids resonance issues associated with
passages, but maximises thermal shock,especially at periphery ofcombustion chamber
• Torque:tighten to recommended torque/sensitivity will change if transducer is tightened excessively
• Leaks:check for leaks during operation—avoid wetting the connectors• Gaskets:recommend copper material for gaskets(nickel is frequently
supplied)
Engine Testing and Instrumentation 107
Cylinder Pressure Hardware
Engine Testing and Instrumentation 108
Cylinder Pressure Hardware --Pegging
Referencing Pressure Measurements (pegging)1. Transducer outputs charge to charge amplifier2. Charge amplifier outputs voltage to digitiser3. User must reference voltage to pressure (peg)
Pressure = gain * voltage + biasP = G έ (Ø) + έb
Engine Testing and Instrumentation 109
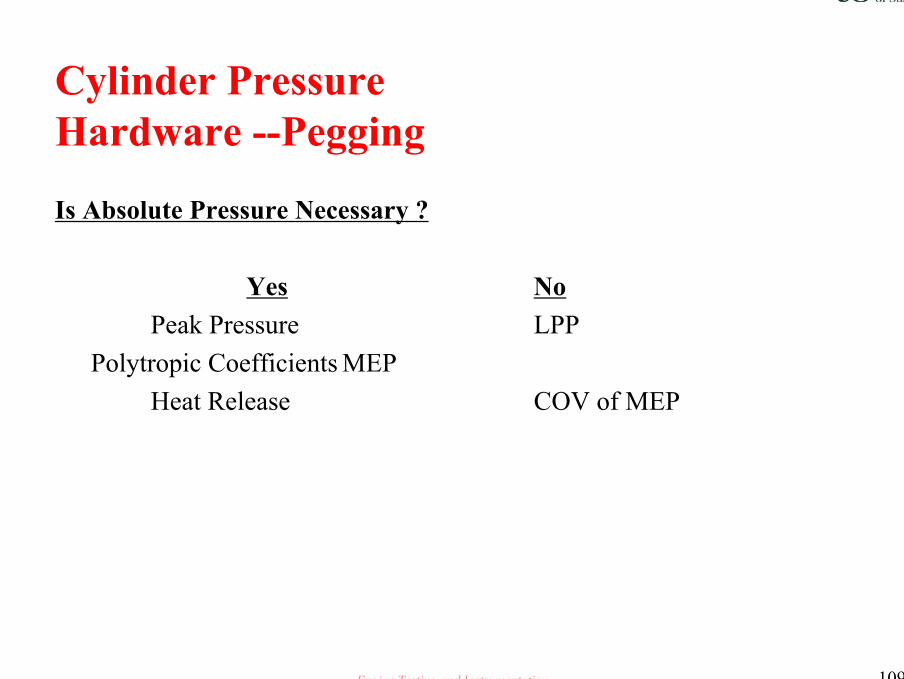
Cylinder Pressure Hardware --Pegging
Is Absolute Pressure Necessary ?
Yes NoPeak Pressure LPP
Polytropic Coefficients MEPHeat Release COV of MEP
Engine Testing and Instrumentation 110
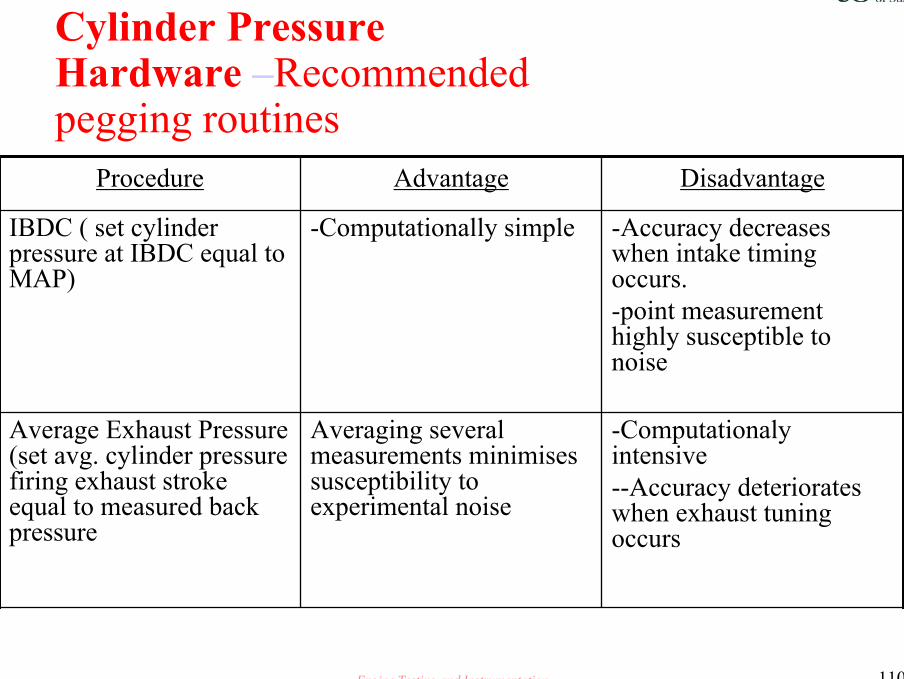
Cylinder Pressure Hardware –Recommendedpegging routines
-Computationalyintensive--Accuracy deteriorates when exhaust tuning occurs
Averaging several measurements minimises susceptibility to experimental noise
Average Exhaust Pressure (set avg. cylinder pressure firing exhaust stroke equal to measured back pressure
-Accuracy decreases when intake timing occurs.-point measurement highly susceptible to noise
-Computationally simpleIBDC ( set cylinder pressure at IBDC equal to MAP)
DisadvantageAdvantageProcedure
Engine Testing and Instrumentation 111
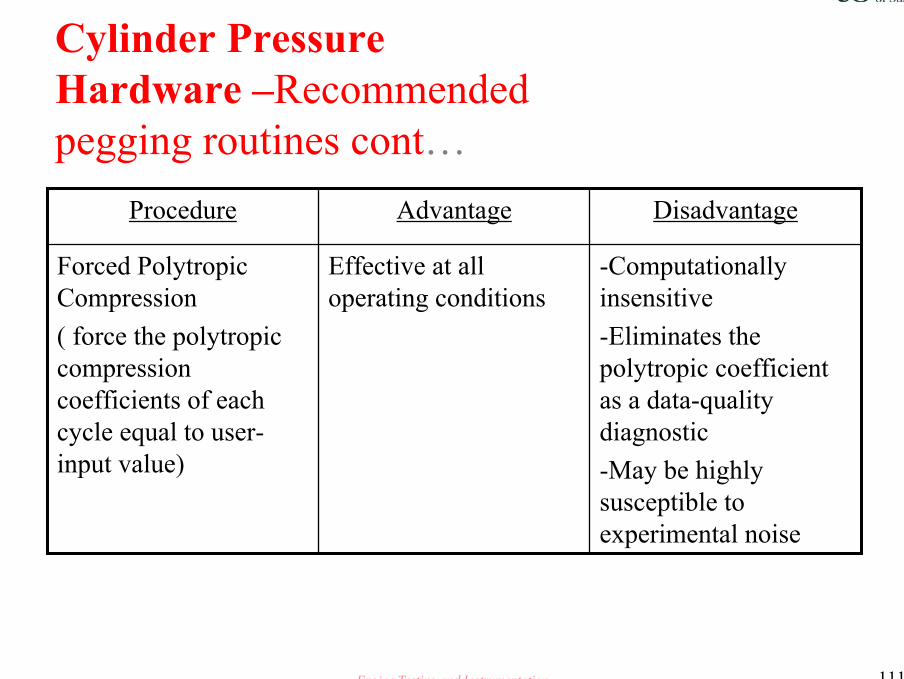
Cylinder Pressure Hardware –Recommendedpegging routines cont…
-Computationally insensitive-Eliminates the polytropic coefficient as a data-quality diagnostic-May be highly susceptible to experimental noise
Effective at all operating conditions
Forced Polytropic Compression ( force the polytropiccompression coefficients of each cycle equal to user-input value)
DisadvantageAdvantageProcedure
Engine Testing and Instrumentation 112
Cylinder PressureHardware - Transducers
Engine Testing and Instrumentation 113
Recommendations• Be aware of transducer limitations• Select a transducer with a good thermal shock resistance• Mount the transducer precisely• Keep the heat shield and connectors clean• Use clean, preferably distilled,water supply• Examine data for signs of measurement error
Cylinder PressureHardware - Transducers
Engine Testing and Instrumentation 114
Cylinder PressureHardware - Cables
High Impedance CablePurpose:Conduct charge from the transducer to the charge
amplifierApplication:resistance between centre conductor and outer
shield must be kept high (.10 13 ( Ω)ohms)--Keep cable length reasonably short
-- Do not allow cable to sit in liquid-- Keep connector clean and dry ( do not use alcohol –based electrical – based electrical contact cleaners)
Engine Testing and Instrumentation 115
Cylinder PressureHardware – Transducers cont.
Cable Resistance Testing
Tool:Kistler 5491 Insulation tester (circa $1,000)• Check cable and transducer/cable assembly• If < 10 13 ( Ω)ohms:
• Clean connectors with contact cleaner• Bake for 2 hours at 125C• If still low, check cable for damage.
Engine Testing and Instrumentation 116
Cylinder PressureHardware – Charge Amplifier
Purpose:1. Convert charge output from transducer to a voltage ( Range
capacitor)V α charge / capacitance
2. Amplify voltage to produce desired gain
Engine Testing and Instrumentation 117
Cylinder PressureHardware – Charge Amp.cont…
Charge Amplifier Recommendations• Use differential amplifier to reduce susceptibility to many
types of noise• Use amplifier which grounds each engine cycle to help
keep data from drifting out of digitiser range• Prefer amplifier with the capability of offsetting ground to
allow more efficient use of digitiser range• Select an amplifier which provides information on intra-
cycle drift
Engine Testing and Instrumentation 118
Cylinder PressureHardware – EncodersCrankshaft Position Sensing• Optical Encoder-Light gate and optical pickup indicate crankshaft
position• Digital Magnetic Pickup (DI-MAG)-0 to 5v TTL output dependant
on magnetic field strength –used for sensing ring gear teeth• Magnetic-Sinewave output corresponding to magnetic field strength-
prefer to use zero crossing rather than some arbitrary amplitudethreshold
• Engine Crankshaft Sensor-Generally insufficient resolution, although 58x systems are adequate for some rudimentary applications (58 pulses per crankshaft revolution)
Prefer 360 ppr for general combustion work, 3,600 for knock work
Engine Testing and Instrumentation 119
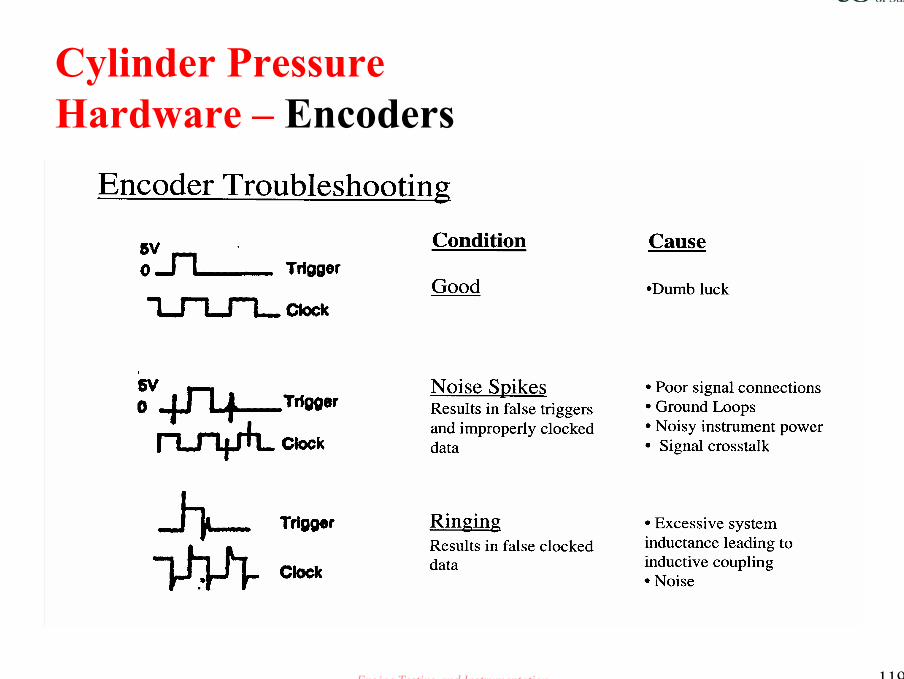
Cylinder PressureHardware – Encoders
Engine Testing and Instrumentation 120
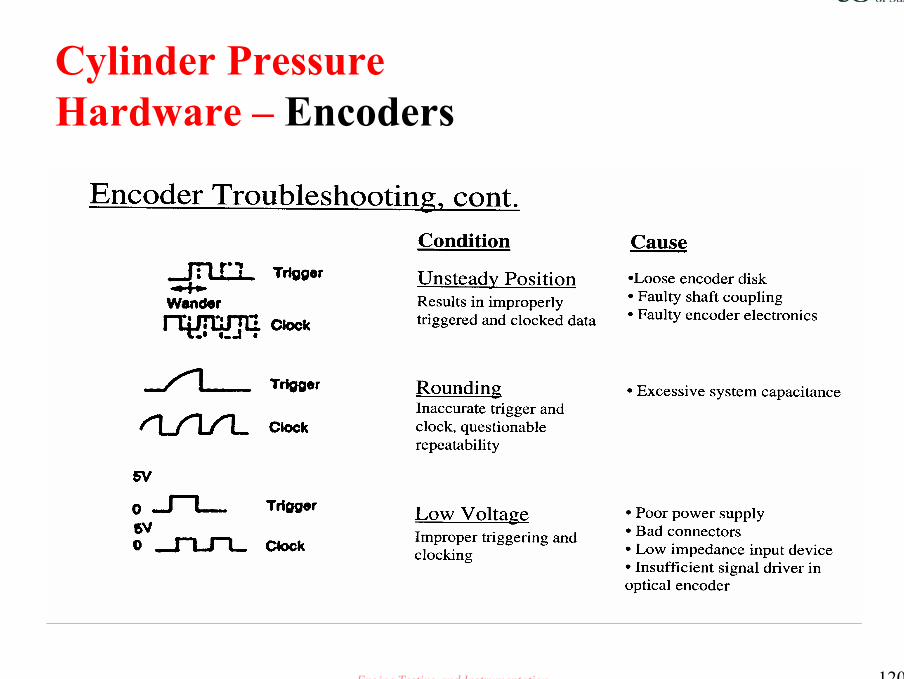
Cylinder PressureHardware – Encoders
Engine Testing and Instrumentation 121
Cylinder PressureHardware – Encoders
Encoder Recommendations• Select an encoder which does not ground to the engine
( isolated case )• Prefer a direct-mount encoder as opposed to one requiring
a coupling• May need to photo-isolate encoder signals in high-noise
applications• Use a quadrature encoder for applications where the engine
may rotate backwards ( such as cold start tests)