in search of appropriate rehabilitation …eaas-journal.org/survey/userfiles/files/7_enviornmental...
TRANSCRIPT

March 2013. Vol. 2, No.3 ISSN 2305-8269
International Journal of Engineering and Applied Sciences © 2012 EAAS & ARF. All rights reserved
www.eaas-journal.org
58
IN SEARCH OF APPROPRIATE REHABILITATION STRATEGIES
FOR ABANDONED NYALA MAGNESITE MINE, LIMPOPO
PROVINCE OF SOUTH AFRICA
S.E. Mhlongo1*
; F.A.Dacosta1 and N.F. Mphephu
2
1University of Venda, School of Environmental Sciences, Department of Mining and Environmental
Geology, Private Bag x 5050, Thohoyandou 0950 South Africa 2Environmental Specialist, Xstrata Alloys, P. O. Box 1050, Rustenburg 0300 South Africa
*Email: [email protected]; [email protected]
ABSTRACT
Mining operations have a disruptive effect on the environment and abandoned surface mines exacerbate the
problem. Some of these historic mine sites are in a deplorable state and continue to cause damage to the
environment and potential risks to human and animal health in the surrounding areas. The main aim of this
research was to identify and evaluate practical rehabilitation strategies for addressing physical and
environmental problems at an abandoned Nyala Magnesite Mine. The approach used involved
characterization of tailings and spoil materials as well as water within the excavations, development of
current and post-rehabilitation terrain models using RTK-GPS data, and selection and evaluation of
alternative land uses for the mine used SWOT and QSPM analysis respectively. The mine waste
characterization showed that the tailings are suitable for engineering purposes based on their physical
properties and high silica content. The laboratory analysis of the water samples from the pit-lake showed
that the water is highly alkaline with unacceptable levels of Cl-, Mg
+2, F
- and K
+ thus making the water to
be unsuitable for domestic uses. Characterization of mine waste and water, together with terrain modeling
provided are more robust scientific techniques for making sound decision on selection of appropriate
rehabilitation strategies and on determination of Cut and Fill volume. Based on SWOT and QSPM analysis
results; three post-mining land use scenario plans for rehabilitation of the mine site were developed. Cost
estimation of these practical rehabilitation strategies was recommended in order to ensure that low-cost
strategies are implemented at the mine site.
Keywords: Terrain Modeling, Mine Rehabilitation Strategies, Abandoned Mines, Land-use Selection,
Nyala Mine
1. INTRODUCTION
Mining is a temporary land use that adversely
degrades the natural environment. Surface mining
in particular can severely erode the soil and
reduce its fertility, pollute water and other
components of the environment, drain
underground water reserves, disrupt all visually
aesthetic elements of the landscape, and destroy
wildlife.[1]
These problems continue even after
mining has ceased if the mine was not properly
closed or abandoned. Mine rehabilitation,
therefore, is a significant and essential element of
mining that is carried out to improve the disturbed
part of the environment to a degree that it
integrates well with the surrounding environs thus
effectively supporting other land uses.
Backfilling of disrupted areas and re-contouring
of slopes are significant measures to be taken in
restoration of land mined by open pit to original
or accepted alternative uses.[2]
Landform design
for mine rehabilitation purposes is about planning
for the immediate and long term future in tandem,
optimizing post-mining land capacity while
minimizing the cost of achieving optimal land
use, and sustainable development.[3]
The
operations of re-contouring and backfilling of

March 2013. Vol. 2, No.3 ISSN 2305-8269
International Journal of Engineering and Applied Sciences © 2012 EAAS & ARF. All rights reserved
www.eaas-journal.org
59
voids areas require extensive grading of mine
waste in order to create stable and acceptable
topography with improved land use capacity. In
view of this, it is important that characterization
of mine waste is conducted so as to reduce the
risks of contamination of water regimes. This is
due to the fact that mine waste can contain a
range of properties that are likely to impact
negatively on the environment if allowed to enter
the environment. Characterization of mine waste
can also assist in determining their suitability for
alternative uses.
Mining of magnesite by open pit at Nyala Mine
has resulted to extensive degradation of the
natural environment around the study area. It has
created a landscape with extremely reduced
capacity to support other land uses.[4]
This is due
to the fact that the mining operations in the area
were not subjected to the current environmental
laws, thus the mines were abandoned without any
attempt of rehabilitation of the land for other uses.
The main aim of this research was to identify and
evaluate practical and appropriate rehabilitation
strategies for addressing physical and
environmental problems at the historic Nyala
Mine.
1.1. Location of the Study Area
Nyala Magnesite Mine is found in the vicinity of
Zwigodini Village. It is situated approximately 50
km North East of Thohoyandou and at about 60
km from the Pafuri gate of the Kruger National
Park as shown in Fig.1. The region is dominated
by agricultural, residential and recreational
activities, and small-scale magnesite mining
operations.
Figure 1: Locality map of the study area
1.1.2. Geologic setting
The Nyala Magnesite Mine falls within the
Tshipise Straightening Zone along the southern
periphery of the Central Zone of the Limpopo
Belt. Generally, the Central Zone comprise
dominantly of high grade metasediments which
are interlayered with quartzofeldspathic gneisses
and mafic rocks (collectively known as Beit
Bridge Complex). These rocks are lithologically
subdivided into three groups; namely, Mount
Dowe, Malala Drift and Gumbu Groups in their
order of younging. The Mount Dowe Group
mainly consists dominantly of quartzite,
magnetite quartzite and metapelitic gneiss, with
intercalations of quartzofeldsphic gneiss.
Comparatively, the Malala Drift is dominated by
quartzofeldspathic gneisses with minor quartzite,
magnesite quartzite and metapelite, while the
Gumbu Group is characterized predominantly of
marbles and calc-silicate rocks with minor fine-
grained metapelite and metapsammite.[5]
The magnesite deposits at Nyala Mine are hosted
by metamorphosed ultrabasic and calcareous
rocks of the Limpopo Belt. These deposits are
known to be extending for about 50 km east-north
of Tshipise.[6]
Magnesite deposits in the study area
are amorphous in nature and they occurs as veins
and irregular masses that were derived by
weathering from olivine-rich rocks, namely;
basalt and limburgite rocks of the Drakensburg
Stage of the Stormberg Group.[6][7]
Other similar
deposits of little economic importance occurring

March 2013. Vol. 2, No.3 ISSN 2305-8269
International Journal of Engineering and Applied Sciences © 2012 EAAS & ARF. All rights reserved
www.eaas-journal.org
60
around the region include the deposits occurring
within pyroxinite and veins of crystalline, around
the Musina and Mopane districts. However, most
of the magnesite deposits of the country are of
amorphous in nature.[7]
2. METHODS AND MATERIALS
2.1. Physical Characterization of Tailings and
Spoil Materials
The particle size distribution technique was used
in determination of physical characteristics of
tailings and spoil dumps materials at Nyala Mine.
It included measuring the grain size distribution
of the wastes by passing them through a series of
sieves ranging from 4, 3.15, 2, 1 mm; 500, 250,
125, 63, 32 µm in sizes. A pan was placed at the
bottom of the stack.
The procedure included passing the dried sample
of known weight through the set of sieves of
known individual empty weight. The sieve stack
was placed on the motorized mechanical shaker
and shaken for 1 hour. Material retained in each
sieve was weighed and expressed as a percentage
of the whole sample. The results of sieve analysis
expressed as percentage passing were plotted on
the logarithmic graph using Dplot® Software. The
plotted gradational curve was used in the
calculation of uniformity ( ) and curvature ( )
coefficient.
2.2. Chemical Analysis of Tailings Material
Magnesite tailings are generally inert rock
particles with little direct environmental impact
associated with their chemical nature. This is due
to that no chemical reagents are used in the
processing of magnesite. The chemical analysis of
tailings material involved determination of
percentage of major oxides in order to establish
their potential alternative use.
The procedure for samples preparation for direct
analysis with PANanalytical Axios X-ray
fluorescence spectrometer instrument involved
milling of tailings materials to the fraction less
than 75 µ using the Retsch RS 200 vibratory disk
milling machine. The milled specimen was then
roasted at 1000 °C for at least 3 hours to oxidize
iron (Fe2+
) and Sulfur (S), and to determine the
Loss on Ignition (L.O.I) percentage of the
samples. The analysis of major oxides required
that the glass disks are prepared through fusing 1
g roasted sample, 8 g (12-22) flux consisting of
35% alkali borate (LiBO2) and 64.71% lithium
tetraborate (Li2B4O7) at 1050 °C. The glass disks
were then analyzed by XRF machine equipped
with a 4 kW Rhodium (Rh) tube.
2.3. Chemical Analysis of Water
The water samples were analyzed for anions and
cations concentrations using the 850 Professional
Ion Chromatograph (IC) and the Flame Atomic
Absorption Spectrometry (FAAS) (Perkin Elmer
AAnalyst 400) respectively. For the analysis of
anions, the mobile phase of the IC instrument was
equipped with two litres solution of 168 g sodium
carbonate (NaHCO3) and 678 g disodium
carbonate (Na2CO3) in the analysis of anions. The
water samples were then passed through the
pressurized Metrosep A Supp 5 anions column at
0.8 ml/minute flow rate. The standards used for
instrument calibration were 1 ppm, 5 ppm, 10
ppm and 20 ppm.
Alkali metals (cations) in water were analyzed
using the FAAS. Sodium, calcium, magnesium,
potassium and iron were detected in water
samples by plotting non-linear calibration curve
using well prepared standard solutions for each
metal under investigation. Prior to the instrument
calibration, optimization was done to obtain the
best response of the instrument. The analysis
involved introducing a water sample to the
instrument aspirator where it was then aspirated to
flame in the form of aerosol. The beam of
ultraviolet light at a specific wavelength was
focused to the flame prior to sample aspiration.
The machine detected the metal existence in water
by measuring the change in intensity of each
metal under investigation. The computer system
then converted the measured change in intensity
into an absorbance that was subsequently
converted to parts per million (ppm).
2.3.1. Mine water and waste pH determination
Mine water and solid waste (both tailings and
spoil materials) were analyzed for their pH and
electrical conductivity (EC) levels. The slurry was
prepared by adding 20 ml of deionizered water to
the homogenized 20 g scoop of clay and silt
particles of solid waste. The samples were
vigorously stirred for 15 minutes with a glass
stirring rod and let to stand for 30 minutes. The

March 2013. Vol. 2, No.3 ISSN 2305-8269
International Journal of Engineering and Applied Sciences © 2012 EAAS & ARF. All rights reserved
www.eaas-journal.org
61
pH meter was then calibrated over the appropriate
alkaline range of 7.00 to 9.00 using the buffer
standard solution and thereafter pH and EC rods
were respectively immersed in to the beaker with
slurred soil samples. The pH and EC readings of
the soil were recorded from the instrument. In the
case of water samples, the pH and its
corresponding EC were measured by immersing
the pH and EC rods in 40 ml of water for a minute
after the sample have been vigorously stirred and
let to stand for at least 60 minutes.
2.4. GPS Setting and Data Collection
The height data required as input for digital
terrain modeling was collected through the use of
Hi-Target V9 GNSS RTK Surveying system. The
procedure for data acquisition using RTK-GPS
involved setting of the GPS base at a known point
at 50 m radius away from high voltage power
lines and at clear view of the sky. The base point
was localized to the nearest Lwandze trig station
(-22.55431S; 30.6949E and the height of 633.6
above MSL). The GPS base receiver was placed
on the fixed height tripod and set at the elevation
musk of 15° under WGS-84 coordinate system.
The rover’s receiver was mounted on the fixed
height rod (2 m) and set at elevation musk of 10º
to enhance the accuracy of the points. Both base
and rover heights were kept at an ellipsoids set-
up. The points were collected at every 1 m
vertical interval as the rover moves from point to
point along the designed 15 m spaced traverse
lines. The measured points were stored in the
mobile PC and downloaded for processing
purposes.
2.4.1. Data processing for terrain modeling
The surfer® 8 software using linear interpolation
methods was used in creation of Nyala Mine
terrain models. Prior to the creation of the actual
surfaces; the height data was processed to make it
compatible for the software. Kriging interpolation
method was used to produce visual maps from
irregularly spaced height data. Adjustments on the
relief data were made for the creation of an
engineering surface design. The designed
engineering surface models were superimposed
on the models representing the current terrain to
define cut and fill areas.
2.4.2. Cut and fill volume calculation
The volumes of material to be cut and voids to be
filled in order to create level mine surfaces were
calculated and considered as an average of the
extended trapezoidal, extended Simpson’s, and
Simpson’s 3/8 rules as expressed mathematically
in equation (i), (ii) and (iii) respectively.[8]
In
these equations, represents the grid column
spacing, represents the grid row spacing, and
represents the grid node value in row and
column .
..………..(i)
where: the pattern of coefficients is: 1, 2, 2, 2…, 2, 2, 1
…………..(ii)
where: the pattern of coefficients is: 1, 4, 2, 4, 2, 4,
2,…, 4, 2, 1
…….…….(iii)
where: the pattern of coefficients is 1, 3, 3, 2, 3, 3,
2,…, 3, 3, 2, 1
The difference in the volume computed by the
three methods was used to measure the accuracy
of the estimate. In the cases where the three
volume estimates were reasonable close, the three
volumes were considered to be close to the
computed values. The net volume of the material
to be cut as well as the void to be filled was
considered to be the average of the three values.
2.5. Development of Appropriate
Rehabilitation Strategies
Based on the interpretation of the mine
topography from the developed terrain models,
mineral composition and geotechnical
characteristics of tailing materials; several
rehabilitation alternatives for each modeled
section of the mine were suggested. SWOT
analysis was used to select the appropriate
rehabilitation options. Quantitative Strategic
Planning Matrix (QSPM) for the selected
strategies was developed to evaluate the options
in terms of their relative attractiveness. The three
March 2013. Vol. 2, No.3 ISSN 2305-8269
International Journal of Engineering and Applied Sciences © 2012 EAAS & ARF. All rights reserved
www.eaas-journal.org
62
most favorable rehabilitation options indicated by
the QSPM analysis were considered in the design
of the rehabilitation scenarios for the mine. Thus
three rehabilitation scenarios were developed
from the rehabilitation alternatives evaluated to be
most attractive in the five modeled mine
segments. ArcGIS® 9.3 software was used in the
representation of the designed rehabilitation plans
in the form of the maps.
3. RESULTS AND DISCUSSION
3.1. Physical Characteristic of Mine Waste
The grain size analysis for both tailings and spoil
showed that the materials comprised of grains
spanning from fine gravel, sand and silt to clay
particles, thus both materials were classified as
uniformly graded sands. The interpretation of the
steep slope gradient of the plotted gradational
curves for both tailings and spoil materials shown
in Fig.3 qualified the classification of these
materials as poorly graded or uniformly graded
sands. The calculated of greater than 6 (10.97
for tailings and 9.97 for spoils) and the ranging
between 1 and 3 (that is 1.09 for tailings and 1.14
for spoils) justified the classification of the mine
waste materials as well-graded sands. This was
also supported by the fact that both materials
comprise of less than 5% silt to clay particle sizes
(<63µm). The similarity of grains comprising
both tailings and spoil materials at Nyala Mine
can be interpreted from the similarity of the ploted
grain size distribution curves (see Fig.2).
Figure 2: Grain size distribution curves tailings and
spoil materials
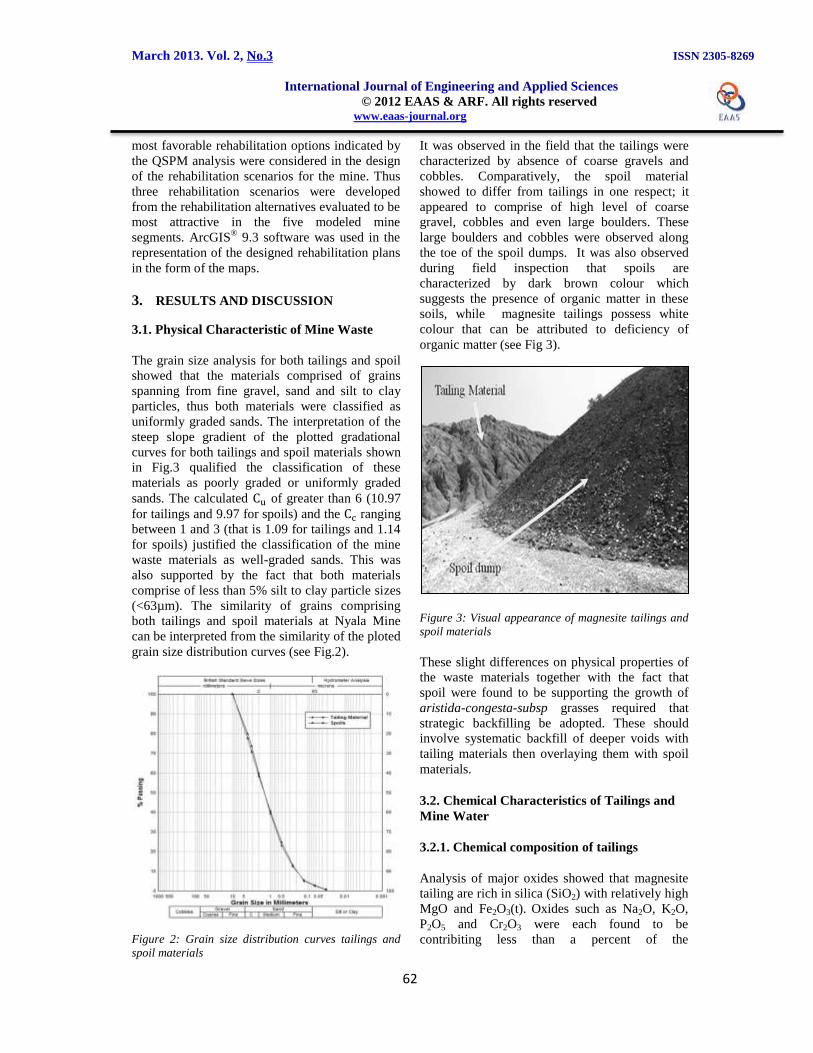
It was observed in the field that the tailings were
characterized by absence of coarse gravels and
cobbles. Comparatively, the spoil material
showed to differ from tailings in one respect; it
appeared to comprise of high level of coarse
gravel, cobbles and even large boulders. These
large boulders and cobbles were observed along
the toe of the spoil dumps. It was also observed
during field inspection that spoils are
characterized by dark brown colour which
suggests the presence of organic matter in these
soils, while magnesite tailings possess white
colour that can be attributed to deficiency of
organic matter (see Fig 3).
Figure 3: Visual appearance of magnesite tailings and
spoil materials
These slight differences on physical properties of
the waste materials together with the fact that
spoil were found to be supporting the growth of
aristida-congesta-subsp grasses required that
strategic backfilling be adopted. These should
involve systematic backfill of deeper voids with
tailing materials then overlaying them with spoil
materials.
3.2. Chemical Characteristics of Tailings and
Mine Water
3.2.1. Chemical composition of tailings
Analysis of major oxides showed that magnesite
tailing are rich in silica (SiO2) with relatively high
MgO and Fe2O3(t). Oxides such as Na2O, K2O,
P2O5 and Cr2O3 were each found to be
contribiting less than a percent of the

March 2013. Vol. 2, No.3 ISSN 2305-8269
International Journal of Engineering and Applied Sciences © 2012 EAAS & ARF. All rights reserved
www.eaas-journal.org
63
composition. The concentrations of major oxides
in tailings are presented in Table.1.
Table 1: Chemical characteristics of tailing materials
Composition Concentration (%)
SiO2 43.32
TiO2 2.22
Al2O3 3.99
Fe2O3(t) 11.43
MnO 0.15
MgO 20.56
CaO 3.74
Na2O 0.12
K2O 0.42
P2O5 0.15
Cr2O3 0.20
L.O.I. 13.70
Total 100
3.2.2. Chemical composition of mine water
The pH analysis of water revealed that the water
in Pit-I is strongly alkaline in nature; with the
average pH and the electrical conductivity values
of 9.20 and 2.30 mS/cm. The measured pH value
of water was found to be above Department of
Water Affairs (DWA) recommended range for
domestic (6.0 - 9.0), recreational (6.5 - 8.5) and
agricaltural (6.5 - 9.0) uses of water. The results
of analysis of anions and cations concentrations in
water are presented in Table 2. The water was
generally found to comprise of Cl-, Mg
2+, F
- and
K+
concentrations that are above the
recommended range for domestic use of water
(see Table 2).
Table 2: Chemical characteristics of mine water
Composition Concentrations (ppm)
Mine Water ïSTD (ppm)
F- 1.09 0-1.0
Cl- 169.6 0-100
NO3- 0.76 0-30
PO43-
-0.04 0-50
SO42-
0.71 0-0.1
Na+ 8.22 0-100
Ca2+
15.70 0-100
Mg2+
67.85 0-6
K+ 87.6 -
Fe3+
-0.27 0-200 ïDWA Standards for domestic use of water
The determined Cl- and F
- levels increase the
corrosive rate of the water and the potential to
cause slight mottling of dental enamel in sensitive
persons respectively. The detected concentration
of K (87.6 ppm) is undesirable for infants or
persons with renal diseases, while Mg (67.85
ppm) level has potential of introducing bitter
taste and scaling problems is the water is used as
drinking water by people.[9]
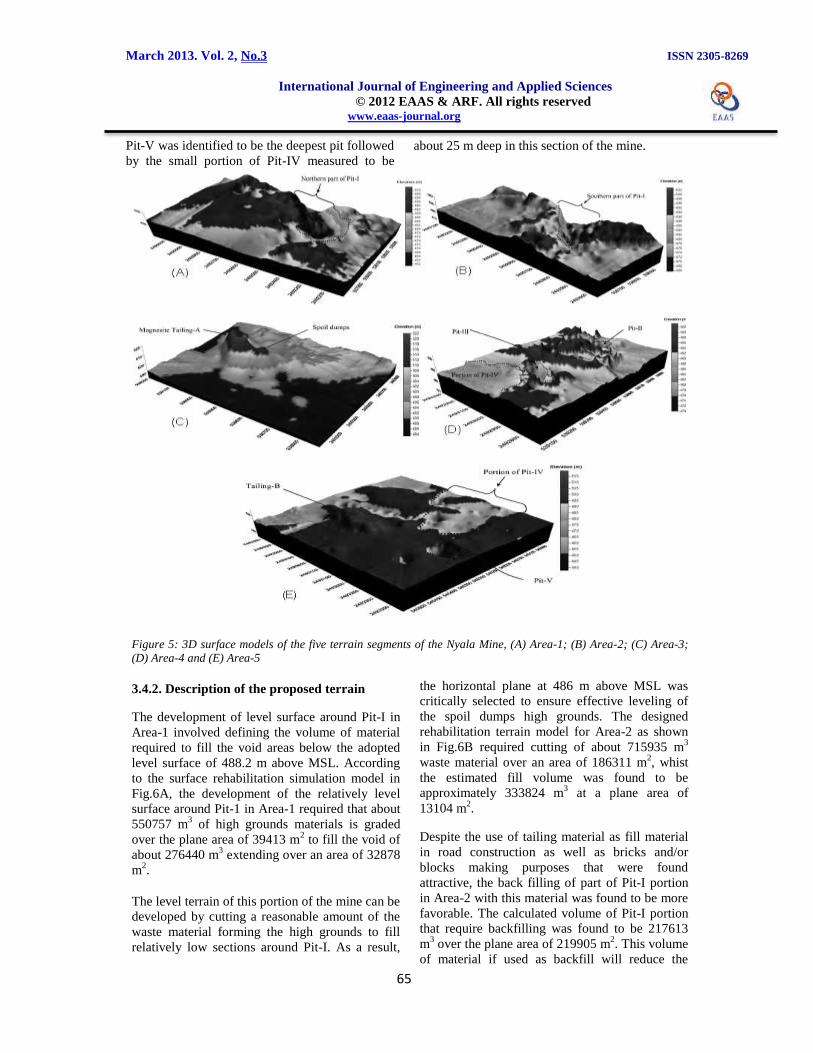
3.4. Modeling of the Historic Nyala Mine
Terrain
Terrain models of the Nyala Mine were developed
in five meaningful segments (denoted as Area-1
to Area-5) covering the mine lease area as shown
in Fig.4.

March 2013. Vol. 2, No.3 ISSN 2305-8269
International Journal of Engineering and Applied Sciences © 2012 EAAS & ARF. All rights reserved
www.eaas-journal.org
64
Figure 4: Areas delineated for landform modeling
3.4.1. Models description
Area-1 surface model covered an area of about
558103 m2 along the southern part of Pit-I. The
walls of Pit-I covered in the model were found to
be approximately 29 m high and attaining the
slope angles ranging from 14° to 44°. The spoil
dumps directly above the south east facing pit
walls added an extra height of about 14 m,
making the pit walls to be about 43 m high. The
surface model for Area-1 is presented in Fig.5A.
The determined volume of Pit-I void shown in the
model was estimated to be approximately
1323241 m3 over an area of 189903 m
2.
The 3D surface model of Area-2 covered the
south western portion of Pit-I and its surrounding
terrain. The model in Fig.5B shows extremely
rugged terrain around Pit-I portion and this can be
attributed to be due to relatively small excavations
as well as the carelessly dumped spoils material
found in the area. The walls of Pit-I portion
covered in the model attained the slope angle
ranging from 8° to 50° at the measured height of
20 to 36 m.
The central part of the mine (Area-3) is overlain
by a large volume of magnesite tailings denoted
as Tailing-A and few spoil materials (see Fig.5C).
The tailings and spoil materials were found to be
about 23 m high and covering an area of 56152
m2 above the estimated level surface defined by
an elevation of 499 m above MSL. Slope angles
maintained by the tailings material were estimated
to be between 8° to 38°. The terrain along the
north eastern part of Tailing-A appears rugged
due to scattered spoil materials while the south
western part is dominated by shallow excavations.
Area-4 portion of the mine is relatively flat with
minimum excavations and spoils dumps (see
Fig.5D). The modeled area of this part of the mine
extent over an area of approximately 551292 m2
and the major features covered by the model
include Pit-II, Pit-III and the portion of Pit-IV.
Areas of high grounds were only identified along
the central part of the model that is; between Pit-II
and Pit-III. Pit-II and Pit-III measured maximum
depths were found to be 20 m and 29 m
respectively. The spoil materials dumped directly
above the northern part of Pit-III highwalls
extended this wall to the maximum high of 27 m.
The last modeled portion of the mine (Area-5)
covered an area of about 297997 m2. The
prominent features in this area include Tailing-B,
Pit-V and half portion of Pit-IV (see Fig 5E). The
height of the dump was measured to be about 26
m above a level surface of 495 m above the MSL.
March 2013. Vol. 2, No.3 ISSN 2305-8269
International Journal of Engineering and Applied Sciences © 2012 EAAS & ARF. All rights reserved
www.eaas-journal.org
65
Pit-V was identified to be the deepest pit followed
by the small portion of Pit-IV measured to be
about 25 m deep in this section of the mine.
Figure 5: 3D surface models of the five terrain segments of the Nyala Mine, (A) Area-1; (B) Area-2; (C) Area-3;
(D) Area-4 and (E) Area-5
3.4.2. Description of the proposed terrain
The development of level surface around Pit-I in
Area-1 involved defining the volume of material
required to fill the void areas below the adopted
level surface of 488.2 m above MSL. According
to the surface rehabilitation simulation model in
Fig.6A, the development of the relatively level
surface around Pit-1 in Area-1 required that about
550757 m3 of high grounds materials is graded
over the plane area of 39413 m2 to fill the void of
about 276440 m3 extending over an area of 32878
m2.
The level terrain of this portion of the mine can be
developed by cutting a reasonable amount of the
waste material forming the high grounds to fill
relatively low sections around Pit-I. As a result,
the horizontal plane at 486 m above MSL was
critically selected to ensure effective leveling of
the spoil dumps high grounds. The designed
rehabilitation terrain model for Area-2 as shown
in Fig.6B required cutting of about 715935 m3
waste material over an area of 186311 m2, whist
the estimated fill volume was found to be
approximately 333824 m3 at a plane area of
13104 m2.
Despite the use of tailing material as fill material
in road construction as well as bricks and/or
blocks making purposes that were found
attractive, the back filling of part of Pit-I portion
in Area-2 with this material was found to be more
favorable. The calculated volume of Pit-I portion
that require backfilling was found to be 217613
m3 over the plane area of 219905 m
2. This volume
of material if used as backfill will reduce the
1
3
4

March 2013. Vol. 2, No.3 ISSN 2305-8269
International Journal of Engineering and Applied Sciences © 2012 EAAS & ARF. All rights reserved
www.eaas-journal.org
66
tailing and spoil dump volume from the estimated
223906 m3 (above the level surface of 500 m
above the MSL) to 6293 m3 that is sufficient for
the material use for road construction and blocks
making purposes. The filing of the portion of Pit-I
with Tailing-A material is expected to reduce Pit-I
volume by 15.8%.
Although Area-4 portion of the study area is
characterized by relatively flat landscape the need
for leveling spoil dumps around Pit-II and Pit-III
to fill and level the rugged portion of Pit-IV and
Pit-III was identified. Fig.6C illustrates the
portion of the ground to be cut above the designed
level surface around Pit-II to completely fill both
Pit-III and part of Pit-IV covered in the surface
model. The level surface that defines the Cut and
Fill volumes was developed at 491 m above MSL.
It was computed from the model that
approximately 451949 m3 (over the level surface
of 491.5 m above MSL) of material will have to
be moved to fill the relatively low grounds around
Pit-II. The total estimated fill volume was found
to be 971529 m3. The surface area occupied by
the cut volume was estimated to be approximately
206637 m2 while the fill volume area was
estimated to be 344655 m2.
The rehabilitation of Area-5 (see Fig.6D) terrain
was developed such that a cut volume of 862747
m3 is to be graded to fill a void of about 513244
m3. Without material compaction operation, about
349503.42 m3 of this material was determined as
an extra cut volume material. The rehabilitation of
the terrain in Area-5 involved complete filling of
Pit-IV and Pit-V with Tailing-B material and its
surrounding spoils. The material to be graded or
cut occupied an area of 188183 m2. On the other
hand, the area occupied by the fill volume
material was estimated to be 117813 m2.
Figure 6: 3D representation of the developed level terrain surfaces for rehabilitation of the mine site, (A) Area-1;
(B) Area-2; (C) Area-4 and (D) Area-5
3.5. Rehabilitation Options
The calculated sum total attractiveness score of
the selected rehabilitation alternatives in Area-1
showed that crop farming alternative is the most
attractive strategy, followed by the use of Pit-I as
pit-lake, and development of the site for
settlement purposes. It was observed that Area-2
portion of Pit-I covered in the model rarely
contain water and as a result, the construction of
pit-lake alternative was not selected for evaluation
in this area. Crop farming, site development for
settlement purposes and construction of Dirt Park
for BMX cycling purpose were found to be the

March 2013. Vol. 2, No.3 ISSN 2305-8269
International Journal of Engineering and Applied Sciences © 2012 EAAS & ARF. All rights reserved
www.eaas-journal.org
67
most attractive alternatives for the rehabilitation
of Area-2 (see Table 3).
Rehabilitation options selected for Area-3 focused
on addressing issues of environmental problems
and physical hazards associated with large
volume tailings and spoil materials covering the
lager part of the area. These options ranged from
doing nothing (no-action alternative), removal of
the dump by means of evaluating alternative use
of the tailings, and management of the dumps as
an alternative strategy for containing the hazards.
The results of the evaluation enabled
identification of three most attractive land uses for
Area-3, namely; (1) removal of the tailings
material and its subsequent use to backfill part of
Pit-I portion covered in Area-2, (2) utilization of
the tailings material as fill material in road
construction and (3) use of the material as
replacement of river sand in making of blocks or
bricks.
The use of Area-4 mine site for agricultural and
development purposes as well as the use of Pit-II
as landfill site for inert waste were found to be the
most favorable rehabilitation alternatives. The
rating of alternative rehabilitation strategies for
Area-5 showed the use of the site for livestock
grazing, agricultural purposes (crop land) and
development of the site for residential purposes
are the most attractive rehabilitation options.
3.5.1. Nyala Mine rehabilitation scenarios
The first scenario designed for rehabilitation of
the Nyala Mine was developed from the land use
alternatives with the highest attractiveness scores.
These alternatives include the development of the
site for crop farming purposes, pit-lake and inert
landfill construction. The second most attractive
rehabilitation options for individual mine terrain
segments were used to design the second
rehabilitation scenario. The rehabilitation
strategies suggested in Scenario-II included
cleaning up of the land for settlement and
industrial development purposes, livestock
grazing and construction of inert-landfill site, pit-
lake associated with picnic site.
Finally, the third rehabilitation scenario was
mainly developed using rehabilitation alternatives
selected as less attractive operations. The most
prominent options in Scenario-III were the
rehabilitation of the site to support development
and the construction of earth ramp dirt pack along
the north eastern part of the mine area. The
rehabilitation plans for the three designed
scenarios are presented in Fig. 7a, Fig.7b and
Fig.7c.
4. Conclusions
The characterization of mine waste and water,
together with terrain modeling proved to be robust
scientific techniques for making sound decision
on selection of appropriate rehabilitation
strategies for the historic Nyala Mine.
The physical characterization of the mine waste
showed that both tailings and spoil materials are
generally well-graded sands. These materials
were found to be suitable for engineering
purposes such as road construction, brick- and
block-making, and as fill material in foundation
building due to their uniform size gradation. The
high silica (SiO2) content in the tailing materials
coupled with the fact that silica is one of the
hardest minerals makes this resource more
suitable for engineering purposes.
Based on the outcome of interpretation of the
developed terrain models, several rehabilitation
alternative strategies for each modeled portion of
the mine were selected. The results of the SWOT
and QSPM analysis indicated that about 97% of
the total rehabilitation area in the first
rehabilitation scenario was favorable for cropland
development. It also emerged that about 62% and
78% of the total area will be more appropriate for
development of residential areas in the second and
third scenarios respectively. The alternative use of
Pit-I as pit-lake (in conjunction with picnic site in
scenario II) and Pit-II as a landfill site for inert
waste were proposed in all the rehabilitation
scenarios.
Cost estimation of these practical rehabilitation
strategies was recommended in order to ensure
that low-cost strategies are implemented at the
mine site.
5. Acknowledgement
This work was supported by the Mining
Qualification Authority (MQA) and the
University of Venda and it was carried out within
March 2013. Vol. 2, No.3 ISSN 2305-8269
International Journal of Engineering and Applied Sciences © 2012 EAAS & ARF. All rights reserved
www.eaas-journal.org
68
the framework of the IGCP/SIDA Project No. 606
“Addressing Environmental Health Impacts of
Major and Abandoned Mines in Sub-Saharan
Africa”. The authors are grateful to Mr. C.
Muzerengi and Mr. K. Chigayo for their
assistance in sample analysis.
6. References
[1] Squillace, M. (1990.). The Strip Mining
Handbook, Environmental Policy Institute.
p150.
[2] Spitz, K. and Trudinger, J. (2009). Mining
and Environment from Ore to Metal. Taylor
and Francis Group, Londan, UK, pp 816-841.
[3] Australian Government (2006), Mine
Rehabilitation, Leading Practice Sustainable
development Program for the Mining
Industry. Department of Industry Tourism
and resources, pp 77.
[4] Mhlongo, S.E. (2012). Development of a
Modeling Framework for Design of Low-
Cost and Appropriate Rehabilitation
Strategies for Nyala Abandoned Mine.
Unpublished MSc. Dissertation, University of
Venda, p 175.
[5] Kramers J.D., McCourt S. and van Reenen,
D.D. (2006). The Limpopo Belt. In: M.R.
Johnson, C.R. Anhaeusser, and R.J. Thomas,
(Ed.), The Geology of South Africa.
Geological Society of South Africa,
Johannesburg and the Council of
Geosciences, Pretoria, pp 209-239.
[6] Strydom J.H. (1998). Magnesite. In: M.G.C.
Wilson and C.R. Anhaeusser, The Mineral
Resource of South Africa, 6th
Edition,
Handbook 16. Council for Geosciences. pp
444-449.
[7] Herzberg W. (1976). Magnesite. In: C.B.
Coetzee, Mineral Resources of Republic of
South Africa, 4th
Edition. Government Print,
Pretoria, pp. 385-388.
[8] Surfer®8 User’s Guide (2002). Surfer
®8
Contouring and 3D Surface Mapping for
Scientists and Engineers. Golden Software,
Inc. Calorado, p 640.
[9] DWA: Department of Water Affairs
(1996). South African Water Quality
Guidelines (2nd
edition). Vol.1, Domestic
Use. pp 17, 47, 129.
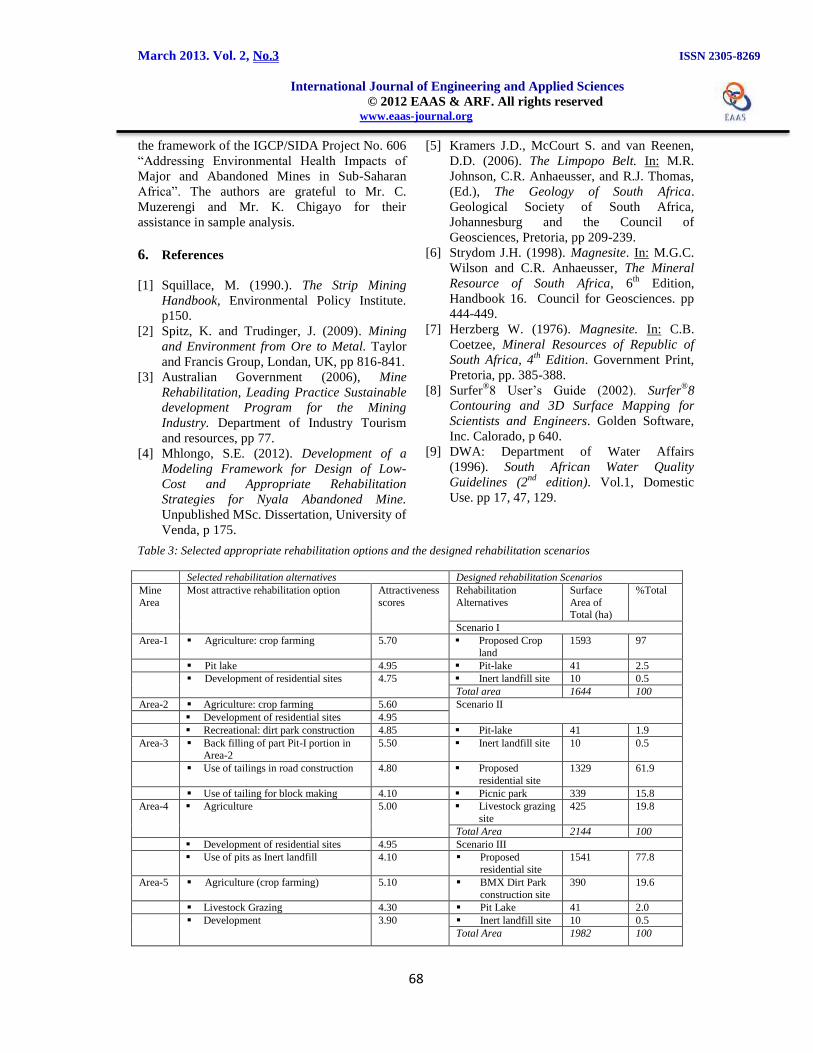
Table 3: Selected appropriate rehabilitation options and the designed rehabilitation scenarios
Selected rehabilitation alternatives Designed rehabilitation Scenarios
Mine
Area
Most attractive rehabilitation option Attractiveness
scores
Rehabilitation
Alternatives
Surface
Area of Total (ha)
%Total
Scenario I
Area-1 Agriculture: crop farming 5.70 Proposed Crop
land
1593 97
Pit lake 4.95 Pit-lake 41 2.5
Development of residential sites 4.75 Inert landfill site 10 0.5
Total area 1644 100
Area-2 Agriculture: crop farming 5.60 Scenario II
Development of residential sites 4.95
Recreational: dirt park construction 4.85 Pit-lake 41 1.9
Area-3 Back filling of part Pit-I portion in Area-2
5.50 Inert landfill site 10 0.5
Use of tailings in road construction 4.80 Proposed
residential site
1329 61.9
Use of tailing for block making 4.10 Picnic park 339 15.8
Area-4 Agriculture 5.00 Livestock grazing
site
425 19.8
Total Area 2144 100
Development of residential sites 4.95 Scenario III
Use of pits as Inert landfill 4.10 Proposed
residential site
1541 77.8
Area-5 Agriculture (crop farming) 5.10 BMX Dirt Park
construction site
390 19.6
Livestock Grazing 4.30 Pit Lake 41 2.0
Development 3.90 Inert landfill site 10 0.5
Total Area 1982 100

March 2013. Vol. 2, No.3 ISSN 2305-8269
International Journal of Engineering and Applied Sciences © 2012 EAAS & ARF. All rights reserved
www.eaas-journal.org
69
Figure 7a: Proposed mine site rehabilitation Plan I.
Figure 7b: Proposed mine site rehabilitation Plan II.

March 2013. Vol. 2, No.3 ISSN 2305-8269
International Journal of Engineering and Applied Sciences © 2012 EAAS & ARF. All rights reserved
www.eaas-journal.org
70
Figure 7c: Proposed mine site rehabilitation Plan III.