independent complaints directorate
DESCRIPTION
INDEPENDENT COMPLAINTS DIRECTORATE. Presentation to the Portfolio Committee on Safety and Security 16 March 2007. Introduction. Mr P Mongwe. PROGRAMME 1 : Administration. Mr E Valoyi. STAFF COMPLEMENT. Growth: Additional 17 (7%) more positions for 2007\2008 financial year. - PowerPoint PPT PresentationTRANSCRIPT

INDEPENDENT COMPLAINTS DIRECTORATE
Presentation to the Portfolio Committee on Safety and Security
16 March 2007

2
Introduction
Mr P Mongwe

3
PROGRAMME 1 : Administration
Mr E Valoyi

4
STAFF COMPLEMENT
OFFICE APPROVED POSTS 2006/2007 2007/2008
Vacancies as at 28 February 2007
National Office 80 83 2(P3)
Gauteng 22 23 3(P1)
Limpopo 16 17 1(P3)
Eastern Cape 16 20 0
Western Cape 20 20 0
Northern Cape 13 14 0
Mpumalanga 14 15 1(P3)
KZN 20 25 1(P3)
North West 16 16 0
Free State 14 15 0
TOTAL 231 248 8 (3.5%)
Growth: Additional 17 (7%) more positions for 2007\2008 financial year

5
STAFF COMPLEMENT (CONT…)
2006/2007 2007/2008(35%) 80 = H/O (33%) 83 = H/O(65%) 151 = Provinces (67%)165 = Provinces Total: 231 Total: 248

6
NEW POSTS AS FROM 1/04/2007
• National Office 3
• Provinces 14
Total 17
Breakdown of posts per Office
National Office 3
KZN 5
Gauteng 1
Eastern Cape 4
Limpopo 1
Mpumalanga 1
Free State 1
Northern Cape 1
Total 17

7
AUDITOR GENERAL’S CONCERNS: 2005/2006
• SCM Policy approved and implemented as from 1 April 2006• All staff members were trained in respect of the SCM procedures• Follow-up SCM training to be arranged in 2007• SCM framework being implemented in parts• Discrepancies in terms of leave mostly experienced by the Provinces• Quarterly meetings of the Administrative Forum used for training on
leave matters• Monthly reports used by Responsibility Managers for monitoring and
reporting on leave

8
AUDIT GENERAL’S CONCERNS: 2005/2006 (Cont…)
• HRM to perform annual inspections• Human Resource Plan was revised in line with the
Public Service Regulations

9
PROGRAMME 2 :Investigation of Complaints
Mr T Tshabalala

10
Strategic objectivesIndicator Target
Finalized internal investigations in respect of Class 1 (deaths) within 180 days
60% of notifications received from SAPS/MPS
Finalized internal ICD investigations of Class III (criminal offences) within 180 days
50% of complaints received from SAPS/MPS
Finalized internal ICD investigations of Class IV (misconduct) within 90 days
60% of complaints

11
Finalized cases (Backlog)
Province Class I Class II Class III Class IV Total Percentage
Eastern Cape 98 5 103 155 361 7%
Limpopo 301 22 456 474 1253 26%
Mpumalanga 292 32 36 72 432 9%
Gauteng 4 13 30 21 68 1%
Northern Cape 20 32 197 268 517 11%
Western Cape 74 25 151 574 824 17%
North West 25 2 138 287 452 9%
Free State 7 38 26 21 92 2%
KZN 105 48 220 522 895 18%
Total 926 217 1357 2394 4894 100%

12
Finalized cases – Current financial year
Province Class I Class II Class III Class IV Total Percentage
Eastern Cape 47 2 45 29 123 14%
Limpopo 14 9 33 69 125 15%
Mpumalanga 10 0 13 34 57 7%
Gauteng 11 2 8 3 24 3%
Northern Cape 5 2 24 40 71 8%
Western Cape 58 0 67 12 137 16%
North West 24 9 44 157 234 27%
Free State 6 0 15 10 31 4%
KZN 38 0 12 9 59 7%
Total 213 24 261 363 861

13
Finalized cases: Total per province
Province Class I Class II Class III Class IV Total Percentage
Eastern Cape 145 7 148 184 484 6%
Limpopo 315 31 489 543 1378 16%
Mpumalanga 302 32 49 106 489 6%
Gauteng 15 15 38 24 92 1%
Northern Cape 25 34 221 308 588 7%
Western Cape 132 25 218 586 961 11%
North West 49 11 182 444 686 7%
Free State 13 38 41 31 123 1%
KZN 2914 8 282 759 3963 45%
Total 3910 201 1668 2985 8764
Percentages 45% 2% 19% 34%

14
Closed cases: Unsubstantiated
Province Class I Class II Class III Class IV Total Percentage
Eastern Cape 70 6 111 142 329 16%
Limpopo 32 3 67 149 251 12%
Mpumalanga 9 0 6 22 37 2%
Gauteng 16 13 66 57 152 7%
Northern Cape 12 5 87 71 175 9%
Western Cape 35 9 71 256 371 18%
North West 42 4 98 239 383 19%
Free State 11 0 71 123 205 10%
KZN 79 3 27 31 140 7%
Total 306 43 604 1090 2043

15
Closed cases: Substantiated
Province Class I Class II Class III Class IV Total Percentage
Eastern Cape 17 10 18 22 67 8%
Limpopo 4 3 12 9 28 3%
Mpumalanga 1 0 6 7 14 2%
Gauteng 10 19 21 29 79 10%
Northern Cape 5 3 39 43 90 11%
Western Cape 14 11 64 171 260 32%
North West 11 7 18 142 178 22%
Free State 15 0 18 19 52 6%
KZN 30 0 1 7 38 5%
Total 107 53 197 449 806

16
Closed cases: Dismissed
Province Class I Class II Class III Class IV Total Percentage
Eastern Cape 2 0 5 24 31 4%
Limpopo 0 3 37 58 98 13%
Mpumalanga 0 0 10 15 25 3%
Gauteng 1 6 28 5 40 5%
Northern Cape 0 1 17 15 33 4%
Western Cape 7 6 91 272 376 50%
North West 0 4 42 88 134 18%
Free State 0 0 2 6 8 1%
KZN 0 0 0 0 0 0%
Total 10 20 232 483 745

17
Closed cases: Unfounded
Province Class I Class II Class III Class IV Total Percentage
Eastern Cape 0 0 0 1 1 0%
Limpopo 0 0 3 8 11 5%
Mpumalanga 0 0 2 9 11 5%
Gauteng 2 1 8 5 16 7%
Northern Cape 0 0 3 13 16 7%
Western Cape 13 14 21 128 176 76%
North West 0 0 0 0 0 0%
Free State 0 0 0 0 0 0%
KZN 0 0 0 0 0 0%
Total 15 15 37 164 231

18
Closed cases: Withdrawn
Province Class I Class II Class III Class IV Total Percentage
Eastern Cape 1 0 2 3 6 2%
Limpopo 0 0 4 0 4 1%
Mpumalanga 0 0 1 3 4 1%
Gauteng 0 3 17 11 31 10%
Northern Cape 3 9 86 60 158 53%
Western Cape 0 11 12 39 62 21%
North West 1 3 15 10 29 10%
Free State 0 3 0 0 3 1%
KZN 0 0 0 0 0 0%
Total 5 29 137 126 297

19
Closed cases: Resolved
Province Class I Class II Class III Class IV Total Percentage
Eastern Cape 0 0 0 13 13 3%
Limpopo 0 0 5 10 15 4%
Mpumalanga 0 0 1 4 5 1%
Gauteng 0 0 1 2 3 1%
Northern Cape 1 1 144 68 214 57%
Western Cape 0 1 7 114 122 32%
North West 1 0 0 0 1 0%
Free State 0 3 0 0 3 1%
KZN 0 0 0 0 0 0%
Total 2 5 158 211 376

20
Closed cases: Total per province
Province Class I Class II Class III Class IV Total Percentage
Eastern Cape 90 16 136 205 447 10%
Limpopo 36 9 128 234 407 9%
Mpumalanga 10 0 26 60 96 2%
Gauteng 29 42 141 109 321 7%
Northern Cape 21 19 376 270 686 15%
Western Cape 69 52 266 980 1367 30%
North West 55 18 173 479 725 16%
Free State 26 6 91 148 271 6%
KZN 109 3 28 38 178 4%
Total 445 165 1365 2523 4498
Percentages 10% 4% 30% 56%

21
Post Mortems
Province Attended Not Attended Total Percentage
Eastern Cape 33 1 34 97%
Limpopo 32 0 32 100%
Mpumalanga 16 0 16 100%
Gauteng 99 12 111 89%
Northern Cape 6 0 6 100%
Western Cape 39 28 67 58%
North West 28 12 40 70%
Free State 20 6 26 77%
KZN 33 3 36 92%
Total 306 62 368 83%

22
Scenes
Province Attended Not Total Percentage
Eastern Cape 36 8 44 82%
Limpopo 48 0 48 100%
Mpumalanga 22 1 23 96%
Gauteng 112 3 115 97%
Northern Cape 7 0 7 100%
Western Cape 60 13 73 82%
North West 14 15 29 48%
Free State 24 3 27 89%
KZN 85 7 92 92%
Total 408 50 458 89%

23
Recommendations - DPP
Province Class I Class II Class III Class IV Total Percentage
Eastern Cape 37 0 17 0 54 12%
Limpopo 46 1 8 0 55 13%
Mpumalanga 4 0 3 0 7 2%
Gauteng 16 0 1 0 17 4%
Northern Cape 12 0 150 0 162 37%
Western Cape 61 2 4 1 68 16%
North West 8 0 8 0 16 4%
Free State 5 0 0 0 5 1%
KZN 24 0 28 0 52 12%
Total 213 3 219 1 436

24
Court attendance
Province Class I Class II Class III Class IV Total Percentage
Eastern Cape 20 0 3 1 24 6%
Limpopo 82 0 1 0 83 21%
Mpumalanga 37 0 3 0 40 10%
Gauteng 20 0 0 0 20 5%
Northern Cape 2 2 14 0 18 4%
Western Cape 18 0 0 0 18 4%
North West 11 0 17 0 28 7%
Free State 38 0 4 0 42 10%
KZN 87 2 36 3 128 32%
Total 315 4 78 4 401

25
Recommendations – SAPS/ MPS
Province Class I Class II Class III Class IV Total Percentage
Eastern Cape 7 0 9 1 17 3%
Limpopo 1 5 2 3 11 2%
Mpumalanga 0 1 1 0 2 0%
Gauteng 11 0 2 2 15 2%
Northern Cape 7 1 4 6 18 3%
Western Cape 3 0 7 1 11 2%
North West 31 13 122 303 469 75%
Free State 18 44 4 5 71 11%
KZN 12 0 2 1 15 2%
Total 90 64 153 322 629

26
Disciplinary hearings
Province Class I Class II Class III Class IV Total Percentage
Eastern Cape 1 0 0 0 1 2%
Limpopo 8 2 1 0 11 21%
Mpumalanga 0 0 0 0 0 0%
Gauteng 6 0 1 0 7 13%
Northern Cape 2 0 2 1 5 9%
Western Cape 2 0 0 0 2 4%
North West 0 0 0 0 0 0%
Free State 3 0 2 0 5 9%
KZN 12 0 9 1 22 42%
Total 34 2 15 2 53

27
Anti-Corruption Command (ACC)In the 2006/7 financial year
– A staff complement of 4 posts– Provide services in provinces
• Received 64 cases of corruption by SAPS/MPS– 31 substantiated– 33 closed as unsubstantiated/unfounded– 24 investigations continuing– 2 cases in court– 1 dept. case o/standing for collusion in escape– 2 await DPP decision & 1 DPP declined prosecution– I female EMPS dismissed dept. for accepting a bribe
• Project investigation on missing firearms from DMPS

28
High profile investigations• Some of the instances of abuse of power
– SAPS Warrenton: An Inspector is out on bail and faces a charge of rape of a suspect at the police station. DNA results outstanding
– SAPS Volksrust: A female suspect arrested for drunkenness; was incarcerated in a male holding cell where she was repeatedly raped by more than 4 inmates; 2 members are on suspension for the incident

29
ConvictionsProvince Class I Class II Class III Class IV Total Percentage
Eastern Cape 1 0 0 2 3 5%
Limpopo 6 0 0 0 6 9%
Mpumalanga 0 0 1 0 1 2%
Gauteng 3 0 0 0 3 5%
Northern Cape 2 0 4 0 6 9%
Western Cape 3 0 0 0 3 5%
North West 8 3 11 20 42 65%
Free State 1 0 0 0 1 2%
KZN 0 0 0 0 0 0%
Total 24 3 16 22 65

30
Acquittals
Province Class I Class II Class III Class IV Total Percentage
Eastern Cape 0 0 0 0 0 0%
Limpopo 9 0 3 0 12 20%
Mpumalanga 0 0 0 0 0 0%
Gauteng 3 0 0 0 3 5%
Northern Cape 3 0 1 4 8 13%
Western Cape 1 0 0 0 1 2%
North West 9 3 9 3 24 40%
Free State 1 0 3 0 4 7%
KZN 5 1 2 0 8 13%
Total 31 4 18 7 60

31
Investigative training
Two training sessions were conductedSeptember 2006
• 29 investigators trained in basic investigations skills such as crime scene management, statement taking, report writing, etc
February 2007• 68 investigators attended training on
– Database– Financial investigations – presented by AFU– Role and prevention of money laundering and corruption
presented by Financial intelligence Centre

32
Priorities - 2007/8
• Upgrading salaries of investigators• Establish 2 satellite offices (Richards Bay and Mthatha) • Implementation of the revised targets developed from
the business process project• Review all Standard Operating Procedures• Review Protocol with MPS re investigation of criminal
offences• Compilation of an investigation manual for newly
appointed investigators

33
PROGRAMME 3:Information Management System
Ms N Sihlezana

34
OBJECTIVE
Information Management and Research is to maintain a current complaints register, allocate and follow – up on cases and oversee the implementation of DVA and analyze all information on the database, producing at least 3 reports (2 – research reports and 1 – workshop) annually recommending interventions to enhance human rights focused service delivery in policing.
Further, to improve the management of information through technology and the dissemination of information in order to market the organization to various stakeholders

35
PERFORMANCE 2006/2007
1. COMPLAINTS CASE INTAKE:
- 80% of new cases are captured and processed within 48 hours- Improvement on feedback to clients; from 30 days to 7 days- Streamlined business process project which was conducted during August
to November 2006, resulting in an improved updating of the database; from 60% to 75%
- All line staff in the provinces (both investigators and case analysts) were trained on the complaints registry process, database management, registering cases on the database, and, the training is still continuing on an ad hoc basis and on an one-on-one basis.
36
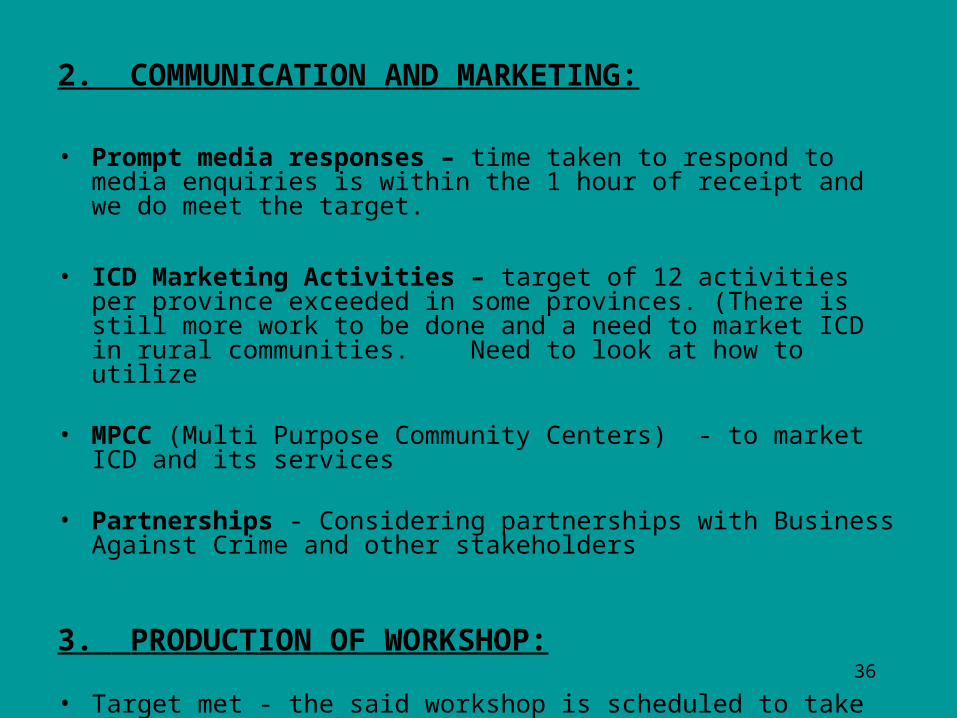
2. COMMUNICATION AND MARKETING:
• Prompt media responses – time taken to respond to media enquiries is within the 1 hour of receipt and we do meet the target.
• ICD Marketing Activities – target of 12 activities per province exceeded in some provinces. (There is still more work to be done and a need to market ICD in rural communities. Need to look at how to utilize
• MPCC (Multi Purpose Community Centers) - to market ICD and its services
• Partnerships - Considering partnerships with Business Against Crime and other stakeholders
3. PRODUCTION OF WORKSHOP: • Target met - the said workshop is scheduled to take place on 28 March 2007

37
4. PROACTIVE OVERSIGHT 2006/ 2007:
4.1 ResearchProduction of qualitative reports containing recommendations – target metTwo research reports have been conducted.
The first research report was done byICD. The topic of the research report: Investigation of deaths as a result of police actionin KwaZulu-Natal, Gauteng and the Eastern Cape
Rationale of the research – although the last few years have witnessed asignificant decline in deaths as a result of police action and deaths in police custody thenumber of such deaths remained relatively high in the 3 provinces
Findings – will be discussed in the workshop on 28th March 2007
The second research report is done by ICD in collaboration with the ISS. We are stillBusy with the research which should be completed by April 2007. The topic of theResearch: Compliance with ICD recommendation by the SAPS
38
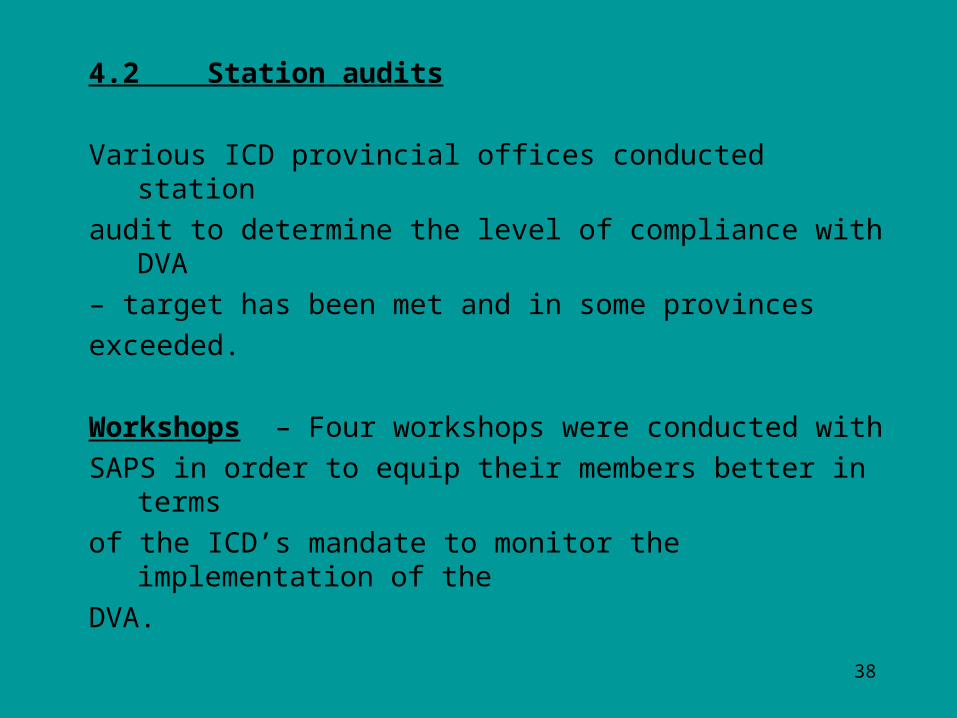
4.2 Station audits
Various ICD provincial offices conducted stationaudit to determine the level of compliance with DVA – target has been met and in some provincesexceeded.
Workshops – Four workshops were conducted withSAPS in order to equip their members better in termsof the ICD’s mandate to monitor the implementation of theDVA.

39
5. MONITORING THE IMPLEMENTATION OF THE DVA:
100% applications for exemption (DVA) processed within 30 days of receipt
100% of DVA cases of non-compliance processed and monitored
During this calendar year the ICD received 46 cases of non-compliance during the first semester and 58 cases during the second semester It is interesting to note that whilst a number of such cases of non-compliance were recorded across all provinces, a minimal number of applications for exemption, from internal prosecution, was received
Both reports have been produced and the report with regard to the second semester will soon be tabled

40
INFORMATION TECHNOLOGY (IMS)
6. IMPROVED FEEDBACK TO COMPLAINANTS:• (In the process to link “SMS’s” with the Case Management System.
Complainants will be contacted through cell phone “sms’s” with regard to the progress on their cases rather than phoning them or calling them to the office)
• Remote electronic connection for Investigators and staff (Sought to empower investigators by taking statements and printing
it in the field)• Intranet – We have finalized the intranet and it will go live in April
2007. This tool will enhance communication between the National Office and the Provincial offices and vice versa

41
OVERVIEW – CASES REGISTERED 2006/2007
42
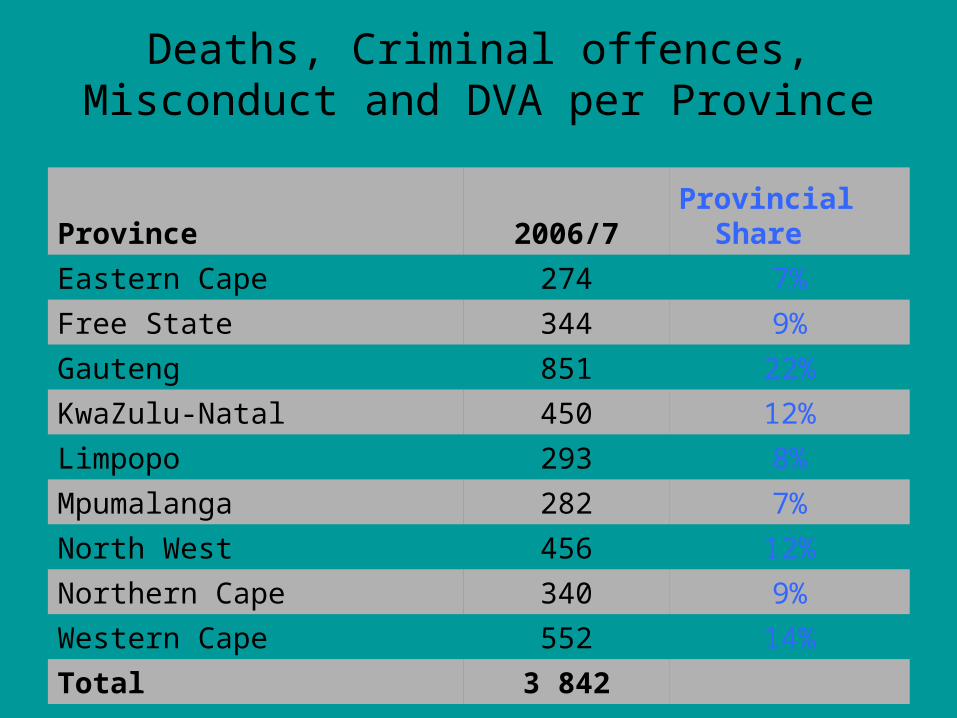
Deaths, Criminal offences, Misconduct and DVA per Province
Province 2006/7 Provincial Share
Eastern Cape 274 7%
Free State 344 9%
Gauteng 851 22%
KwaZulu-Natal 450 12%
Limpopo 293 8%
Mpumalanga 282 7%
North West 456 12%
Northern Cape 340 9%
Western Cape 552 14%
Total 3 842

43
Deaths, Criminal offences, Misconduct and DVA Yearly change
Province 2005/6 2006/7 Yearly change
Eastern Cape 275 274 -0.4%
Free State 426 344 -23.8%
Gauteng 785 851 7.8%
KwaZulu-Natal 497 450 -10.4%
Limpopo 301 293 -2.7%
Mpumalanga 265 282 6%
North West 358 456 21.5%
Northern Cape 276 340 18.8%
Western Cape 915 552 -65.8%
Total 4098 3 842 -6.7%

44
Case Intake per Classification
Case type 2006/7 Class share
Death 535 14%
DVA 117 3%
Criminal 1 242 32%
Misconduct 1 948 51%
Total 3 842

45
Case Type - yearly change
Class 2005/6 2006/7 Change
Death 482 535 10%
DVA 25 117 79%
Criminal 1265 1 242 -2%
Misconduct 2326 1 948 -19%
Total 4098 3 842 -7.8%

46
Deaths - yearly change
Province 2005/6 2006/7 Yearly change
Eastern Cape 73 59 -24%
Free State 45 43 -5%
Gauteng 111 129 14%
KwaZulu-Natal 102 122 16%
Limpopo 31 46 33%
Mpumalanga 30 25 -20%
North West 32 40 20%
Northern Cape 13 10 -30%
Western Cape 45 61 26%
Total 482 535 10%

47
Criminal offences
Province 2006/7 Provincial %
Eastern Cape 77 6%
Free State 120 10%
Gauteng 311 25%
KwaZulu-Natal 133 11%
Limpopo 79 6%
Mpumalanga 71 6%
North West 103 8%
Northern Cape 116 9%
Western Cape 232 19%
Total 1242

48
Criminal offences - yearly changeProvince 2005/6 2006/7 Yearly change
Eastern Cape 67 77 13%
Free State 182 120 -52%
Gauteng 259 311 17%
KwaZulu-Natal 134 133 -1%
Limpopo 96 79 -22%
Mpumalanga 73 71 -3%
North West 103 103 0%
Northern Cape 90 116 22%
Western Cape 261 232 -13%
Total 1265 1242 -2%

49
Misconduct
Province 2006/7 Percentage share
Eastern Cape 128 7%
Free State 154 8%
Gauteng 400 21%
KwaZulu-Natal 188 10%
Limpopo 158 8%
Mpumalanga 181 9%
North West 304 16%
Northern Cape 198 10%
Western Cape 237 12%
Total 1948

50
Misconduct - yearly change
Province 2005 2006 Yearly Change
Eastern Cape 135 128 -5%
Free State 192 154 -25%
Gauteng 415 400 -4%
KwaZulu-Natal 261 188 -39%
Limpopo 173 158 -9%
Mpumalanga 162 181 10%
North West 213 304 30%
Northern Cape 172 198 13%
Western Cape 603 237 -154%
Total 2326 1948 -19%

51
PRIORITIES 2007/2008• ICD Ten Year Celebrations
ICD will be celebrating its ten years of existence on 01/04/2007• Research Workshop
On 28th April 2007 the ICD will host a workshop on the research findings - recently completed
Envisage to join SAPS in the implementation of a designed strategy geared towards decreasing deaths in police custody or as a result of police action
• DVA
Conduct research especially in terms of the DVA to provide a basis for the implementation of lessons and, breaking the barrier of the “culture of silence” around domestic violence

52
• Implementation of Portfolio Committee’s recommendations on DVA, cell inspections and station audits
• Cell Inspections and Station Audits Deployment of Monitors to facilitate cell inspections and
stations audits, and tasking some Investigators to investigate DVA cases
• Forging relationships with NGO’s that deal with Domestic Violence
• Increased Communication Protocols - SAPS/MPS Strengthen the existing relationship with SAPS
Improve coordination of station audits and MPS through effective communication

53
CHALLENGES
• Review classification system and capacity of the database to meet the needs of the changing statistical environment
• Fostering better and coordinated relationships with Social Crime Prevention Stakeholders with the purpose of strengthening cooperation around the ICD’s DVA mandate

54
• Ensure access to and sharing of knowledge resources amongst ICD staff
• Production of quality research recommendations which are “cutting edge” and innovative
• Establish a knowledge management system in order to facilitate the accessing and sharing of knowledge resources
• Revamping ICD Internet - so that we can use it as a platform for marketing ICD nationally

55
Financial Statements
Ms E Verster

56
Financial year 2006/7Budget and Expenditure per Programme
to 31 December 2006
Programme Budget
R ‘000
Expenditure (Including
commitments)
R ‘000
Percentage of total
expenditure
Number of posts
1 Administration 22 777 17 566 35% 63
2 Investigations 29 058 22 290 44% 101
3 Compl. Reg. Mon. & Research
14 071 10 787 21% 67
TOTAL 65 906 50 643 (76,8%) 231

57
Expenditure per Economic ClassificationComparison between 2005/6 and 2006/7
Economic Classification Expenditure for 2005/6
R `000
Budget for 2006/7
R `000
Expenditure for 2006/7 (31/12/06)
R `000
Current payment:- Compensation- Goods & services, Others
30 23515 257
39 55924 411
27 42220 522
Transfers & Subsidies-Provincial & Municipal-Dept agencies
9135
2540
25
Capital assets-Buildings & fixed assets- Equipment- Software
5752 618
4251 729
1422 000
674
TOTAL 49 236 65 906 50 643

58
Expenditure on certain Goods and ServicesComparison between 2005/6 and 2006/7
2005/6
R ‘000
2006/7(31/12/06)
R ‘000
Advertising 692 414Consultants, Contractors & S/Services 1 459 1 094
Printing & publications 36 82
Resettlement cost 190 238
Leasehold property 392 3 518
Travel & subsistence 4 128 5 024
Venues & facilities 174 111Bursaries 128 32Government Motor Transport 1 637 2 386

59
Expenditure: Travel and Subsistence per OfficeComparison between 2005/6 and 2006/7
Office
(Staff structure VS Investigators)
2005/6
R `000
2006/7(31/12/06)
R`000
National Office 80 – 6 1 195 2 230
Eastern Cape 16 – 6 438 607Free State 14 – 6 265 653
Gauteng 22 – 11 176 367
KwaZulu-Natal 20 – 11 393 666Limpopo 16 – 7 329 655
Mpumalanga 14 – 6 275 347Northern Cape 13 – 5 279 624
North West 16 – 6 382 499Western Cape 20 - 9 396 765

60
Qualified Report from the Auditor-General
- Much progress has been made to date- Interim AG Report confirms improvement
1 Clearing of Suspense Accounts• Attention is now given to clear the last of the outstanding R1,2 million of the Disallowance Miscellaneous Account, viz R 326 000, before the close
of the current financial year

61
Qualified Report from the Auditor-General (cont…)
2 Staff debtors• 25 debtors were raised during October 2005 due to the clearing of the Conversion Accounts. A few more debts were
registered since 2006 • Ten debtors have been traced through the Government
Pension Fund and letters were sent for collecting the debts• One submission for the writing-off of a debt has been put to the
Programme Manager: Investigations, for his recommendation• Four other debts have been written-off earlier in the financial year and another nine is in the process of being written off • Ten debtors still need to be traced

62
Budgetary allocationComparing growth in budget from 2005/6 to 2007/8
Programme 2005/6
ExpenditureR `000
2006/7
BudgetR `000
2007/8
BudgetR `000
1 Administration 21 743 22 777
(5%)
29 499
(36%)
2 Investigations 21 283 29 058
(36%)
35 663
(67%)
3 Compl. Reg. Mon & Research
11 480 14 071
(22%)
15 729
(37%)
Total 54 506 65 906
(21%)
80 891
(48%)

63
Financial year: 2007/8 Budget: Satellite offices
Requested R 28 million - to open 12 satellite officesReceived R 3,9 million - could open at least one s/office
Reviewed the proposed staff structure: Reduced 7 members to 4 members
Results: Less expenditure in terms of:• Compensation of Employees• Accommodation• Furniture/equipment and vehicles• S & T and other expenditure on goods and services• Opening 2 satellite offices

64
Thank you
Questions ?