independent evaluation of unosat rapid mapping service
TRANSCRIPT

1
FINAL REPORT

ii
This report is a product of the Planning, Performance Monitoring, and Evaluation Unit of UNITAR and the findings, conclusions and recommendations expressed therein do not necessarily reflect the opinion of the partners of the UNOSAT Rapid Mapping Service. The evaluation was conducted by Dr. Achim Engelhardt. The designation employed and the presentation of material in this publication do not imply the expression of any opinion whatsoever on the part of the United Nations Institute for Training and Research (UNITAR) concerning the legal status of any country, city or area or its authorities or concerning the delimitation of its frontiers or boundaries.

iii
This page left blank.

iv
This page left blank.

v
Table of contents
List of acronyms and abbreviations ......................................................................... viii Preface...................................................................................................................... x Executive summary ................................................................................................... xi Section I: Introduction ................................................................................................ 1 1.1 Background of the Rapid Mapping Service ............................................ 1
1.2 Evaluation background and purpose ...................................................... 3
1.3 Evaluation methodology and approach .................................................. 3
1.4 Reconstructed Theory of Change of the Rapid Mapping Service ........... 8
Section II: Findings .................................................................................................. 11 2. Relevance: Is the UNOSAT Rapid Mapping Service doing the right thing?.......... 11 2.1 Alignment to UN Sustainable Development Goals ............................... 11
2.2 Alignment to UNITAR’s mandate, strategy and results framework ....... 13
2.3 Relevance for the donor ....................................................................... 13
2.4 Relevance for countries’ and partners’ needs ...................................... 14
2.5 The validity of the Theory of Change .................................................... 16
3. Efficiency: were resources used appropriately to achieve results? ...................... 17 3.1 Cost efficiency in comparison with alternative approaches ................... 17
3.2 Alternatives to UNOSAT Rapid Mapping Service ................................. 19
3.3 Appropriateness of partnership modalities ........................................... 19
3.4 Timeliness of the Raping Mapping Service .......................................... 21
4. Effectiveness: Were the Service’s results achieved and how?............................. 23 4.1 Achievement of the service’s objectives ............................................... 23
4.2 Factors affecting service’ performance ................................................. 26
4.2.1 Strengths, weaknesses, opportunities and threats ............................... 28
4.3 Contribution to support analysis and interpretation of maps ................. 30
4.4 User satisfaction .................................................................................. 32
5. Impact: What change did the Service bring about? .............................................. 34 5.1 The difference made to partners' and end beneficiaries' work in humanitarian assistance: impact resulting from the Service .................................... 34
5.2 Cumulative effects of the Service ......................................................... 35
5.3 What would have happened if the Service did not exist? ...................... 37
5.3.1 Stakeholders ability for decision making and operational coordination . 38
5.3.2 Effects on the timeliness ...................................................................... 38
5.3.3 Effects on costs .................................................................................... 38
6. Sustainability: Are results lasting? ....................................................................... 40 6.1 Sustainability of business model .......................................................... 40
6.2 Contribution to better humanitarian assistance in the long-term ........... 43
6.3 Factors affecting sustainability ............................................................. 43
Section III: Conclusions and recommendations ....................................................... 44 7. Conclusions ......................................................................................................... 44

vi
8. Recommendations .............................................................................................. 45 9. Lessons learned .................................................................................................. 46 Annex A: Terms of Reference ................................................................................. 50 Annex B: Survey/questionnaires deployed .............................................................. 58 Annex C: List of persons interviewed ...................................................................... 64 Annex D: List of documents reviewed ..................................................................... 65 Annex E: Evaluation questions matrix ..................................................................... 67 Annex F: Evaluation consultant agreement form ..................................................... 70 Annex G: Dashboard of key findings by evaluation criteria and main evaluation questions ................................................................................................................. 71 Annex H: Examples of Rapid Mapping Service products for the selected country cases ...................................................................................................................... 74 Annex I: Audit Trail: Comments by UNOSAT Management ..................................... 78

vii
Table of figures
Figure 1: Infographic: External evaluation of UNOSAT Rapid Mapping Service ........ ix
Figure 2: Operational framework for Rapid Mapping. ................................................ 2
Figure 3: Legend for color coding used for results assessment ................................. 5
Figure 4: Overview of geographic location of activations used .................................. 6
Figure 5: Reconstruction of the Theory of Change for the Rapid Mapping Service .... 8
Figure 6: Theoretical effects of the Rapid Mapping Service ..................................... 12
Figure 7: Stakeholder perception about the relevance of the Rapid Mapping Service for SDG 11.5 and 13.1 ..................................................................................... 12
Figure 8: Relevance of Rapid Mapping Service to countries’ and partners’ needs in percentage ...................................................................................................... 14
Figure 9: Use of specific products/services of the UNOSAT Rapid Mapping Service ........................................................................................................................ 15
Figure 10: Cost per activation – comparison between UNOSAT Rapid Mapping Service and Copernicus Emergency Mapping Service for 2016 and 2017 (in Euro) ............................................................................................................... 18
Figure 11: Appropriateness of partnership modalities .............................................. 20
Figure 12: Timeliness of UNOSAT Rapid Mapping Service for evidence-based decision making in Percentage ........................................................................ 21
Figure 13: Timeliness of Rapid Mapping Service for evidence-based decision making - country-level results in Percentage ................................................................ 22
Figure 14: Contribution of Rapid Mapping Service to decision-making and operational cooperation (in Percentage) ............................................................................ 24
Figure 15: Comparison of the contribution of Rapid Mapping Service to decision-making and operational cooperation by selected emergency (in percentage) .. 25
Figure 16: Factors affecting the performance of Rapid Mapping Service (in percentage) ..................................................................................................... 26
Figure 17: SWOT analysis of the UNOSAT Rapid Mapping Service ........................ 28
Figure 18: User experience in UNOSAT support for analysis and interpretation of maps ............................................................................................................... 31
Figure 19: Country experience in UNOSAT support for analysis and interpretation of maps (in percentage) ....................................................................................... 31
Figure 20: Proxy indication of Rapid Mapping Service user satisfaction .................. 32
Figure 21: Country comparison - proxy indication of Rapid Mapping Service user satisfaction (in percentage) .............................................................................. 33
Figure 22: Summary of key findings, conclusions and recommendations ............... 47
Table of tables
Table 1: List of activations strengthening the evidence base for the independent evaluation .......................................................................................................... 7
Table 2: Comparison of costs between UNOSAT Rapid Mapping Service and Copernicus Emergency Mapping Service for 2016 and 2017 .......................... 18

viii
List of acronyms and abbreviations
CERN European Organization for Nuclear Research
EMS Emergency Mapping Service (of Copernicus)
ESCAP Economic and Social Commission for Asia and the Pacific
FAO Food and Agriculture Organization of the United Nations
GIS Geographic Information System
IASC Inter-Agency Standing Committee on humanitarian coordination
ICAI Independent Commission for Aid Impact (of the United Kingdom)
M&E Monitoring and Evaluation
NAAS Needs Assessment & Analysis Section (of UNOCHA)
MoU Memorandum of Understanding
Norad Norwegian Agency for Development Cooperation
PO Programmatic objective
SDG Sustainable Development Goal
SWOT
ToR
Strengths, weaknesses, opportunities and threats
Terms of Reference
UK
UN
UNDAC
UNDP
United Kingdom
United Nations
United Nations Disaster Assessment and Coordination (of UNOCHA)
United Nations Development Programme
UNICEF United Nations Children's Fund
UNITAR United Nations Institute for Training and Research
UN-ASIGN Adaptive system for image communication over global networks
UNOCHA United Nations Office for the Coordination of Humanitarian Affairs
UNOSAT UNITAR Operational Satellite Applications Programme
WFP World Food Programme

ix
Figure 1: Infographic: External evaluation of UNOSAT Rapid Mapping Service

x
Preface Through its Rapid Mapping Service, the UNITAR Operational Satellite Applications
Programme (UNSOAT) has been supporting the humanitarian community with
satellite imagery analysis for over 15 years. The Service has unequivocally helped
place UNITAR on the map as a credible provider of real-time or near real-time
information to support decision-making and coordination in the wake of humanitarian
emergencies and natural disasters.
The evaluation assessed the Rapid Mapping Service’s relevance, effectiveness,
efficiency, impact, and sustainability. In doing so, the evaluation not only examined
the Service’s performance during 2016-2017 but also sought to identify the ‘why’
question by identifying factors contributing to or inhibiting the Service’s delivery and
achievement of results. The evaluation issued a set of six recommendations.
Readership of this evaluation should not only include the immediate stakeholders of
the Rapid Mapping Service, but also a wider audience involved in efforts to support
decision-making and coordination among humanitarian actors.
The evaluation was managed by the UNITAR Planning, Performance Monitoring, and
Evaluation (PPME) Unit and was undertaken by Dr. Achim Englehardt, consultant
and independent evaluator. The PPME Unit provided guidance, oversight and quality
assurance, as well as logistical support for fieldwork and survey deployment.
UNOSAT’s response to the evaluation and its conclusions and recommendations are
outlined in the Management Response.
The PPME Unit is grateful to the evaluator, UNOSAT and the other evaluation
stakeholders for providing important input into this evaluation.
Brook Boyer
Director, Division for Strategic Planning and Performance Manager, Planning, Performance Monitoring and Evaluation Unit

xi
Executive summary Introduction: This document constitutes the report of the independent evaluation of the Operational Satellite Applications Programme’s (UNOSAT) Rapid Mapping Service (“the Service”) for the period 2016 to 2017. UNOSAT is a programme of the United Nations Institute for Training and Research (UNITAR). The Norwegian Agency for Development Cooperation (Norad) provides funding of USD 220,741 annually from 2017 to 2020. Prior to the Norad contribution, the Norwegian Ministry of Foreign Affairs funded the Service with USD 326.000 per year, from 2014 to 2016. Programme background: Over the last 15 years, the UNOSAT Rapid Mapping Service has been providing satellite imagery analysis during humanitarian emergencies. The Service has been created to meet the demand of United Nations agencies such as the United Nations Office for the Coordination of Humanitarian Affairs (UNOCHA), Member States and other humanitarian agencies for rapid mapping and satellite derived analysis in the wake of disasters and complex emergencies. Evaluation purpose: Since becoming operational in 2003, this is the first external evaluation of the Service. The purpose of the evaluation is to assess to what extent and why the UNOSAT Rapid Mapping Service is providing effective and efficient support for evidence-based decision-making to users engaged in humanitarian work for the period 2016 to 2017. The evaluation methodology builds on an standard evaluation matrix and work plan and includes a mixed-methods approach tailored to the Service using i) comprehensive desk review, including a stakeholder analysis based on data from the UNOSAT Rapid Mapping Service; ii) Theory of Change analysis; iii) online survey with 20,8% response rate1; iv) key informant interviews covering 38% of institutional stakeholders based on their availability to participate in the evaluation2; and v) a focus group with the project team. For each evaluation criterion, the evaluation applied a rating, using a four-point scale as practiced by the United Kingdom’s Independent Commission for Aid Impact. The aggregate of sub-criteria listed in the Terms of Reference serves as the basis for the assessment, with a maximum score of 100%. Clients for this evaluation are UNITAR, the UNOSAT Rapid Mapping Service, the donor, requestors and users of the Service in the United Nations (UN) system, other international organizations, national governments, non-governmental organizations (NGOs) and other partners of the Service. Main evaluation findings are presented by the evaluation criteria suggested in the Terms of Reference: relevance, efficiency, effectiveness, impact, and sustainability. Relevance: The UNOSAT Rapid Mapping Service is doing the right thing in the humanitarian assistance context. The evaluation finds that the relevance of the Rapid Mapping Service is very high reaching a relevance score of 95% out of 100%. In four out of five sub-criteria, the programme shows a solid performance, including i) alignment to UN Sustainable Development Goals 11.5 concerning the reduction the number of deaths and the number of people affected by disasters and less to target 13.1; ii) alignment to UNITAR Program Objective 5 “Improve resilience and humanitarian assistance” under the Strategic Framework 2014 – 2017.; iii) relevance
1 81 out of 390 users reached. 2 13 out of 34 institutional stakeholders agreed to be interviewed (with one or more than one interviewee per institutional stakeholder).
Rel
evan
ce

xii
for the donor Norway’s 2008 humanitarian strategy; and iv) relevance for 83% of stakeholders’ needs. The Theory of Change (ToC) developed for Norad in 2017 and further reconstructed for the Rapid Mapping Service as part of this evaluation is valid. Prior to the Norad funding, no ToC existed, however. The Service stands out as an area of good practice where UNITAR is making a significant positive contribution concerning the Service’s relevance. Efficiency: Overall, the Service uses resources efficiently. Ratings for efficiency reach 75% on a 100% scale, based on the four sub-criteria. The Service shows satisfactory achievement in most areas including partnership modalities and the timeliness of service delivery. Partnership modalities: Memoranda of Understanding (MoUs) and letters of support between UNITAR and partners are the main partnership modality. Partners appreciate the generic character of MoUs to maintain certain levels of flexibility. However, several partners would appreciate a more strategic engagement and dialogue with UNOSAT, including UNOCHA, ESCAP and MapAction. Timeliness: Stakeholders view the timeliness of the Rapid Mapping Service positively, with ratings reaching 77%. Alternative service providers: Humanitarian stakeholders use UNOSAT Rapid Mapping Service alongside alternative service providers such as the Copernicus Emergency Management Service (EMS)3 or regional providers, for example Sentinel Asia. Timeliness and quality of services determine which provider is used on a case-by-case basis. Quality can be influenced for example by the percentage of cloud cover on imagery with no service provider being positioned in a unique niche for the global humanitarian community. No single service provider seems to be positioned in a unique niche for the global humanitarian community. Cost-efficiency: Costs incurred by the Rapid Mapping Service compare favorably with 70.2% to 91.4% less costs than the main competitor, the Copernicus Emergency Mapping Service when calculated per activation in average for 2016 and 2017. Effectiveness: The level of results achievement is satisfactory. The evaluation finds that the Service shows satisfactory achievement of all four effectiveness sub-criteria: Service objectives, factors affecting service performance, the contribution to support analysis and interpretation of maps and user satisfaction. The score for effectiveness reaches 75% out of 100%. Achievement of objectives: Stakeholder satisfaction about the contribution of the Rapid Mapping Service to evidence-based decision-making is at 75,8%. Being even less under the control of the Service, the stakeholders' satisfaction about the contribution of the Service to enhanced operational coordination in humanitarian assistance still reaches 69%. At the country level, UN users experienced UNOSAT’s contributions as particularly high in the 2017 Caribbean tropical cyclones with 80%. Service users identified the lowest contribution with 58% in the 2016 and 2017 Bangladesh floods, followed by the Vietnam floods and tropical cyclone (2016/17) with 60%. Factors positively affecting the performance of the Service are the timeliness of service delivery (86%) and the level of quality of service (80%). 71% of users experience the channeling of deliverables to decision-makers as a disabling factor for
3 The Copernicus Emergency Management Service is part of the Copernicus Programme, which is an European Union Programme managed by the European Commission and implemented in partnership with Member States, the European Space Agency, the European Organization for the Exploitation of Meteorological Satellites, the European Centre for medium-range Weather Forecasts, European Union
Agencies and Mercator Ocean.
Effi
cien
cy
Effe
ctiv
enes
s

xiii
using the Service, the latter being beyond the control of UNOSAT, particularly in the field. At the country level, this global finding was confirmed in response to the 2017 Caribbean tropical cyclones, the 2017 Iran/Iraq earthquake, the 2017 Philippines tropical cyclone and the Vietnam floods (2016/2017) and tropical cyclone (2017) where channeling of deliverables to decision-makers was perceived as a challenge. Impact: The level of achieving long-term results is satisfactory. The evaluation finds that the impact of the Service shows satisfactory achievement in most areas such as the difference made to partners, cumulative effects of the Service and their comparative advantage concerning timeliness and cost. The score for impact is 71% out of 100%. In the context of overall positive results, the lack of evidence about the utility of Service to end-users leads to underreporting on impact. Underreporting is regrettable as technical solutions related to the UN-Adaptive System for Image Communication over Global Networks (ASIGN) and UNOSAT’s cooperation with AnsuR seem feasible. The contribution to better humanitarian assistance in the long-term reaches a rating of 71,9%, followed by 69,1% for making a real difference to the users’ work in humanitarian assistance by better focusing UN and national governments’ emergency responses. The most potent effects of the Service seem to show at the initial stages of decision-making processes at UN headquarter levels when a situation analysis is required. For 78% of users, alternatives to the Service are at reach while 13% of users would fear adverse effects concerning timeliness and costs. For the UN Economic and Social Commission for Asia and the Pacific (UNESCAP) alone, UNOSAT Rapid Mapping Service (with an annual budget of USD 273.000) is valued USD 600.000 to 700.000 per year. A minority of stakeholders identified negative cost implications in the absence of the Rapid Mapping Service in natural disasters in Colombia, Indonesia, Iran/Iraq, Madagascar, and Mexico. Other stakeholder do not share those preoccupations. Sustainability: Results are unlikely to last under the current business model. The evaluation finds that the sustainability of the Service shows unsatisfactory achievement in most areas such as financial sustainability, internal operational sustainability or the factors affecting sustainability. Some positive elements emerge such as inter-institutional sustainability through partnerships and the contribution to better humanitarian assistance in the long term. The score for sustainability is 40% out of 100%. Business model and institutional arrangements: The sustainability of the business model is unsatisfactory. Dependency on project-based funding and funding by one donor threatens the offering of free service as a public good to the humanitarian community. The Inter-institutional sustainability is well based on sufficiently generic MoUs which could be better operationalized in some cases through joint planning or secondment of personnel. Financial and operational sustainability: The financial sustainability of UNOSAT Rapid Mapping Service is weak, experiencing eleven months funding delay in 2017 and a significantly reduced budget for the Service. The internal operational sustainability of the Rapid Mapping Service team is threatened due to understaffing following the recent funding cuts. Long-term contribution of the Service: Though only 30% of users benefit from the Service's disaster preparedness engagement (risk analysis/possible scenario definition maps), this aspect of the work contributes to better humanitarian assistance in the long-term. Besides, in general space-related emergency response reduces the number of actors on the ground enhancing the efficiency of humanitarian assistance.
Imp
act
Sust
ain
abili
ty

xiv
The above key findings lead to the following conclusions: The Rapid Mapping Service remains relevant and operate strategically in the Agenda 2030 context, with proper alignment to objectives of UNITAR and the donor Norway. The Service mainly meets the needs of countries and partners. The comparison of cost-efficiency of the Service with the main comparator is highly favorable and shows value for money. Timeliness is one of the key selling points of the Service. While opportunities arise for UNOSAT to further strengthen its strategic engagement with partners, those come at the expense of scarce staff time. At the same time, alternatives to the Service exist and are used by UNOSAT clients. Overall, the performance of the Service and delivery of its objectives is high, despite experiencing challenges in channeling its products to the end-user at national level, including national governments and UN partners in the field. The likely impact of the Service seems high, but its tangible effects in the field are blurred due to the lack of capturing impact data. This challenge is shared with other service providers, and an opportunity emerges to get ahead of the curve on this topic. The closer UNOSAT is to the decision-makers, the higher is the likelihood of effective use of its Rapid Mapping Service. A stronger focus of the Service on disaster risk reduction through preparedness work could further enhance its contribution to sustained changed in humanitarian assistance. If the Service were to end, the costs to develop a similar rapid mapping service outside UNOSAT would be burdensome for a minority of users in the humanitarian context. “Business as usual” does not seem an option for ensuring the future of the Rapid Mapping Service. While performance is high and secondments or placements in partner organizations are good practices and make a difference to UNOSAT clients, those need to be embedded in a redefined Service given the severe funding constraints. In the present adverse funding context, the Service is at crossroads. Based on the above key findings and conclusions, five recommendations emerge: Relevance R 1: UNOSAT should enhance the visibility of the Rapid Mapping Service due to its global relevance for the UN family and the UN Member States. More visibility could be achieved for example by establishing a strategic advisory board for the Rapid Mapping Services comprised of UNOSAT’s main institutional partners and the current donor Norad. Prioritization moderate: next 12 to 36 months. Efficiency R 2: UNOSAT should revise current MoUs with institutional partners and include more joint planning and implementation tasks including secondments. This could strengthen UNOSAT’s position in an increasingly competitive environment. Prioritization high: next 12 months Effectiveness R 3: UNOSAT should invest in a strategic retreat with donor Norad, other potentially interested parts of the Norwegian administration, other potential donors and selected institutional partners to shape a redefined business model of the Rapid Mapping Service. Some options to discuss are business model and funding possibilities for a Service of i) up to 10 full-time staff scaling up current work practices and systematically using secondments and placements in institutional partners ; ii) up to 3 full-time staff scaling down current work practices covering only selected parts of the Rapid Mapping Operational Framework and focusing on coordination issues and investments in impact assessment of rapid mapping; iii) moving all remaining staff to institutional partners in field locations for shared funding of posts and maximum impact in the field combined with a light oversight role from UNOSAT in Geneva. Prioritization very high: next 6 months
Co
ncl
usi
on
s R
eco
mm
end
atio
ns
xv
Impact R 4: UNOSAT should identify indicators and targets for the outcome and impact of the Rapid Mapping Service, as a means to move from activity-based management to results-based management. Prioritization high: next 12 months R 5: UNOSAT should consider to which extent user-based real-time impact assessment by upgrading existing technical solutions related to UN-ASIGN can be accommodated in any future business model of the Service, given donor interest and opportunity to lead the global humanitarian community on this topic. Prioritization high: next 12 months R 6: UNOSAT: If the current funding crisis requires a prioritization in the service portfolio, UNOSAT should focus on risk analysis/possible scenario definition maps and location/preliminary situation maps due to the more direct access to end-users for those products. Prioritization high: next 12 months Sustainability See recommendations 3 and 6.

xvi

1
Section I: Introduction 1. This document constitutes the report of the independent evaluation of the
UNITAR Operational Satellite Applications Programme’s (UNOSAT) Rapid Mapping Service (the “Service”). UNOSAT is a programme of the United Nations Institute for Training and Research (UNITAR).
United Nations Institute for Training and Research (UNITAR) 2. UNITAR is a principal training arm of the United Nations, with the aim to
increase the effectiveness of the United Nations in achieving its primary objectives through training and research. UNITAR programming covers various thematic areas, including support for the implementation of the 2030 Agenda for Sustainable Development; multilateral diplomacy; public finance and trade; environment, including climate change, environmental law and governance, and chemicals and waste management; peacekeeping, peacebuilding and conflict prevention; decentralized cooperation; and resilience and disaster risk reduction.
UNITAR Operational Satellite Applications Programme
3. UNOSAT is a technology-intensive programme delivering imagery analysis and satellite solutions to relief and development organizations within and outside the UN system to help make a difference in critical areas such as humanitarian relief, human security, strategic territorial and development planning. UNOSAT develops applied research solutions keeping in sight the needs of the beneficiaries at the end of the process.
1.1 Background of the Rapid Mapping Service 4. The Service provides satellite image analysis during humanitarian emergencies,
including natural disasters. The service has been created to meet the demand of United Nations Office for the Coordination of Humanitarian Affairs (UNOCHA), and other humanitarian agencies and NGOs part of the Inter-Agency Standing Committee on humanitarian coordination hosted by the UN (IASC) for rapid mapping and satellite derived analysis in the wake of disasters and complex emergencies. With a 24/7 year-round availability to process requests, UNOSAT delivers satellite imagery derived maps, reports, and data ready for direct inclusion in Geographic Information Systems (GIS) according to needs.
5. Typical situations for which the Service is activated during sudden-onset natural disasters include floods, earthquakes, storms, landslides, and volcanoes. Natural disasters still represent significant activities at UNOSAT, in particular, floods, which often include the need for monitoring over time. An activation is as a formal request for UNOSAT to provide rapid mapping to respond to a need for satellite derived information following disasters provoked by natural hazards or complex emergency situations. The activation results in the very rapid acquisition and processing of satellite imagery to generate geospatial information and analytical reports in addition to GIS layers in support of humanitarian relief agencies4.
6. The capacity of providing frequent imagery analysis updates as situations unfold
has become one of the critical features of UNOSAT rapid mapping. UNOSAT benefits from a variety of sources for its satellite imagery: Free and open source,
4 As explained on the website of UN-Spider: http://www.un-spider.org/space-application/emergency-mechanisms/unitar-operational-satellite-applications-programme-unosat

2
commercial vendors, International Charter Space and Major Disasters (natural and technological disasters only), and in-kind donations.
7. Requests for the Service may be submitted by United Nations entities,
governments, the Red Cross and Red Crescent Movement, international and regional organizations and humanitarian non-governmental organizations. The service is free of charge for UN agencies and humanitarian entities operating in line with UN policies such as the institutions listed above. Rapid mapping products include maps, GIS-ready data (for example flood extents, damage assessments), statistics and reports. Currently, the Service is funded through project-based funding from Norad. The service also benefits from important in-kind contributions, including office and IT facilities offered by the European Organization for Nuclear Research (CERN).
8. UNOSAT’s Rapid Mapping Service operates within the framework outlined in
Figure 2. Specific deliverables are tied to the timeline of a natural disaster. Figure 2: Operational framework for Rapid Mapping.
Source: UNOSAT
9. Prior to a natural disaster, in phase 0 assessment preparedness is the focus of
the Rapid Mapping Service. The Service provides risk analysis and possible scenario definition maps.
10. Phase 1 takes place within the first 24 hours of a sudden onset disaster. Location
and preliminary situation maps are the main deliverables of the Rapid Mapping Service.

3
11. In phase 2, 72 hours after the sudden onset disaster the service provides situation analysis updates. These are accompanied with impact and preliminary damage analysis up to 2 weeks after the disaster.
12. In phases 3 and 4, the service provides detailed for example building damage
assessments.
1.2 Evaluation background and purpose 13. Since becoming operational in 2003, the Service has collected periodic feedback
on its service. However, this is the first independent evaluation of the Service.
14. The purpose of the evaluation is to assess to what extent the Rapid Mapping Service is providing effective and efficient support for evidence-based decision-making to clients engaged in humanitarian work. Apart from assessing performance the evaluation also seeks to answer the ‘why' question by identifying factors contributing to (or inhibiting) the achievement of results. The purpose is also to provide recommendations and lessons-learned on strengthening the Service, including identifying what methods or approaches work well and why.
15. It is expected that the results from this evaluation will contribute to guiding not
only the future contours of the service but also project related work requested by donors and other stakeholders.
16. Main users of this evaluation are UNITAR, the UNOSAT Rapid Mapping Service,
the donor, requestors and users of the service in the UN system, other international organizations, national governments, NGOs and other partners of the service.
1.3 Evaluation methodology and approach 17. In line with the evaluation’s TOR, the first deliverable was an evaluation matrix
and work plan. The evaluation methodology and approach are included in the evaluation matrix and summarized below.
18. Given that UNOSAT provides a demand-driven service, the availability of detailed planning documents including performance indicators, time-bound milestones and targets is recent and partly related to the new funding agreement by the new donor Norad, as well as ongoing internal strategic planning in UNOSAT. In the absence of such results-based planning, results were previously measured by counting the numbers of activations and using a user feedback survey with varying response rates.
19. As a result, the evaluator suggested a theory-based evaluation approach. This
approach specifies the program's intervention logic building on a set of assumptions and outlining how the program designers think the change will happen. This intervention logic is available in UNOSAT as part of the funding agreement with Norad for services beyond the Rapid Mapping Service and was reconstructed with the UNOSAT team focusing on Rapid Mapping Service only, followed by validation through engaging clients of the Service.
20. The following evaluation tools and processes were used for the evaluation:
• Comprehensive desk review, including a stakeholder analysis;

4
• ToC analysis;
• Online survey reaching 81 out of 390 users (20,8% response rate);
• Key informant interviews with 13 out of 34 institutional stakeholders agreed to be interviewed (38,3% response rate);
• Focus groups;
• Analysis of strengths, weaknesses, opportunities and threats of the service with UNOSAT team members;
• Presentation of emerging findings with UNOSAT team in Geneva, followed by a presentation of conclusions and recommendations.
21. The evaluation aims to address impact at the level of humanitarian actors and
end-beneficiaries. In the absence of a budget and similar timeframe for sizeable primary data collection at field level, the impact on end-beneficiaries was reconstructed using theoretical contribution where possible.
22. Challenges emerged when trying to identify the contribution the Rapid Mapping Service made on decision making among humanitarian actors due to the high staff turnover in humanitarian organizations and the frequent deployment of external experts rather than staff.
23. To mitigate those risks, the consultant contacted the users of Rapid Mapping
Service for all 46 activations in 2016 (17 activations) and 2017 (29 activations) based on available mailing lists. This approach aimed to ensure that more than one person would be contacted per activation for the online survey to allow for a more comprehensive reconstruction of the use and results of the Rapid Mapping Service.
Sampling approach
24. In the evaluation matrix, a sampling approach for activations based on “most
significant change” and “least significant change” 5 was suggested under the assumption that sufficient documentation for activations and access to users was given.
25. Both assumptions proved to be only partly correct and, as a result, the sampling approach required revision. Subsequently, the evaluator took a comprehensive approach to cover all activations through an online survey.
Analysis of strengths, weaknesses, opportunities and threats (SWOT) 26. Towards the end of the data collection phase the evaluator undertook an analysis
of the strengths, weaknesses, opportunities, and threats of the Rapid Mapping Service with each team member and the management of the service. The analysis highlights factors affecting the performance of the service. The results of the SWOT analysis section were triangulated with the user perspective where possible.
5 “Most significant change” concerning examples where the Service made a real difference to partners in the field and enhanced evidence-based decision making. “Least significant change” refers to cases where the use of Rapid Mapping Services was unclear or feedback uneven.

5
Scoring methodology 27. This evaluation uses a four-point scale assessment methodology as applied by
the United Kingdom’s Independent Commission for Aid Impact for its performance reviews. The four-point scale is explained in detail in Figure 3 below.
28. Each evaluation criterion is rated based on an aggregate of the relevant sub-criteria. The latter refer to evaluation questions. This results in an overall rating of the evaluation object.
29. Starting at the level of the individual evaluation questions, the evaluator scored the performance according to the available evidence. It is important to state that the evidence-base determines the scores, for example, the degree of accomplishment of service outputs, quantitative results of surveys or other quantifiable data. Qualitative data can also be quantified where applicable. Where insufficient evidence is available, a score was avoided and explained in the evaluation report, for example in section 3.1 on cost-efficiency where insufficient data was available to make an assessment. This choice aims to limit any bias.
30. Subsequently the scores per evaluation are aggregated by evaluation criteria
using a numerical “translation” of the color coding. “red” scores are rated with 1, “amber/red” scores with 2, “green/amber” scores with 3 and green “scores” with 4.
31. For the percentage calculation of the total score of an evaluation criterion, the
aggregate is divided by the maximum possible score and multiplied by 100. No weighting of evaluation criteria is foreseen unless otherwise desired by the evaluation commissioner.
Figure 3: Legend for color coding used for results assessment
Green: Strong achievement across the board. Stands out as an area of good practice where UNOSAT is making a significant positive contribution. Score 76 to 100 out of 100
Green/amber: Satisfactory achievement in most areas, but partial achievement in others. An area where UNOSATS is making a positive contribution but could do more. Score 51 to 75 out of 100
Amber/red: Unsatisfactory achievement in most areas, with some positive elements. An area where improvements are required for UNOSAT to make a positive contribution. Score 26-50 out of 100
Red: Poor achievement across most areas, with urgent remedial action required in some. An area where UNOSAT is failing to make a positive contribution. Score: 0-25 out of 100
32. The total score per evaluation criterion can easily be translated back into a color
coding. For this purpose, 100% are evenly divided into four categories to match the color coding. As a result, ratings of 25% and below translate into a “red” color coding. Ratings of 26% to 50% fall into the category of “amber/red” color coding. The “green/amber” color coding applies for ratings between 51% and 75%. All ratings above 75% translate into the “green” color coding.

6
Limitations 33. This evaluation benefitted from sufficient budget to undertake a full-fledged
assessment of the of the Rapid Mapping Service. However, the strong focus of the ToR on assessing the user feedback and the application of Rapid Mapping Service on the ground encountered the challenge of incomplete information about who those users are.
34. For each activation of Rapid Mapping Service, a requester6 is documented. This person, however, tends not to be the user of data but is a person merely fulfilling an administrative or coordination role. The requesting agency does not assign a technical person with whom UNOSAT can liaise directly.
35. UNOSAT sends out its deliverables to a group of potential users during each activation. This uncertainty about the actual users of satellite imagery and maps is not unique to UNOSAT; other service providers such as MapAction have experienced similar constraints. The evaluation engaged with this group of potential users for all 46 activations between 2016 and 2017, a time-consuming process which was not initially foreseen.
36. Combined with high staff turnover in the humanitarian sector, the fluidity of the
potential user group jeopardizes intents to identify who used Rapid Mapping Service, for what purpose and to what ends. The evaluation managed this major challenge by broadening the evaluation approach assessing all 46 activations to the extent possible, rather than evaluating specific cases in greater depth. As a result, field visits seemed unfeasible. This learning process during the evaluation constituted an evaluability assessment of the Rapid Mapping Service in parallel to undertaking the evaluation.
37. The activations listed in Table 1 (page 20) and presented in Figure 4 (below) were
used to strengthen the evidence base of the evaluation. The report draws on the results of those activations combined with the total of all 46 activations.
Figure 4: Overview of geographic location of activations used
6 The person officially requesting the activation of the Rapid Mapping Service

7
38. Given the limited number of respondents to the online survey per activation(s), ranging from a minimum of five service users for the Philippines tropical cyclone in 2016 to a maximum of 10 users in the Bangladesh floods, the results are only indicative, but tend to confirm the main trends identified based on all 46 activations. Data for activations with less than five respondents were excluded from the country level analysis due to the insufficient evidence base for further analysis. Annex h presents examples of Rapid Mapping Service products for the selected activations.
39. Table 1 contains all countries/regions where five or more stakeholders participated in the on-line survey. The participation rate of stakeholders determines the selection of those countries/regions.
Table 1: List of activations strengthening the evidence base for the independent evaluation
Activation code Country Date Disaster type
Duration Products/ services
Requesting agency
Number of survey respondents
TC20161024PHL Philippines October 2016
Tropical Cyclone
1 month 2 UNOCHA 5
FL20160720BGD Bangladesh July 2016 Floods < 1 week
3 UN ESCAP 10
TC20170529BGD Bangladesh May 2017 Floods 2 weeks 11 UNOCHA
FL20170815BGD Bangladesh August 2017
Floods > 2 weeks
4 UNOCHA
FL20161109VNM Vietnam November 2016
Floods 1 10 UN Resident Coordinator
6
TC20170717VNM Vietnam July 2017 Tropical Cyclone
< 2 weeks
3 UNICEF
FL20171106VNM Vietnam November 2017
Floods 1 week 5 UNOCHA/ UNSPIDER
FL20171211VNM Vietnam December 2017
Floods 1 week 2 UN Resident Coordinator
TC20170306MDG Madagascar March 2017
Tropical Cyclone
> 1 month
8 UNOCHA 6
FL20170424HTI Haiti April 2017 Floods 2 weeks 7 UNOCHA 6
TC 20170902PRI Caribbean September 2017
Tropical Cyclone
> 3 weeks
21 UNDAC 9
EQ20170919MEX Mexico September 2017
Earthquake > 1 month
15 UNOCHA 5
EQ20171112IRQ Iraq/Iran November 2017
Earthquake 1 week 8 UNOCHA 6
40. Twelve of the 46 eligible activations went through the mechanism of the
International Charter "Space and Major Disasters." Those 12 activations benefitted from written documentation about the Service deployment process. Only activations made through the mechanism of the International Charter "Space and Major Disasters" contain such written documentation such as technical data related to the activation, deliverables (for example maps), testimonials about the emergency and anecdotal evidence about user feedback.
41. Another limitation concerns the gender dimension of the evaluation. Though the
evaluation intended to capture sex-specific data and undertake data disaggregation by sex, the nature of the Services does not make any distinction whether ultimately the lives of men or women are saved in a natural disaster.

8
1.4 Reconstructed Theory of Change of the Rapid Mapping Service 42. The evaluation reconstructed the following ToC based on the 2017 funding
proposal for Norad and presented in Figure 5. Figure 5: Reconstruction of the Theory of Change for the Rapid Mapping Service
43. The reconstructed ToC contains the following elements:
• Formulation of the main problems
• Output (short-term results) and related assumptions
• Barriers to moving from outputs to outcomes (medium-term results)
• Outcomes
• Impact statement (long-term results)

9
• Linkages to external drivers of change catalyzing the achievement of the impact
• Main assumptions 44. The main challenge to the humanitarian community that justifies the
existence of the Service is to address in a very short timeframe to data, and information needs after a natural disaster to inform instant emergency responses. As such, the primary output, or short-term result, of the Service is the provision of timely rapid mapping products (data, reports and maps) for dissemination to end-users following major disaster events in support of the Humanitarian Programme Cycle.
45. The main output can be broken down into the following components: i) 24/7 on-call rapid mapping service; ii) dedicated technical support, including analysis to end-users during disasters; iii) wide distribution of rapid mapping products such as satellite derived maps through sending information to partners; iv) data sharing feeding to actors in the field and HQ level as a basis to ensure regular briefings to top UN management.
46. The following assumptions need to hold for the components of the output to be
delivered successfully: i) The predictability of adequate funding; ii) A budget for the Service that can attract and retain highly qualified technical staff under challenging working conditions; iii) The availability of distribution channels and reachability of decision-makers; and iv) Sufficient capacities of partners and users to interpret data.
47. Those assumptions are accompanied by more general ones such as i) The Rapid
Mapping Service remain relevant, given the availability of alternative sources to data; ii) The willingness of donor community to keep funding "free of charge" Rapid Mapping Service, and iii) European Organization for Nuclear Research (CERN) willingness to keep sharing data capacities with UNITAR.
48. The Rapid Mapping Service aims to contribute to an enhanced evidence base for
decision making amongst humanitarian actors during a major natural disaster event. The latter is the outcome or medium-term results of the Service.
49. On this pathway from short-term to medium-term results the Service faces a
number of barriers which are largely beyond the control of the Rapid Mapping Service: i) the lack of timely interpretation of data, maps, and reports by some stakeholders; ii) coordination challenges after natural disasters at the field level; iii) multiple sources of data as evidence-based for decision making; and iv) feedback for future service improvement hindered by quick staff turnover in partner agencies.
50. The long-term result of the Rapid Mapping Service is the contribution to more
effective humanitarian assistance through evidence-based decision-making. 51. A range of external factors can catalyze the achievement of the Service’s results,
the so-called "drivers of change." The drivers of change comprise:
• Relevance of the Service to the Sustainable Development Goals (SDGs), particularly to SDG 11.57 and SDG 13.18 and the Sendai Framework for Disaster Risk Reduction9.
7 “By 2030, significantly reduce the number of deaths and the number of people affected and
substantially decrease the direct economic losses relative to global gross domestic product caused by

10
• Increasing coordination of humanitarian actors increasing at headquarter level
• The political will of instant action after natural disasters with a low risk of politicizing
• A genuine desire for evidence-based decision making in the humanitarian community after natural disasters
52. Section 2.6 assesses the ToC validity of the Service.
disasters, including water-related disasters, with a focus on protecting the poor and people in vulnerable situations” 8 “Strengthen resilience and adaptive capacity to climate-related hazards and natural disasters in all countries." 9 Priority for action 1: Understanding disaster risk; Priority 3: Investing in disaster risk reduction for resilience
SDG 11.5 “By 2030, significantly reduce the number of deaths and the number of people affected and substantially decrease the direct economic losses relative to global gross domestic product caused by disasters, including water-related disasters, with a focus on protecting the poor and people in vulnerable situations”.
SDG 13.1 “Strengthen resilience and adaptive capacity to climate-related hazards and natural disasters in all countries."

11
Section II: Findings
2. Relevance: Is the UNOSAT Rapid Mapping Service doing the right thing? 53. This section addresses the evaluation criteria of relevance. The sub-criteria used
for the assessment referred to the alignment to the United Nations Sustainable Development Goals and the alignment to the UNITAR mandate, strategy and results framework. The relevance for the donor Norway and countries' and partners' needs follow. The last sub-criterion concerns the validity of the Service’s ToC.
54. The evaluation finds the relevance of the Service to be very high. Based on the
evaluations’ scoring methodology10, the relevance score of the service is “green” with a score of 95 out of 10011. In four out of five sub-criteria, the service shows a solid performance.
2.1 Alignment to UN Sustainable Development Goals 55. Two SDGs are related to the Service, SDG 11.5 and SDG 13.1., according to the
UNITAR Programme Budget 2016 - 201712.
56. SDG 11.5 refers to the following: “By 2030, significantly reduce the number of deaths and the number of people affected and substantially decrease the direct economic losses relative to global gross domestic product caused by disasters, including water-related disasters, with a focus on protecting the poor and people in vulnerable situations”.
57. As stipulated in the Service’s ToC, improvements in humanitarian assistance are
the long-term result of the Service. As such, a theoretical link is given between the service and the reduced number of deaths and people affected by disasters, as shown in Figure 6.
10 Explained in the methodology section of this report. The methodology is applied by the UK’s Independent Commission for Aid Impact, see for example http://icai.independent.gov.uk/wp-content/uploads/ICAI-Review-UK-aids-contribution-to-tackling-tax-avoidance-and-evasion.pdf 11 Scores by sub-criteria: green: 4, green/amber: 3, amber/red: 2; red: 1 12 UNITAR: Revision to the Program and Budget for the biennium 2016 – 2017, page 64.
Key findings: The UNOSAT Rapid Mapping Service is doing the right thing in the humanitarian assistance context.
• The Service contribute to SDG 11.5. For preparedness related work before tropical cyclones, the evaluation finds a contribution to SDG 13.1. The contributions are theoretical, however.
• The Service is fully aligned to UNITAR’s Programme Objective 5 of the 2014-17 Strategic Framework.
• Alignment to Norway’s 2008 humanitarian strategy is given.
• For 83% of stakeholder survey respondents, the Rapid Mapping Service are relevant for country and partner needs.
• The reconstructed theory of change for the Rapid Mapping Service is valid.

12
Figure 6: Theoretical effects of the Rapid Mapping Service
58. SDG 13.1 refers to the following: “Strengthen resilience and adaptive capacity
to climate-related hazards and natural disasters in all countries."
59. Tropical cyclones are the primary example where the Service contributes to disaster risk preparedness, with examples however being outside the evaluation period. The evaluation also found evidence from stakeholders for enhanced disaster risk preparedness for the tropical cyclones Irma and Maria hitting the Caribbean in 2017. Another example is the analysis of flash floods in Myanmar where the Rapid Mapping Service performed an analysis of historical data for mapping communities at risk for UNOCHA’s Needs Assessment & Analysis Section (NAAS).
60. Figure 7 shows stakeholder perception about the relevance of the Rapid Mapping
Service for SDG 11.5 and 13.1. The relevance for SDG 11.5 results higher than for SDG 13.1 due to the current focus on the Service which are less preparedness oriented.
Figure 7: Stakeholder perception about the relevance of the Rapid Mapping Service for SDG 11.5 and 13.1
61. Most stakeholders interviewed identified a crucial future role UNOSAT to play in
engaging even more in disaster risk preparedness, including the International Space Charter. For Asia, a UN stakeholder identified vulnerability mapping
0
1
2
3
4
5
6
7
8
9
10
Very high High Medium Low Very low No answer
SDG 11.5 SDG 13.1

13
related to earthquake exposure as an essential future aspect of disaster risk preparedness. The Service is thus also highly relevant to the 2015 Sendai Framework for Disaster Risk Reduction13.
2.2 Alignment to UNITAR’s mandate, strategy and results framework 62. The UNOSAT Rapid Mapping Service are fully aligned to the 2014 to 2017
Strategic Framework of UNITAR, more specifically to the programme objective (PO) 5 “Improve resilience and humanitarian assistance." Under PO5, item 5.1 directly relates to the Rapid Mapping Service with the objective to “leverage technology to generate geospatial information and create integrated solutions for human security, peace, and socio-economic development."
63. The Rapid Mapping Service also contributes to results area 5.2 to “develop credible and reliable support systems for improved disaster risk reduction." However, the explanation provided in the 2014 to 2017 Strategic Framework of UNIRAR14, unfortunately, miss out the critical preparedness element of the Rapid Mapping Service in the buildup of tropical cyclones.
2.3 Relevance for the donor 64. The Norwegian Ministry of Foreign Affairs’ Humanitarian Secretariat established
the recent Norwegian funding support for the Service for the period 2014 to 2016. Following a transfer of the contract to the Department for Climate and Energy in the Ministry, that Department was transferred from the Ministry to Norad as part of moving the climate portfolio within the Norwegian administration. Norad, in fact, manages the current contract for the Service since late 2017 till 202015.
65. Norway’s humanitarian strategy dates to 2007-2008 and is currently being updated. The preparedness element of the Rapid Mapping Service shows the strongest overlap with the 2007-2008 humanitarian strategy16.
13 Priority for action 1: Understanding disaster risk; Priority 3: Investing in disaster risk reduction for resilience concerning disaster risk assessment, mapping and management. 14 with references made to the vulnerability of school children. 15 The evaluator interviewed both, the previous counterpart of UNOSAT in the Norwegian Ministry of Foreign Affairs and the current counterpart in Norad 16https://www.regjeringen.no/globalassets/upload/ud/vedlegg/hum/humpolicy_eng.pdf
“Norway’s humanitarian efforts are intended to promote local ownership, an early response on the basis of early warning systems, and response mechanisms that are as predictable and well coordinated as possible. Our efforts are designed to increase resilience to humanitarian crises at local level on the do-no-harm principle, including through humanitarian partnerships with the UN, NGOs and other actors”.
Source: Norwegian Ministry of Foreign Affairs, 2007: Norwegian policy on the prevention of humanitarian crisis. Section 4.2.5 “Humanitarian response and preparedness”

14
2.4 Relevance for countries’ and partners’ needs 66. The combination of online survey results from service users results and
telephone interviews with strategic partners show a very high relevance for 31,4% of stakeholders and a high relevance for 41,9% of stakeholders. 16,3% of stakeholders provided medium ratings.
67. Figure 8 shows that the global average of relevance reaching 83,4% is similar to the selected country cases 17 . In the country cases, the relevance of Rapid Mapping Service varies only slightly at a high-level ranging from 73,3% in the Vietnam floods and tropical cyclone (2016/17) and 86,7% in the Haiti floods in 2017. The rationale for the ratings is outlined in the examples below.
Figure 8: Relevance of Rapid Mapping Service to countries’ and partners’ needs in percentage
68. Figure 9 further quantifies which service clients of the Service used. About 50%
of users participating in the online survey used location, and preliminary situation maps to a great or very great extent. Nearly the same applies to situation analysis updates (50.9%). 47,2% of users used impact and preliminary damage analysis and 45,2% used detailed building assessments. Risk analysis and possible scenario definition maps were used to a lesser extent, probably as they relate to one specific type of natural disaster: tropical cyclones.
69. The quantitative results presented above can be further qualified with the use of the Rapid Mapping Service and its specific products. UNESCAP, for example, stress the importance of the Service for the benefit for UN coordination which is preferable over other service available in Asia. Country needs were identified, for example, in Iraq where UNOSAT provided useful maps after the Iraq and Iran earthquake in 2017 where data helped to verify information from the government.
17 For the country selection criteria, please refer to section 1.3.
50556065707580859095
100Global average
Haiti floods 2017
Mexico earthquake 2017
Caribbean tropical cyclones2017
Philippines tropical cyclone2016
Bangladesh floods(2016/2017)
Iran/Iraq earthquake 2017
Madagascar tropical cyclone2017
Vietnam floods (2016/2017)& tropical cyclone (2017)

15
In the same natural disaster, UNOCHA noted the excellent communication with UNOSAT. While UNOCHA confirmed that data and maps would be used from the service providers with the best quality, the personal touch of UNOSAT’s Rapid Mapping Service is appreciated.
70. UNDP’s Crisis Response Unit identified that the Rapid Mapping Service fully
meet its demand at present. Challenges appear with other departments in UNDP where knowledge about how best to use the Service. Stakeholders in UNOCHA expressed similar challenges.
Figure 9: Use of specific products/services of the UNOSAT Rapid Mapping Service
71. UNOCHA uses the Service for strategic decision-making at headquarters level
while MapAction noted using the service for operational decision-making in the field. UNOCHA appreciated the relevant data and maps during the tropical cyclone Gita in Tonga and stressed its role in directing UNOSAT deliverables to relevant decision-makers, through this event was outside the evaluation period.
72. The International Charter expressed appreciation of the speed and low cost of the Rapid Mapping Service, describing the Service as a critical pillar and critical link in the emergency response chain.
0
10
20
30
40
50
60
Risk analysis/possiblescenario definition maps
(pre disaster)
Location/preliminarysituation maps (24 hours
after the disaster)
Situation analysis updates(up to 72 hours after the
disaster)
Impact & preliminarydamage analysis (after 72hours after the disaster)
Detailed building damageassessment (1-2 weeks
after the disaster)
Pe
rce
nta
ge
To a great to very great extent To a moderate extent To a small extent or not at all No answer
“Data is the currency of the Rapid Mapping Service. It is their added value to support decision-makers.” “We consistently use Rapid Mapping Service when working on the situation analysis during the first 72 hours after a natural disaster. UNOSAT produces data instantly. Then we send data to the UN country office". “UNOSAT is the only partner providing Rapid Mapping Service to UNDAC. The service[s] were unique in the past. Now they have to compete or cooperate with other service providers.” Sources: Survey respondents
16
73. A private sector partner stressed the relevance for the Service, as satellite communication is often the only communication channels left when mobile telephone networks are out of service after natural disasters.
74. Map Action appreciates the Service as a provider of “bigger picture data” that is
subsequently combined with data for example on infrastructure such as United Nations Children's Fund (UNICEF) data on water points. MapAction’s maps about the status of water points in Dominica following the tropical cyclones in 2017 is one results of the previously mentioned approach.
2.5 The validity of the Theory of Change 75. The Service’s ToC is grounded in information from the 2017 UNOSAT funding
proposal to Norad. Subsequently, the evaluator reconstructed the Rapid Mapping Service ToC and discussed it with members of the Rapid Mapping Service team.
76. Overall, the logic identified for the service from output to impact is valid. All service providers interviewed for this evaluation are challenged in determining the contribution of rapid mapping to an enhanced evidence-based and ultimately improved humanitarian assistance.
77. The assumptions, barriers, and drivers of change are correctly identified. This
includes the critical assumptions concerning the institutional capacities of the Rapid Mapping Service about the predictability of adequate funding and the potential to attract and retain qualified technical staff. Without those assumptions holding, the Service cannot function efficiently affecting the institutional performance. At this point following the funding cuts from the donor Norway, those critical assumptions are being tested.

17
3. Efficiency: were resources used appropriately to achieve results? 78. This section analyses the efficiency of the Service based on the following set of
sub-criteria, as suggested in the evaluation matrix: i) cost-efficiency in comparison with alternative approaches; ii) timeliness of service delivery; iii) alternatives to the Service; and iv) appropriateness of partnership modalities. The principal sources of evidence for assessing this criterion are the document review, the online survey and the interviews with service users.
79. The evaluation finds satisfactory achievement in most areas, but partial
achievement in others. The score for the evaluation criterion of efficiency is “amber/green” with a rating of 75% out of 100%.
3.1 Cost efficiency in comparison with alternative approaches 80. The costs of the Service per activation compare favorably with costs of the main
competitor, the Copernicus Emergency Mapping Service (EMS). A calculation of costs for 2016 and 2017 shows that Copernicus EMS incurs Euro 146,285 per activation18 in average19. The costs compare to USD 11,886 the UNOSAT Rapid Mapping Service incurs per activation. This figure excludes in-kind contributions. When including in-kind contributions by CERN, the United States government and the Algerian Space Agency for 2016/2017 for the entire UNOSAT programme, beyond the Service20, the figure per activation rises to USD 41,151.
Table 2 provides further details on the cost comparison21.
81. Figure 10 shows that the differences in costs between the Rapid Mapping
Service and Copernicus Emergency Mapping Service reaches 70.2% to 91.4%, depending whether in-kind contributions for UNOSAT are included.
18 The annual number of activations of Copernicus EMS as higher than the annual number of activations of the UNOSAT Rapid Mapping Service, as EMS also covers Europe while UNOSAT does not. 19 http://www.copernicus.eu/sites/default/files/library/Com_Impl_Decision_WP2017_0.pdf http://ec.europa.eu/transparency/regdoc/rep/3/2016/EN/3-2016-743-EN-F1-1-ANNEX-1.PDF 20 For contributions from CERN and the United States government data is not disaggregated by type of UNOSAT services. 21 Exchange rate monthly median of EURO/USD 0,8998 for 2016 and EURO/USD 0,8794 for 2017 (www.oanda.com)
Key findings: Overall, the Service uses resources efficiently.
• Costs incurred by the Service compare favorably with 70.2% to 91.4% less costs of the main competitor, the Copernicus Emergency Mapping Service
• Humanitarian stakeholders use UNOSAT Rapid Mapping Service alongside alternative service providers such as Copernicus or regional providers. Timeliness and quality of service (for example percentage of cloud cover on imagery) determine which provider is used on a case-by-case basis.
• Memoranda of Understanding (MoU) between UNITAR and partners are the main partnership modality. The generic character of MoUs is appreciated by partners to maintain certain levels of flexibility. However, several partners would appreciate a more strategic engagement and dialogue with UNOSAT.
• Stakeholders experience the timeliness of the Rapid Mapping Service positively, with ratings reaching 77%. For 86% of service users, the timeliness of Rapid Mapping Service constitutes an enabling factor for informed decision-making.

18
Figure 10: Cost per activation – comparison between UNOSAT Rapid Mapping Service (RMS) and Copernicus Emergency Mapping Service (EMS) for 2016 and 2017
Table 2: Comparison of costs between UNOSAT Rapid Mapping Service and Copernicus Emergency Mapping Service for 2016 and 2017
Year Number of activations
Annual budget Cost per activation USD
Copernicus EMS 2016 33 7,324,000 Euro
249,510
UNOSAT RMS 2016 17 791,090 USD 711,822.8 Euro
41,872
Copernicus EMS 2017 63 4,450,000 Euro
79,410
UNOSAT RMS 2017 29 1,101,878 USD 968,992 Euro
33,413
Copernicus EMS Average 2026/1017 137,882
UNOSAT RMS without in-kind contributions
Average 2026/1017 11,886
UNOSAT RMS with all in-kind contributions beyond RMS22
Average 2026/1017 41,151
82. Technological considerations: Stakeholders consider the use of drones as
complementary to satellite-based technologies. Though potentially cheaper in their application and able to operate below cloud cover, the geographical coverage of drones is significantly inferior to satellites, as experienced by stakeholders. Besides, drones also need permission to fly from authorities.
83. Looking towards the future, machine and automated learning, virtual reality and
augmented reality are likely to change the face of any rapid mapping initiatives in general. Automation is likely to replace some of the task currently being undertaken by data analysts. However, data analysts are not replaceable. They
22 Services provided in-kind to UNOSAT: calculated at USD 158,840 per year for 2016 and USD
186,462 for 2017 from CERN for hosting the office and USD 306,250 (2016) and USD 574,675 (2017) for high resolution Satellite images from the United States government. Besides, in-kind services valued at USD 120,000 were provided for seconded staff by the Algerian Space Agency in 2017.
137882
11886
41151
0
20000
40000
60000
80000
100000
120000
140000
Copernicus EMS UNOSAT RMS excluding in-kindcontributions
UNOSAT RMS with all in-kindcontributions for UNOSAT
In U
SD

19
will still be required for quality control, an understanding of clients’ needs and the provision of customized products for specific situations to avoid a one-size fits all approach. The future developments will require additional investments in technology while offsetting some staff time due to the automation of tasks.
3.2 Alternatives to UNOSAT Rapid Mapping Service
84. Among humanitarian stakeholders, the alternative service provider Copernicus Emergency Management Service 23 or regional providers such as Sentinel Asia are also appreciated. However, some stakeholders are unsure about its coverage and priorities of Copernicus outside the European Union (EU) while the UNOSAT Rapid Mapping Service have a global mandate by belonging to the UN. For others, the service provider providing the fastest response at a sufficiently high quality24 is the preferred option, irrespectively of its UN or EU origin. From the perspective of the International Space Charter, coordination issues among the emerging numbers of rapid mapping providers are on the agenda. In fact, this evaluation shows that both UNOSAT and Copernicus had provided in parallel similar data for the 2017 Tropical Cyclone Maria.
85. In Asia, national or regional mapping agencies have a local value and are more contextual than UNOSAT Rapid Mapping Service. They are considered complementary to UNOSAT.
86. For most stakeholders interviewed in OCHA and UNDP, at present, no
replacement for the Rapid Mapping Service exists, but alternatives at the regional level and the global player Copernicus emerge.
3.3 Appropriateness of partnership modalities 87. The Memoranda of Understanding (MoU) between UNITAR and partners are the
main partnership modality UNOSAT uses. The MoUs comprise a wide range of UNOSAT services, including ones related to Rapid Mapping for the following partners:
• ESCAP
• ICRC
• MapAction
• OHCHR
• OTP-ICC The Office of the Prosecutor of the International Criminal Court
• RCMRD (Regional Centre for Mapping of Resources for Development
• UNHCR
• UNICEF Emergency Programmes, Early Warning & Preparedness
• UNOCHA
• UN Secretariat
• World Meteorological Organisation
23 See endnote 1 24 For example cloud cover on imagery.
“The quality of the Rapid Mapping Service makes a real difference. There is a UNOSAT standard”. Source: Survey respondent

20
88. The analysis of MoUs showed their generic character which is appreciated by
partners to maintain certain levels of flexibility. ESCAP reported that the MoU with UNITAR helped to institutionalize the partnership. Partners like UNDP, UNOCHA and MapAction see the MoU with UNITAR as an intent for cooperation. The better UNOSAT and its Rapid Mapping Service are known to the partner, the more value is attached to the MoU. Secondments of UNOSAT staff to UNDP’s Crisis Response Unit in Geneva and UNOCHA helped relevant staff in the partner organizations to better understand the service on offer from UNOSAT and its Rapid Mapping Service.
89. Partners like UNOCHA stress the desire for more strategic engagement and dialogue with UNOSAT. UNOCHA's NAAS, for example, suggests to streamline rapid mapping service, to be automatically provided by UNOSAT as a natural disaster strikes. ESCAP identified the potential to merge work plans to include the UNOSAT Rapid Mapping Service liaison officer in the ESCAP office in Bangkok more into its work.
90. MapAction sees monitoring and evaluation as one potential area of more
strategic cooperation with UNOSAT. Assessing downstream decision-making about the decision-makers use of maps and data could be a specific area of cooperation. However, partners are aware that a more strategic engagement with the Rapid Mapping Service requires investments concerning human and financial resources for the involved parties.
91. For MapAction, a non-UN partner, the MoU with UNITAR also has the effect of a
“stamp of recognition” which is much appreciated, as it helps to increase the credibility of MapAction.
92. Eight out of 12 institutional partners assessed the appropriateness of their
partnership arrangements with UNOSAT as high to very high, three as medium and one as low, as shown in Figure 11. No very low ratings show.
Figure 11: Appropriateness of partnership modalities
Very high High Medium Low Very low

21
3.4 Timeliness of the Raping Mapping Service 93. Over the last ten years, the speed of providing relevant imaging products has
continuously increased. Due to a broader spectrum of earth observation resources, processing times shortened.
94. In this context, the timeliness of the Service is generally high with the Rapid
Mapping Team being on call 24 hours a day, seven days a week, despite not being an entirely voluntary-funded operation. In effect, UNOSAT depends on others in a chain of service, for example, to obtain satellite images from relevant providers. Besides, cloud cover in the tropics can require several flight overs by satellites to capture a specific location, which also affects timeliness.
95. Regardless those limitations, 86% of survey respondents reported timeliness of the Service as an enabling factor for informed decision-making. All twelve UNOSAT partners consulted about the timeliness of the Service experienced high or very high timeliness of service delivery.
96. Figure 12 summarizes the combined results of the online survey and interview
with 66,3% of stakeholders testifying the timeliness of the Rapid Mapping Service as high to very high.
Figure 12: Timeliness of UNOSAT Rapid Mapping Service for evidence-based decision making in Percentage
97. The comparison of country-level results shows little variation concerning the
timeliness of the Rapid Mapping Service, as presented in Figure 13. The timeliness of service delivery during the 2017 Iran/Iraq earthquake and the Vietnam floods and tropical cyclone (2016/17) reached 77%, in line with the global average. The lowest ratings emerge for the 2017 tropical cyclones in the Caribbean and the Philippines with 68%.
23,4
42,9
29,9
1,3 1,3 1,3
0,0
5,0
10,0
15,0
20,0
25,0
30,0
35,0
40,0
45,0
50,0
Very high High Medium Low Very low Do not know
“Actually, we do not have to wait for UNOSAT. They are on time unless there is cloud cover. But that is out of their hands". Source: Survey respondent

22
98. UNOCHA uses the Rapid Mapping Service for example for its Situation Analysis and experiences the Service as very reliable with delivery within 24 hours. For products delivered after 72 hours, timeliness also seems high. Evidence from the online survey and interviews with institutional stakeholders point towards the rapid response from UNOSAT in the Iraq/Iran earthquake or for a tropical cyclone in Madagascar both in 2017.
99. For the International Charter, the timeliness of the Service compare with the
standard. Figure 13: Timeliness of Rapid Mapping Service for evidence-based decision making - country-level results in Percentage
100. The activations through the International Charter document the timeliness of
Rapid Mapping Service.
50%
55%
60%
65%
70%
75%
80%Global average
Haiti floods 2017
Mexico earthquake 2017
Caribbean tropical cyclones2017
Philippines tropical cyclone2016
Bangladesh floods(2016/2017)
Iran/Iraq earthquake 2017
Madagascar tropical cyclone2017
Vietnam floods (2016/2017)& tropical cyclone (2017)

23
4. Effectiveness: Were the Service’s results achieved and how? 101. This section of the report assesses the effectiveness of the Service using the
following set of sub-criteria: i) achievement of planned objectives; ii) factors affecting the performance of the Service; iii) contribution to support analysis and interpretation of maps, and iv) user satisfaction. The section includes an assessment of the strengths, weaknesses, opportunities, and threats for the Rapid Mapping Service.
102. The principal sources of evidence for assessing effectiveness are the document review, the online survey and the interview with service users complemented with individual interviews with the Rapid Mapping Service team and management.
103. The evaluation finds that the Rapid Mapping Service shows satisfactory
achievement in most areas, but partial achievement in others. The score for effectiveness is "amber/green." With 75% out of 100%, this constitutes the highest possible score for "amber/green."
4.1 Achievement of the service’s objectives 104. Prior to receiving funding from Norad, there was no log frame or results
framework specifying targets and indicators for the Service. As the Norad funding only started at the end of 2017, those targets and indicators are not used for this evaluation to assess the Service’s performance for 2016 and 2017. Instead, the overall objectives of the Rapid Mapping Service are used as a reference point: to provide better information for informed decision-making in situations of natural disasters and enhanced operational coordination.
105. Figure 14 provides an overview of the level of achievement of both objectives based on the experiences of the users and institutional stakeholders.
Key findings: The level of results achievement is satisfactory.
• Stakeholder satisfaction about the contribution of the Service to evidence-based decision making is at 75,8%. Being even less under the control of the Rapid Mapping Service, the stakeholder satisfaction about the contribution of the service to enhanced operational coordination in humanitarian assistance is 69%.
• Factors positively affecting the performance of the Rapid Mapping Service are the timeliness of service delivery (86%) and the level of quality of service (80%). 71% of users experience the channeling of deliverables as a disabling factor for using the Rapid Mapping Service, the latter being beyond the control of UNOSAT.
• In the current funding crisis of the Rapid Mapping Service, real opportunities are at reach (funding from Radiant Earth partnership), some transforming the role of the service (focus on coordination role as "Center of Excellence"). The future will tell whether the service has sufficient time at hand to embrace those opportunities, as competitors are well positioned to offer this much-needed service to the humanitarian community.
• The satisfaction rate of Rapid Mapping addressing capacity issues through training and ad-hoc support reaches 76% among Service users.
• The overall user satisfaction of UNOSAT Rapid Mapping Service reaches 75% with institutional partners indicating that secondments or placements of Rapid Mapping Service staff in partner organizations made the most significant difference concerning client satisfaction.

24
Figure 14: Contribution of Rapid Mapping Service to decision-making and operational cooperation (in percentage)
106. UNOSAT depends on its partners for channeling its maps, reports, and data
to the decision-makers following a natural disaster. Two-thirds of stakeholders25 find the contribution of the Service to evidence-based decision making as high to very high. For 28% of stakeholders the contribution is medium, and for 2,7% it is low.
107. Enhanced operational coordination in humanitarian assistance is even less under the control of the Rapid Mapping Service, compared to informed decision-making. As shown in Figure 14. 49,2% of Service user and institutional stakeholders perceive the contribution of the Rapid Mapping Service to enhanced operational coordination as high to very high, followed by 34,9 % medium ratings and 11,1 % low to very low ratings.
108. Figure 15 provides an interesting comparison of the contribution of the Rapid
Mapping Service to i) better information for informed decision-making in situations of natural disasters, and ii) to enhanced operational coordination. The former reaches 75,8% based on user feedback from the online survey and the latter 69%.
109. At the country level, the contribution to better information for informed
decision-making showed little variation and was highest in the 2017 Madagascar tropical cyclone with 80%, followed by the 2017 Haiti floods with 76,7%. The lowest ratings of 70% emerge from users involved in the 2017 Mexico earthquake and the Vietnam floods and tropical cyclone (2016/17).
110. The contribution of the Rapid Mapping Service to enhanced operational coordination showed stronger differences among the selected emergencies. Users experienced UNOSAT's contributions as unusually high in the 2017
25 64 stakeholders participating in the online survey and 11 institutional partners being interviewed.
25,3
41,3
28,0
2,7
0,02,7
6,3
42,9
34,9
9,5
1,6
4,8
0,0
5,0
10,0
15,0
20,0
25,0
30,0
35,0
40,0
45,0
Very high High Medium Low Very low Do not know
Contribution to better informed decision-making
Contribution to enhanced operational coordination
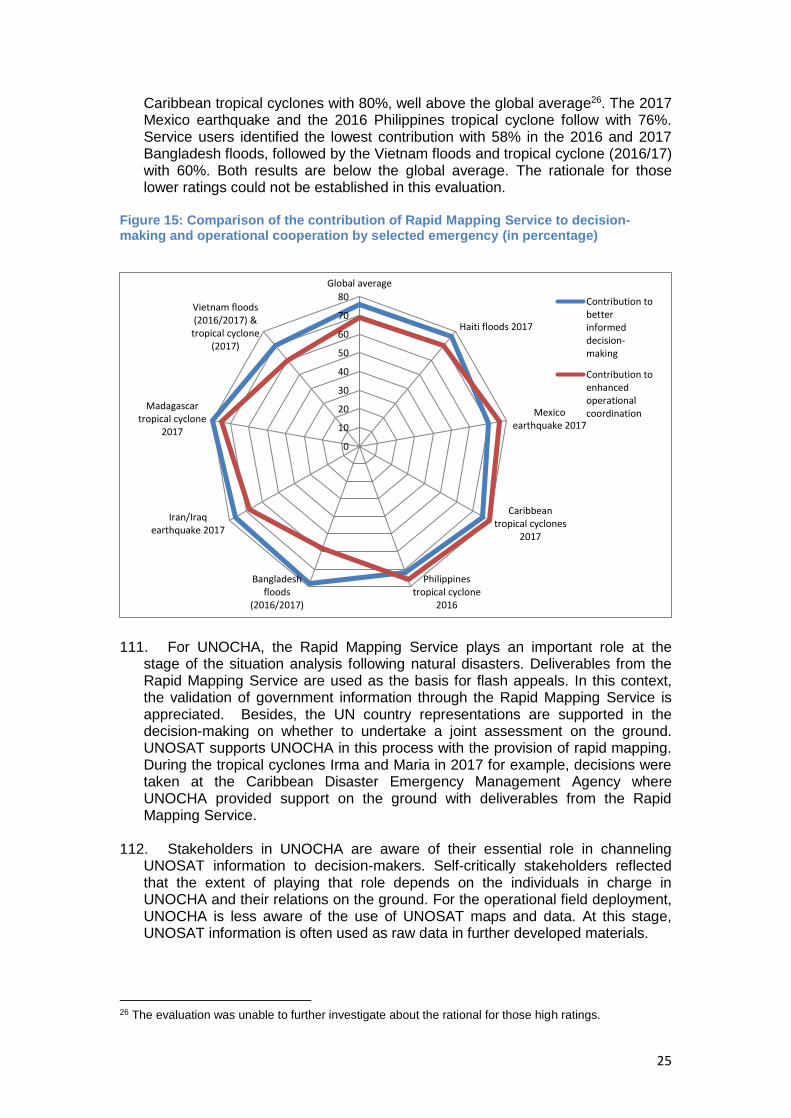
25
Caribbean tropical cyclones with 80%, well above the global average26. The 2017 Mexico earthquake and the 2016 Philippines tropical cyclone follow with 76%. Service users identified the lowest contribution with 58% in the 2016 and 2017 Bangladesh floods, followed by the Vietnam floods and tropical cyclone (2016/17) with 60%. Both results are below the global average. The rationale for those lower ratings could not be established in this evaluation.
Figure 15: Comparison of the contribution of Rapid Mapping Service to decision-making and operational cooperation by selected emergency (in percentage)
111. For UNOCHA, the Rapid Mapping Service plays an important role at the
stage of the situation analysis following natural disasters. Deliverables from the Rapid Mapping Service are used as the basis for flash appeals. In this context, the validation of government information through the Rapid Mapping Service is appreciated. Besides, the UN country representations are supported in the decision-making on whether to undertake a joint assessment on the ground. UNOSAT supports UNOCHA in this process with the provision of rapid mapping. During the tropical cyclones Irma and Maria in 2017 for example, decisions were taken at the Caribbean Disaster Emergency Management Agency where UNOCHA provided support on the ground with deliverables from the Rapid Mapping Service.
112. Stakeholders in UNOCHA are aware of their essential role in channeling
UNOSAT information to decision-makers. Self-critically stakeholders reflected that the extent of playing that role depends on the individuals in charge in UNOCHA and their relations on the ground. For the operational field deployment, UNOCHA is less aware of the use of UNOSAT maps and data. At this stage, UNOSAT information is often used as raw data in further developed materials.
26 The evaluation was unable to further investigate about the rational for those high ratings.
0
10
20
30
40
50
60
70
80
Global average
Haiti floods 2017
Mexicoearthquake 2017
Caribbeantropical cyclones
2017
Philippinestropical cyclone
2016
Bangladeshfloods
(2016/2017)
Iran/Iraqearthquake 2017
Madagascartropical cyclone
2017
Vietnam floods(2016/2017) &tropical cyclone
(2017)
Contribution tobetterinformeddecision-making
Contribution toenhancedoperationalcoordination

26
113. In 2018, stakeholders experienced the added value of the Rapid Mapping Service during the tropical cyclone Gita where imagery analysis helped to prioritize the countries in most need of aid and relief. The Food and Agriculture Organization of the United Nations (FAO) had similar positive experiences during the 2017 tropical cyclone in Madagascar.
114. From government perspectives, the comparison of their own data with UNOSAT maps helps to assess where information matches, as experienced with data from the Bangladesh Hydrological Board and the Bangladesh Meteorological Organization during floods in 2017. Subsequently, data was used to inform a rehabilitation program in zones after the natural disaster. In Madagascar, the National Geographic Institute has the capacities for specialized mapping but not enough funding to permanently fulfill its role. Hence partner support for example from the Rapid Mapping Service is vital in situations of natural disasters. In Colombia and Mexico by contrast, national capacities are strong, but coordination issues jeopardize timely decision-making. In that context, UNOSAT Rapid Mapping Service fill a critical void with timely service provision.
115. However, some stakeholders questioned UNOSAT’s capacity to keep
responding to activations concerning disaster risk preparedness due to the reduced capacities in the Rapid Mapping Service team. In fact, some stakeholders started sensing a limited human resource capacity with a reduced team27.
4.2 Factors affecting service’ performance 116. Five main factors emerge that affect the performance of the Rapid Mapping
Service, as presented in Figure 16. Figure 16: Factors affecting the performance of Rapid Mapping Service (in percentage)
27 Following the decrease in funding from 2014-2017 v. present 2017-2020 funding
86
67
80
60
29
14
33
20
40
71
00
10
20
30
40
50
60
70
80
90
100
Timeliness ofmaps or other
products/services
Product deliveredcorresponding to
user needs
Level of meetingquality
expectations
Ease ofinterpreting the
product
Reach of therequired
distributionchannels
Enabling factor
Disabling factor

27
117. Users reached in the online survey identified the timeliness of service delivery and its quality as the main factors for users to choose the UNOSAT Rapid Mapping Service. For 86% of users, timeliness determined the use of the Service and for 80% service quality. For 67% of users, the Rapid Mapping Service meets their needs, and for 60% the ease of interpreting products makes UNOSAT the service providers of their choice. However, 40% of users struggled with the interpretation of products however, without providing further details.
118. For 71% of users, the reach of distribution channels surface as the primary negative factor affecting the use of the Service. This finding is significant, showing the distance between UNOSAT and its end users while at the same time channeling the products to the end user is out of the hands of UNOSAT.
119. Other factors affecting UNOSAT’s performance which users identified are as follows:
• Insufficient knowledge what to request from the Rapid Mapping Service;
• Natural factors such as cloud cover;
• Limited national capacities; and
• Access to the products in the field with insufficient bandwidth. 120. The country-level analysis of factors affecting the performance of the Service
shows similar results. Users experienced the timeliness of maps or other products and service as an enabling factor with ratings between 83% and 100 %. Slightly lower ratings emerged for the Vietnam floods (2016/2017) with 75% and the Mexico earthquake (2017) with 67%.
121. 75% to 100% of users found the products corresponding to their needs as an enabling factor for the Rapid Mapping Service. Lower ratings emerged again for the Mexico earthquake (67%) and the Madagascar tropical cyclone (2017) with 33%.
122. The ease of interpreting Rapid Mapping Service products was an enabling
factor reaching ratings of 80% in Bangladesh floods (2016/2017) and 100% for Iran/Iraq earthquake 2017 and Madagascar tropical cyclone 2017. 67% of users involved in humanitarian assistance following the Caribbean tropical cyclones 2017 experienced the ease of interpreting Rapid Mapping Service products as an enabling factor for informed decision-making and operational coordination, followed by 50% of users involved in the 2017 Mexico earthquake response.
123. Users of Rapid Mapping Service engaged in response to Philippines tropical
cyclone in 2016 and the Vietnam floods (2016/2017) and tropical cyclone (2017) experienced the interpretation of products as a disabling factor.
124. In line with the global trend, the reach of the required distribution channels for
Rapid Mapping Service products was a disabling factor for users engaged in various emergencies. For example, the response to the 2017 Caribbean tropical cyclones, the 2017 Iran/Iraq earthquake, the 2017 Philippines tropical cyclone and the Vietnam floods (2016/2017) and tropical cyclone (2017). Only in the case of the Bangladesh floods in 2016 and 2017, users experienced the required distribution channels for Rapid Mapping Service products as an enabling factor for their work.

28
4.2.1 Strengths, weaknesses, opportunities and threats 125. The evaluator undertook an analysis of the strengths, weaknesses,
opportunities, and threats of the Service with each team member and management of the Service. Figure 17 summarizes the analysis. The SWOT analysis highlights factors affecting the performance of the Service and is captured below. The section also provides triangulation with the user perspective where possible.
Strengths Staff skills 126. One of the main strengths of the Rapid Mapping Service is its dedicated
team, combining technical expertise and coordination skills with a personal engagement of clients. The latter point was also repeatedly mentioned in the interviews with the Service’ institutional stakeholders. The evaluator experienced the high dedication of the team during the visits to its offices.
Figure 17: SWOT analysis of the UNOSAT Rapid Mapping Service
Integration into the humanitarian project cycle 127. Understanding the needs of different humanitarian actors makes a difference
which many Institutional partners acknowledged. The ability to timely react with objective information is essential. Equally important is the ability of the Rapid Mapping Service to define specific products for different timing at project cycle

29
aligned with OCHA and integrated with overall humanitarian mechanisms. The integration in humanitarian relief and emergency response system appears as a crucial development over the last two years. UNOCHA and UNDP acknowledged good progress in the critical issue of synchronization of service delivery to meet their needs. After ten years of existence, the Rapid Mapping Service are now well known across the UN humanitarian network, providing quality technical support and a human face to its clients.
Weaknesses
Scaled down human resources 128. The primary weakness of the Rapid Mapping Service is its reduced human
resource capacity following the budget cut resulting from the 2017-2019 Norad funding. The Service is not operating with the needed critical mass of staffing. Until the end of 2017, before the budget cut, the five-person team seemed nearly appropriately staffed to reply to most requests. Now staff members need to work for five to six months per year on other projects due to the underfunding of the Service, and the manager of the Service can only spend one to two months per year on management responsibilities, a void which is felt in the team. The role of internships is becoming more critical in the team as the number of team members got reduced. However, staff needs to invest in training internship persons who are exiting the Service on a six-monthly basis.
129. The staffing situation limits the Service to reacting to activation requests and does not allow for planning and implementing development activities such as future MoUs, joint strategies or joint activities with partners. Overall, the present staffing situation is unsatisfactory and unsustainable.
Opportunities 130. In an overall bleak financial situation, the Rapid Mapping Service is at
crossroads. The question is whether there is sufficient time left for the Rapid Mapping Service to leverage existing funding opportunities, following a negative response to a funding proposal to a potential new donor. UNOSAT’s engagement as the provider of Rapid Mapping Service to Radiant Earth, a partnership funded by the Bill and Melinda Gates Foundation and the UK Space Agency, among others is another future funding source.
131. The development of a pool of stand-by experts to get help in the in Rapid
Mapping Service when needed and paid for by a partner engaged in emergency coordination is an opportunity for relieving the Service of costs. The same applies for initiatives to strengthen analytical capacities in countries like Mexico or Dominica to balance capacity gaps in the UNOSAT Rapid Mapping Service team, though with uneven results to date. Secondments from partners is another option to temporarily address the issue of stretched staff capacities, though not a sustainable one.
132. Other opportunities are found in a modified role of the Rapid Mapping Service focusing more on coordination and impact assessment. The evaluation interviews
"We are at crossroads”. Source: Rapid Mapping Service

30
showed that an opportunity emerges for the assessment of the impact of Rapid Mapping Service, as other partners contributing to similar service face similar challenges. In fact, the donor Norad would be interested in real-time user feedback on the Rapid Mapping Service. Mobile applications seem suited for such user feedback, as interviews with the UNOSAT partner AnsuR revealed.
133. Rather than treating the enhanced capacities of partners as a threat, the
Rapid Mapping Service move into the role of a “Center of Excellence” where UNOSAT plays a stronger coordination function and to a lesser extent an analytical function. Reliving the Rapid Mapping Service from much of its analytical role, the Service could better operationalize many of its MoUs with partners. The latter idea is shared with UNOSAT’s institutional partners but controversially discussed in the Rapid Mapping Service team.
134. The possibility of introducing a subscription to the Service emerges as
another opportunity, whereby UN agencies would pay an annual subscription fee. That fee would make them eligible not only to free products and services when a disaster would strike, but also additional information such as a periodic newsletter with analysis on GIS support in humanitarian assistance.
135. In an environment of real opportunities, time is required to sell the Rapid
Mapping Service further. The question arises whether there is sufficient time left for the Rapid Mapping Service to embrace those opportunities, as competitors are well positioned to offer this much-needed service to the humanitarian community.
Threats Underfunding 136. The main threat to the Rapid Mapping Service is underfunding. Insufficient
funding might cause the loss of further staff, resulting in the loss of networks and expertise. The “human touch” of the Rapid Mapping Service is at stake, a comparative advantage most institutional stakeholders identified for the service.
137. Ultimately, this situation is a threat to the very existence of the Rapid Mapping Service. It comes without saying that underfunding also threatens UNOSAT's technological advantage to "stay ahead of the curve."
Competitors 138. Other Rapid Mapping Service providers such as Copernicus would only be a
threat to UNOSAT if future cooperation would not exist. Any kind of future cooperation with Copernicus is required to manage the risk of Copernicus threatening the existence of the UNOSAT Rapid Mapping Service due to the significant differences in the operational budgets.
4.3 Contribution to support analysis and interpretation of maps 139. Interviews with the Rapid Mapping Service team and institutional partners
pointed towards capacity issues of some users to correctly interpret the maps produced by the Service.
140. The Rapid Mapping Service addresses capacity issues through training and ad-hoc support, predating the current Norad funding. Users experienced UNOSAT support in the analysis and interpretation of maps, with 64,5% of users

31
describing the Rapid Mapping Service as being supportive (14,5%) or very supportive (50%). 30,6% of users described the support as medium and 1.6% of users as very low. Figure 18 provides an overview of the results.
Figure 18: User experience in UNOSAT support for analysis and interpretation of maps
141. Users of the Rapid Mapping Service at country level following natural
disasters in 2016 and 2017 experienced the support to the analysis and interpretation of maps to levels similar to the global average without significant variations.
142. Users operating during the 2017 Caribbean Tropical Cyclone experienced above-average support for the analysis and interpretation of maps, with ratings of 84% compared to the global average of 76%. A similar situation shows for Service users during the 2017 Mexico earthquake and the 2016 Philippines tropical cyclone, as shown in Figure 19.
Figure 19: Country experience in UNOSAT support for analysis and interpretation of maps (in percentage)
14,5
50,0
30,6
1,6 3,2
Very high High Medium Low Very Low No answer
50%
55%
60%
65%
70%
75%
80%
85%Global average
Haiti floods 2017
Mexico earthquake 2017
Caribbean tropical cyclones2017
Philippines tropical cyclone2016
Bangladesh floods(2016/2017)
Iran/Iraq earthquake 2017
Madagascar tropical cyclone2017
Vietnam floods (2016/2017) &tropical cyclone (2017)

32
143. The users of Rapid Mapping Service during the Iran/Iraq earthquake in 2017
and the 2017 Madagascar tropical cyclone experienced levels of support in the analysis and interpretation of maps which was close to the global average, with 77% and 75% respectively. Users involved in response to the Bangladesh floods in 2016 and 2017 provided ratings of 71% for the Rapid Mapping Service’ support to the analysis and interpretation of maps.
4.4 User satisfaction 144. As a proxy indication, the average of the four performance related questions28
in the online survey shows the user satisfaction of the Rapid Mapping Service. Figure 20 indicates that 58,9% of service users are highly to very highly satisfied with the UNOSAT Rapid Mapping Service. 33,6 % of users show medium satisfaction while 4.5% of users are unsatisfied or very unsatisfied.
Figure 20: Proxy indication of Rapid Mapping Service user satisfaction
145. The telephone interviews with institutional partners revealed that using a
“before/after” approach, secondments or placements of Rapid Mapping Service staff in partner organizations made the most significant difference concerning client satisfaction.
28 Concerning i) a basis for better-informed decision-making; ii) timeliness to allow for evidence-based decision making; iii) enhanced operational coordination, and iv) support to analysis/ interpretation capacities. Additional data on the rational of user satisfaction beyond those four criteria is unavailable.
12,6
46,3
33,6
3,2 1,2 3,1
Very high High Medium Low Very low No answer
“We in UNESCAP have witnessed a marked improvement in working with the Rapid Mapping Service since the UNOSAT staff was placed in our office. We give our intelligence directly to UNOSAT. In turn, ESCAP has better and quicker access to Rapid Mapping Service' products. Our Member States are very happy, and the UNOSAT service are much appreciated". Source: UNOSAT institutional partner

33
146. This feedback came strongly from ESCAP where a staff member is placed29,
UNOCHA and UNDP, both benefitting from secondments in the past. Secondments or placements allowed to understand better the service UNOSAT offers and to operationalize the MoUs with UNOSAT. For the Rapid Mapping Service, the secondments or placements allowed to understand clients' needs better and to tailor its service accordingly.
147. Figure 21 shows a comparison of user satisfaction across countries using the
same proxy measure as in Figure 20. Results show a high performance with little variation across the selected countries experiencing emergencies in 2016 and 2017. User satisfaction ranges between 76% in the case of the 2017 Madagascar tropical cyclone and 70% for the 2016/17 Bangladesh floods and the 2016/17 Vietnam floods and tropical cyclone. The global average reached 75% for user satisfaction.
Figure 21: Country comparison - proxy indication of Rapid Mapping Service user satisfaction (in percentage)
29 UNOSAT-funded, while ESCAP would be willing to share the funding of the post.
50%
55%
60%
65%
70%
75%
80%Global average
Haiti floods 2017
Mexico earthquake 2017
Caribbean tropical cyclones2017
Philippines tropical cyclone2016
Bangladesh floods(2016/2017)
Iran/Iraq earthquake 2017
Madagascar tropical cyclone2017
Vietnam floods (2016/2017)& tropical cyclone (2017)

34
5. Impact: What change did the Service bring about? 148. This section analyzes the Service’s impact. Sub-criteria used are i) the
difference made to partners; ii) the cumulative effects of the service; iii) a counterfactual enquiring about humanitarian assistance without the Rapid Mapping Service; iv) stakeholder ability for decision-making and operational coordination; v) effects on timeliness; and vi) effects on costs. Principal data sources used in this section are interviews with institutional partners and the online survey.
149. The evaluation finds that the impact of the Service shows satisfactory
achievement in most areas such as the difference made to partners, cumulative effects of the Service and their comparative advantage concerning timeliness and cost. The counterfactual shows however that alternative options to the UNOSAT Rapid Mapping Service are available and could be used as a replacement for the majority of users participating in the evaluation. The score for impact is "green-amber" (71% out of 100%)30.
5.1 The difference made to partners' and end beneficiaries' work in humanitarian assistance: impact resulting from the Service 150. The Service share the fate with other actors in space-related emergency
response such as MapAction or AnsuR about the lack of evidence concerning their impact. To date, information about the use of the Service is captured only for activations through a protocol under the Space Charter. Testimonials are used for this purpose, for example from e-mails commenting on the quality or timeliness of the service.
30. The score is calculated based on average of the following sub-criteria: Difference made to partners: green/amber (scores 3 out 4); cumulative effects of the service: green/amber (scores 3 out 4); counterfactual: amber/red (scores 2 out 4) ; stakeholder ability on decision-making and coordination green/amber (scores 3 out 4); effects on cost; green/amber (scores 3 out 4); effects on timeliness green/amber (scores 3 out 4);
Key findings:
• In the context of overall positive results, the lack of evidence about the utility of Service to end-users leads to underreporting on impact, while technical solutions related to UN-ASIGN and UNOSAT’s cooperation with AnsuR seem feasible.
• The contribution to better humanitarian assistance in the long-term reaches a rating of 71,9%, followed by 69,1% for making a real difference to the users’ work in humanitarian assistance by better focusing UN and national governments’ emergency responses.
• The most potent effects of the UNOSAT Rapid Mapping Service seem to show at the initial stages of decision-making processes at UN headquarter levels when a situation analysis is required.
• For 78% of users alternatives to the UNOSAT Rapid Mapping Service are at reach while 13% of users would fear adverse effects concerning timeliness and costs.
• In ESCAP alone, UNOSAT Rapid Mapping Service (with a budget of USD 546.000 for 2016/17) are valued USD 600.000 to 700.000 per year. A minority of stakeholders identified negative cost implications in the absence of the Rapid Mapping Service in natural disasters in Colombia, Indonesia, Iran/Iraq, Madagascar, and Mexico.

35
151. Yet from the donor side, the interest to learn more about the utility of service is given, and preference is given to timely, more rapid feedback.
152. Institutional stakeholders identify the following main aspects determining the
impact of UNOSAT Rapid Mapping Service: i) Power of data visualization and ii) communication channels.
153. UNOCHA experienced that data visualization often makes a breakthrough
with the governments, as decision makers like to have maps in those situations of natural disasters. Maps and other products provided by UNOSAT give the UN the required authority based on evidence which is not available for national governments. Even if not leading to direct operational decisions, this authority is vital for the UN to play its role effectively. In fact, other institutional partners pointed out that maps per se are products, not decision-making tools. Those products are often transformed from their original format, as practiced by MapAction. In the case of Dominica for example, UNOSAT’s maps on the devastation after hurricane Maria in 2017 were further refined by MapAction to map the food status or portable water status across the island.
154. One of the primary applications of the UNOSAT Rapid Mapping Service is the
determination of the scale of natural disasters to inform assessments on the ground and subsequent deployment, as witnessed by an institutional stakeholder over many years for example in the case of earthquake in Ecuador (2016).
155. Communication channels: UNESCAP experienced that deliverables from
UNOSAT Rapid Mapping Service are fit for purpose. UNOCHA coincides that UNOSAT reaches the right people in the first line of communication, with a challenge to reaching the right national stakeholders down the line of decision-making once the process is out of the hands-on UNOSAT. As such, communication with the end-users of the service31 is very limited and the impact unclear. However, options to increase communication and feedback are presented in the box above.
156. Four out of seven institutional stakeholders judged the difference made to
partners and end-beneficiaries work in humanitarian assistance as high to very high, two as medium and one as low.
5.2 Cumulative effects of the Service 157. Figure 18 provides an overview of the user perspective on the longer-term
effects of the work of UNOSAT’s Rapid Mapping Service. Overall, the users judge the longer-term effects of the service positively. The contribution to better humanitarian assistance in the long-term reaches a rating of 71,9%, followed by 69,1% to make a real difference to the users' work in humanitarian assistance.
31 National stakeholders or UN partners in the field
Option for real-time feedback on the Service ANSUR solutions: apps for end-user feedback on the accuracy of the images and data and options how to improve. For UN-ASIGN, a feedback form could be added to the existing app. One additional form with one question about the correctness of a map in the user’s location could be linked to geographical information service. This addition would allow capturing the georeference and timing when a response is given.

36
158. Figure 18 shows that 56% of users perceive that the service contributes to better humanitarian assistance in the long-term to a great or very great extent. For 43,3% of users, the Rapid Mapping Service make a real difference to the users’ work in humanitarian assistance in serving end beneficiaries to a great or very great extent. However, equally another 43,3% of users judge those effects as moderate.
Figure 18: Effects of the Rapid Mapping Service (in percentage)
159. Based on the interviews with institutional partners, the most potent effects of
the UNOSAT Rapid Mapping Service seem to show at the initial stages of decision-making processes at UN headquarter levels when a situation analysis is required following a natural disaster. This finding is partly influenced by the fact that the use of service further down the line of decision-making processes is currently hardly traced.
160. The evaluation finds that UNOSAT Rapid Mapping Service help the UN and national governments to be better focused in their emergency response.
161. In the example of the floods in Thailand in December 2016, the Thai space
agency contacted UNESCAP for support after being overwhelmed Flood warning and information about the progression of the flood resulted from combining UNOSAT maps and UNESCAP analysis. Ultimately, UNOSAT Rapid Mapping Service contributed to precise national bulletins for public awareness raising, with information also being used in national newspapers.
162. One more cautious voice among institutional stakeholders questions the size
of cumulative effects of space-related emergency response in general. The use of a consensus focused approach in natural disaster response rather than command and control processes like in the military would diminish the time gained by using satellite technologies. Another critical voice questioned UNOSAT's capacity to build capacities at country level for example to use mobile phone applications. Though technically sound, such applications developed by UNOSAT compete with a wide range of other applications and require training for
10,0
33,3
43,3
6,7
1,7
5,0
8,5
47,5
25,4
10,2
0,0
8,5
0,0
5,0
10,0
15,0
20,0
25,0
30,0
35,0
40,0
45,0
50,0
Very great extent Great extent Moderate extent Small extent Not at all Do not know
Making a real difference to work in humanitarian assistance in serving end beneficiaries
Contribution to better humanitarian assistance in the long term

37
potential users. In humanitarian assistance those users tend to change in a fast and fluid environment, requiring continuous training efforts. As a result, cumulative effects of the service would be diminished by the lack of internal capacities.
5.3 What would have happened if the Service did not exist? 163. Due to the limitations in the evidence base of the impact of UNOSAT Rapid
Mapping Service, the evaluation aims to establish a counterfactual. The latter was created by asking users and institutional partners what would have happened if the service did not, or ceased to, exist.
164. The user perspective out of 46 users responding to this question, 78% would use other open source providers such as Copernicus, Sentinel Asia, Open Streetmap or Google maps. 22% of users would not be aware of any alternative to the UNOSAT Rapid Mapping Service. 13% of users mention negative implications for cost and timeliness for alternative service delivery. The following cases showcase what would have happened in natural disasters if the UNOSAT Rapid Mapping Service had not existed, representing the 13% of users listed above.
165. An institutional partner cooperating with UNOSAT during the tropical cyclones
in the Caribbean in 2017 states that their own real-time monitoring tool could have been used as a fallback position. However, being able to compare results of their tool with UNOSAT's Rapid Mapping Service makes both stronger.
166. A national stakeholder in South Asia pointed to the availability of alternative
open source data but the limitations in the analytical capacity in the country which is currently delivery by the UNOSAT Rapid Mapping Service.
167. Stakeholders in UNESCAP find that in the Asia-Pacific region a reluctance
prevails to access global mechanisms due to cultural norms and political reasons. As international mechanisms are underutilized and some countries have not signed up to the International Charter, the cooperation between UNOSAT and ESCAP tap into regional support mechanisms with seem the preferred option in Asia-Pacific.
168. The box below showcases the wide range of views of institutional
stakeholders about what would happen if UNOSAT Rapid Mapping Service would not exist32.
32 The Management of the UNOSAT Rapid Mapping Service strongly disagrees with one of the quotes above, as still relatively few countries have their own satellites and the maps produced from these would face challenges in meeting the user requirements of the humanitarian community.
“This is a good question! What would happen if UNOSAT Rapid Mapping Service would not exist? In many emergencies, I simply can’t imagine them not being there. Alternative sources such as Copernicus do exist but are less predictable. With UNOSAT there is no back and forth. They have good administrative procedures in place, and they deliver 24/7." Source: Survey respondent “If UNOSAT Rapid Mapping Service would not exist, not much would happen. Government maps are available, and we have countries with their own satellites in our region". Source: Survey respondent

38
5.3.1 Stakeholders ability for decision making and operational coordination
169. As stated in the previous section, UNOSAT Rapid Mapping Service support
stakeholders to varying degrees, with alternative open source service providers at hand for many users and institutional partners. 66% of stakeholders find the contribution of the Rapid Mapping Service to evidence-based decision making as high to very high, as reported in section 4. The contribution of service to enhanced operational coordination in humanitarian assistance reached 48,9% high to very high ratings.
170. The service being part of the UN system provides neutrality which is appreciated and ensures coverage even in regions that might not be of interest to other service providers. Besides, the service is tuned in administrative procedures which facilitate swift cooperation with partners in the UN system. Those advantages are difficult to challenge by non-UN service providers. However, this view is only shared by a minority of users.
5.3.2 Effects on the timeliness 171. As stated in section 3 of this report, 66,3% of stakeholders found the
timeliness of the Rapid Mapping Service high to very high. 86% of service users experienced the timeliness of Rapid Mapping Service as an enabling factor for informed decision-making.
172. Users appreciate the synchronization of the Rapid Mapping Service with humanitarian processes. Some users question whether competitors would achieve this high level of synchronization which would affect the timeliness of service delivery.
173. A UN user engaged in natural disaster response in Asia and the Pacific stated
that there are other providers of rapid mapping services based on satellite image analysis in the region. "However, none are as timely, and as finely tuned to the needs of emergency responders as UNOSAT. None are even close, actually". This view is shared by some institutional stakeholders of the UN in the region, where UNOSAT is appreciated to triangulate data for validation purposes. Without the UNOSAT Rapid Mapping Service UN agencies would be severely hampered in their evidence-based support.
174. UNOCHA’s NAAS describe the Rapid Mapping Service as the custodian of
the workstream to shape the situation analysis within 72 hours of a natural disaster. Undertaking situation analysis without the Rapid Mapping Service would cause delays in the process.
5.3.3 Effects on costs 175. The evaluation finds that the actual costs of funding the Rapid Mapping
Service for the donor Norway are low compared to the value of the Service to its partners. While quantifying cost-implications were challenging for this evaluation one example emerges from UNESCAP. In the Bangkok-based UN organization, about 200 images are produced per year, at the cost of USD 1m. With 60% to 70% of the images being provided by UNOSAT, the Rapid Mapping Service are valued at USD 600.000 to USD 700.000 per year by its institutional partner

39
UNESCAP33. Those figures need to be compared to the budget of the Rapid Mapping Service of USD 546.00034 for 2016 and 2017.
176. In the case of the earthquake in the border region between Iran and Iraq in 2017, a UN source could have resorted to using existing satellite images and population data to perform extrapolations to get an estimate of the of the potential and actual damage. However, this alternative would have required more time and resources.
177. Evidence from the 2017 Mexico earthquake and the 2017 landslide in
Colombia show that national capacities are in place, but coordination issues prevail, leading to costly and inefficient process if the UNOSAT Rapid Mapping Service would not have been available.
178. A rapid assessment on the ground or by plane would have been alternative
options during natural disasters in Indonesia and Madagascar, but the cost implications would have been significant. In fact, evaluative evidence from the World Food Program (WFP) shows that mainly replacing the use of helicopters with remote sensing technologies saved up to USD 1 million per day when comparing Mozambique floods in 2001 with floods in 200735.
33 UNESCAP values its services for space-based information to Member States at USD 1 million per year, according to a senior source 34 Excluding goods and services provided in-kind to UNOSAT. Calculated at USD 158,840 per year for 2016 and USD 186,462 for 2017 from CERN for hosting the office and USD 306,250 (2016) and USD 574,675 (2017) for high resolution Satellite images from the United States government. Besides, in-kind services valued at USD 120,000 were provided for seconded staff by the Algerian Space Agency in 2017. 35 Engelhardt, A. et al, 2009: Review of DFID’s Institutional Strategy with the World Food Programme: « Working in partnership with WFP », page 26.

40
6. Sustainability: Are results lasting? 179. This section analyzes the sustainability of the UNOSAT Rapid Mapping
Service, mainly by focusing on its business model, as suggested in the ToR. Principal data sources used in this section are the document review, interviews with institutional partners and the online survey.
180. The evaluation finds that the sustainability of UNOSAT Rapid Mapping
Service shows unsatisfactory achievement in most areas such as financial sustainability, internal operational sustainability or the factors affecting sustainability, with some positive elements such as inter-institutional sustainability through partnerships and the contribution to better humanitarian assistance in the long term. The score for sustainability is "amber-red" (40% out of 100%)36.
181. Given the lack of predictable multi-year core funding and the dependency on project-based funding by one donor, the sustainability of the UNOSAT Rapid Mapping Service is suboptimal. The future for offering free service as a public good to the humanitarian community is threatened.
6.1 Sustainability of business model 182. The sustainability of the business model of the Rapid Mapping Service is
unsatisfactory. The assessment of the sustainability of the business model of the UNOSAT Rapid Mapping Service is broken down into three sub-categories: i) inter-institutional sustainability, ii) financial sustainability; and iii) internal operational sustainability.
36 . The score is calculated based on average of the following sub-criteria: Inter-Institutional sustainability: green/amber (scores 3 out 4); financial sustainability: red (scores 1 out of 4) ; internal operational sustainability : red (scores 1 out 4) ; contribution to better humanitarian assistance : green/amber (scores 3 out 4) ; factors affecting sustainability : amber/red (scores 2 out 4).
Key findings: Results are unlikely to last.
• The sustainability of the business model is unsatisfactory. Dependency on project-based funding by one donor threatens the offering of free services as a public good to the humanitarian community.
• Inter-institutional sustainability is well based on sufficiently generic MoUs which could be better operationalized in some cases through joint planning or secondment of personnel.
• The financial sustainability of UNOSAT Rapid Mapping Service is weak, experiencing 11 months funding delay in 2017 and a significantly reduced budget for the service.
• The internal operational sustainability of the Rapid Mapping Service team is threatened due to understaffing.
• Though only 30% of users benefitted from the service’s disaster preparedness engagement (Risk analysis/possible scenario definition maps), this aspect of the work contributes to better humanitarian assistance in the long-term. Besides, in general space related emergency response reduces the number of actors on the ground enhancing the efficiency of humanitarian assistance.

41
Inter-institutional sustainability: 183. A review of the existing MoUs of UNOSAT with institutional partners shows
that Rapid Mapping Service are treated quite generically in the MoUs. This fact was also reflected in some interviews with institutional partners such as UNOCHA. The potential of creatively implementing such MoUs shows with UNOCHA where a staff member of the UNOSAT Rapid Mapping Service was seconded for one year in 2016. The partner benefitted from better understanding the kind of Rapid Mapping Service UNOSAT can offer, and cooperation has increased in quality since the secondment. The same applies to UNDP's office in Geneva where a staff member of UNOSAT Rapid Mapping Service was seconded once per week, leading in fact to establishing a MoU between the two organizations and the development of a joint grant proposal.
184. The MoU between UNOSAT and ESCAP benefits from one UNOSAT staff member being permanently based in ESCAP in Bangkok. ESCAP highly appreciates this arrangement and further strengthening the strategic focus of the partnership is desirable. Other MoUs such as the one with MapAction show potential to be implemented based on a joint strategy with concrete joint actions based. UNOCHA also desires a more strategic approach to implement the MoU.
Financial sustainability: 185. The evaluation finds that the financial sustainability of UNOSAT Rapid
Mapping Service is weak. The service is to date dependent on a single donor, Norad. A second funding proposal has been submitted to another donor to broaden the donor base, but the donor’s decision was adverse, asking to resubmit the proposal.
186. The Norad project titled “Use of geospatial information for disaster risk
reduction and capacity development for improved resilience in Asia and Africa” provides USD 220,741 per year for Rapid Mapping Service. The three-year period initially aimed to cover January 2017 to December 2019. However, funding was delayed by eleven months, showing the vulnerability of UNOSAT Rapid Mapping Service. By surprise, the Rapid Mapping Service also experienced a significant cut in funding, threatening service delivery.
187. Many of UNOSAT’s institutional partners share the fate of lacking core
funding. However, UNOSAT managed to have untied funding within the budget line of Rapid Mapping Service, and Norad does neither prescribe a thematic nor geographic focus on the service. UNOSAT also do not suffer donor pressures to engage in high visibility emergencies37, as experienced by some of UNOSAT’s institutional partners. At least two institutional partners from non-governmental organizations voiced the lack of evidence about the impact of Rapid Mapping Service in the field. The latter affects the ability for more efficient fundraising and UNOSAT shares this void. Considering that UNOSAT gets most of its satellite
37 Prioritisation of emergencies receiving significant media coverage.
“UNOSAT should not have to act like a cowboy running from donor to donor to chase after funds." Source: Institutional partner of the UNOSAT Rapid Mapping Service

42
images for free and that its engagement in natural emergencies allows for high visibility, the underreporting on impact seems a lost opportunity for fundraising.
188. Apart from broadening the donors base, cost reduction seems feasible.
ESCAP suggest that the UNOSAT staff member based in Bangkok could be jointly funded. That approach would save UNOSAT funds while at the same time integrating the staff closer to ESCAP operational work for example during training or for publications.
189. Some institutional partners suggest that UNOSAT could charge for its Rapid
Mapping Service. Others point towards similar service being free of charge offered by the competitor Copernicus which would make the payable service option less feasible.
Internal operational sustainability 190. The small and shrinking size of the Geneva-based Rapid Mapping Service
team bears the risk of limiting the operational capacity of the service and losing institutional memory when staff leaves. The team consists of a team leader, two staff and an internship person and a liaison officer based in Bangkok and a vacant post for the liaison officer in Nairobi at the time of the evaluation. The team leader is engaged one to two months per year to manage the Service and the two staff five to six months per year38.
191. Some institutional partners such as OCHA have noted limitations in the responsiveness of the UNOSAT Rapid Mapping Service in 2016 and 2017 for example at times of multiple disasters at the same time where OCHA was invited to priorities its demands on the Service. However, many institutional partners of UNOSAT Rapid Mapping Service share the fate of staffing limitations and the risk of volatility in their operational capacities.
192. Overall, eight out of ten institutional stakeholders able to comment on the
business model of UNOSAT Rapid Mapping Service scored its sustainability as medium to low. The quote below summarized well the views of institutional partners on the business model of UNOSAT Rapid Mapping Service.
193. UNOSAT Rapid Mapping Service being understaffed resulting in significant
stress levels for the team was also experienced by the evaluator when conducting the evaluation. Under-staffing was identified as the main weakness of the service by the team members.
38 The UNOSAT Rapid Mapping Management comments that due to the strong commitment of UNOSAT staff significant amounts on un-paid time is spent on ensuring the service. This goes both for analysts and supervisor. Otherwise UNOSAT could not ensure the service as it is carried out today.
Their (UNOSAT Rapid Mapping Service) business model lacking any core funding is not a great model for a public service, a global public good. Unfortunately, in space-related emergency response, this is a conventional model but not a good one. It kills ambition and can restrain to donor preferences. Source: Institutional partner of the UNOSAT Rapid Mapping Service

43
6.2 Contribution to better humanitarian assistance in the long-term
194. The work on disaster risk preparedness of UNOSAT Rapid Mapping Service
contributes to better humanitarian assistance in the long run because the response time to disasters is reduced. The quicker the response, fewer lives are in danger.
195. Though only 24 out of 80 stakeholders benefitted from services related to pre-disaster work (Risk analysis/possible scenario definition maps), interviews with institutional stakeholders underscored the importance of this aspect of the work of UNOSAT. In fact, an even stronger focus on disaster risk preparedness of UNOSAT Rapid Mapping Service is suggested by a range of institutional stakeholders due to a general shortage of funding for disaster risk preparedness in humanitarian assistance.
196. Overall, space-related emergency response as practiced by UNOSAT seems
to contribute to better humanitarian assistance, as it reduces the number of actors on the ground. This assessment is captured in the quote below.
6.3 Factors affecting sustainability 197. The main factors affecting the sustainability of UNOSAT Rapid Mapping
Service are twofold: i) access to stable and predictable funding, which also affects the human resource base of the team and ii) the level of strategic engagement with its institutional partners.
198. The dependence on one donor in 2016 and 2017 with a lengthy funding delay in 2017 put considerable stress on the UNOSAT Rapid Mapping Service team. This high dependence on one donor persisted at the time of the evaluation in 2018 and jeopardized the operational capacity of the overstretched team. UNOSAT has submitted a funding proposal to an additional donor, as stated earlier. At the same time, it seems that UNOSAT could even publicize it service better across the Norwegian government, the current donor.
199. The better institutional partners understand the offer of UNOSAT Rapid
Mapping Service, the more focused the cooperation becomes, as shown in the cases of UNDP, UNESCAP, and UNOCHA. As a result, UNOSAT is enabled to deliver quality service meeting the demand of its institutional partners, leading to better humanitarian assistance. As shown, this approach can even lead to joint funding proposals which can positively affect the financial sustainability of the UNOSAT Rapid Mapping Service.
“When a disaster strikes, the number of emergency relief personnel on the ground can become a real problem. For example during the 2017 hurricanes Maria and Irma on small Caribbean islands. Many people are in the field who should in fact not be there, but donations depend on NGO's presence. The space-related emergency response can help to get a quick overview of the situation and reduce the need for countless reconnaissance missions. This reduces at least some of the burden on the emergency-struck countries or regions”. Source: Institutional partner of the UNOSAT Rapid Mapping Service

44
Section III: Conclusions and recommendations
7. Conclusions 200. Based on the main findings summarized at the beginning of the findings
sections for each evaluation criteria, the following conclusions emerge. The logic between main evaluation findings and conclusions is transparently presented in Figure 22.
The above key findings lead to the following conclusions: 201. Relevance: The Rapid Mapping Service remain relevant and operate
strategically in the 2030 Agenda and Sendai contexts, with proper alignment to strategic objectives of UNITAR and the donor Norway. The Service mainly meet needs of countries and partners.
202. Efficiency: The comparison of cost-efficiency of UNOSAT Rapid Mapping Service with the main comparator is highly favorable and shows value for money. Timeliness is one of the key selling points of the UNOSAT Rapid Mapping Service. While opportunities arise for UNOSAT to further strengthen its strategic engagement with partners, those come at the expense of scarce staff time. At the same time, alternatives to the UNOSAT Rapid Mapping Service exist and are used by UNOSAT clients.
203. Effectiveness: Overall, the performance of the Rapid Mapping Service and
delivery of its objectives is high, despite experiencing challenges in channeling its products to the end-user.
204. Impact: The likely impact of the Rapid Mapping Service seems to be high,
but its tangible effects in the field are blurred due to the lack of capturing impact data. This challenge is shared with other service providers, and an opportunity emerges to get ahead of the curve on this topic. The closer UNOSAT is to the decision-makers, the higher is the likelihood of effective use of its Rapid Mapping Service. A stronger focus of the Rapid Mapping Service on disaster risk reduction through preparedness work could further enhance its contribution to sustained changed in humanitarian assistance.
205. If the UNOSAT Rapid Mapping Service was abolished, the costs for similar
rapid mapping service outside UNOSAT would be burdensome for a minority of users in the humanitarian context. Besides, the Rapid Mapping Service operates activity-based rather than results-based due to its funding arrangements with Norway. Measures for outcomes and the impact of the Service are underdeveloped as a result.
206. Sustainability: “Business as usual” does not seem an option for ensuring the
future of the Rapid Mapping Service. While performance is high and secondments or placements in partner organization are good practices and make a difference to those UNOSAT clients, those need to be embedded in a redefined Service given the severe funding constraints. In an unfavorable funding context, the Rapid Mapping Service is at a crossroads.

45
8. Recommendations 207. After the main findings and the conclusions, the following recommendations
are made. Again, the logic between main evaluation findings, conclusions and recommendations is transparently presented in Figure 22.
Based on the above key findings and conclusions, six recommendations emerge: Relevance R 1: UNOSAT should enhance the visibility of the Rapid Mapping Service due to its global relevance for the UN family and the UN Member States. More visibility could be achieved for example by establishing a strategic advisory board for the Rapid Mapping Services comprised of UNOSAT’s main institutional partners and the current donor Norad. Prioritization moderate: next 12 to 36 months. Efficiency R 2: UNOSAT should revise current MoUs with institutional partners and include more joint planning and implementation tasks including secondments. This could strengthen UNOSAT’s position in an increasingly competitive environment. Prioritization high: next 12 months. Effectiveness R 3: UNOSAT should invest in a strategic retreat with Norad, other potentially interested parts of the Norwegian administration, other potential donors and selected institutional partners to shape a redefined business model of the Rapid Mapping Service. Some options to discuss are business model and funding possibilities for a Service of i) up to 10 full-time staff scaling up current work practices and systematically using secondments and placements in institutional partners ; ii) up to 3 full-time staff scaling down current work practices covering only selected parts of the Rapid Mapping Operational Framework and focusing on coordination issues and investments in impact assessment of rapid mapping; iii) moving all remaining staff to institutional partners in field locations for shared funding of posts and maximum impact in the field combined with a light oversight role from UNOSAT in Geneva. Prioritization very high: next 6 months. Impact R 4: UNOSAT should identify indicators and targets for the outcome and impact of the Rapid Mapping Service, as a means to move from activity-based management to results-based management. Prioritization high: next 12 months R 5: UNOSAT should consider to which extent user-based real-time impact assessment by upgrading existing technical solutions related to UN-ASIGN can be accommodated in any future business model of the Rapid Mapping Service, given donor interest and opportunity to lead the global humanitarian community on this topic. Prioritization high: next 12 months. R 6: If the current funding crisis requires a prioritization in the service portfolio, the Rapid Mapping Service should focus on Risk analysis/possible scenario definition maps and location/preliminary situation maps due to the more direct access to end-users for those products. Prioritization high: next 12 months. Sustainability: See recommendations 3 and 6.

46
9. Lessons learned 208. In addition to identifying conclusions and recommendations, the evaluation
also sought to bring forward lessons to be learned from the Rapid Mapping Service which prove to be of relevance to the wider context of UNITAR programming.
Partnerships are instrumental in delivering results.
209. The positive findings on relevance, effectiveness and efficiency highlight the extent to which the vast array of partnerships is important in delivering results. In addition to partnerships with users and providers of the Rapid Mapping Service, including UN, non-governmental, private sector and other entities, the partnership with CERN which provides in-kind support for UNOSAT’s office premises and access to high-speed Internet is not to be underestimated. In fact, it is unlikely that UNOSAT would be able to provide the Service in its present form in the absence of the CERN partnership.
Effective management of documentation, information and data is critical to track progress in highly activity-driven undertakings. 210. The Rapid Mapping Service is largely an activity-driven undertaking from the
standpoint of its key deliverables such as situation maps or damage assessment reports being produced upon activation following the onset of a natural disaster. These events are, of course largely if not entirely unpredictable. The lack of systematic documentation for all activations and the unclear identification of the actual users of the Service’s deliverables make tracking the Service’s effects challenging. This challenge is in turn exacerbated with the large staff turnover in the humanitarian community, affecting institutional memory among the users and the constant change of schedules of many interview partners due to their engagements in ongoing emergencies. Interviews showed that in hindsight, a field visit to Bangkok would have added value to the evaluation to further enhance the evidence base due to the larger number of available stakeholders with sufficient institutional memory. However, this only emerged after the interviews. Effective management of documents, information, and data are thus critical to track progress and inform stakeholder analyses and evaluations.
Evaluability assessments are useful when engaging in a new programming area. 211. For the evaluation design of future similar interventions in the area of
technology-based programing in humanitarian assistance, an evaluability assessment prior to the main evaluation phase might add value to assess limitations and opportunities. This lesson is valid for UNITAR’s Planning, Performance Monitoring, and Evaluation Unit and other evaluation offices dealing with technology-based programing in humanitarian assistance.

47
Figure 22: Summary of key findings, conclusions and recommendations
Key findings of the Service Conclusions Recommendations
Rele
va
nce
UNOSAT Rapid Mapping Service contribute to SDG 11.5. For preparedness related work before tropical cyclones, the evaluation finds a contribution to SDG 13.1. The contributions are theoretical.
The Rapid Mapping Service remain relevant in the post-Millennium Development Goal context, with proper alignment to objectives of UNITAR and the donor Norway. The Service mainly meet needs of countries and partners,
R 1: UNOSAT should enhance the visibility of the Rapid Mapping Service due to its global relevance for the UN family and the UN Member States. More visibility could be achieved for example by establishing a strategic advisory board for the Rapid Mapping Services comprised of UNOSAT’s main institutional partners and the current donor Norad Prioritization moderate: next 12 to 36 months
The Service are fully aligned to UNITAR’s Program Objective 5
Alignment to Norway's 2008 humanitarian strategy is given.
For 73,3% of stakeholders, the Rapid Mapping Service are relevant for country and partner needs
The reconstructed theory of change for the Rapid Mapping Service is valid.
The Rapid Mapping Service operate strategically in a complex humanitarian environment.
Eff
icie
ncy
Costs incurred by the Rapid Mapping Service compare favorably with 70.2% to 91.4% less costs (or 1/7th to 1/9th of cost incurred) compared to the main competitor, the Copernicus Emergency Mapping Service when calculated per activation in average for 2016 and 2017.
The comparison of cost-efficiency of UNOSAT Rapid Mapping Service with the main comparator is highly favorable and shows value for money.
R 2: UNOSAT should revise current MoUs with institutional partners and include more joint planning and implementation tasks including secondments. This could strengthen UNOSAT’s position in an increasingly competitive environment Prioritization high: next 12 months
Humanitarian stakeholders use UNOSAT Rapid Mapping Service alongside alternative service providers such as Copernicus or regional providers. Timeliness and quality of service determine which provider is used on a case-by-case basis.
Alternatives to the UNOSAT Rapid Mapping Service exist and are used by UNOSAT clients.
Memoranda of Understanding (MoU) between UNITAR and partners are the main partnership modality. The generic character of MoUs is appreciated by partners to maintain certain levels of flexibility. However, several partners such as UNOCHA, ESCAP or MapAction would appreciate a more strategic engagement and dialogue with UNOSAT.
Opportunities arise for UNOSAT to further strengthen its strategic engagement with partners at the expense of scarce staff time.
For 66,3% of stakeholders, the timeliness of the Rapid Mapping Service is high to very high. 86% of service users experienced the timeliness of Rapid Mapping Service as an enabling factor for informed decision-making.
Timeliness is one of the key selling points of the UNOSAT Rapid Mapping Service.

48
Eff
ectiven
ess
66% of stakeholders find the contribution of the Rapid Mapping Service to evidence-based decision making as high to very high. Being even less under the control of the Rapid Mapping Service the contribution to enhanced operational coordination in humanitarian assistance reached 48,9% high to very high ratings.
Overall, the performance of the Rapid Mapping Service and delivery of its objectives is high, despite experiencing challenges in channeling its products to the end-user.
R 3: UNOSAT should invest in a strategic retreat with donor Norad, other potentially interested parts of the Norwegian administration, other potential donors and selected institutional partners to shape a redefined business model of the Rapid Mapping Service. Some options to discuss are business models and funding possibilities for a Service of i) up to 10 full-time staff scaling up current work practices and systematically using secondments and placements in institutional partners ; ii) up to 3 full-time staff scaling down current work practices covering only selected parts of the Rapid Mapping Operational Framework and focusing on coordination issues and investments in impact assessment of rapid mapping; iii) moving all remaining staff to institutional partners in field locations for shared funding of posts and maximum impact in the field combined with a light oversight role from UNOSAT in Geneva. Prioritization very high: next 6 months
Factors positively affecting the performance of the Rapid Mapping Service are the timeliness of service delivery (86%) and the level of quality of service (80%). 71% of users experience the channeling of deliverables as a disabling factor for using the Rapid Mapping Service, the latter being beyond the control of UNOSAT.
64,5% of users describing the Rapid Mapping Service as being supportive or very supportive in addressing capacity issues through training and ad-hoc support.
58.9% of users are highly to very highly satisfied with the UNOSAT Rapid Mapping Service with institutional partners indicating that secondments or placements of Rapid Mapping Service staff in partner organizations made the most significant difference concerning client satisfaction.
Investing staff time in secondments or placements in partner organization makes a difference to those UNOSAT clients. This constitutes good practices.
In the current funding crisis of the Rapid Mapping Service, real opportunities are at reach (funding from Radiant Earth partnership), some transforming the role of the Service (focus on coordination role as "Center of Excellence").
“Business as usual” does not seem an option for ensuring the future of the Rapid Mapping Service. While performance is high and secondments or placements in partner organization are good practices, those need to be embedded in a redefined Service given the severe funding constraints.
Imp
act
Lack of evidence about the utility of Service to end-users leads to underreporting, while technical solutions in the context of UN-ASIGN and UNOSAT’s cooperation with AnsuR seem feasible
The likely impact of the Rapid Mapping Service seems high, but its tangible effects in the field are blurred due to the lack of capturing impact data. This challenge is shared with other service providers, and an opportunity emerges to get ahead of the curve on this topic. Besides, the Rapid Mapping Service operate activity-based rather than results-based due to its funding arrangements with Norway. Measures for outcomes and the impact of the service are underdeveloped as a result.
R 4: UNOSAT should identify indicators and targets for the outcome and impact of the Rapid Mapping Service, as a means to move from activity-based management to results-based management. Prioritization high: next 12 months R 5: UNOSAT should consider to which extent user-based real-time impact assessment by upgrading existing technical solutions related to
56% of users perceive that the Service contribute to better humanitarian assistance in the long-term to a great or very great extent by better focusing UN and national governments’ emergency responses

49
UN-ASIGN can be accommodated in any future business model of the Rapid Mapping Service, given donor interest and opportunity to lead the global humanitarian community on this topic. Prioritization high: next 12 months
The most potent effects of the UNOSAT Rapid Mapping Service seem to show at the initial stages of decision-making processes at UN headquarter levels when a situation analysis is required.
The closer UNOSAT is to the decision-makers, the higher is the likelihood of effective use of its Rapid Mapping Service.
R 6: UNOSAT: If the current funding crisis requires a prioritization in the service portfolio, the Rapid Mapping Service should focus on Risk analysis/possible scenario definition maps and location/preliminary situation maps due to the more direct access to end-users for those products. Prioritization high: next 12 months
For 43,3% of users, the Rapid Mapping Service make a real difference to the users' work in humanitarian assistance in serving end beneficiaries to a great or very great extent. For another 43,3%, the effects are moderate
UNOSAT Rapid Mapping Service operate in an environment where user needs are often well satisfied by competitors. For the majority of users, the Service are replaceable. For 78% of users alternatives to the UNOSAT Rapid Mapping Service are
at reach while 13% of users would fear adverse effects concerning timeliness and costs.
The actual costs of funding the Rapid Mapping Service for the donor Norway are low compared to the value of the Service to its partners. In ESCAP alone, UNOSAT Rapid Mapping Service are valued USD 600.000 to 700.000 per year. Stakeholders identified negative cost implications in the absence of the Rapid Mapping Service in natural disasters in Colombia, Indonesia, Iran/Iraq, Madagascar, and Mexico.
If the UNOSAT Rapid Mapping Service were abolished, the costs for similar rapid mapping service outside UNOSAT would be burdensome for a minority of users in the humanitarian context.
See R 3.
Su
sta
ina
bili
ty
The sustainability of the business model is unsatisfactory. Dependency on project-based funding by one donor threatens the offering of free service as a public good to the humanitarian community.
As concluded in the effectiveness section “Business as usual” does not seem an option for ensuring the future of the Rapid Mapping Service. In a bleak funding context, the Rapid Mapping Service are at crossroads.
The financial sustainability of UNOSAT Rapid Mapping Service is weak, experiencing 11 months funding delay and a significantly reduced budget for the Service.
The internal operational sustainability of the Rapid Mapping Service team is threatened due to understaffing.
Inter-institutional sustainability is satisfactory based on sufficiently generic MoUs which could be better operationalized in some cases through joint planning or secondment of personnel
Room for further leveraging the benefits of existing partnerships is given in the Rapid Mapping Service.
Though only 30% of users benefitted from the Service’ disaster preparedness engagement (Risk analysis/possible scenario definition maps), this aspect of the work contributes to better humanitarian assistance. Besides, space-related emergency response reduces the number of actors on the ground enhancing the efficiency of humanitarian assistance.
A stronger focus of the Rapid Mapping Service on disaster risk reduction through preparedness work could further enhance its contribution to sustained changed in humanitarian assistance.
See R 6.

50
Annex A: Terms of Reference

51

52

53

54

55

56

57

58
Annex B: survey/questionnaires deployed Evaluation questionnaire for on-line survey
Name Position Organization/Enterprise Date
(A) Relevance 1a. What type of rapid mapping services were performed and to what type of need?
1b. To what extent respond the rapid mapping services to your institutional needs and priorities? Very high High Medium Low Very low No answer
Please select:
(B) Efficiency: appropriate use of resources 2. Please respond to the questions below:
Very much Much Medium Little Very little No answer
To what extend were Rapid Mapping Services provided on time to allow for evidence-based decision making?
To what extent were partnership modalities (e.g. institutional MoUs) conductive to the delivery of the mapping?
To what extent have maps/other products helped with evidence-based decisions?
2a. If products from the Rapid Mapping Services were used, how? 2b. If products from the Rapid Mapping Services were not used, why not?
• Maps or other products/services were not timely enough,
• The product delivered did not correspond to the needs,
• The quality expectations were not met,
• The product was too difficult to be interpreted,
• The product did not reach the channel it should have,
• Others (please specify).
(C) Effectiveness: achievement of project results
Please explain your assessment: In case of “medium”, “low” and “very low” ratings, please suggest how relevance could be enhanced:

59
3. To what extent have the rapid mapping initiatives achieved the planned objectives and results to provide better information for informed decision-making and operational coordination in situations of natural disasters?
Very high High Medium Low Very low No answer
Please select:
4. What factors may have influenced the achievement (or non-achievement) of providing better information for informed decision-making and operational coordination in situations of natural disasters
5. How effective has UNITAR support been following the delivery of rapid mapping services to support the analysis/interpretation capacities of maps?
Very high High Medium Low Very low No answer
Please select:
(D) Impact: what change did RMS produce or bring about? 6. What real difference has rapid mapping made to your work in humanitarian assistance and to the end beneficiaries? Very high High Medium Low Very low No answer
Please select:
7. What cumulative effects have the rapid mapping initiatives made to your work in humanitarian assistance and to the end beneficiaries?
Please explain your assessment: In case of “medium”, “low” and “very low” ratings, please suggest how results could be better achieved:
Please explain your assessment: In case of “medium”, “low” and “very low” ratings, please suggest how results could be better achieved:
Please explain your assessment: In case of “very high” and “high” ratings, please explain the difference the Rapid Mapping Services made for you?

60
Very high High Medium Low Very low No answer
Please select:
8. How have the end-users benefitted from Rapid Mapping Services? 9. If UNOSAT Rapid Mapping Services would not exist, what would happen to stakeholders’ decision-making in humanitarian assistance? Where would you get data, reports and maps from? At what cost and which timeliness? 10. To what extend were Rapid Mapping Services used for unintended purposes? If yes, for which purposes?
(E) Sustainability: are results lasting? 11. To what extent have the rapid mapping initiatives contributed to better humanitarian assistance in the long term?
Very high High Medium Low Very low No answer
Please select:
12. What were the major factors which influenced the achievement or non- achievement of sustainability of the rapid mapping initiatives?
Please explain your assessment:
Please explain your assessment:

61
Semi-structured Evaluation questionnaire for focus groups and key informant interviews
Name Position Organization/Enterprise Date
(A) Relevance 1a. To what extent respond the rapid mapping services to the institutional needs and priorities of the
respective partner institutions? Very high High Medium Low Very low No answer
Please select:
1b.
o To what extent does the Rapid Mapping Services contribute to achieve SDG 11, more specifically target 11.5: “By 2030, significantly reduce the number of deaths and the number of people affected and substantially decrease the direct economic losses relative to global gross domestic product caused by disasters, including water-related disasters, with a focus on protecting the poor and people in vulnerable situations” (focus group)
Very high High Medium Low Very low No answer
Please select:
1c.
o To what extent does the Rapid Mapping Services contribute to achieve SDG 13, more specifically target 13.1: “Strengthen resilience and adaptive capacity to climate-related hazards and natural disasters in all countries” (focus group)
Very high High Medium Low Very low No answer
Please select:
(B) Efficiency: appropriate use of resources
Please explain your assessment: In case of “medium”, “low” and “very low” ratings, please suggest how relevance could be enhanced:
Please explain your assessment
Please explain your assessment

62
2. Please respond to the questions below:
Very high High Medium Low Very low No answer
To what extend were Rapid Mapping Services provided on time to allow for evidence-based decision making?
To what extent were partnership modalities (e.g. MoU) conductive to the delivery of the mapping?
To what extent have maps/other products helped with evidence-based decisions?
3. Were there alternative, less resource-intensive means to produce the rapid mapping?
(C) Effectiveness: achievement of project results 4. To what extent have the rapid mapping initiatives achieved the planned objectives and results to provide better information for informed decision- making in situations of natural disasters and conflict?
Very high High Medium Low Very low No answer
Please select:
5. What factors may have influenced the achievement (or non-achievement) of the objectives?
(D) Impact: what change did RMS cause? 6. What real difference have the rapid mapping initiatives made to the partners’ work in humanitarian assistance and to the end beneficiaries?
Very high High Medium Low Very low No answer
Please select:
Please explain:
Please explain your assessment:
Please explain your assessment:

63
7. How have the end-users benefitted from Rapid Mapping Services? 8. If UNOSAT Rapid Mapping Services would not exist, what would happen to stakeholders’ decision-making in humanitarian assistance? Where would they get data, reports and maps from? At what cost and which timeliness?
(E) Sustainability: are results lasting? 9. How sustainable is the Rapid Mapping Service in the long term given its business model?
Very high High Medium Low Very low No answer
Please select:
10. What were the major factors which influenced the achievement or non- achievement of sustainability of the rapid mapping initiatives?
Please explain your assessment:
Please explain your assessment:

64
Annex C: List of persons interviewed Name Organization
Mr Alessandro Sorichetta Flowminder
Mrs Astrid Thesen Tveteraas Norad
Mr Aziz Mazharul Ministry of Agriculture Bangladesh
Mr David Hodgson International Space Charter
Mrs Emma Mumford MapAction
Mr Harald Skinnemoen AnsuR Technologies
Mrs Ingunn Vatne Ministry of Foreign Affairs, Norway
Mr Jahal De Meritens UNDP
Mr Jesper Lund UNOCHA
Mr Kashif Rehman UNOCHA
Mr Keran Wang UNESCAP
Mr Matt Sims MapAction
Mr Nigel Woof MapAction
Mr Oli Brown UNEP
Mr Peter Muller UNOCHA
Mr Ravahambola Andriniaina FAO
Mr Roberto Paganini UNDP
Mr Syed T. Ahmend UNESCAP
Mr Winston Chang UNOCHA
UNOSAT Rapid Mapping Services
Mr Lucca Delloro UNOSAT
Mr Samir Belabbes UNOSAT
Mrs Carolina Jorda UNOSAT
Mr Einar Bjoergo UNOSAT
Mr Khaled Mashfiq
UNOSAT
The list of persons interviewed is based on the stakeholder list provided by UNOSAT. Ultimately, the availability of stakeholders and their interest to participate in the evaluation determined whether an interview materialized. The 81 users of the UNOSAT Rapid Mapping Service participating in the online survey are kept anonymous.
65
Annex D: List of documents reviewed International Charter. Space and Major Disasters, 2016: Charter Activation 485. PM report (Fiji ocean storm)
International Charter. Space and Major Disasters, 2016: Charter Activation 490. PM report (Ecuador earthquake) International Charter. Space and Major Disasters, 2016: Charter Activation 502. PM report (Sudan flood) International Charter. Space and Major Disasters, 2017: Charter Activation 521. PM report (Flood/storm, hurricane Madagascar) International Charter. Space and Major Disasters, 2017: Charter Activation 552. PM report (Dominica storm/hurricane) International Charter. Space and Major Disasters, 2017: Charter Activation 555. PM report (Mexico earthquake) International Charter. Space and Major Disasters, 2017: Charter Activation 558. PM report (Iraq earthquake) International Charter. Space and Major Disasters, 2017: Charter Activation 559. PM report (Islamic Republic of Iran earthquake) Royal Norwegian Ministry of Foreign Affairs, 2014: Agreement between the Norwegian Ministry of Foreign Affairs and the United Nations Institute for Training and Research. Special purpose grant agreement (2014-2016). UNOSAT: Use of geospatial technologies for humanitarian assistance and capacity development. UNOSAT, undated: Satellite analysis and mapping to support humanitarian operations. Rapid Mapping Operational Framework UNOSAT, undated: UNOSAT Rapid Mapping Service Use Feedback Form – Natural disasters 2016 – 2017 UNOSAT, undated: UNOSAT Rapid Mapping Service Use Feedback Form – Natural disasters 2017 – 2018 UNITAR/UNOSAT, 2017: Use of geo-spatial information for disaster risk reduction and capacity development for improved resilience in Asia and Africa. Project Proposal UNITAR, undated: UNOSAT Rapid Mapping Services. Evidence-based information support to humanitarian assistance and human rights using satellite imagery and geospatial technologies. UNITAR, undated: Revision to the Programme Budget for the biennium 2016 - 2017 UNITAR, 2015: UNITAR’s Operational Satellite Applications Programme – UNOSAT. Report to the International Charter Space and Major Disasters on activities during

66
October 2014 – September 2015 UNITAR, 2016: UNITAR’s Operational Satellite Applications Programme – UNOSAT. International Charter “Space and Major Disasters”. UNOSAT activity report: October 2015 – September 2016 UNITAR, 2017: International Charter “Space and Major Disasters”. Activity report: October 2016 – September 2017
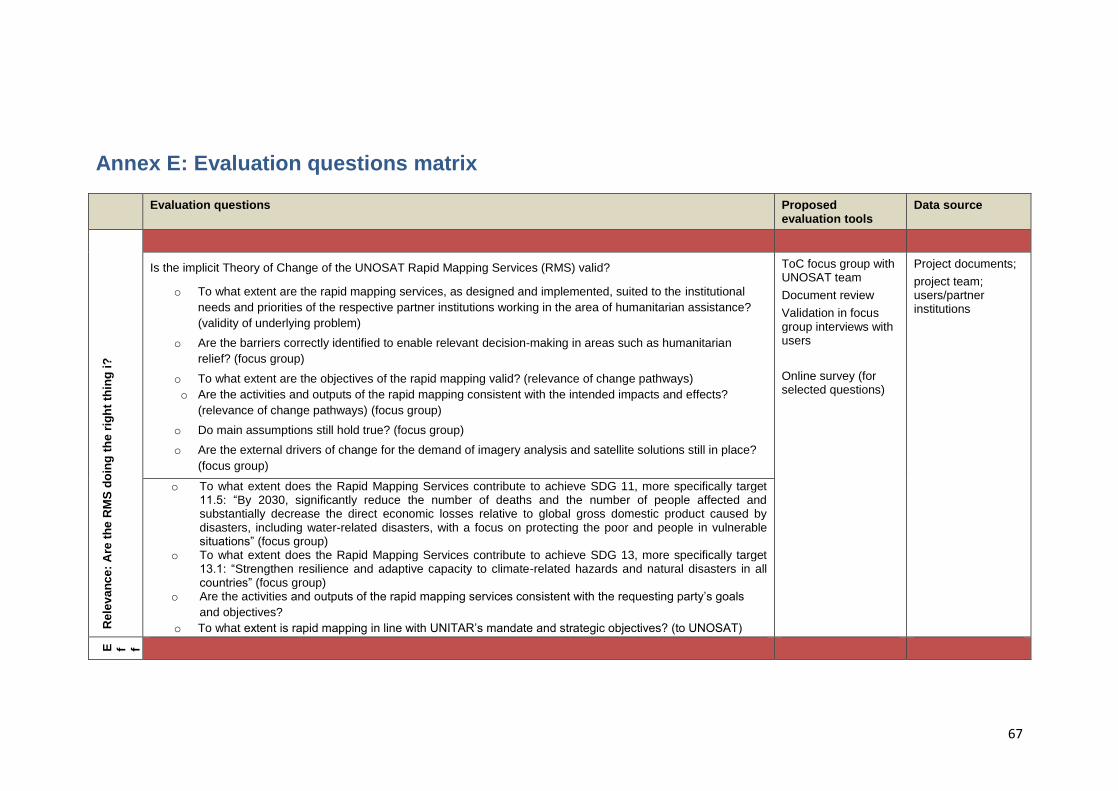
67
Annex E: Evaluation questions matrix
Evaluation questions Proposed evaluation tools
Data source
Re
lev
an
ce
: A
re t
he
RM
S d
oin
g t
he
rig
ht
thin
g i
?
Is the implicit Theory of Change of the UNOSAT Rapid Mapping Services (RMS) valid?
o To what extent are the rapid mapping services, as designed and implemented, suited to the institutional
needs and priorities of the respective partner institutions working in the area of humanitarian assistance?
(validity of underlying problem)
o Are the barriers correctly identified to enable relevant decision-making in areas such as humanitarian
relief? (focus group)
o To what extent are the objectives of the rapid mapping valid? (relevance of change pathways)
o Are the activities and outputs of the rapid mapping consistent with the intended impacts and effects?
(relevance of change pathways) (focus group)
o Do main assumptions still hold true? (focus group)
o Are the external drivers of change for the demand of imagery analysis and satellite solutions still in place?
(focus group)
ToC focus group with UNOSAT team
Document review
Validation in focus group interviews with users
Online survey (for selected questions)
Project documents;
project team; users/partner institutions
o To what extent does the Rapid Mapping Services contribute to achieve SDG 11, more specifically target 11.5: “By 2030, significantly reduce the number of deaths and the number of people affected and substantially decrease the direct economic losses relative to global gross domestic product caused by disasters, including water-related disasters, with a focus on protecting the poor and people in vulnerable situations” (focus group)
o To what extent does the Rapid Mapping Services contribute to achieve SDG 13, more specifically target 13.1: “Strengthen resilience and adaptive capacity to climate-related hazards and natural disasters in all countries” (focus group)
o Are the activities and outputs of the rapid mapping services consistent with the requesting party’s goals
and objectives?
o To what extent is rapid mapping in line with UNITAR’s mandate and strategic objectives? (to UNOSAT)
E f f i c i e n c y : W e r e
r e s o u r c e s
u s e d a p p r o p r i a t e l y
t o a c h i e v e
r e s u l t s ?

68
Evaluation questions Proposed evaluation tools
Data source
o To what extent have outputs been produced in a cost-efficient manner (e.g. in comparison with alternative
approaches)? Document review
Focus group with UNOSAT team
Validation in focus group interviews with users (for questions on timeliness and partnerships)
Project documents; project team; users/partner institutions
o Were objectives achieved on time and was rapid-mapping delivered immediately in emergency situations?
o Were there alternative, less resource-intensive means to produce the rapid mapping?
o To what extent were partnership modalities conductive to the delivery of the mapping?
Eff
ec
tiv
en
es
s:
were
res
ult
s a
ch
iev
ed
an
d
ho
w?
o To what extent have the rapid mapping initiatives achieved the planned objectives and results to provide
evidenced-based decision- making and operational coordination in situations of natural disasters? Document review
Focus group with UNOSAT team
Validation in focus group and key informant interviews with users
Online survey
Project documents; project team; users/partner institutions
o What factors may have influenced the achievement (or non-achievement) of the objectives?
o How effective has UNITAR support been following the delivery of rapid mapping services to support the
analysis/interpretation capacities of maps?
Imp
ac
t: w
ha
t c
han
ge
did
RM
S c
au
se
?
o What real difference have the rapid mapping initiatives made to the partners’ work in humanitarian
assistance and to the end beneficiaries? Document review
Focus group with UNOSAT team
Validation in focus group and key informant interviews with users
Online survey
Project documents; project team; users/partner institutions
o What cumulative effects have the rapid mapping initiatives made to the beneficiaries’ work in humanitarian
assistance/natural disasters and to the end user beneficiaries?
o What has happened as a result of the rapid mapping?
o How have the end-users benefitted from Rapid Mapping Services?

69
Evaluation questions Proposed evaluation tools
Data source
o If UNOSAT Rapid Mapping Services would not exist, what would happen to stakeholders’ ability for
decision-making and operational coordination in humanitarian assistance? Where would they get data,
reports and maps? At what cost and timeliness?
• To what extend were Rapid Mapping Services applied for unintended use? If yes, for which use?
Su
sta
inab
ilit
y:
Are
res
ult
s la
sti
ng
?
o How sustainable is the Rapid Mapping Service in the long term given its business model? Document review
Focus group with UNOSAT team
Validation in focus group and key informant interviews with users
Online survey
Project documents; project team; users/partner institutions
o To what extent have the rapid mapping initiatives contributed to better humanitarian assistance in the long term?
o What were the major factors which influenced the achievement or non- achievement of sustainability of the rapid mapping initiatives?

70
Annex F: Evaluation consultant agreement form
Achim Engelhardt

71
Annex G: Dashboard of key findings by evaluation criteria and main evaluation questions
Criteria Assessment Rationale
R
ele
va
nc
e
UNOSAT Rapid Mapping Service are doing the right thing in the humanitarian assistance context. The evaluation finds that the relevance of the Rapid Mapping Service is very high reaching a relevance score of 95% out of 100%. In four out of five sub-criteria, the program shows a solid performance. The Service stand out as an area of good practice where UNITAR is making a significant positive contribution concerning the Service’ relevance. The reconstructed Theory of change is valid.
• In four out of five sub-criteria the Service shows a solid performance, including:
o Alignment to UN Sustainable Development Goals 11.5 o Alignment to UNITAR Program Objective 5 o Relevance for the donor Norway’s 2008 humanitarian strategy o Relevance for 83% of stakeholders’ needs.
E
ffic
ien
cy
Overall, the Service use resources efficiently. Overall efficiency reaches 75% on a 100 % scale, based on the four sub-criteria. The Service shows satisfactory achievement in two areas: partnership modalities and timeliness of service delivery.
• Partnership modalities: Memoranda of Understanding (MoU) between UNITAR and partners are the main partnership modality. The generic character of MoUs is appreciated by partners to maintain certain levels of flexibility. However, several partners would appreciate a more strategic engagement and dialogue with UNOSAT;
• Timeliness: Stakeholders experience the timeliness of the Rapid Mapping Service positively, with ratings reaching 77%.
• Alternative service providers: Humanitarian stakeholders use UNOSAT Rapid Mapping Service alongside alternative service providers such as Copernicus or regional providers. Timeliness and quality of service determine which provider is used on a case-by-case basis;
• Cost-efficiency: Costs incurred by the Rapid Mapping Service compare favorably with 70.2% to 91.4%, less costs than the main competitor, the Copernicus Emergency Mapping Service when calculated per activation in average for 2016 and 2017.

72
E
ffe
cti
ven
es
s
The level of results achievement is satisfactory. The evaluation finds that the Rapid Mapping Service show satisfactory achievement for the achievement of all four effectiveness sub-criteria: Service objectives, factors affecting Service performance, the contribution to support analysis and interpretation of maps and user satisfaction. The score for effectiveness reaches 75% out of 100%.
• Stakeholders satisfaction about the contribution of the Rapid Mapping Service to evidence-based decision-making is at 75,8%.
• Factors positively affecting the performance of the Rapid Mapping Service are the timeliness of service delivery (86%) and the level of quality of service (80%). 71% of users experience the channeling of deliverables to decision-makers as a disabling factor for using the Rapid Mapping Service, the latter being beyond the control of UNOSAT, particularly in the field.
• In the current funding crisis of the Rapid Mapping Service, real opportunities are at reach (funding from Radiant Earth partnership), some transforming the role of the Service (focus on coordination role as "Center of Excellence").
• The satisfaction rate of Rapid Mapping addressing capacity issues through training and ad-hoc support reaches 76% among Service users.
• User satisfaction of UNOSAT Rapid Mapping Service reaches 75% with institutional partners indicating that secondments or placements of Rapid Mapping Service staff in partner organizations made the most significant difference concerning client satisfaction.
Imp
act
The level of achieving long-term results is satisfactory. The evaluation finds that the impact of UNOSAT Rapid Mapping Service shows satisfactory achievement in most areas such as the difference made to partners, cumulative effects of the Service and their comparative advantage concerning timeliness and cost. The score for impact is 71% out of 100%.
• In the context of overall positive results, the lack of evidence about the utility of Service to end-users leads to underreporting on impact, while technical solutions related to UN-ASIGN and UNOSAT’s cooperation with AnsuR Technologies seem feasible.
• The contribution to better humanitarian assistance in the long-term reaches a rating of 71,9%, followed by 69,1% for making a real difference to the users’ work in humanitarian assistance by better focusing UN and national governments’ emergency responses.
• The most potent effects of the UNOSAT Rapid Mapping Service seem to show at the initial stages of decision-making processes at UN headquarter levels when a situation analysis is required.
• For 78% of users, alternatives to the UNOSAT Rapid Mapping Service are at reach while 13% of users would fear adverse effects concerning timeliness and costs.
• In ESCAP alone, UNOSAT Rapid Mapping Service (with an annual budget of USD 546.000) are valued USD 600.000 to 700.000 per year. A minority of stakeholders identified negative cost implications in the absence of the Rapid Mapping Service in natural disasters in Colombia, Indonesia, Iran/Iraq, Madagascar, and Mexico.

73
S
usta
inab
ilit
y
Results are unlikely to last The evaluation finds that the sustainability of UNOSAT Rapid Mapping Service shows unsatisfactory achievement in most areas such as financial sustainability, internal operational sustainability or the factors affecting sustainability, with some positive elements such as inter-institutional sustainability through partnerships and the contribution to better humanitarian assistance in the long term. The score for sustainability is 40% out of 100%.
• The sustainability of the business model is unsatisfactory. Dependency on project-based funding by one donor threatens the offering of free service as a public good to the humanitarian community.
• Inter-institutional sustainability is well based on sufficiently generic MoUs which could be better operationalized in some cases through joint planning or secondment of personnel.
• The financial sustainability of UNOSAT Rapid Mapping Service is weak, experiencing 11 months funding delay in 2017 and a significantly reduced budget for the Service.
• The internal operational sustainability of the Rapid Mapping Service team is threatened due to understaffing.
• Though only 30% of users benefit from the Service' disaster preparedness engagement (Risk analysis/possible scenario definition maps), this aspect of the work contributes to better humanitarian assistance in the long-term. Besides, in general space related emergency response reduces the number of actors on the ground enhancing the efficiency of humanitarian assistance.

74
Annex H: Examples of Rapid Mapping Service products for the selected country cases Haiti floods 2017: Population exposure to heavy rains

75
Bangladesh floods 2017: Satellite detected waters

76
Mexico earthquake 2017: Damage assessment in the city of Izucar de Matamoros, State of Puebla, Mexico

77
Madagascar tropical cyclone 2017: Population exposure (excerpts)

78
Annex I: Audit Trail: Comments by UNOSAT Management 8 August 2018
Comments, UNOSAT Programme Unit Manager Response
1 For the cost-efficiency: The percentage can be difficult to understand. If you say 1/7th to 1/9th of the cost
The infographic in figure 1 was revised accordingly.
2 Recommendation 6: This is not Rapid Mapping, though
The recommendation was kept due to be higher reach of end-users for risk analysis/possible scenario definition maps and location/preliminary situation maps compared to other services.
3 Note: Copernicus also covers Europe. UNOSAT does not. This needs to be highlighted as otherwise one may think that Copernicus covers much more that UNOSAT in developing countries
The new footnote 17 addresses this important issue.
4 Drones also need permission to fly from authorities. The comment is included in para 82.
5 I cannot see the very low in the pie chart. Para 92 explains now that no very low ratings show.
6 Then there is no Rapid Mapping Service left. That is why this is not an opportunity the way I see it.
Para 133 explains that the option listed in the text is controversially discussed in UNOSAT.
7 This sentence is not clear to me. Para 138 has been revised to better explain the sentence.
8 For key findings below, last bullet: This means a three-fold cost-benefit in financial terms and that only for one partner.
No need to revise the bullet-point, as no factual error emerges.
9 For comment two below: This is something we hear from time to time. It is simply not true. I have heard it several times from space agencies, UNOOSA and others, but although Government maps are available, these are typically not up to date. Secondly, still relatively few countries have their own satellites and them maps produced from these are far from meeting the user requirements of the humanitarian community. If donors read this they may think it is true.
New footnote 31 captures the comment made.
10 That is a suggestion that is useful for ESCAP training and publications, but does not help towards Rapid Mapping
The comment was acknowledged but the text remained unchanged.
11 This is correct. However, it should be noted that due to the extremely strong commitment of UNOSAT staff significant amounts on un-paid
The new footnote 37 addresses this comment.

79
time is spend on ensuring the service. This goes both for analysts and supervisor. Otherwise we could not ensure the service as it is carried out today.
12 Note: Not even Copernicus can “do it alone”. Copernicus has stated this on numerous occasions. Hence, both services need to co-exist and coordination happen at the operational level during events.
The comment was acknowledged but the text remained unchanged.
13 Why not also other donors? The recommendation was revised accordingly.
14 This means no operational service and hence no rapid mapping service.
The recommendation remained unchanged due to diverse views on that topic in the UNOSAT team
15 That would not work in practice as the Rapid Mapping production is team work and very intense. By spreading thin out in the field, there will be close to no analysis done.
The comment was acknowledged but the text remained unchanged.
16 Please see first comment on the infographics. The text was revised accordingly.
Comments received by UNOSAT Programme Management Team
1-6 Comments on modifications of formulations and inclusion of additional information
Accepted
7 Is this methodology is standard or was used only for this one Additional information was provided in the relevant paragraph
8 Perhaps it would be good to explain how stakeholder analysis was done and sampling criteria defined.
Additional information was provided in the relevant paragraph
I think is 12 institutional stakeholders. How did he define the sample of 34 institutional stakeholders? Is the 38% the percentage?
The percentage was revised accordingly to 38%
11-14 Comments on modifications of formulations and inclusion of additional information
Accepted
15 What types of end users? Governments?
The para was modified to address the comment.
16-18 Comments on modifications of formulations and inclusion of additional information
Accepted
19 Perhaps it may be good to explain what does it mean most and least significant.
The new footnote 4 provides the required clarification.
20 I disagree. I would say coordination role. Accepted
21-23 Comments on modifications of formulations and inclusion of additional New para 31 provided the required explanation .

80
information
24 Comments on modifications of formulations and inclusion of additional information
Accepted
25 Tonga is outside the evaluation period The modified para 59 now clarifies this issue transparently.
26 Not clear. The new footnote 13 provides the required clarification
27 Are dates correct? Yes, dates were double checked
28 Outside evaluation period Para 71 clarifies this issue now
29 We didn’t provide this type of analysis Para 74 clarified the origin od analysis now.
30-31 Comments on modifications of formulations and inclusion of additional information
The comments were acknowledged but the text remained unchanged.
32 Which ones? it would be good to be more explicit Para 84 addresses the comment.
33 Comments on modifications of formulations and inclusion of additional information
Accepted
34 For the Caribbean, with the number of people involved and magnitude of the event, results might be biased.
The comments were acknowledged but the text remained unchanged.
35 Explain why it was high with few words The new footnote 25 addresses the comment.
36 WFP-Laos? The comments were acknowledged but the text remained unchanged.
37 Which ones? Para 128 now provides the required explanation.
38-39 This issue can be addressed in the strategic approach Para 138 now provides the required explanation.
40 How these results can be relativized taking into account the answers. Unsatisfied but why, would be good to have potential info
New footnote 27 addresses the comment.
41 Interviews? Telephone, face to face? Para 145 now provides the required explanation.
42 Who? Rescue teams? Governments? New footnote 30 addresses the comment.
43 Any recommendations to clearly address to achieve the aim of having a core funding?
The comments were acknowledged but the text remained unchanged, as comparable service face similar limitations.
44 ?? New footnote 36 addresses the comment.
45 Comments on modifications of formulations and inclusion of additional information
Accepted
46 It will require funds for more communication. The comments were acknowledged but the text remained unchanged,
47-48 Comments on modifications of formulations and inclusion of additional information
The comments were acknowledged and the text partly changed.