india infrastructure development opportunities and …presentations\88\mr. parvez... · railways...
TRANSCRIPT

India Infrastructure DevelopmentOpportunities and Challenges
A presentation by

66,666Railways120,000Energy11,111Ports17,778Irrigation8,889Airports
336,664Total
76,666Others-Telecom, Tourism, SEZs, Townships, Supporting Urban Infra, Water & Sanitation, State & rural roads, Logistics etc.
48,888National Highways
Infrastructure Investments
MN US$
Sectors
FINANCING REQUIREMENTS
Funding requirements during the Eleventh Five Year Plan 2007-12

60 %Urban Infrastructure
55 %Tourism100 %Roads42 %Railways30 %Nuclear Power
70 %Hydro
20%Thermal
-Power50%Ports80%Irrigation42%Airports
Construction component
Sectors
Source- CRISINFAC
Contracting Opportunity

ROADSROADS
PORTSPORTS
AIRPORTSAIRPORTS
POWERPOWER
METRO RAILSMETRO RAILS
INFRASTRUCTUREINFRASTRUCTURE
WATERWATER
CENTRECENTRE
STATESTATE
CENTRECENTRE-- MAJORMAJOR
STATESTATE-- MINORMINOR
CENTRECENTRE-- AAIAAI
CENTRECENTRE
STATESTATE
CENTRECENTRE
STATESTATE
STATESTATE
CITYCITY
Responsibility
Opportunities….

ROADSROADS
PORTSPORTS
AIRPORTSAIRPORTS
POWERPOWER
METRO RAILSMETRO RAILS
INFRASTRUCTUREINFRASTRUCTURE
WATERWATEROpportunities….

Fact fileIndia has a dense road network which covers 3.3 million kms and includes 0.2 million kms of highways.
India’s road network carries close to 70% of the country’s freight traffic and 85% of its passenger traffic
National Highways account for only 2% of the total network but accounts for 40% of the total traffic.
Of the total 65,000 kms of national highways, only 9% are four-lane, 56% are two-lane, and 35% are single-lane.
Traffic on roads growing at 7-10% per annum
ROADS
Of TotalKMType
33,15,23126,50,0004,67,7631,31,899
65,569
100%79.9%14.1%
4%2%
Village & Other RoadsTotal Length
Major District RoadsState HighwaysNational Highways
Source- National Highways Authority of India

NHAI was constituted in 1995 for implementation of Road Projects.
NHAI is a AAA rated Entity in the Debt Markets
Modes of Road sector development by NHAI
Through construction contracts- Govt. Funded
Through Annuity based projects on PPP Model
Through Toll based BOT projects on PPP Model
ROADS

ROADS
GQ – 5846 Kms
NSEW – 7300 Kms

1000
5800
500
10,000
7300
5846
LengthKm
PPP- 100%
PPP- 100%
Govt. funded- 100%PPP- 100%
Govt. funded- 50-70%PPP- 30-50%
Govt. funded- 90%PPP- 10%
Mode
Expressways 8 Corridors
Phase VI
Phase I revisited (FROM 4 laning – 6 laning of GQ)
Phase V
Port Connectivity Phase IV
Interconnection of Phase I & Phase IIPhase III
North – South & East – West Corridors Phase II
Connecting 4 Metros referred to as GQ. (2 lane – 4 lane)
Phase I
Description Stage
NHAI Roadmap Since 1997
ROADS

• All projects on BOT basis.• Total length of around 5800 Km.• Total number of projects – 44 valued at US $ 10 Bn.• 8 Projects at prequalification stage, valued at US $ 1.8 Bn • Projects cleared by the centre
- overall grant +10 %• Most projects expected on concession premium i.e. on revenue
sharing basis• Concession Period –20 years (including construction phase)
Characteristics of Phase V (carried forward from Phase I)
ROADS
ROADSROADS
PORTSPORTS
AIRPORTSAIRPORTS
POWERPOWER
METRO RAILSMETRO RAILS
INFRASTRUCTUREINFRASTRUCTURE
WATERWATEROpportunities….

PORTS
Fact file
India has 13 major and 185 minor and intermediate ports, along 7,000 kms of coastline.
Seaports handle 95% of India’s foreign trade in volume terms and70% in value terms.
Major ports accounted for 75% of the total cargo traffic of 345 million tons in F2004.
During F1996-F2006, average cargo traffic growth was 20% and 7% at small ports and major ports, respectively.
Low productivity at Indian ports primarily due to operational & labour inefficiencies, high tariff rates & poor hinterland connectivity and lack of capital investments
Source- Ministry of Shipping, Road Transport & Highways

Asia's share of world trade more than doubledduring 1970-2005
0.05.0
10.015.020.025.030.0
1970 1975 1980 1985 1990 1995 2000 2005
Asia's share of world trade (%)
• Momentum of growth in Developing Asia has shown an uptrendwith Indian economy at No. 2 position after China
Asia Rising
PORTS
Share of World trade defined as(total exports + total imports)/(world exports + world imports)

423.41 To
834.00
281.13 To
423.41
152.85To
281.13
20.01To
152.85
Major Ports
(MN T)
145.53 To
391.00
87.37To
145.53
12.78To
87.37
2.50To
12.78
Non- Major Ports
(MN T)
Total(MN T)
11.47568.94 To
1225.0
2005-06To
2013-2014
Projected Traffic
8.54368.50To
568.94
2000-01To
2005-06
Post- Private Sector Participation
6.28165.63To
368.50
1990-91To
2000-01
Pre-Private Sector Participation
5.2022.51 To
165.63
1950-51To
1990-91
Pre-Liberalisation
CAGR (%)PeriodERA
Trend of Traffic - INDIA
PORTS

423.41383.69344.80313.55287.59All Major Ports
96.27
37.73
22.52
26.43
22.93
17.51
12.06
13.02
36.12
3.40
44.34
21.13
30.40
2001-02
105.41
40.63
26.84
26.80
23.65
21.43
13.02
13.30
33.69
8.49
46.01
23.90
35.80
2002-03
137.83
41.54
32.81
35.19
30.66
33.90
14.09
15.81
43.81
9.48
50.15
30.10
46.16
2004-05
145.59
45.91
37.75
44.19
31.69
34.45
13.94
17.14
47.25
9.17
55.80
33.10
53.02
2005-06
120.84Non Major Ports
41.53Kandla
31.18JNPT
30.00Mumbai
27.87Mormugao
26.67New Mangalore
13.57Cochin
13.68Tuticorin
36.71Chennai
9.28Ennore
47.74Visakhapatnam
25.31Paradip
41.26Kolkata & Haldia
2003-04PORT
All India Traffic in last 5 Years (Million Tons)
PORTS
Traffic includes all cargo including bulk and containers; 1 Container (TEU) is taken as 15 Tons
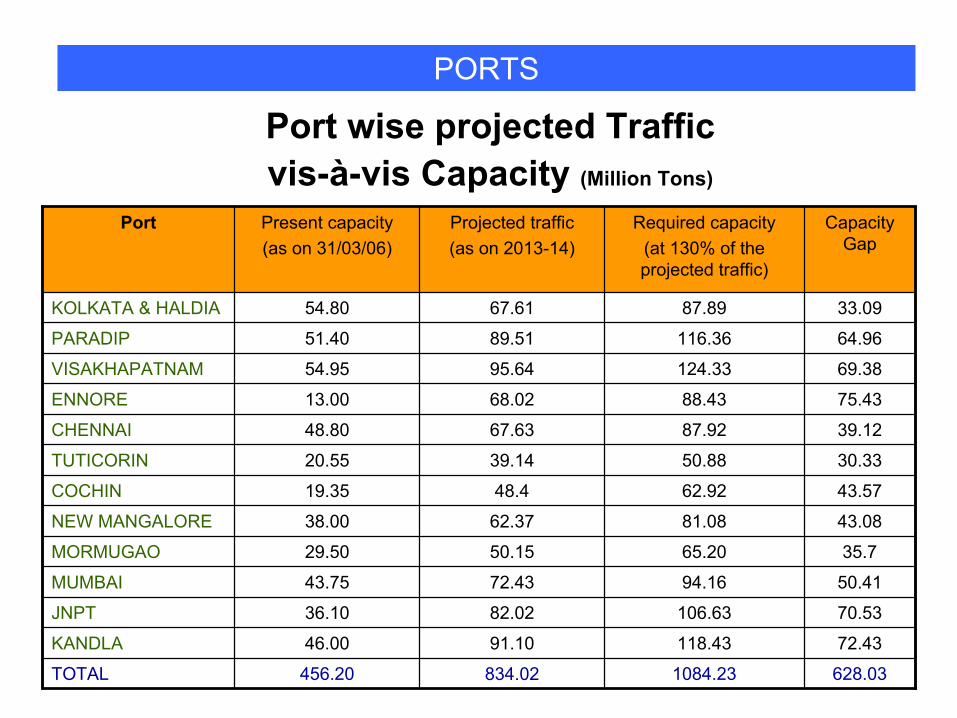
Port wise projected Traffic vis-à-vis Capacity (Million Tons)
1084.23
118.43
106.63
94.16
65.20
81.08
62.92
50.88
87.92
88.43
124.33
116.36
87.89
Required capacity (at 130% of the projected traffic)
834.02
91.10
82.02
72.43
50.15
62.37
48.4
39.14
67.63
68.02
95.64
89.51
67.61
Projected traffic(as on 2013-14)
628.03
72.43
70.53
50.41
35.7
43.08
43.57
30.33
39.12
75.43
69.38
64.96
33.09
Capacity Gap
456.20
46.00
36.10
43.75
29.50
38.00
19.35
20.55
48.80
13.00
54.95
51.40
54.80
Present capacity(as on 31/03/06)
ENNORE
TOTAL
KANDLA
JNPT
MUMBAI
MORMUGAO
NEW MANGALORE
COCHIN
TUTICORIN
CHENNAI
VISAKHAPATNAM
PARADIP
KOLKATA & HALDIA
Port
PORTS

Container Traffic (Million TEUs)
PORTS
Year (Mn TEUs)1993-94 1.05 1994-95 1.26 1995-96 1.45 1996-97 1.70 1997-98 1.89 1998-99 1.93 1999-00 2.19 2000-01 2.44 2001-02 2.88 2002-03 3.37 2003-04 3.90 2004-05 4.23 2005-06 4.61 2006-07 5.44
60% of the Container Traffic is handled at JNPT port- Mumbai Port
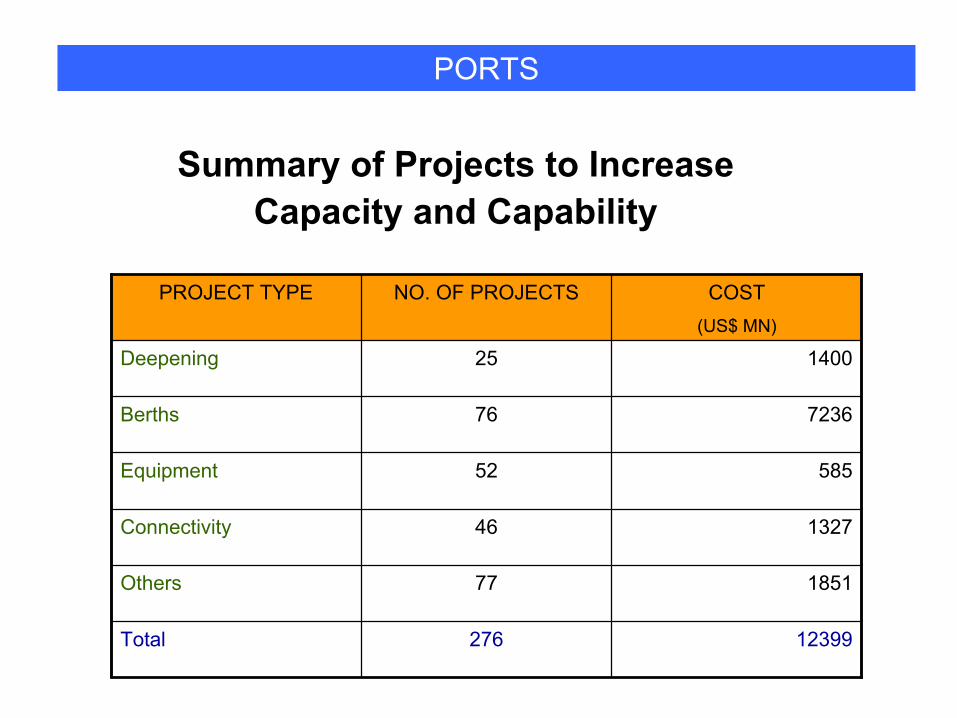
Summary of Projects to Increase Capacity and Capability
12399276Total
185177Others
132746Connectivity
58552Equipment
723676Berths
140025Deepening
COST(US$ MN)
NO. OF PROJECTSPROJECT TYPE
PORTS

Proposed Funding Pattern For Port Infrastructure Projects
55803391734505137713609276Total
8346565162290422578Others
59563634-22329045Rail and Road connectivity works
263213010751427-52Procurement of Equipments, etc.
325635028083386756376Construction/ re-construction of berths/ jetties, etc.
6304481853340273125Deepening of channels/ berths, etc.
TotalOthersPrivateInvest-ment
InternalResources
BudgetarySupport
No. of Projects
Project Head
PORTS

ROADSROADS
PORTSPORTS
AIRPORTSAIRPORTS
POWERPOWER
METRO RAILSMETRO RAILS
INFRASTRUCTUREINFRASTRUCTURE
WATERWATEROpportunities….

Fact fileMajor four airports at Mumbai, Delhi, Kolkatta & Chennai account for 63% of India’s passenger traffic & 78% of its freight traffic.
AAI has started the modernization process of airports with Mumbai, Delhi, Bangalore & Hyderabad airports
With a 24.3% growth in passenger traffic & 9.6% growth in cargo handled (Source: AAI) over the previous period (FY05), India is amongst the fastest growing aviation markets.
Category FY06 FY05 % Y/YAircraft Movements (in '000)International 191 162 17.8%Domestic 647 557 16.2%Total 838 719 16.6%Passengers (in Million)International 22 19 17.7%Domestic 51 40 27.4%Total 73 59 24.3%Cargo (in '000 tons)International 920 822 11.9%Domestic 484 459 5.4%Total 1404 1281 9.6%
AIRPORTS
Source: Airports Authority of India

Source: CRISIL (S&P’s Indian arm)
AIRPORTS

1.908.6016.79.7023.702005-06
1.7311.8120.6519.8021.502004-05
0.8112.7610.359.1011.602003-04
1.597.5412.014.609.402002-03
Multiple (Traffic
Growth over GDP)
GDP Growth %, yoy
Traffic Growth%
Cargo Traffic Growth %,
yoy
PassangerTraffic
Growth %, yoy
Year
GDP v/s Total Traffic
AIRPORTS
International benchmark for Traffic Growth is 0.8-1 times GDP growth

Airport Growth Story – 2005-06

Airport Development Fund Requirements – USD 8.85 bn
AIRPORTS

AIRPORTS

AIRPORTS

ROADSROADS
PORTSPORTS
AIRPORTSAIRPORTS
POWERPOWER
METRO RAILSMETRO RAILS
INFRASTRUCTUREINFRASTRUCTURE
Opportunities….

METRO RAILS IN INDIA
Government FundedKolkata Metro Rail (One of the oldest running Metro rail systems in India)
Mumbai Metropolitan Rail system (existing)
Delhi Metro Rail
Bangalore Metro Rail
On PPP FormatHyderabad Metro Rail (Line I, II & III)
Kochi Metro Rail
Mumbai Metro Rail (Phase I, II & III)
Delhi Airport Metro Rail Link
Chandigarh monorail (planned)
Chennai monorail (planned)
METRO RAILS IN INDIA
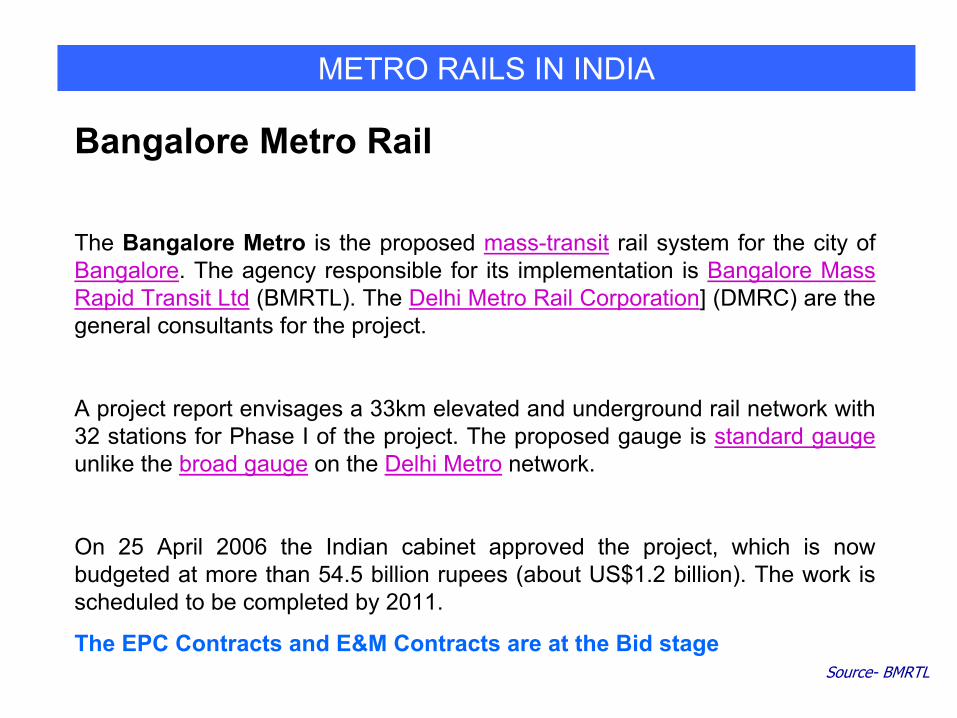
The Bangalore Metro is the proposed mass-transit rail system for the city of Bangalore. The agency responsible for its implementation is Bangalore Mass Rapid Transit Ltd (BMRTL). The Delhi Metro Rail Corporation] (DMRC) are the general consultants for the project.
A project report envisages a 33km elevated and underground rail network with 32 stations for Phase I of the project. The proposed gauge is standard gaugeunlike the broad gauge on the Delhi Metro network.
On 25 April 2006 the Indian cabinet approved the project, which is now budgeted at more than 54.5 billion rupees (about US$1.2 billion). The work is scheduled to be completed by 2011.
The EPC Contracts and E&M Contracts are at the Bid stage
Bangalore Metro Rail
Source- BMRTL
METRO RAILS IN INDIA
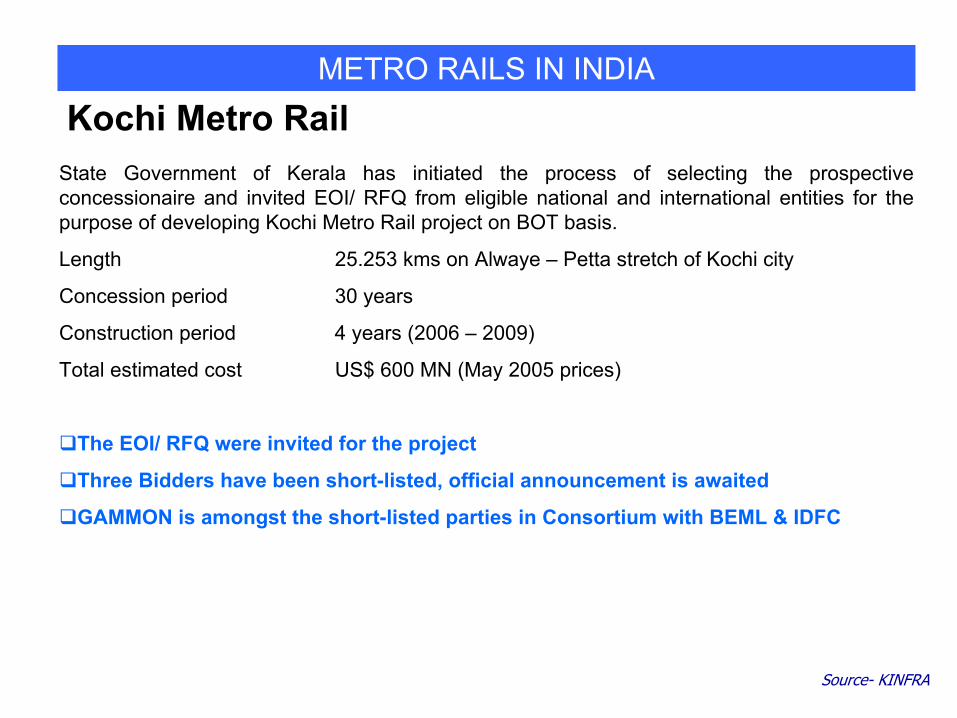
State Government of Kerala has initiated the process of selecting the prospective concessionaire and invited EOI/ RFQ from eligible national and international entities for the purpose of developing Kochi Metro Rail project on BOT basis.
Length 25.253 kms on Alwaye – Petta stretch of Kochi city
Concession period 30 years
Construction period 4 years (2006 – 2009)
Total estimated cost US$ 600 MN (May 2005 prices)
The EOI/ RFQ were invited for the project
Three Bidders have been short-listed, official announcement is awaited
GAMMON is amongst the short-listed parties in Consortium with BEML & IDFC
Kochi Metro Rail
Source- KINFRA

METRO RAILS IN INDIA
–Project Features:Concession of 35 years including 5 years of construction period.Bid Parameter: Min. Viability Gap Funding
3 corridors totaling 66.39 km: –Line 1:Miyapuri to Chaitanyapuri /L.B Nagar- 29.87 km–Line 2:Jubilee Bus Station to Falaknuma- 14.78 km–Line 3:Habsiguda/ Tarnaka to Hitec City-21.74 km
One combined bid for all three packages
Hyderabad Metro Rail
Source- KINFRALine 1,2 & 3Package III
Line 2Package II
Line 1 & 3Package I
CorridorPackage

METRO RAILS IN INDIA
62.68 KmTotal
13.37 KmBandra - Kurla – Mankhurd- LINE 3
38.24 KmColaba - Bandra – Charkop- LINE 2
11.07 KmVersova - Andheri – Ghatkopar (under implementation)- LINE 1
LengthPhase I year (2006 – 2011)
Mumbai Metro Rail
Source- MMRDA
Master Plan is to develop the Metro in 3 Phases
Total Length as per Master Plan – 146.5 Km
Total Cost as per Master Plan –4.35 bn $

METRO RAILS IN INDIA
3.5 KmSewri – Prabhadevi
21.8 KmHutatma Chowk – Ghatkopar
18.0 KmAndheri(E) - Dahisar(E)
19.5 KmBKC - Kanjur Marg via Airport
LengthPhase III ( 2016 – 2021)
12.4 KmGhatkopar – Mulund
7.5 KmCharkop - Dahisar
LengthPhase II (2011 – 2016)
Mumbai Metro Rail
Source- MMRDA

METRO RAILS IN INDIA
Airport Link Mass Rapid Transit Systems
Delhi International Airport Link
Bangalore International Airport Link
Hyderabad International Airport Link
Cochin International Airport Link
ROADSROADS
PORTSPORTS
AIRPORTSAIRPORTS
POWERPOWER
METRO RAILSMETRO RAILS
INFRASTRUCTUREINFRASTRUCTURE
WATERWATEROpportunities….

POWER
Fact file
India has a power shortage of 12% at peak level.
Govt. of India has set up a target of 100,000 MW capacity addition over 2002-2012 to contain power shortage.
Ongoing huge Investments in Transmission & Distribution required to augment the planned generation capacity and overhauling the outdated & inefficient infrastructure
Hydro power opportunity being given renewed thrust. More than 35% of the planned capacity addition during the tenth plan is inhydro power.
Source- Ministry of Power

Source- Ministry of Power, Planning Commission
Power capacity creation
37%60,89622,420Eleventh plan (2008-12) target34%31,90010,800Likely addition in tenth plan35%41,10014,393Tenth plan (2003-07) target25%105,04626,269Capacity in March 2002
% of total
TotalHydroYear to 31 March
Hydro Power capacity creation
66,98560,8852007-2012Eleventh Plan period (E)
35,00041,1002002-2007Tenth Plan period (E)
19,16540,2451997-2002Ninth Plan period
16,42230,5381992-1997Eighth Plan period
Actual / implied requirement
TargetPeriod
66,98560,8852007-2012Eleventh Plan period (E)
35,00041,1002002-2007Tenth Plan period (E)
19,16540,2451997-2002Ninth Plan period
16,42230,5381992-1997Eighth Plan period
Actual / implied requirement
TargetPeriod
POWER

Source- Ministry of Power, Planning Commission
Sector MW %age
State Sector 71,250 55.4
Central Sector 43,231 33.7
Private Sector 13,951 10.9
Total 1,28,432
Total installed capacity
POWER

Source- Ministry of Power, Planning Commission
Fuel MW %age
Total ThermalCoal
84,40069,616
65.654.1
Gas 13,582 10.6
Oil 1,202 0.9
Hydro 33,942 26.5
Nuclear 3,900 3.0
Renewable 6,191 4.8
Total 1,28,432
POWER

Source- Ministry of Power, Planning Commission
Capacity MVA Circuit KM
765/800 KV -- 2,037
400 KV 91,052 73,753
220 KV 1,52,967 112,901
HVDC 3,000 5,872
High Voltage Transmission Capacity
POWER
ROADSROADS
PORTSPORTS
AIRPORTSAIRPORTS
POWERPOWER
METRO RAILSMETRO RAILS
INFRASTRUCTUREINFRASTRUCTURE
WATERWATEROpportunities….

WATERUrban WSS Investment required for meeting the MDG

•Financial Closure•Environmental issues•Engineering challenges•Mechanisation•Operational efficiency•Revenue collection
Post Bid/ Award
•Project feasibility•PPP structure offered•Willingness to pay•License Agreement•Credibility of Client
Pre Bid/ Award
Challenges in Challenges in Privatisation Privatisation ProjectsProjects
Challenges….

THANK YOU