india market strategy 2-
TRANSCRIPT

DISCLOSURE APPENDIX AT THE BACK OF THIS REPORT CONTAINS IMPORTANT DISCLOSURES, ANALYST CERTIFICATIONS, LEGAL ENTITY DISCLOSURE AND THE STATUS OF NON-US ANALYSTS. US Disclosure: Credit Suisse does and seeks to do business with companies covered in its research reports. As a result, investors should be aware that the Firm may have a conflict of interest that could affect the objectivity of this report. Investors should consider this report as only a single factor in making their investment decision.
18 May 2017 Asia Pacific/India Equity Research
Strategy
India Market Strategy Research Analysts
Neelkanth Mishra
91 22 6777 3716
Prateek Singh
91 22 6777 3894
Ravi Shankar
91 22 6777 3869
STRATEGY
Can companies grow fast without innovation?
Figure 1: Tough to beat GDP growth even in under-penetrated sectors
Source: Euromonitor, CSO, Company Data, Credit Suisse estimates
■ The difference between economy and markets. Tempting as it is to link
them, the relationship between the economy and markets is tenuous at best, in
our view. Not only are market returns more P/E than EPS driven, markets and
economy also have different structures. To study this, we categorised BSE500
stocks into: Global, Macro, Penetration and Market Share (as key revenue
driver). 64 of the 97 stocks that grew sales at more than 25% CAGR over ten
years improved penetration, and 15 (mostly private banks) gained share. We,
therefore, analyse the drivers of penetration.
■ Growing revenues faster than GDP is tough. The 2002-16 growth for even
under-penetrated categories is not too different from the growth in nominal
GDP. For a category to grow meaningfully faster, one needs one or more of:
(1) Innovations that bring down price points to a level where price elasticity of
demand is high (e.g., sachets, mortgages); (2) Improvement in enablers (e.g.,
electricity for appliances); (3) Improved distribution; and (4) Demographics. In
India, only items with very low price points have high penetration (telecom
penetration is 90% only as it is profitable at Rs80 ARPU). For under-penetrated
categories to grow fast, they must innovate and cut costs sharply so they can
stay profitable even at low price points.
■ Market pricing in a tide; there may be none. Even as revenue growth has
slowed in the recent years, P/E multiples have risen (24% of stocks trade at
30x P/E or more, vs 6% five years back). This is partly due to global drivers,
but also implies a broad-based growth faster than GDP. This is unlikely. We
believe sharp penetration improvement would be selective—in NBFCs
(Overweight on Chola Finance), banking, consumer appliances (HAVL,
Crompton Consumer), select Staples (Godrej Consumer, ITC), telecom towers
(Bharti Infratel) and QSR (Jubilant). Expectations (high P/E) appear excessive
in NEST, COLG and TVSM (Underweight).
-2% 0% 2% 4% 6% 8% 10%12%14%16%
Shampoo
Detergents
Bar Soap
Carbonated Drinks
Cigarettes
Tooth Paste
Tea
Alcohol
Biscuits
2W
Paints
4W
Volume Price
Expenditure G
rowth
Revenue Growth 2002-16
Shampoo
Detergents
Bar Soap
Carbonated Drinks
Cigarettes
Tooth Paste
Tea
AlcoholBiscuits
2W
Paints
4W
0%
2%
4%
6%
8%
10%
12%
-5% 0% 5% 10% 15%
Volume Growth CAGR
Pric
e G
row
th C
AG
R (
2002
-16)
Drivers of 2002-16 revenue growth

18 May 2017
India Market Strategy 2
Focus charts
Figure 2: Nifty returns dominated by P/E changes Figure 3: India GDP growth vs Nifty EPS growth
Source: The BLOOMBERG PROFESSIONAL™ service, Credit Suisse estimates Source: CSO, The BLOOMBERG PROFESSIONAL™ service, RAVE, Credit Suisse
estimates
Figure 4: Market cap for each sector split into the four categories, by key driver of revenue growth
Source: The BLOOMBERG PROFESSIONAL™ service, RAVE, Credit Suisse estimates
Figure 5: 64 of 97 fast growing names in Penetration Figure 6: Growth though has slowed sharply of late
Source: Capitaline, Credit Suisse estimates Source: Capitaline, Credit Suisse estimates
Figure 7: Penetration/Market share at a premium Figure 8: P/E Multiples have risen across the board
Source: RAVE, Credit Suisse estimates Source: RAVE, Credit Suisse estimates
-40%
-20%
0%
20%
40%
60%
80%
2007 2008 2009 2010 2011 2012 2013 2014 2015 2016 2017
12MF EPS Change 12MF P/E Change Index Change
1Y Change
-5%
0%
5%
10%
15%
20%
-10%
0%
10%
20%
30%
40%
2007 2008 2009 2010 2011 2012 2013 2014 2015 2016 2017
Nifty EPS Growth Nominal GDP Growth (RHS)
0%
20%
40%
60%
80%
100%
IT
Ene
rgy
Priv
ate
Ban
k
Sta
ples
PS
U B
ank
NB
FC
Aut
os
Hea
lth
Indu
stria
ls
Tel
ecom
Util
ities
Met
als
Cem
ent
Dis
cret
ion
ary
Che
mic
als
Rea
lE
stat
e
Tot
al
Penetration
Market Share
Macro
Global
0%
20%
40%
60%
80%
100%
Decline 0-15% 15-25% 25%+ Total
Penetration Macro Global Market Share
# Cos 8 172 164 97 441
0%
20%
40%
60%
80%
100%
10Y 5Y 3Y 1Y
Decline 0-15% 15-25% 25%+
5
10
15
20
25
30
Jan-11 Sep-11 May-12 Jan-13 Sep-13 May-14 Jan-15 Sep-15 May-16 Jan-17
Penetration Market Share Macro
Global Total
12MF PE 0%
20%
40%
60%
80%
100%
5Y 3Y 1Y Now
< 10 10-15 15-20 20-25 25-30 > 30
18 May 2017
India Market Strategy 3
Can companies grow fast without innovation? The difference between economy and markets
Intuitive as it may seem to link macroeconomic trends to market performance, such a relationship is at best tenuous, in our view. Not only are market returns more P/E than EPS driven, the markets and the economy also have different structures. The economy has a very large informal component, large parts of the formal economy are not listed, and a large part of the market is driven by global factors, or is growing penetration and share.
To study these dynamics better, we divided the BSE500 stocks into four categories: Global, Macro, Penetration and Market Share. 25% of the BSE500 market cap is almost completely driven by global factors, 22% by local macro, 11% by market share (private sector banks and telecom) and 42% by penetration driven stories.
Expectedly, penetration and market share driven stories have seen much stronger organic revenue growth over the last ten years — together they are 79 of the 97 companies in the BSE500 (22% of total) that grew revenues at 25% CAGR. They have also outperformed the index over the past three and five years, with P/E multiples expanding sharply. In this note we focus primarily on the concept of Penetration and potential for growth.
Growing revenues faster than GDP is tough
We find that the 2002-16 growth in market-size for even under-penetrated categories is not too different from the growth in nominal GDP. For a category to grow meaningfully faster than nominal GDP at least one of the following must happen: (1) Innovations that bring down price points to a level where price elasticity of demand is high (e.g., sachets, mortgages); (2) Improvement in enablers (e.g., electricity for appliances, doctors to write prescriptions); (3) Improvement in distribution (local presence and brand awareness); and (4) Demographics. The first two can drive short-lived bursts of very strong growth and the latter two provide a smaller boost but over longer periods.
Whether the Indian middle class has 300 mn or 100 mn people is an important debate as only items that have very low price points have high penetration. Telecom penetration for example would not have been 90% if companies were not profitable at Rs80 ARPU. Intuitive as this is, it throws a challenge to enterprises in under-penetrated categories to innovate and cut costs to a level where one can stay profitable even at low price points.
We believe some NBFCs and banks are benefiting from a sharp fall in operating costs, enabled by improving technology and telecom penetration. A sharp improvement in electrification could be an enabler for appliance companies, and lower interest costs and more tax filings (that act as income proof) could enable better mortgage penetration. There are very few other examples that come to mind. We continue to believe that factors of production—capital, labour and land, are likely to get cheaper in India, but their impact on production costs would be slow, even though steady.
Market pricing in a tide: There may be none
Growth rates have slowed steadily in recent years—only 12% of BSE500 companies saw revenues grow faster than 25% CAGR in the last five years. During the same period P/E multiples have increased across the board—while 6% of BSE500 (232 stocks for which forward EPS is available) traded above 30x P/E five years back, now 24% do.
While this re-rating has much to do with a global increase in P/E multiples, a popular justification is a future acceleration in India's economic growth that would drive super-normal growth for companies. Our framework suggests that such acceleration would be contingent on sector and stock specific factors, and it is prudent to be selective.
Key overweights: GCPL, Havells, Crompton, BHRI, CHLF, Jubilant and ITC. Key Underweights: Nestle, Colgate, TVS Motors. We provide the rationale in Figure 9.
The relationship between the economy
and markets is tenuous at best, in our view
Stories driven by penetration (42% of
BSE500 market cap) and market share (11%)
have seen stronger organic revenue growth and also outperformed
the index over years
The growth in market size over 2002-16 is not
too different from the nominal GDP growth
and growing faster than that is tough, unless
there are a few specific drivers in place
In India, only items with
low price points have seen high penetration
The factors of production are likely to
get cheaper but their impact on production costs would be slow
Even as revenue growth has slowed
over years, P/E multiples have
expanded

18 M
ay 2
017
Ind
ia M
ark
et S
trate
gy
4
Financial Summary
Figure 9: Stock ideas
Company RIC Rating Mkt Cap
($ bn)
Comments
Recommended Overweight stocks
ITC Ltd ITC.BO OUTPERFORM 53 1. Government moving to a rational tax regime, three consecutive declines in excise hikes on cigarettes, FY18 saw just a 6% hike.
2. This should give ITC more flexibility in the volume vs. price balance, and retain bigger share of market (earlier government took much of the increase).
3. We expect ITC to return to ~15% earnings growth with a ~5% volume growth in cigarettes in in FY18. It is also the cheapest consumer staples name in our coverage.
Bharti Infratel Ltd BHRI.BO OUTPERFORM 11 1. As data prices drop sharply, volumes are likely to surge driving an increased need for towers along with incremental business from Jio.
2. Downside from Idea-Vodafone merger would at most be loss of half a year’s growth. Long term tenancy growth story is beginning to look better with a
higher benchmark being set by the Idea+Vodafone in terms of network size.
3. Path to ‘independent’ ownership is now visible.
Godrej Consumer
Products Ltd
GOCP.BO OUTPERFORM 9 1. Product innovation pace has accelerated over the last five years especially in home insecticides, e.g. the Re1 mosquito repellant and cheap air fresheners.
2. India business saw a very strong recovery in 4Q post demonetisation. Margins went up without cutting ad spends. Has high pricing power in its portfolio except soaps.
3. Worst of the currency headwinds in the international business seem behind. Company also increased div. payout to 45% from 20%.
Cholamandalam Finance CHLA.BO OUTPERFORM 3 1. Using technology creatively to not just improve operating efficiency but also to increase credit quality.
2. We see room for NIM expansion with delayed funding cost benefit and operating leverage as growth comes back in Vehicle finance.
3. It has maintained portfolio quality in its vehicle finance book albeit incurring higher operating cost. This could drive ROE expansion. At current valuations,
Chola trades at 2.6XFY19E P/B and 12.8XFY19E P/E.
Crompton Greaves
Consumer Electrical Ltd
CROP.BO OUTPERFORM 2 1. Key beneficiary of rising electrification and improving power availability through its appliances business. Making a big push in premium fans (40-50%
growth) and revamping distribution to become FMCG like.
2. Has historically been a strong franchise but now getting requisite investments. The new management at the help has rich consumer experience (P&G, Pidilite).
3. We think margins will gradually move up due to premiumisation and cost savings, results already evident.
Jubilant Foodworks JUBI.BO OUTPERFORM 1 1. Company reviving price competitiveness: lower priced items have been introduced and price hikes have ben near zero since Dec 2015. Important for volume growth.
2. Business has a very high operating leverage and thus earnings can accelerate with steady SSSG improvement.
3. Separately, they have taken several strategic decisions recently to focus on improving profitability of existing stores and moderating expansion plans.
Havells India Ltd HVEL.BO NEUTRAL 5 1. Key beneficiary of rising electrification and improving power availability through its appliances business. Also a direct play on overall economic growth
(switch gears and cable business).
2. Havells management has built strong brand equity over the years with consistent marketing spends and has the strongest pan India in domestic electricals.
3. Management is seeing some greenshoots in its core switchgear and expects double digit growth in FY18.
Recommended Underweight stocks
Nestle India NEST.BO UNDERPERFORM 10 1. The focus on margins in the last few years has meant very poor quality growth. Recent pickup in investment behind ad spends may show up with a lag.
2. Nestle has been able to get back only a 60% market share for Maggi versus the 70% before the ban.
3. P/E multiples are too high versus what we think are achievable growth rates in the coming years.
TVS Motors TVSM.BO UNDERPERFORM 4 1. As our analysis shows, supernormal growth in 2W industry revenues could be challenging.
2. TVS intends to expand market share and also expand margins through cost optimization and better product mix but we foresee challenges as competitive
intensity in 2W industry remain high.
3. Valuations are expensive even after building reasonable growth in volumes and expansion in operating margins.
Colgate-Palmolive India COLG.BO NEUTRAL 4 1. Toothpastes are a well penetrated category, and growth can only now come through premiumisation.
2. But Colgate is losing share of premium products to Patanjali and Dabur’s herbal variants. It lost an alarming 200bps worth of market share in CY16.
3. For effectively a single product company, this is a big risk. P/E multiples are too high versus what we think are achievable growth rates in the coming years.
Source: Company data, Credit Suisse estimates

18 May 2017
India Market Strategy 5
The difference between economy & markets
Markets and the local economy not always in sync
Intuitive as it may seem to link macroeconomic trends to market performance, such a
relationship is at best tenuous, in our view. Looking at GDP growth versus Nifty returns
(Figure 10), and also at the deviation of GDP growth from trend versus Nifty returns
(Figure 11), we find the relationship is weak and far from predictive. That is, one cannot
predict the performance of markets only on the basis of a strong/weak economy.
Figure 10: India GDP growth vs Nifty performance Figure 11: Deviation from GDP trend vs Nifty returns
Source: CSO, Bloomberg, Credit Suisse estimates Source: CSO, Bloomberg, Credit Suisse estimates
There are many well discussed reasons for this, including timing, that is, when the market
prices in future earnings are variable, as reflected in a volatile P/E ratio. Market returns are
as often P/E driven as they are EPS driven (Figure 12). While one can assume over time,
as the P/E remains in a range, on a long enough time horizon it should be earnings that
drive market returns, and should therefore, be linked to the economy. Interestingly,
however, even Nifty EPS growth has a weak link to GDP growth (Figure 13).
Figure 12: Split of Nifty change into P/E & EPS Figure 13: India GDP growth vs Nifty EPS growth
Source: The BLOOMBERG PROFESSIONAL™ service, Credit Suisse estimates Source: CSO, The BLOOMBERG PROFESSIONAL™ service, CS estimates
-40%
-20%
0%
20%
40%
60%
80%
100%
0%
2%
4%
6%
8%
10%
12%
1995 1997 1999 2001 2003 2005 2007 2009 2011 2013 2015 2017
Real GDP Growth Nifty Performance YoY
-100%
-80%
-60%
-40%
-20%
0%
20%
40%
60%
80%
100%
-3.0%
-2.0%
-1.0%
0.0%
1.0%
2.0%
3.0%
1995 1997 1999 2001 2003 2005 2007 2009 2011 2013 2015 2017
GDP: Deviation from Trend Nifty Performance YoY
-40%
-20%
0%
20%
40%
60%
80%
2007 2008 2009 2010 2011 2012 2013 2014 2015 2016 2017
12MF EPS Change 12MF P/E Change Index Change
1Y Change
-5%
0%
5%
10%
15%
20%
-10%
0%
10%
20%
30%
40%
2007 2008 2009 2010 2011 2012 2013 2014 2015 2016 2017
Nifty EPS Growth Nominal GDP Growth (RHS)

18 May 2017
India Market Strategy 6
There are multiple reasons for this—the constitution of the markets and the economy is
different. Not only does the economy have a very large informal component, large parts of
the formal economy are also not listed (e.g., LIC, most real-estate developers, nearly 40%
of the car market, consumer appliance and cellphone producers, cola companies). In
important sectors like banks, the share of market capitalisation of PSU Banks is very
different from their share of deposits or credit (Figure 14). Further, a large part of the
market is driven by global factors (e.g., IT, Pharmaceutical exporters, Tata Motors). Lastly,
many listed companies are likely to be increasing penetration (e.g., Microfinance, cars), or
beneficiaries of large market share shifts (e.g., private sector banks).
Figure 14: PSU Banks' share of market cap is low Figure 15: Unlisted names dominate some markets
Source: Company Data, RBI, The BLOOMBERG PROFESSIONAL™ service, Credit Suisse estimates
Source: Company Data, Credit Suisse estimates
Classifying stocks by their key drivers
To study these dynamics better, we divided the BSE500 stocks into four categories:
Global, Macro, Penetration, and Market Share; Figure 16 shows how these are defined.
Figure 16: Category definitions
Category Stock fundamentals primarily driven by
Global Global factors.
Macro Indian macroeconomic factors, like GDP growth, interest rates, inflation, investments, etc.
Penetration Stock/sector-specific issues, related to greater penetration, improved distribution, etc.
Market Share The sector may not be expanding meaningfully, but there are big market share shifts happening.
Source: Credit Suisse Research
■ Global: 14% by number (Figure 17) and 25% by market cap (Figure 18) is almost
completely driven by global factors: mainly IT, Metals, Energy and some Auto names.
We do not include Pharmaceuticals here (ANDA filings and India business are drivers).
■ Macro: 26% by number and 22% by market cap, the companies are driven by
domestic macroeconomic catalysts. These include Industrials, PSU Banks, Cement,
Utilities, some Energy and NBFC names and Real estate.
■ Market Share: This has only 17 names (3%)—private sector banks and telecom
companies. However, these form 11% of BSE500 market cap.
■ Penetration: The largest category both in terms of number of companies (57%), as
well as market cap (42%). This is likely the primary reason that aggregate market
revenues and profits can potentially grow faster than the nominal economic growth.
32%
74% 76%
0%
10%
20%
30%
40%
50%
60%
70%
80%
Mcap Loans Deposits
Share of PSU Banks among all banks
0%
10%
20%
30%
40%
50%
60%
70%
80%
Dairy Jewellery 2W Biscuits 4W AC LifeInsurance
Share of unlisted formal companies in overall market

18 May 2017
India Market Strategy 7
Figure 17: Split of BSE500 by Number of Companies Figure 18: Split of BSE500 by Market Cap
Source: Credit Suisse Source: RAVE, Credit Suisse estimates
Sector-wise classification into the four categories
The split for each sector is available in Figure 19. Sectors like IT, Energy and Metals are
almost entirely classified as global. Private Banks and Telecom are classified as market
share because their growth is less dependent on the growth in the sector, but more by
their ability to take share from government companies (in the case of banks), or to protect
share from new entrants (in the case of telecom). Healthcare is classified as penetration
as there is a significant growth potential in the domestic market, and most listed
companies also have large pending pipelines in the large US market. NBFCs,
Discretionary, Autos and Chemicals are classified primarily as Penetration.
Figure 19: Market cap for each sector split into the four categories, by key driver of revenue growth
Source: RAVE, Credit Suisse estimates
Penetration57%
Market Share3%
Macro26%
Global14%
Penetration42%
Market Share11%
Macro22%
Global25%
0%
10%
20%
30%
40%
50%
60%
70%
80%
90%
100%
IT
Ene
rgy
Priv
ate
Ban
k
Sta
ples
PS
U B
ank
NB
FC
Aut
os
Hea
lth
Indu
stria
ls
Tel
ecom
Util
ities
Met
als
Cem
ent
Dis
cret
iona
ry
Che
mic
als
Rea
l Est
ate
Tot
al
Penetration Market Share Macro Global

18 May 2017
India Market Strategy 8
Why we classified Staples under Penetration and not Macro
We debated whether Staples should be classified as Macro or Penetration, and chose the
latter. Many if not most of these categories are well penetrated, and growth at the sector
level seems to be rarely higher than the nominal GDP growth, as we see in the next
section. But the listed companies in this space are still expanding in new product
categories and geographies. Even the largest of these firms still does not have direct
distribution or advertising reach in large swathes of India, can be called underpenetrated.
Penetration-driven stories dominate the market
Stocks in the penetration and market share categories have significantly outperformed the
market and the Global and Macro categories over three and five years (Figure 20).
Penetration showed a 25% CAGR rise over five years, versus 16% CAGR for the market.
Figure 20: Performance by Type (CAGR) Figure 21: P/E for each category over time
Source: RAVE, Credit Suisse estimates Source: RAVE, Credit Suisse estimates
However, over the past year, their performance has been in line with the overall market, as
Macro (i.e., Industrials, PSU Banks) has outperformed meaningfully. One reason for this
performance could be the sharp increase in P/E ratios for this set of stocks (Figure 21).
Figure 22: Split by 10-year growth for each category Figure 23: Category-wise split by ten-year growth
Source: Capitaline, Credit Suisse estimates Source: Capitaline, Credit Suisse estimates
28%27%
25%
28%
20% 20%
36%
15%
10%
21%
10%12%
28%
18%16%
0%
5%
10%
15%
20%
25%
30%
35%
40%
1Y 3Y 5Y
Penetration Market Share Macro Global Total
Annualized Returns
-10% 0% 10% 20% 30% 40% 50% 60% 70%
Global
Penetration
Market Share
Macro
5Y 3Y 1Y CYTD
Change in 12M Forward PE
0%
10%
20%
30%
40%
50%
60%
70%
80%
90%
100%
Penetration Macro Global Market Share Total
Decline 0-15% 15-25% 25%+
# Cos 244 119 63 15 441
0%
10%
20%
30%
40%
50%
60%
70%
80%
90%
100%
Decline 0-15% 15-25% 25%+ Total
Penetration Macro Global Market Share
# Cos 8 172 164 97 441

18 May 2017
India Market Strategy 9
22% of companies grew revenues >25% for ten years
While historical growth rates may not help predict future trends, they provide useful insights into what can drive revenue growth meaningfully higher than India's nominal GDP growth. We find that 39% of the companies in the BSE500 (441 for which ten-year records are available) failed to beat 15% growth (nominal GDP growth was 12-14%), another 37% grew between 1x and 2x nominal GDP, and 22% grew more than 25% CAGR (Figure 22). Two-thirds of companies growing this fast were in the Penetration category (Figure 23).
Figure 24: Market-cap wise split by ten-year growth Figure 25: % of companies split by ten-year growth
Source: Capitaline, Credit Suisse estimates Source: Capitaline, Credit Suisse estimates
23% of BSE500 market capitalisation grew revenues at 25% CAGR, 39% showed 15-25% growth, and as much as 36% grew less than the nominal GDP growth (Figure 24). The share by number of companies was similar (Figure 25) indicating average sizes to be similar, though these averages hide sharp sector-level disparity.
Figure 26: Sector-wise split of 25%+ growth (no.) Figure 27: Sector-wise split of 25%+ growth (Mcap)
Source: Capitaline, Credit Suisse estimates Source: Capitaline, Credit Suisse estimates
The sectoral split of companies with more than 25% ten-year revenue CAGR reveals that NBFCs and discretionary dominate in number of companies (Figure 26). However, 75% of the market capitalisation is in Private sector banks, NBFCs and companies that have made large global acquisitions, like Tata Motors, Motherson Sumi, and Vedanta (Figure 27). Discretionary companies on the other hand are relatively small—they are 20% of the companies, but add up to only 5% of the market capitalisation.
Decline2%
0-15%36%
15-25%39%
25%+23%
Split of market cap by 10Y revenue CAGR
Decline2%
0-15%39%
15-25%37%
25%+22%
Split of companies by 10Y CAGR
NBFC26%
Discretionary20%
Industrials12%
Health9%
IT7%
Pvt. Bank6%
Chemicals5%
Staples4%
Autos3%
Real Estate3%
Others5%
Split of companies with 10Y CAGR >25%
Pvt. Bank.35%
NBFC27%
Health9%
Autos8%
Industrials5%
Discretionary5%
IT3%
Metals3%
Telecom1%
Real Estate1%
Chemicals1%
Others2%
Split of Market Cap with 10Y CAGR >25%

18 May 2017
India Market Strategy 10
Growing revenues faster than GDP is tough
Most categories grow at the pace of per capita GDP
India has a low per capita GDP, and therefore, a greater potential for growth is now well
known—at least among EMs, since 1980, long-term growth rates have been inversely
proportional to the starting GDP (Figure 36). In India, growth in the nominal per capita
GDP as well as consumption per capita has averaged about 12% in the last decade
(Figure 29). A growth of 10-12% going forward is a reasonable assumption.
Figure 28: Per capita GDP PPP adjusted is low Figure 29: Per capita GDP & spending growth
Source: IMF, Credit Suisse estimates Source: CSO, Credit Suisse estimates
Intuitively, growth experienced by a category can be faster than this pace, if penetration
(defined as the number of households per 100 that use the product in a month) improves
as well. Even where penetration is high, like in detergents, (Figure 30) growth need not be
zero, as significant upgradation potential exists, like moving from low-end Rs40/kg
powders to higher-end Rs140/kg low-foam powders for front-loading washing machines.
Figure 30: Change in penetration over more than a decade (2000 to 2012)
Source: NSSO, SIAM, Credit Suisse estimates
China
India
Thailand
Indonesia
Malaysia
Turkey
Mexico
BrazilS. Africa
0%
2%
4%
6%
8%
10%
12%
0 1,000 2,000 3,000 4,000 5,000 6,000
Per Capita GDP (PPP Adjusted, US$, 1980)
CA
GR
in p
er C
ap. G
DP
(198
0-20
17)
-10%
-5%
0%
5%
10%
15%
20%
1952 1957 1962 1967 1972 1977 1982 1987 1992 1997 2002 2007 2012 2017
GDP PFCENominal Per Capita Growth
1%4%
35%
56%
35%
42%
65%
97% 95% 96%
3%
22%
46%
52%
68% 69%
89%
97% 98% 99%
0%
10%
20%
30%
40%
50%
60%
70%
80%
90%
100%
4W 2W Bicycle Tobacco Skin Care Biscuits Toothpaste Edible Oil Soap Detergents
2000 2012

18 May 2017
India Market Strategy 11
We find that medium-term growth in market-size for a category is not too different from the
growth in nominal GDP (Figure 31). Enterprises operating in these categories can choose
to increase penetration by keeping prices subdued and growing volumes, or, like in
cigarettes, take price hikes while keeping volume growth subdued.
Figure 31: Growth in market 2002-2016 (CY) Figure 32: Price and volume are inversely related
Source: Euromonitor, Credit Suisse estimates Source: Euromonitor, Credit Suisse estimates
This is because price and volume have an inverse relationship (Figure 32). As they
should—only when a product/service becomes affordable to more people that penetration
can increase (Figure 33), which implies a reduction in real prices.
Figure 33: Companies can choose to grow volumes or price; latter is harder
Source: Credit Suisse Research
For example, an important driver of the increase in penetration of four-wheelers and two-
wheelers is the decline in real prices. Over and above the 33% decline in inflation adjusted
realisations of both two-wheelers (Figure 34) and four-wheelers (Figure 35) since 2002,
excise duties have also come down by 10-12% since 2000 (from 24% to 12.5% for two-
wheelers as well as small cars), bringing down retail prices in real terms by nearly 40%.
This is after feature upgrades and increase in sizes of both categories. In well penetrated
categories like toilet soaps, this plays out as premium products at similar real prices.
-2% 0% 2% 4% 6% 8% 10% 12% 14% 16%
Shampoo
Detergents
Bar Soap
Carbonated Drinks
Cigarettes
Tooth Paste
Tea
Alcohol
Biscuits
2W
Paints
4W
Volume Price
Expenditure G
rowth
Revenue Growth 2002-16
Shampoo
Detergents
Bar Soap
Carbonated Drinks
Cigarettes
Tooth Paste
Tea
AlcoholBiscuits
2W
Paints
4W
0%
2%
4%
6%
8%
10%
12%
-2% 0% 2% 4% 6% 8% 10% 12%
Volume Growth CAGR (2002-16)P
rice
Gro
wth
CA
GR
(20
02-1
6)
Drivers of 2002-16 revenue growth

18 May 2017
India Market Strategy 12
Figure 34: Real 2W realisations down 33% 2003-17 Figure 35: Real 4W realisations down 33% 2003-17
Source: Company Data, CMIE, Credit Suisse estimates Source: Company Data, CMIE, Credit Suisse estimates
Drivers of category penetration/market growth
For a category to grow meaningfully faster than the per capita consumption growth, at
least one of the following must happen. Of these the first two can cause sharp acceleration
for a few years, and the last two a moderate pick-up in growth over a longer period:
1. Innovations that bring down price points meaningfully: The income pyramid is not
smooth with a price elasticity of -1, i.e., the improvement in volumes need not be the
same as the decline in prices. At certain inflection points, price elasticity of demand
can be high and volume growth can offset price declines, growing the market strongly
in value terms, e.g., cellphones/smartphones, computers and banking.
These need not only be technological innovations—economic ones like shampoo
sachets (rural penetration improved from 13% in 2000 to 32% by 2005, and currently
90%), or buying consumer appliances on EMI (brings down the price point at which a
product becomes affordable) can be very potent too. If affordable housing can work,
say by using cheap land made available by government departments or public sector
units, together with subsidised mortgages, that would also be an economic innovation.
2. Improvement in Infrastructure/Enablers: There are several examples here:
− Consumer appliances are useless without availability of electricity, even if the
products are affordable. Improvement in the quality and quantity of power supply is
necessary to help the category grow.
− Availability of good roads is necessary for vehicle ownership.
− Improvement in doctor availability improves demand for pharmaceuticals
− Growth in tax filers/salaried employees helps mortgage demand as this helps
provide a proof of income needed for disciplined mortgage lending.
3. Improvement in distribution: Some goods and services require local presence,
lending and banking being the most obvious examples. Due to elevated operating
costs some businesses may not be able to expand their distribution. However, through
efficient processes and automation, companies can expand their geographical
footprint while bringing down their costs of operation. HDFC's mortgages are a good
example—it has grown its branch strength manifold (Figure 36) in an under-
penetrated market, helped by a falling cost-to-income ratio (Figure 37).
-
5,000
10,000
15,000
20,000
25,000
30,000
35,000
40,000
45,000
50,000
2003 2005 2007 2009 2011 2013 2015 2017
Avg. realization 2W (Rs/vehicle) Real Terms
-
50,000
100,000
150,000
200,000
250,000
300,000
350,000
400,000
450,000
500,000
2005 2006 2007 2008 2009 2010 2011 2012 2013 2014 2015 2016 2017
Avg. realization 4W (Rs/vehicle) Real Terms

18 May 2017
India Market Strategy 13
Even for companies operating in well-penetrated categories, distribution reach is still
limited. We, therefore, classify Staples companies as penetration-driven despite their
categories being mature. This also explains the relatively strong reported growth of
categories like edible oils—demand for fats is rising faster than the average food
demand, but only by a few percentage points. The main reason for the growth is the
transition from loose, unbranded oils to branded packaged edible oil.
Figure 36: HDFC's branch network Figure 37: HDFC's cost-to-income ratio 1998-2017
Source: Company Data, Credit Suisse estimates Source: Company Data, Credit Suisse estimates
4. Demographics: Demographic trends also support greater penetration of some
categories, like the use of pre-prepared foods and packaged masalas can be linked to
more women joining the workforce (at the high-end this also explains the demand for
studded jewelry). While these trends are very powerful, their impact is rarely sudden.
The price point is critical: It is all about unit costs
Figure 38: Household penetration of various categories
Source: NSSO, Credit Suisse estimates
Whether the Indian middle class has 300 mn or 100 mn people is an important debate—
only the cheaper items (Figure 38), i.e., those that have very low price points, have high
penetration. Intuitive as this is, it throws a challenge to enterprises in under-penetrated
0
50
100
150
200
250
300
350
400
450
1997 1999 2001 2003 2005 2007 2009 2011 2013 2015 2017
No. of HDFC Outlets
0%
2%
4%
6%
8%
10%
12%
14%
16%
18%
20%
1998 2000 2002 2004 2006 2008 2010 2012 2014 2016
HDFC Ltd. Cost to Income Ratio
0%
10%
20%
30%
40%
50%
60%
70%
80%
90%
100%
Mic
row
ave
Mal
ted
Foo
ds
Car
bona
ted
Drin
ks
4W
Cig
aret
tes
Com
pute
r
Was
hing
Mac
hine
Alc
ohol
MF
Fol
ios
Ref
riger
ator
2W
Sal
ty S
nack
s
TV
Ski
n ca
re
Bis
cuits
Cho
cola
tes
Tea
Mob
ile P
hone
Too
thpa
ste
Hai
r oi
l
Sha
mpo
o
Edi
ble
Oil
Soa
p
Det
erge
nts
Ban
k A
ccou
nt
Household Penetration of Various goods and services

18 May 2017
India Market Strategy 14
categories for bringing operating costs to a level where even at rock bottom revenues one
can stay profitable. For example, telecom penetration would not have reached 90% if the
telecom sector was not profitable at Rs100 ARPU (Figure 39). Similarly, while TV
penetration in India is not universal, nearly every TV-owning household has
cable/satellite—the highest such ratio in the world, primarily as subscription costs are the
lowest globally.
Figure 39: Telecom ARPUs vs penetration Figure 40: % of households with bank accounts
Source: Company Data, Trai, Credit Suisse estimates Source: PMJDY, Census 2011, Credit Suisse estimates
Banking penetration increase driven by falling transaction costs
In our view, banking penetration would not have grown (Figure 40) without a sharp decline
in operating costs, which brought down the minimum balance at which an account
becomes viable for a bank. Transaction cost for an ATM cash withdrawal is nearly a third
of a withdrawal from a bank branch, and mobile banking transfers are nearly zero-cost in
comparison; further, Aadhaar as KYC (Know Your Client) is faster and much cheaper than
paper KYC. A meaningful part of this improvement has come from technology and
widespread availability of cheap telecom services.
Figure 41: Number of MFI accounts Figure 42: NBFC operating ratio
Source: MFIN, Credit Suisse estimates Source: Company Data, Credit Suisse estimates
0%
25%
50%
75%
100%
0
100
200
300
400
Mar-05 Jun-06 Sep-07 Dec-08 Mar-10 Jun-11 Sep-12 Dec-13 Mar-15 Jun-16
Industry ARPU (Rs/sub/month) Mobile Telecom Penetration (RHS)
Removal of inactive subscribers from records
Sharp jump as RJio brought down ARPUs
Strong penetration growth as ARPUs fell by three-fourths
0%
20%
40%
60%
80%
100%
Mar-01 Mar-11 Nov-14 Jan-15
% Households having banking facilities
PMJDY launched
-20%
-10%
0%
10%
20%
30%
40%
50%
0
5
10
15
20
25
30
35
40
45
2012 2013 2014 2015 2016 2017
MFI Accounts (mn) YoY (RHS)
0.60%
0.70%
0.80%
0.90%
1.00%
1.10%
1.20%
1.30%
FY09 FY10 FY11 FY12 FY13 FY14 FY15 FY16 FY17 FY18
Employee Cost Other Opex
As % of AUM (Shriram Transport)

18 May 2017
India Market Strategy 15
NBFCs benefit from banking penetration, databases and innovation
The rapid scale up in retail lending and microfinance (Figure 41) has benefited from similar
trends—online transfers to bank accounts are significantly less expensive than cash
collection and disbursements, making it easier for NBFCs to operate. A drop in operating
costs allows the NBFC to expand its geographical footprint, and therefore, its customer
base. We show Shriram Transport (Figure 42) as an example; as we earlier saw HDFC's
operating costs have come down sharply too (Figure 36).
A sharp drop in credit assessment costs has helped too—earlier manual evaluations of
creditworthiness that could cost several hundred rupees would have been 1 pp or more of
the loan issued (say a consumer durable loan of Rs25,000); but loan viability assessment
through databases like CIBIL or MFIN brings costs down to a fraction, and smaller ticket-
size loans can be disbursed as well.
Figure 43: NBFC AUMs growth stays steady Figure 44: Growth in durables has been steady
Source: Company Data, Credit Suisse estimates Source: Company Data, Credit Suisse estimates
While the ability to break a large purchase into smaller monthly payments may have
improved the affordability of durables, such a trend is not yet visible (Figure 44)—the
growth in durables has been steady even as the share of sales financed by Bajaj Finance
(which dominates the durables financing market) has risen sharply.
Cheaper factors of production to help, but slowly
All three factors of production, i.e. land, labour and capital have historically been very
costly in India. A fourth, enterprise formation, has been impeded by excessive regulation.
Not only has this hurt India's export competitiveness, necessitating several government
interventions (like allowing global financing for export oriented units to bring down cost of
capital); it has slowed improvements in production efficiency that could have brought down
costs, and hence, improved penetration of various products and also substituted imports.
Capital: Falling inflation, rising financial savings, falling repression
However, changes are afoot—with inflation below 3% in April 2017, we have now had six
consecutive months of sub-4% inflation; the last time this happened was in 2002 (Figure
45), and only the third time since 1980. Unlike the episodes before 1980, this appears
sustainable. While the RBI has been reluctant to project the current low inflation levels
going forward, apprehending price increases driven by GST and the pay commission's
recommendations, sustenance of such trends would mean lower interest rates.
0%
5%
10%
15%
20%
25%
2012 2013 2014 2015 2016 2017
NBFC AUM Growth YoY0%
10%
20%
30%
40%
50%
60%
CY13 CY14 CY15 CY16
Indian cons. durables sales growth
Bajaj cons. durables segmentgrowth
18 May 2017
India Market Strategy 16
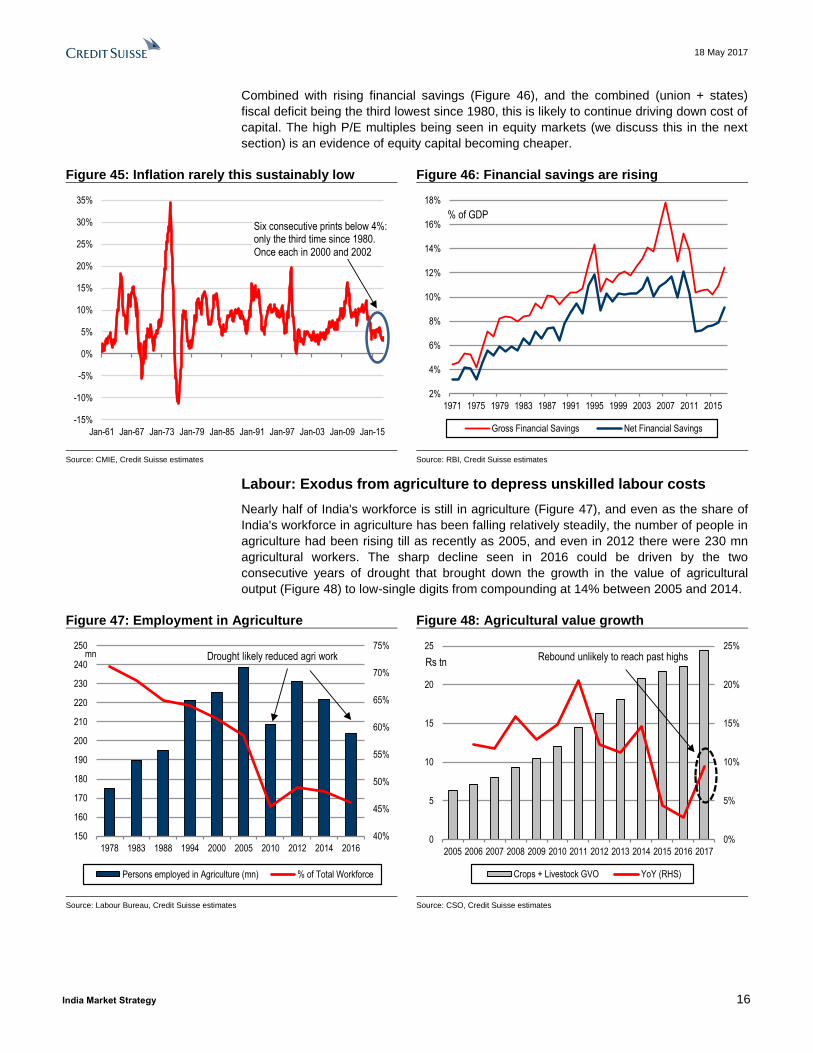
Combined with rising financial savings (Figure 46), and the combined (union + states)
fiscal deficit being the third lowest since 1980, this is likely to continue driving down cost of
capital. The high P/E multiples being seen in equity markets (we discuss this in the next
section) is an evidence of equity capital becoming cheaper.
Figure 45: Inflation rarely this sustainably low Figure 46: Financial savings are rising
Source: CMIE, Credit Suisse estimates Source: RBI, Credit Suisse estimates
Labour: Exodus from agriculture to depress unskilled labour costs
Nearly half of India's workforce is still in agriculture (Figure 47), and even as the share of
India's workforce in agriculture has been falling relatively steadily, the number of people in
agriculture had been rising till as recently as 2005, and even in 2012 there were 230 mn
agricultural workers. The sharp decline seen in 2016 could be driven by the two
consecutive years of drought that brought down the growth in the value of agricultural
output (Figure 48) to low-single digits from compounding at 14% between 2005 and 2014.
Figure 47: Employment in Agriculture Figure 48: Agricultural value growth
Source: Labour Bureau, Credit Suisse estimates Source: CSO, Credit Suisse estimates
-15%
-10%
-5%
0%
5%
10%
15%
20%
25%
30%
35%
Jan-61 Jan-67 Jan-73 Jan-79 Jan-85 Jan-91 Jan-97 Jan-03 Jan-09 Jan-15
Six consecutive prints below 4%: only the third time since 1980. Once each in 2000 and 2002
2%
4%
6%
8%
10%
12%
14%
16%
18%
1971 1975 1979 1983 1987 1991 1995 1999 2003 2007 2011 2015
Gross Financial Savings Net Financial Savings
% of GDP
40%
45%
50%
55%
60%
65%
70%
75%
150
160
170
180
190
200
210
220
230
240
250
1978 1983 1988 1994 2000 2005 2010 2012 2014 2016
Persons employed in Agriculture (mn) % of Total Workforce
Drought likely reduced agri workmn
0%
5%
10%
15%
20%
25%
0
5
10
15
20
25
2005 2006 2007 2008 2009 2010 2011 2012 2013 2014 2015 2016 2017
Crops + Livestock GVO YoY (RHS)
Rs tnRebound unlikely to reach past highs

18 May 2017
India Market Strategy 17
Normal rainfall last year increased the sown area, and likely created more agricultural
jobs. However, as growing output met slowing demand (please refer to our reports
Agriculture: The Problem is Plenty, and "Interest"ing Times for details on this theme),
prices declined. This has been the root cause of slowing inflation, and has also resulted in
continuing agricultural distress despite the good monsoons. With monsoons now projected
to be normal in 2017 as well, this trend may persist. Thus, the minor pick-up in rural wage
growth that we have seen over the past few months (Figure 49) may not sustain, as
farmers adjust their costs of production to the changing realities of agriculture. This may
benefit construction companies who keep their costs low.
Figure 49: Rural wage growth Figure 50: India has very low rental yields
Source: Labour Bureau, Credit Suisse estimates Source: Global Property Guide, Credit Suisse estimates
Land: Weaker agri income, black money clampdown to make it cheaper
High land costs inflate project expenses—in real-estate, they show up in the lowest rental
yields in the world despite a high-interest environment (Figure 50). As most farmers
deployed their excess savings in hard assets (silver, gold, land), slowing agricultural
income growth brings down demand for land. The clampdown on black money is likely to
further hurt land demand as it was one of the preferred mechanisms to hide black money.
While all these factors becoming cheaper is very positive over the medium term, all of this
is great over the medium term, but will take time.
-10%
-5%
0%
5%
10%
15%
20%
25%
30%
Jan-03 Aug-04 Mar-06 Oct-07 May-09 Dec-10 Jul-12 Feb-14 Sep-15
Nominal Wage Growth Real Wage Growth
Rural Agri Wage Growth
0% 2% 4% 6% 8% 10%
India
China
UK
Russia
Germany
Japan
South Africa
USA
Australia
Malaysia
Brazil
Mexico
Philippines
Indonesia
Gross Rental Yields

18 May 2017
India Market Strategy 18
Enablers improve; distribution growth may continue
Figure 51: Electrification of households improving Figure 52: Power availability/quality improving too
Source: Census 2011, Credit Suisse estimates Source: Prayas, Credit Suisse estimates
As we have been highlighting over the past five years, there has been a substantial
improvement in household electrification in the recent years (Figure 51), and this trend
continues. As political priorities shift, the quality of electricity available has improved as
well (Figure 52). Night-time satellite pictures of India published by NASA show a
substantial improvement in the last five years (Figure 53).
Figure 53: Evidence of a substantial improvement in electrification and availability—night-time pictures
Source: NASA, ESRI, Credit Suisse
44%55%
75%
88%93%
99%
56%67%
83%
0%
20%
40%
60%
80%
100%
2001 2011 2017
Rural Urban India
% Households Electrified
0
2
4
6
AP BI GA KN MH MP UP HR
State Capital District HeadquartersOther Municipal Area Gram Panchayat(hrs)
Availability of power supply in 6 hours

18 May 2017
India Market Strategy 19
In addition to the impact on GDP and productivity, this creates opportunity to sell
consumer appliances. Further, the improvement in TV and cable/DTH penetration (Figure
54) that this engenders help brands reach new areas. Improving rural road connectivity
(Figure 55) helps extend supply chains. Thus, distribution should continue to improve.
These trends, however, are only slightly more rapid than the demographic changes.
Figure 54: TV/DTH allow for brand-building Figure 55: Rural roads penetration up sharply
Source: Company Data, Credit Suisse estimates Source: PMGSY, Credit Suisse estimates
25%
30%
35%
40%
45%
50%
55%
60%
65%
100
110
120
130
140
150
160
170
180
2007 2008 2009 2010 2011 2012 2013 2014 2015 2016
Total no. of TV households (mn) C&S penetration (%, RHS)
0
25
50
75
100
125
150
0
100
200
300
400
500
600
700
Mar-02 Mar-04 Mar-06 Mar-08 Mar-10 Mar-12 Mar-14 Mar-16 Mar-18
Roads Completed, Cum. ('000 km) Habitations, Cum ('000, RHS)

18 May 2017
India Market Strategy 20
Market pricing in a tide: There may be none
Growth has slowed sharply in the last few years
As discussed in the first section, 22-23% of companies in the BSE500 have managed to
grow faster than 2x nominal GDP in the last ten years. This mostly has private sector
banks and some NBFCs among the larger market capitalisation set (Figure 26). In recent
years, however, growth has slowed meaningfully, with only 9% of the companies (Figure
56), adding up to 7% of market capitalisation (Figure 57) showing 25% growth in FY16.
Figure 56: BSE500 split by revenue growth (No.) Figure 57: BSE500 split by revenue growth (MCap)
Source: Capitaline, Credit Suisse estimates Source: Capitaline, Credit Suisse estimates
When P/E multiples have risen across the board
On the other hand, all this while P/E multiples have been going up (Figure 58).
Figure 58: BSE500 P/E has risen sharply Figure 59: P/E multiples have risen across the board
Source: Bloomberg, Credit Suisse estimates Source: Capitaline, RAVE, Credit Suisse estimates
Whereas five years back only 6% of companies (232 of the BSE500 that have forward
earnings available) had P/E greater than 30x, now nearly a fourth of companies fall in that
bracket (Figure 59), and 44% of them have P/E greater than 20x.
0%
10%
20%
30%
40%
50%
60%
70%
80%
90%
100%
10Y 5Y 3Y 1Y
Decline 0-15% 15-25% 25%+
0%
10%
20%
30%
40%
50%
60%
70%
80%
90%
100%
10Y 5Y 3Y 1Y
Decline 0-15% 15-25% 25%+
7x
12x
17x
22x
27x
Jul-05 Oct-06 Jan-08 Apr-09 Jul-10 Oct-11 Jan-13 Apr-14 Jul-15 Oct-16
Trailing 12 Months P/E 12 Month Forward P/E
BSE500 P/E
42%33%
25%15%
25%
23%
23%
22%
14%
19%
18%
19%
8%11%
14%
12%
5%4%
4%
8%
6% 10%16%
24%
0%
10%
20%
30%
40%
50%
60%
70%
80%
90%
100%
5Y 3Y 1Y Now
< 10 10-15 15-20 20-25 25-30 > 30

18 May 2017
India Market Strategy 21
Re-rating strongest in Market-share and Macro
As one would expect, the Penetration and Market Share categories have the highest P/E
(Figure 60), and have re-rated sharply since 2012. Global P/E has seen the least
movement. Till last year the P/E for Macro was lower than in 2011, but since then has
rallied sharply, partly due to a rebound in PSU Banks, but also as government ordering
has boosted construction order books, and reduction in interest rates has helped earnings.
Figure 60: Over five years all of Penetration, Market Share and Macro have seen P/E re-rating
Source: RAVE, Credit Suisse estimates
The P/E premium of Penetration category continues to be elevated, but is meaningfully
lower than in 2013 (Figure 61). However, that of Market Share and Macro is now
approaching its peak. The discount for Global continues to increase, as the category does
not seem to be participating in the broader market rally.
Figure 61: P/E premium to overall market by category
Source: RAVE, Credit Suisse estimates
5
10
15
20
25
30
1-Jan-11 1-Jun-11 1-Nov-11 1-Apr-12 1-Sep-12 1-Feb-13 1-Jul-13 1-Dec-13 1-May-14 1-Oct-14 1-Mar-15 1-Aug-15 1-Jan-16 1-Jun-16 1-Nov-16 1-Apr-17
Penetration Market Share Macro Global Total12MF PE
-60%
-40%
-20%
0%
20%
40%
60%
80%
1-Jan-11 1-Jun-11 1-Nov-11 1-Apr-12 1-Sep-12 1-Feb-13 1-Jul-13 1-Dec-13 1-May-14 1-Oct-14 1-Mar-15 1-Aug-15 1-Jan-16 1-Jun-16 1-Nov-16 1-Apr-17
Penetration Market Share Macro Global12MF PE

18 May 2017
India Market Strategy 22
Global factors have also contributed to re-rating
Much of the increase in P/E multiples in India appears to be driven by global factors
(Figure 62), with premiums of most sector indices of MSCI India over those of MSCI World
remaining broadly unchanged over the past five years. The increase in Telecom is likely
driven by the sharp earnings cuts and the drop in the Indian IT premium (to a discount
now) is due to market concerns with medium-term growth and the US trade restrictions (a
view we disagree with). The growth in P/E multiples and the continuing premium for most
sectors also presumes a growth acceleration in the coming years.
Figure 62: Sector-wise P/E premium of MSCI India sector indices to MSCI World indices
Source: Bloomberg, Credit Suisse estimates
In the last two decades India has indeed seen a proliferation of companies with US$1 bn
or more in sales (Figure 63), with 184 companies reporting sales higher than that
threshold in FY16. The number of companies with US$1 bn or more in market
capitalisation has also continued to rise, with the number now at 282 (Figure 64).
Figure 63: # of listed companies with US$1 bn sales Figure 64: # of companies with US$1 bn MCap
Source: The BLOOMBERG PROFESSIONAL™ service, Credit Suisse estimates Source: The BLOOMBERG PROFESSIONAL™ service, Credit Suisse estimates
-60%
-40%
-20%
0%
20%
40%
60%
80%
Total Discretionary Staples Energy Financials Healthcare Industrials IT Materials Telecom Utilities
5Y 3Y 1Y Now
MSCI India's Premium to MSCI World 304%
0 0
37
122
180 184
0
50
100
150
200
250
300
1995 2000 2005 2010 2015 Now
No. of companies with >=$1bn Sales
1526
91
210223
282
0
50
100
150
200
250
300
1995 2000 2005 2010 2015 Now
No. of companies with >=$1bn Market Cap.

18 May 2017
India Market Strategy 23
Extraordinary growth only in a few sectors
While the increase in P/E multiples, and therefore, implied growth expectations has been
broad-based within the Penetration category (Figure 65), growth going forward may not be
as indiscriminate. As discussed in the previous section, improving penetration
meaningfully in a short period of time requires innovation or a substantial improvement in
the enabling environment.
We believe that these are only available in banking, some NBFCs, and in consumer
appliances, driven by the rapid improvement in electrification and quality of electricity. For
most of Staples, that forms the largest component of the Penetration category (Figure 66),
such growth is unlikely, except in pockets (e.g., sachets even for premium shampoos, or
the innovations in insecticides and room fresheners introduced by Godrej Consumer). We
believe that the government slowing down on increasing taxes for cigarettes can drive
more balanced volume vs price growth for ITC.
Figure 65: P/E by sector for Penetration category Figure 66: Split of Penetration category by sector
Source: RAVE, Credit Suisse estimates Source: RAVE, Credit Suisse estimates
Recommended Trades
In the Penetration category, we suggest ten trade ideas based on our analysis and the
theme developed in this report (Figure 67).
Recommended Overweight: ITC, Jubilant, Chola Finance, GCPL, Havells, Crompton,
Bharti Infratel
Recommended Underweight: Nestle, Colgate, TVS Motors.
0x 5x 10x 15x 20x 25x 30x 35x
Utilities
Real Estate
IT
Pharma
Industrials
Autos
NBFC
Chemicals
Cons. Disc.
Staples
Now 3Y
12MF P/E for Penetration category
Staples21%
NBFC20%
Autos17%
Health15%
Discretionary15%
Chemicals5%
Utilities2%
IT2%
Industrials1%
Telecom2%

18 M
ay 2
017
Ind
ia M
ark
et S
trate
gy
2
4
Financial Summary
Figure 67: Stock ideas
Company RIC Rating Mkt Cap
($ bn)
Comments
Recommended Overweight stocks
ITC Ltd ITC.BO OUTPERFORM 53 1. Government moving to a rational tax regime, three consecutive declines in excise hikes on cigarettes, FY18 saw just a 6% hike.
2. This should give ITC more flexibility in the volume vs. price balance, and retain bigger share of market (earlier government took much of the increase).
3. We expect ITC to return to ~15% earnings growth with a ~5% volume growth in cigarettes in in FY18. It is also the cheapest consumer staples name in our coverage.
Bharti Infratel Ltd BHRI.BO OUTPERFORM 11 1. As data prices drop sharply, volumes are likely to surge driving an increased need for towers along with incremental business from Jio.
2. Downside from Idea-Vodafone merger would at most be loss of half a year’s growth. Long term tenancy growth story is beginning to look better with a
higher benchmark being set by the Idea+Vodafone in terms of network size.
3. Path to ‘independent’ ownership is now visible.
Godrej Consumer
Products Ltd
GOCP.BO OUTPERFORM 9 1. Product innovation pace has accelerated over the last five years especially in home insecticides, e.g. the Re1 mosquito repellant and cheap air fresheners.
2. India business saw a very strong recovery in 4Q post demonetisation. Margins went up without cutting ad spends. Has high pricing power in its portfolio except soaps.
3. Worst of the currency headwinds in the international business seem behind. Company also increased div. payout to 45% from 20%.
Cholamandalam Finance CHLA.BO OUTPERFORM 3 1. Using technology creatively to not just improve operating efficiency but also to increase credit quality.
2. We see room for NIM expansion with delayed funding cost benefit and operating leverage as growth comes back in Vehicle finance.
3. It has maintained portfolio quality in its vehicle finance book albeit incurring higher operating cost. This could drive ROE expansion. At current valuations,
Chola trades at 2.6XFY19E P/B and 12.8XFY19E P/E.
Crompton Greaves
Consumer Electrical Ltd
CROP.BO OUTPERFORM 2 1. Key beneficiary of rising electrification and improving power availability through its appliances business. Making a big push in premium fans (40-50%
growth) and revamping distribution to become FMCG like.
2. Has historically been a strong franchise but now getting requisite investments. The new management at the help has rich consumer experience (P&G, Pidilite).
3. We think margins will gradually move up due to premiumisation and cost savings, results already evident.
Jubilant Foodworks JUBI.BO OUTPERFORM 1 1. Company reviving price competitiveness: lower priced items have been introduced and price hikes have ben near zero since Dec 2015. Important for volume growth.
2. Business has a very high operating leverage and thus earnings can accelerate with steady SSSG improvement.
3. Separately, they have taken several strategic decisions recently to focus on improving profitability of existing stores and moderating expansion plans.
Havells India Ltd HVEL.BO NEUTRAL 5 1. Key beneficiary of rising electrification and improving power availability through its appliances business. Also a direct play on overall economic growth
(switch gears and cable business).
2. Havells management has built strong brand equity over the years with consistent marketing spends and has the strongest pan India in domestic electricals.
3. Management is seeing some greenshoots in its core switchgear and expects double digit growth in FY18.
Recommended Underweight stocks
Nestle India NEST.BO UNDERPERFORM 10 1. The focus on margins in the last few years has meant very poor quality growth. Recent pickup in investment behind ad spends may show up with a lag.
2. Nestle has been able to get back only a 60% market share for Maggi versus the 70% before the ban.
3. P/E multiples are too high versus what we think are achievable growth rates in the coming years.
TVS Motors TVSM.BO UNDERPERFORM 4 1. As our analysis shows, supernormal growth in 2W industry revenues could be challenging.
2. TVS intends to expand market share and also expand margins through cost optimization and better product mix but we foresee challenges as competitive
intensity in 2W industry remain high.
3. Valuations are expensive even after building reasonable growth in volumes and expansion in operating margins.
Colgate-Palmolive India COLG.BO NEUTRAL 4 1. Toothpastes are a well penetrated category, and growth can only now come through premiumization.
2. But Colgate is losing share of premium products to Patanjali and Dabur’s herbal variants. It lost an alarming 200bps worth of market share in CY16.
3. For effectively a single product company, this is a big risk. P/E multiples are too high versus what we think are achievable growth rates in the coming years.
Source: Company data, Credit Suisse estimates

18 May 2017
India Market Strategy 25
Companies Mentioned (Price as of 18-May-2017) Bajaj Finance Ltd (BJFN.BO, Rs1322.8) Bharti Infratel Ltd (BHRI.BO, Rs390.2) Cholamandalam Finance (CHLA.BO, Rs1042.05) Colgate-Palmolive India (COLG.BO, Rs977.3) Crompton Greaves Consumer Electrical Limited (CROP.BO, Rs241.65) Godrej Consumer Products Ltd (GOCP.BO, Rs1857.95) Havells India Ltd (HVEL.BO, Rs508.8) Housing Development Finance Corp (HDFC.BO, Rs1552.65) ITC Ltd (ITC.BO, Rs281.85) Jubilant Foodworks (JUBI.BO, Rs1049.45) Nestle India (NEST.BO, Rs6554.65) TVS Motors (TVSM.BO, Rs532.75)
Disclosure Appendix
Analyst Certification Neelkanth Mishra, Prateek Singh and Ravi Shankar each certify, with respect to the companies or securities that the individual analyzes, that (1) the views expressed in this report accurately reflect his or her personal views about all of the subject companies and securities and (2) no part of his or her compensation was, is or will be directly or indirectly related to the specific recommendations or views expressed in this report. The analyst(s) responsible for preparing this research report received Compensation that is based upon various factors including Credit Suisse's total revenues, a portion of which are generated by Credit Suisse's investment banking activities
As of December 10, 2012 Analysts’ stock rating are defined as follows: Outperform (O) : The stock’s total return is expected to outperform the relevant benchmark* over the next 12 months. Neutral (N) : The stock’s total return is expected to be in line with the relevant benchmark* over the next 12 months. Underperform (U) : The stock’s total return is expected to underperform the relevant benchmark* over the next 12 months. *Relevant benchmark by region: As of 10th December 2012, Japanese ratings are based on a stock’s total return relative to the analyst's coverage universe which consists of all companies covered by the analyst within the relevant sector, with Outperforms representing the most attractive, Neutrals the less attractive, and Underperforms the least attractive investment opportunities. As of 2nd October 2012, U.S. and Canadian as well as European ratings are based on a stock’s total return relative to the analyst's coverage universe which consists of all companies covered by the analyst within the relevant sector, with Outperforms representing the most attractive, Neutrals the less attractive, and Underperforms the least attractive investment opportunities. For Latin American and non -Japan Asia stocks, ratings are based on a stock’s total return relative to the average total return of the relevant country or regional benchmark; prior to 2nd October 2012 U.S. and Canadian ratings were based on (1) a stock’s absolute total return potential to its current share price and (2) the relative attractiv eness of a stock’s total return potential within an analyst’s coverage universe. For Australian and New Zealand stocks, the expected total return (ETR) calculation includes 12 -month rolling dividend yield. An Outperform rating is assigned where an ETR is greater than or equal to 7.5%; Underperform where an ETR less than or equal to 5%. A Neutral may be assigned where the ETR is between -5% and 15%. The overlapping rating range allows analysts to assign a rating that puts ETR in the context of associated risks. Prior to 18 May 2015, ETR ranges for Outperform and Underperform ratings did not overlap wi th Neutral thresholds between 15% and 7.5%, which was in operation from 7 July 2011. Restricted (R) : In certain circumstances, Credit Suisse policy and/or applicable law and regulations preclude certain types of communications, including an investment recommendation, during the course of Credit Suisse's engagement in an investment banking transaction and in certain other circumstances. Not Rated (NR) : Credit Suisse Equity Research does not have an investment rating or view on the stock or any other securities related to the company at this time. Not Covered (NC) : Credit Suisse Equity Research does not provide ongoing coverage of the company or offer an investment rating or investment view on the equity security of the company or related products.
Volatility Indicator [V] : A stock is defined as volatile if the stock price has moved up or down by 20% or more in a month in at least 8 of the past 24 months or the analyst expects significant volatility going forward.
Analysts’ sector weightings are distinct from analysts’ stock ratings and are based on the analyst’s expectations for the fundamentals and/or valuation of the sector* relative to the group’s historic fundamentals and/or valuation: Overweight : The analyst’s expectation for the sector’s fundamentals and/or valuation is favorable over the next 12 months. Market Weight : The analyst’s expectation for the sector’s fundamentals and/or valuation is neutral over the next 12 months. Underweight : The analyst’s expectation for the sector’s fundamentals and/or valuation is cautious over the next 12 months. *An analyst’s coverage sector consists of all companies covered by the analyst within the relevant sector. An analyst may cover multiple sectors.
Credit Suisse's distribution of stock ratings (and banking clients) is:
Global Ratings Distribution
Rating Versus universe (%) Of which banking clients (%) Outperform/Buy* 44% (64% banking clients) Neutral/Hold* 39% (61% banking clients) Underperform/Sell* 14% (54% banking clients) Restricted 2% *For purposes of the NYSE and FINRA ratings distribution disclosure requirements, our stock ratings of Outperform, Neutral, and Un derperform most closely correspond to Buy, Hold, and Sell, respectively; however, the meanings are not the same, as our stock ratings are determined on a relative basis. (Please refer to definitions above.) An investor's decision to buy or sell a security should be based on investment objectives, current holdin gs, and other individual factors.
Important Global Disclosures Credit Suisse’s research reports are made available to clients through our proprietary research portal on CS PLUS. Credit Suisse research products may also be made available through third-party vendors or alternate electronic means as a convenience. Certain research products are only made available through CS PLUS. The services provided by Credit Suisse’s analysts to clients may depend on a specific client’s preferences regarding the

18 May 2017
India Market Strategy 26
frequency and manner of receiving communications, the client’s risk profile and investment, the size and scope of the overall client relationship with the Firm, as well as legal and regulatory constraints. To access all of Credit Suisse’s research that you are entitled to receive in the most timely manner, please contact your sales representative or go to https://plus.credit-suisse.com . Credit Suisse’s policy is to update research reports as it deems appropriate, based on developments with the subject company, the sector or the market that may have a material impact on the research views or opinions stated herein. Credit Suisse's policy is only to publish investment research that is impartial, independent, clear, fair and not misleading. For more detail please refer to Credit Suisse's Policies for Managing Conflicts of Interest in connection with Investment Research: https://www.credit-suisse.com/sites/disclaimers-ib/en/managing-conflicts.html . Credit Suisse does not provide any tax advice. Any statement herein regarding any US federal tax is not intended or written to be used, and cannot be used, by any taxpayer for the purposes of avoiding any penalties. This material is intended for your use only and not for general distribution. This material is not intended to promote or procure a particular outcome in the UK General Election (the "Election"). Credit Suisse does not promote or endorse any party in the Election. This material does not constitute, and should not be interpreted as, a recommendation by Credit Suisse as to the merits of a particular outcome of the Election. See the Companies Mentioned section for full company names The subject company (JUBI.BO, ITC.BO, CROP.BO, BHRI.BO, NEST.BO, BJFN.BO, HDFC.BO) currently is, or was during the 12-month period preceding the date of distribution of this report, a client of Credit Suisse. Credit Suisse provided investment banking services to the subject company (JUBI.BO, CROP.BO, NEST.BO, HDFC.BO) within the past 12 months. Credit Suisse provided non-investment banking services to the subject company (JUBI.BO, ITC.BO, NEST.BO, BJFN.BO, HDFC.BO) within the past 12 months Credit Suisse has managed or co-managed a public offering of securities for the subject company (NEST.BO, HDFC.BO) within the past 12 months. Credit Suisse has received investment banking related compensation from the subject company (JUBI.BO, CROP.BO, NEST.BO, HDFC.BO) within the past 12 months Credit Suisse expects to receive or intends to seek investment banking related compensation from the subject company (CHLA.BO, JUBI.BO, CROP.BO, BHRI.BO, NEST.BO, COLG.BO, BJFN.BO, HDFC.BO) within the next 3 months. Credit Suisse has received compensation for products and services other than investment banking services from the subject company (JUBI.BO, ITC.BO, NEST.BO, BJFN.BO, HDFC.BO) within the past 12 months A member of the Credit Suisse Group is party to an agreement with, or may have provided services set out in sections A and B of Annex I of Directive 2014/65/EU of the European Parliament and Council ("MiFID Services") to, the subject issuer (HVEL.BO, JUBI.BO, GOCP.BO, CROP.BO, BHRI.BO, TVSM.BO, NEST.BO, COLG.BO, BJFN.BO, HDFC.BO) within the past 12 months. Please visit https://credit-suisse.com/in/researchdisclosure for additional disclosures mandated vide Securities And Exchange Board of India (Research Analysts) Regulations, 2014 Credit Suisse may have interest in (HVEL.BO, CHLA.BO, JUBI.BO, GOCP.BO, ITC.BO, CROP.BO, BHRI.BO, TVSM.BO, NEST.BO, COLG.BO, BJFN.BO, HDFC.BO) As of the end of the preceding month, Credit Suisse beneficially own 1% or more of a class of common equity securities of (JUBI.BO). Credit Suisse beneficially holds >0.5% long position of the total issued share capital of the subject company (JUBI.BO).
For other important disclosures concerning companies featured in this report, including price charts, please visit the website at https://rave.credit-suisse.com/disclosures or call +1 (877) 291-2683. For date and time of production, dissemination and history of recommendation for the subject company(ies) featured in this report, disseminated within the past 12 months, please refer to the link: https://rave.credit-suisse.com/disclosures/view/report?i=301798&v=-qaxnpgu4s8mvt2ln18cwmgkh .
Important Regional Disclosures Singapore recipients should contact Credit Suisse AG, Singapore Branch for any matters arising from this research report. The analyst(s) involved in the preparation of this report may participate in events hosted by the subject company, including site visits. Credit Suisse does not accept or permit analysts to accept payment or reimbursement for travel expenses associated with these events. Restrictions on certain Canadian securities are indicated by the following abbreviations: NVS--Non-Voting shares; RVS--Restricted Voting Shares; SVS--Subordinate Voting Shares. Individuals receiving this report from a Canadian investment dealer that is not affiliated with Credit Suisse should be advised that this report may not contain regulatory disclosures the non-affiliated Canadian investment dealer would be required to make if this were its own report. For Credit Suisse Securities (Canada), Inc.'s policies and procedures regarding the dissemination of equity research, please visit https://www.credit-suisse.com/sites/disclaimers-ib/en/canada-research-policy.html. Credit Suisse has acted as lead manager or syndicate member in a public offering of securities for the subject company (NEST.BO, HDFC.BO) within the past 3 years. Principal is not guaranteed in the case of equities because equity prices are variable. Commission is the commission rate or the amount agreed with a customer when setting up an account or at any time after that. This research report is authored by: Credit Suisse Securities (India) Private Limited ......................................................................... Neelkanth Mishra ; Prateek Singh ; Ravi Shankar To the extent this is a report authored in whole or in part by a non-U.S. analyst and is made available in the U.S., the following are important disclosures regarding any non-U.S. analyst contributors: The non-U.S. research analysts listed below (if any) are not registered/qualified as research analysts with FINRA. The non-U.S. research analysts listed below may not be associated persons of CSSU and therefore may not be subject to the FINRA 2241 and NYSE Rule 472 restrictions on communications with a subject company, public appearances and trading securities held by a research analyst account. Credit Suisse Securities (India) Private Limited ......................................................................... Neelkanth Mishra ; Prateek Singh ; Ravi Shankar

18 May 2017
India Market Strategy 27
Important disclosures regarding companies or other issuers that are the subject of this report are available on Credit Suisse’s disclosure website at https://rave.credit-suisse.com/disclosures or by calling +1 (877) 291-2683.

18 May 2017
India Market Strategy 28
This report is produced by subsidiaries and affiliates of Credit Suisse operating under its Global Markets Division. For more information on our structure, please use the following link: https://www.credit-suisse.com/who-we-are This report may contain material that is not directed to, or intended for distribution to or use by, any person or entity who is a citizen or resident of or located in any locality, state, country or other jurisdiction where such distribution, publication, availability or use would be contrary to law or regulation or which would subject Credit Suisse or its affiliates ("CS") to any registration or licensing requirement within such jurisdiction. All material presented in this report, unless specifically indicated otherwise, is under copyright to CS. None of the material, nor its content, nor any copy of it, may be altered in any way, transmitted to, copied or distributed to any other party, without the prior express written permission of CS. All trademarks, service marks and logos used in this report are trademarks or service marks or registered trademarks or service marks of CS or its affiliates.The information, tools and material presented in this report are provided to you for information purposes only and are not to be used or considered as an offer or the solicitation of an offer to sell or to buy or subscribe for securities or other financial instruments. CS may not have taken any steps to ensure that the securities referred to in this report are suitable for any particular investor. CS will not treat recipients of this report as its customers by virtue of their receiving this report. The investments and services contained or referred to in this report may not be suitable for you and it is recommended that you consult an independent investment advisor if you are in doubt about such investments or investment services. Nothing in this report constitutes investment, legal, accounting or tax advice, or a representation that any investment or strategy is suitable or appropriate to your individual circumstances, or otherwise constitutes a personal recommendation to you. CS does not advise on the tax consequences of investments and you are advised to contact an independent tax adviser. Please note in particular that the bases and levels of taxation may change. Information and opinions presented in this report have been obtained or derived from sources believed by CS to be reliable, but CS makes no representation as to their accuracy or completeness. CS accepts no liability for loss arising from the use of the material presented in this report, except that this exclusion of liability does not apply to the extent that such liability arises under specific statutes or regulations applicable to CS. This report is not to be relied upon in substitution for the exercise of independent judgment. CS may have issued, and may in the future issue, other communications that are inconsistent with, and reach different conclusions from, the information presented in this report. Those communications reflect the different assumptions, views and analytical methods of the analysts who prepared them and CS is under no obligation to ensure that such other communications are brought to the attention of any recipient of this report. Some investments referred to in this report will be offered solely by a single entity and in the case of some investments solely by CS, or an associate of CS or CS may be the only market maker in such investments. Past performance should not be taken as an indication or guarantee of future performance, and no representation or warranty, express or implied, is made regarding future performance. Information, opinions and estimates contained in this report reflect a judgment at its original date of publication by CS and are subject to change without notice. The price, value of and income from any of the securities or financial instruments mentioned in this report can fall as well as rise. The value of securities and financial instruments is subject to exchange rate fluctuation that may have a positive or adverse effect on the price or income of such securities or financial instruments. Investors in securities such as ADR's, the values of which are influenced by currency volatility, effectively assume this risk. Structured securities are complex instruments, typically involve a high degree of risk and are intended for sale only to sophisticated investors who are capable of understanding and assuming the risks involved. The market value of any structured security may be affected by changes in economic, financial and political factors (including, but not limited to, spot and forward interest and exchange rates), time to maturity, market conditions and volatility, and the credit quality of any issuer or reference issuer. Any investor interested in purchasing a structured product should conduct their own investigation and analysis of the product and consult with their own professional advisers as to the risks involved in making such a purchase. Some investments discussed in this report may have a high level of volatility. High volatility investments may experience sudden and large falls in their value causing losses when that investment is realised. Those losses may equal your original investment. Indeed, in the case of some investments the potential losses may exceed the amount of initial investment and, in such circumstances, you may be required to pay more money to support those losses. Income yields from investments may fluctuate and, in consequence, initial capital paid to make the investment may be used as part of that income yield. Some investments may not be readily realisable and it may be difficult to sell or realise those investments, similarly it may prove difficult for you to obtain reliable information about the value, or risks, to which such an investment is exposed. This report may provide the addresses of, or contain hyperlinks to, websites. Except to the extent to which the report refers to website material of CS, CS has not reviewed any such site and takes no responsibility for the content contained therein. Such address or hyperlink (including addresses or hyperlinks to CS's own website material) is provided solely for your convenience and information and the content of any such website does not in any way form part of this document. Accessing such website or following such link through this report or CS's website shall be at your own risk.
This report is issued and distributed in European Union (except Switzerland): by Credit Suisse Securities (Europe) Limited, One Cabot Square, London E14 4QJ, England, which is authorised by the Prudential Regulation Authority and regulated by the Financial Conduct Authority and the Prudential Regulation Authority. Germany: Credit Suisse Securities (Europe) Limited Niederlassung Frankfurt am Main regulated by the Bundesanstalt fuer Finanzdienstleistungsaufsicht ("BaFin"). United States and Canada: Credit Suisse Securities (USA) LLC; Switzerland: Credit Suisse AG; Brazil: Banco de Investimentos Credit Suisse (Brasil) S.A or its affiliates; Mexico: Banco Credit Suisse (México), S.A. (transactions related to the securities mentioned in this report will only be effected in compliance with applicable regulation); Japan: by Credit Suisse Securities (Japan) Limited, Financial Instruments Firm, Director-General of Kanto Local Finance Bureau ( Kinsho) No. 66, a member of Japan Securities Dealers Association, The Financial Futures Association of Japan, Japan Investment Advisers Association, Type II Financial Instruments Firms Association; Hong Kong: Credit Suisse (Hong Kong) Limited; Australia: Credit Suisse Equities (Australia) Limited; Thailand: Credit Suisse Securities (Thailand) Limited, regulated by the Office of the Securities and Exchange Commission, Thailand, having registered address at 990 Abdulrahim Place, 27th Floor, Unit 2701, Rama IV Road, Silom, Bangrak, Bangkok10500, Thailand, Tel. +66 2614 6000; Malaysia: Credit Suisse Securities (Malaysia) Sdn Bhd; Singapore: Credit Suisse AG, Singapore Branch; India: Credit Suisse Securities (India) Private Limited (CIN no.U67120MH1996PTC104392) regulated by the Securities and Exchange Board of India as Research Analyst (registration no. INH 000001030) and as Stock Broker (registration no. INB230970637; INF230970637; INB010970631; INF010970631), having registered address at 9th Floor, Ceejay House, Dr.A.B. Road, Worli, Mumbai - 18, India, T- +91-22 6777 3777; South Korea: Credit Suisse Securities (Europe) Limited,
Seoul Branch; Taiwan: Credit Suisse AG Taipei Securities Branch; Indonesia: PT Credit Suisse Securities Indonesia; Philippines:Credit Suisse Securities (Philippines ) Inc., and elsewhere in the world by the relevant authorised affiliate of the above. Additional Regional Disclaimers Hong Kong: Credit Suisse (Hong Kong) Limited ("CSHK") is licensed and regulated by the Securities and Futures Commission of Hong Kong under the laws of Hong Kong, which differ from Australian laws. CSHKL does not hold an Australian financial services licence (AFSL) and is exempt from the requirement to hold an AFSL under the Corporations Act 2001 (the Act) under Class Order 03/1103 published by the ASIC in respect of financial services provided to Australian wholesale clients (within the meaning of section 761G of the Act). Research on Taiwanese securities produced by Credit Suisse AG, Taipei Securities Branch has been prepared by a registered Senior Business Person. Australia (to the extent services are offered in Australia): Credit Suisse Securities (Europe) Limited (“CSSEL”) and Credit Suisse International (“CSI”) are authorised by the Prudential Regulation Authority and regulated by the Financial Conduct Authority (“FCA”) and the Prudential Regulation Authority under UK laws, which differ from Australian Laws. CSSEL and CSI do not hold an Australian Financial Services Licence (“AFSL”) and are exempt from the requirement to hold an AFSL under the Corporations Act (Cth) 2001 (“Corporations Act”) under Class Order 03/1099 published by the Australian Securities and Investments Commission (“ASIC”), in respect of the financial services provided to Australian wholesale clients (within the meaning of section 761G of the Corporations Act). This material is not for distribution to retail clients and is directed exclusively at Credit Suisse's professional clients and eligible counterparties as defined by the FCA, and wholesale clients as defined under section 761G of the Corporations Act. Credit Suisse (Hong Kong) Limited (“CSHK”) is licensed and regulated by the Securities and Futures Commission of Hong Kong under the laws of Hong Kong, which differ from Australian laws. CSHKL does not hold an AFSL and is exempt from the requirement to hold an AFSL under the Corporations Act under Class Order 03/1103 published by the ASIC in respect of financial services provided to Australian wholesale clients (within the meaning of section 761G of the Corporations Act). Credit Suisse Securities (USA) LLC (CSSU) and Credit Suisse Asset Management LLC (CSAM LLC) are licensed and regulated by the Securities Exchange Commission of the United States under the laws of the United States, which differ from Australian laws. CSSU and CSAM LLC do not hold an AFSL and is exempt from the requirement to hold an AFSL under the Corporations Act under Class Order 03/1100 published by the ASIC in respect of financial services provided to Australian wholesale clients (within the meaning of section 761G of the Corporations Act). Malaysia: Research provided to residents of Malaysia is authorised by the Head of Research for Credit Suisse Securities (Malaysia) Sdn Bhd, to whom they should direct any queries on +603 2723 2020. Singapore: This report has been prepared and issued for distribution in Singapore to institutional investors, accredited investors and expert investors (each as defined under the Financial Advisers Regulations) only, and is also distributed by Credit Suisse AG, Singapore Branch to overseas investors (as defined under the Financial Advisers Regulations). Credit Suisse AG, Singapore Branch may distribute reports produced by its foreign entities or affiliates pursuant to an arrangement under Regulation 32C of the Financial Advisers Regulations. Singapore recipients should contact Credit Suisse AG, Singapore Branch at +65-6212-2000 for matters arising from, or in connection with, this report. By virtue of your status as an institutional investor, accredited investor, expert investor or overseas investor, Credit Suisse AG, Singapore Branch is exempted from complying with certain compliance requirements under the Financial Advisers Act, Chapter 110 of Singapore (the “FAA”), the Financial Advisers Regulations and the relevant Notices and Guidelines issued thereunder, in respect of any financial advisory service which Credit Suisse AG, Singapore Branch may provide to you. UAE: This information is being distributed by Credit Suisse AG (DIFC Branch), duly licensed and regulated by the Dubai Financial Services Authority (“DFSA”). Related financial services or products are only made available to Professional Clients or Market Counterparties, as defined by the DFSA, and are not intended for any other persons. Credit Suisse AG (DIFC Branch) is located on Level 9 East, The Gate Building, DIFC, Dubai, United Arab Emirates. EU: This report has been produced by subsidiaries and affiliates of Credit Suisse operating under its Global Markets Division In jurisdictions where CS is not already registered or licensed to trade in securities, transactions will only be effected in accordance with applicable securities legislation, which will vary from jurisdiction to jurisdiction and may require that the trade be made in accordance with applicable exemptions from registration or licensing requirements. Non-US customers wishing to effect a transaction should contact a CS entity in their local jurisdiction unless governing law permits otherwise. US customers wishing to effect a transaction should do so only by contacting a representative at Credit Suisse Securities (USA) LLC in the US. Please note that this research was originally prepared and issued by CS for distribution to their market professional and institutional investor customers. Recipients who are not market professional or institutional investor customers of CS should seek the advice of their independent financial advisor prior to taking any investment decision based on this report or for any necessary explanation of its contents. This research may relate to investments or services of a person outside of the UK or to other matters which are not authorised by the Prudential Regulation Authority and regulated by the Financial Conduct Authority and the Prudential Regulation Authority or in respect of which the protections of the Prudential Regulation Authority and Financial Conduct Authority for private customers and/or the UK compensation scheme may not be available, and further details as to where this may be the case are available upon request in respect of this report. CS may provide various services to US municipal entities or obligated persons ("municipalities"), including suggesting individual transactions or trades and entering into such transactions. Any services CS provides to municipalities are not viewed as "advice" within the meaning of Section 975 of the Dodd-Frank Wall Street Reform and Consumer Protection Act. CS is providing any such services and related information solely on an arm's length basis and not as an advisor or fiduciary to the municipality. In connection with the provision of the any such services, there is no agreement, direct or indirect, between any municipality (including the officials,management, employees or agents thereof) and CS for CS to provide advice to the municipality. Municipalities should consult with their financial, accounting and legal advisors regarding any such services provided by CS. In addition, CS is not acting for direct or indirect compensation to solicit the municipality on behalf of an unaffiliated broker, dealer, municipal securities dealer, municipal advisor, or investment adviser for the purpose of obtaining or retaining an engagement by the municipality for or in connection with Municipal Financial Products, the issuance of municipal securities, or of an investment adviser to provide investment advisory services to or on behalf of the municipality. If this report is being distributed by a financial institution other than Credit Suisse AG, or its affiliates, that financial institution is solely responsible for distribution. Clients of that institution should contact that institution to effect a transaction in the securities mentioned in this report or require further information. This report does not constitute investment advice by Credit Suisse to the clients of the distributing financial institution, and neither Credit Suisse AG, its affiliates, and their respective officers, directors and employees accept any liability whatsoever for any direct or consequential loss arising from their use of this report or its content. Principal is not guaranteed. Commission is the commission rate or the amount agreed with a customer when setting up an account or at any time after that. Copyright © 2017 CREDIT SUISSE AG and/or its affiliates. All rights reserved.
Investment principal on bonds can be eroded depending on sale price or market price. In addition, there are bonds on which investment principal can be eroded due to changes in redemption amounts. Care is required when investing in such instruments. When you purchase non-listed Japanese fixed income securities (Japanese government bonds, Japanese municipal bonds, Japanese government guaranteed bonds, Japanese corporate bonds) from CS as a seller, you will be requested to pay the purchase price only.