india’s trade in · pdf fileindia’s trade in services by ... sheetal j. chaddha...
TRANSCRIPT
DEPARTMENT OF ECONOMICS
India’s Trade in Services
by
L. G. Burange
Sheetal J. Chaddha
Poonam Kapoor
WORKING PAPER UDE 31/3/2009
JULY 2009

1
DEPARTMENT OF ECONOMICS UNIVERSITY OF MUMBAI
Vidyanagari, Mumbai 400 098.
Documentation Sheet
Title:
India’s Trade in Services
Author(s):
L. G. Burange
Sheetal J. Chaddha
Poonam Kapoor
External Participation:
-----
WP. No.: UDE31/3/2009
Contents: 35 P, 14 T, 8 F, 44 R
No. of Copies: 100 Date of Issue: July 2009
Abstract
The Indian economy has witnessed a major boost in the last decade, which can
chiefly be attributed to the growth of its service sector. India‟s service trade to GDP ratio has
risen to 48 percent of GDP in 2006-07 from 29.20 percent of GDP in the year 2000-01. India
has emerged as the fastest growing nation in global services trade. Acknowledging the
growing significance of the service sector in India and across the globe the paper analyses
services trade in India, its composition, revealed comparative advantage of various sectors of
services and compares their growth in the pre and post liberalization period. An assessment
of performance of services at the aggregated level is undertaken; the paper covers the period
from 1980 to 2007.
The paper illustrates that the major growth in the exports as well as imports of
services have occurred chiefly in the post liberalization period i.e. from the year 1991 to the
year 2007. For this period, India‟s exports of services have grown 19.34 percent and imports
have registered 15.91 percent growth. For the world, the growth was 8.27 and 7.74 percent
respectively. The paper identifies some of the significant concerns regarding Indian economy
growth which has been guided by its service industry. It is clear that the growth in the Indian
services sector is a result of change in the global environment, rather than any well planned
internal policy. The opening up of the economy has certainly propelled the growth of
services and its trade; however India needs to give focused attention to sustain this growth.
Key Words: Trade, Services, Liberalization, Revealed Comparative Advantage
JEL Code(s): F10, F14

2
India’s Trade in Services
L. G. Burange
Sheetal J. Chaddha
Poonam Kapoor
1. INTRODUCTION:
One of the key consequences of the advance in science and technology has
been the growth in trade across borders. The progress made in the field of
transportation, communication and the recent ascent of the internet has opened a
Pandora‟s Box for firms seeking to expand their businesses. The easing of the
regulatory framework in conjunction with liberal policies adopted by countries across
the globe has made the world a local market place. International trade in goods as
well as services has largely benefited from this trend. However, trade in „goods‟ is
different from trade in „services‟. The difference lies in the inherent nature of the
two. Services are characterised by intangibility, invisibility, transience and non-
storability, thus making them different from „goods‟. Of course, all these
characteristics mentioned above may not apply simultaneously to a service.
Moreover, „service‟ is a process, while „good‟ is an object. Hence, they can neither
be easily defined, nor measured. For example, tariffs and quotas are a reflection of
the barriers in merchandise trade. However, impediments to trade in services are
much more difficult to define and quantify. The quality of a „service‟ cannot be
identified before it is purchased, thus these are referred to as „experience goods‟. So
also, for a service to be rendered, often, the supplier and the consumer need to be in
close proximity. These differences between the two make trade in services different
from that in goods.
The conventional concept of trade in services hovered around those services
that could be transferred across borders. This involved a separation of the producer
and the consumer, as in the case of computer software. However, later the concept
The inputs of an anonymous reviewer and suggestions made by Shruti Yamini are gratefully
acknowledged. However, the authors remain solely responsible for any errors.

3
was broadened to incorporate non-separated services as well, where the consumer
may travel to the country of the service-provider or vice-versa. According to the
traditional view of economists services are perishable and non-tradable. Therefore,
there were neither any theories to address the possible problems of trade in services
nor any framework for the measurement of their trade. Initially some economists like
Baumol (1967) made valuable contributions to the study of „services‟. His „Cost
Disease Theory‟ discusses the rising costs associated with service industries. Hill‟s
(1977) concept of services was similar to the classical economists. He stated that
services cannot be accumulated and thus need provider and user to be in close
proximity.
Bhagwati (1984) analysed trade in services and focused attention on the
supply side effect on the growth of the service sector; and called the supply side
specialisation „splintering‟. According to him, there are two groups of services, first
one is that require the physical proximity of the user and the provider, and second
group is of those services which are not essentially dependent on the physical
proximity because of technical advancement. The second type of services like
banking and insurance is more in demand. Gordon and Gupta (2003) along with
supply side have also discussed demand side factors which were responsible for the
growth of the service sector in the 1990s. On the basis of their growth pattern, service
activities are being grouped into fast growers which include IT, communication
services, financial services, hotels and restaurants, community services, trade and
distribution services, and trend growers which include real estate, legal services,
transport, storage, personal services, and public administration and defence (PAD).
During the 1990s tradability of services increased many folds. Technological
change, greater mobility of people, cheaper transmission and communication costs,
and increase in merchandise trade have played a catalytic role in propelling the trade
in services. Karmakar (2005) addresses the world economy, post 1990s as „service
economy‟. In fact, trade in services is fast catching up and comprised about a fifth of
the total world trade in 2001 (WTO 2001).
The growing importance of services trade can be gauged from the fact that a
General Agreement on Trade in Services (GATS) was formulated in 1995 as a result

4
of the Uruguay Round of trade negotiations. GATS is the first set of international
rules for the international trade in services. It not only aims at stimulating trade and
development but also lends credibility and reliability to the system of international
trade. GATS also focus on the concerns of the developing nations. It provides
flexibility to the member countries; the members can choose service sectors they
want to offer for commitments under the GATS rules. The obligations under the
GATS comprise „General‟ and „Specific‟ commitments. The former are applicable to
all the member countries of the WTO, regardless of the sectoral commitments that
the member countries may offer. The latter apply to only those services that are
included in the member‟s GATS schedule. For the purpose of negotiations, the
GATS classify the entire range of services trade into following four „modes‟ (United
Nations 2002).
Mode 1 (Cross-Border Supply) refers to a situation where the services cross
international borders, for example a teacher dispatching teaching material to students
in other country; a doctor advising his patient abroad or designer sending designs for
clients of another nation through electronic means.
Mode 2 (Consumption Abroad) is where consumer moves into the territory
of the service provider country to consume services e.g. tourism, use of hotel or
restaurant services abroad; ship or aircraft undergoing repair abroad.
Mode 3 (Commercial Presence) implies that the service provider, in the form
of a legal unit moves into the geography of the consumer. A foreign company sets up
its subsidiaries, branches, or a joint venture in the host country e.g. foreign banks or
food chain setting up operations.
Mode 4 (Movement of Natural Persons) entails the export of workforce. The
service provider temporarily (for less than a year) enters another member country for
providing service e.g. fashion models or dancers , engineers, doctors, consultants, or
cooks visiting other countries to supply their services.
Many developing countries are reaping large benefits from the expanding
service sector within their economies. The presence of skilled and semi-skilled
workforce coupled with improved technology is enabling these countries to
undertake exports of the Mode 1 and Mode 4 type. As far as India is concerned, the
importance of the service sector in its economy is well-established. In the domestic

5
economy the services sector has considerably augmented its contribution. Between
1950-51 and 2003-04, the share of agriculture in GDP fell from 55.28 percent to
21.74 percent, while the share of industry and services increased from 10.65 percent
to 19.42 percent, and 34.07 percent to 58.83 percent, respectively. Since the 1990s
the share of agriculture has declined and that of the industrial sector has stagnated.
On the other hand, the services sector has been growing steadily. The growth of
India‟s service sector is much higher than the combined growth of agriculture and
industry. The World Bank (2004) attributes the immense growth in India‟s economy
in the decade of the 1990s to the thriving services sector. It is interesting to note that
in Indian economy the contribution of the services sector has climbed higher even
before the country can truly be called a developed one. Nevertheless further growth
of the Indian economy largely depends on the growth of its service sector (GOI
2009).
The service sector has not only made waves in the domestic economy, but has
also managed to make its presence felt in the external trade of the country. India has
emerged as one of the top-most countries in exports and imports of services. India‟s
trade to GDP ratio, increased from 22.50 percent in 2000-01 to 34.80 percent by
2006-07. However on including services trade, the rise is much higher at 48 percent
of GDP in 2006-07 from 29.20 percent of GDP in 2000-01 (GOI 2008). The share of
services trade as a percentage of total trade in India in 2001 has been about 30
percent, which has far exceeded the world average (WTO 2001). In comparison to a
mere 5.40 percent of annual average growth in merchandise exports, the growth in
services exports has been a stupendous 23 percent. India‟s comparative advantage in
services exports is not only greater than goods, but is also increasing (World Bank
2004). After recognising the role of the service sector for the Indian economy,
India‟s stance towards the GATS changed radically. India was reluctant to support
the GATS in its early years. However, it later displayed keenness on negotiating with
other member nations and also undertaking reforms in this sector. India has a
comparative advantage in Mode 1 and Mode 4 type of services and is thus pushing its
interests with the other member nations (Das 2006).
In light of the escalating role of the services sector in the Indian economy, the
paper attempts to evaluate the performance of India‟s trade in services. In addition to

6
the growth in services trade, India‟s comparative advantage in services trade is also
evaluated. The principle of comparative advantage demonstrates that for trade to
occur the opportunity cost of production is more important than its absolute cost. The
concept of comparative advantage has been used by economists to explain the basis
of trade. The onus of developing the basic theory of comparative advantage goes to
Ricardo (1817). He explained that a country should specialise in products and
services in which it has a comparative advantage. His theory of comparative
advantage was further developed by Heckscher-Ohlin and Samuelson. Their model,
known as the H-O-S model, suggested that countries will produce and subsequently
export those products whose raw materials are available in abundance and import
such products that exploit the country‟s scarce factor. Balassa (1965) later developed
the concept of revealed comparative advantage (RCA). The term indicates that
countries specialise and export items which they can produce at lower cost in
comparison to the other countries. He suggested that the comparative advantage of a
country depends on its physical and human capital resources. Any country with a
change in human capital, physical capital and trade policies will witness a shift in the
comparative advantage of the various sectors.
A number of studies assessing comparative advantage in merchandise trade
have been conducted. However, the growing importance of services trade has led to
many recent studies in this area also. Smith (1992) examined the performance of
major competitor countries in the international financial services. He studied markets
of various financial services and evaluated performance on the basis of the shares of
the major institutional players in the US, Japan, UK, and Europe. He discussed how
banking sectors of different countries will behave in a liberalised international trade
environment. Acknowledging the recent growth of the services sector, Takatoshi and
Krueger (2003) analysed services trade in the Asia-Pacific region. They studied the
impact of increasing services sectors mainly telecommunications, financial services,
international tourism, and accounting, on the economies of Taiwan, Korea, and Hong
Kong. Kumar (2005) examined the strength of the South Asian countries and stated
that these countries have natural comparative advantage in labour intensive services.
He reviewed South Asian countries in the GATS framework of the four modes of
supply and concluded that all South Asian countries have RCA in Mode 4, i.e.
movement of natural persons. India also has a stronghold on Mode 1, i.e. cross

7
border trade, and along with its neighbouring countries like Sri Lanka and Nepal,
India has a comparative advantage in Mode 2, i.e. consumption abroad. Dash (2005)
on the other hand, scrutinised the economic implications of outsourcing for US and
India within the context of the Ricardian framework.
Seyoum (2007) studied revealed comparative advantage indices to measure
developing countries comparative advantages in selected services for the period 1998
to 2003. His work included services like business, financial, transport and travel.
Makoto (2007) investigated the comparative advantage structure of US trade in
services, using the RCA index. He showed that the variances in the RCA deviations
points out a similarity between the export structure of the U.S. and the world. He thus
concluded that the U.S. has a strong comparative advantage in knowledge-based
services.
Langhammer (2004) studied strengths and weaknesses of RCA for US, EU
and Japanese services trade where he argued that RCA in international trade in
services cannot be compared with RCA in trade in goods. According to him the
essential difference is that services need producer-consumer proximity and is also
dominated by various domestic regulations. Border measures do not greatly influence
the RCA in services trade but they are more influenced by different domestic
regulations.
The paper attempts to examine the growth in India‟s exports and imports of
services and evaluates the composition of services trade. It also assesses India‟s
comparative advantage in exports and imports of the services and analyses in which
particular sub-sector of service India enjoys a comparative advantage. This analysis
at the sub-sector level is beneficial for making conducive policies, which can aid the
acceleration of trade in services in India.
The above introductory section reviewed the concept and literature on
services trade and its growing worth. Section 2 of the paper deals with the
methodology of the study. The third and fourth sections evaluate the growth and
revealed comparative advantage in India‟s service trade respectively and Section 5
concludes the study.

8
2. DATA ISSUES AND METHODOLOGY
Even after being established as a prominent sector in all types of economies,
there is still a dearth of proper method of measurement, collection and sorting of data
in transactions of services. The increased transaction of services has enhanced the
need for better and internationally comparable data for negotiations and agreements.
However, while negotiations at the GATS level are based on the four modes
mentioned above, the data is not compiled in this form. This escalates the difficulties
at the level of negotiations during various rounds of talks of the WTO. Another
difficulty, especially in the case of India, is that the data available is at a very high
level of aggregation. This impedes scrutiny in greater depth. The comprehensive data
on the direction of India‟s services trade is also unavailable, thus restraining the
scope of the present study.
Nevertheless, in order to attain the above mentioned objective of assessing
India‟s services trade, the paper uses services data for India as well as the world from
two data sets in U.S. dollar values. The first set uses the IMF balance of payments
data for the period 1980 to 2007. This incorporates Transportation Services, Travel
Services and Other Commercial Services (OCS). However, the service categories in
this set are too broad, especially the category of OCS, and thus lack depth. The OCS
category comprises many services such as financial, insurance, legal, computer etc.
The importance of these services in world trade is escalating, and hence merits
attention.
International trade in services is classified as per the fifth edition of the
balance of payments manual (BPM5). The standard components of the BPM5
correspond to the four modes of services as described in the GATS framework. The
BPM5 classification of IMF comprises 11 categories of services. These categories
are further disaggregated at various levels and this is referred to as the extended
balance of payments classification (EBOPS). UN Service Trade provides data as per
the EBOPS classification and the paper uses this as a second data set for the period
2000 to 2005. However, the paper restricts itself to Level 1 of the EBOPS
classification since India does not report services data at lower levels. Yet another
limitation of the paper is that of the EBOPS data set itself. The world data in this case
9
w
i
wj
ij
X
X
x
x
w
wj
i
ij
X
xX
x
may not include all the countries since some of the countries do not report their data
as per the EBOPS classification. Hence, „world‟ here is restricted to the countries
reporting their data to UN Service Trade as per the EBOPS classification.
The study evaluates India‟s exports as well as imports of services in order to
obtain a complete picture of India‟s trade in services. In order to evaluate the growth
in India‟s service trade over two main policy regimes, i.e. the pre-reform and the
post-reform period, the study employs the kinked exponential growth rate model of
Boyce (1986), with the year 1991 acting as the watershed year with a major change
in policy orientation towards liberalisation. Thus the total period of 27 years, from
1980 to 2007, is categorised in two sub-periods. Sub-period 1 refers to the years 1980
to 1991, known as pre-reform period and the second sub-period comprises the years
from 1991 to 2007 referred to as the post-reform period. The annual compound
growth rate (ACGR) for the entire 27 year period is computed as per the log-linear
method.
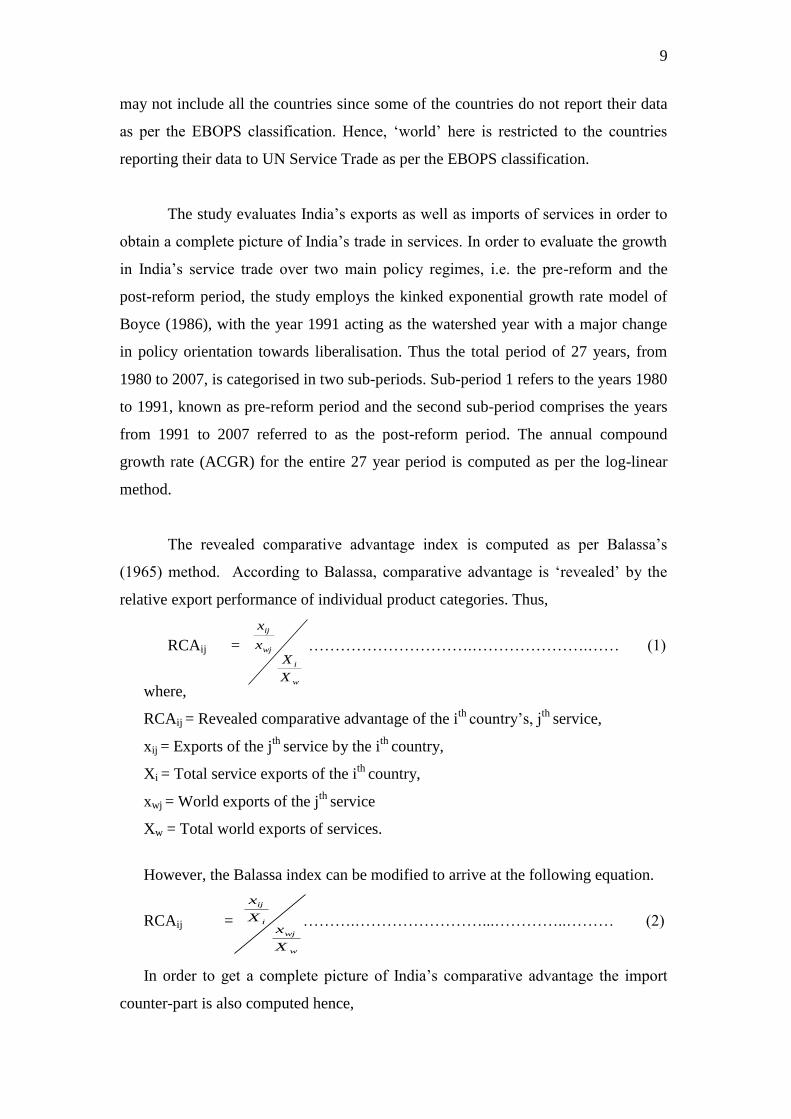
The revealed comparative advantage index is computed as per Balassa‟s
(1965) method. According to Balassa, comparative advantage is „revealed‟ by the
relative export performance of individual product categories. Thus,
RCAij = ………………………….………………….…… (1)
where,
RCAij = Revealed comparative advantage of the ith
country‟s, jth
service,
xij = Exports of the jth
service by the ith
country,
Xi = Total service exports of the ith
country,
xwj = World exports of the jth
service
Xw = Total world exports of services.
However, the Balassa index can be modified to arrive at the following equation.
RCAij = ……….……………………...…………..……… (2)
In order to get a complete picture of India‟s comparative advantage the import
counter-part is also computed hence,

10
w
wj
i
ij
M
mM
m
RCAij = …………………………….………………..….… (3)
where,
RCAij = Revealed comparative advantage of the ith
country‟s, jth
service,
mij = Imports of the jth
service by the ith
country,
Mi = Total service imports of the ith
country,
mwj = World imports of the jth
service,
Mw = Total world imports of services.
If the RCA index for export/import for a particular service is greater than 1, it
implies that the country has a revealed comparative advantage in the exports/imports
of that service and vice-versa.
3. INDIA’S EXPORT OF SERVICES
In order to analyse India‟s exports in services, the paper uses two different
classifications as mentioned in the methodology above. The first sub-section looks at
the exports of services at an aggregate level, while the second sub-section delves on
the disaggregate level.
3.1. Export of Services – Aggregate Level
India‟s share in the world export of services was quite small at 0.78 percent in
1980. The share fluctuated in the range of 0.53 percent to 0.89 percent right until
1998. In 1999, for the very first time India‟s share in the total world exports touched
1 percent. This period falls under the Ninth Five-Year Plan (1997-2002) which
commenced on April 1, 1997. In February 1997, sectoral level negotiations were
concluded in the area of financial services. In mid December 1997, member countries
achieved improved commitments with a larger scope of participation. This reflected
in the growth of India‟s share of export of services in the world from the year 1999 to
2006. In 2005 it crossed the 2 percent mark, and by 2006 it reached 2.71 percent
(Table 1). In fact, in this year, India‟s share of invisible exports in the world‟s export
of service was the highest. But in 2007, the share dropped marginally by 0.06 percent
points to 2.65 percent.

11
Although the decrease in the percentage share was minimal, yet the decline
should not be ignored. The year 2007 falls under the Eleventh Plan (2007-2012).
The objective of this Plan is „faster and more inclusive growth‟. However the
services sector has experienced a dip in its share in the opening year itself. This
slowdown highlights the need for a well planned approach towards services and its
various sub sectors. In fact, China‟s share in world exports of commercial services
surpassed that of India at 3.3 percent in 2006 and the country was 2 notches higher at
the 8th
position, while India was placed at the 10th
rank (WTO 2007).
Table 1: India‟s Share of World Exports of Services (Percent)
Figure 1: India‟s Share of World Exports of Services (Percent)
In terms of growth in exports, service exports from India have grown faster
than world exports. India positively has great possibility for exports of various
services apart from software services (GOI 2009). For the period 1980–2007, India‟s
service exports witnessed an annual compound growth rate (ACGR) of 12.85
Year India's Share of
Exports of Services
1980 0.78
1981 0.70
1982 0.78
1983 0.89
1984 0.86
1985 0.86
1986 0.70
1987 0.61
1988 0.62
1989 0.62
1990 0.59
1991 0.59
1992 0.53
1993 0.53
1994 0.58
1995 0.58
1996 0.57
1997 0.68
1998 0.82
1999 1.00
2000 1.08
2001 1.13
2002 1.20
2003 1.29
2004 1.72
2005 2.25
2006 2.71
2007 2.65

12
percent, while world exports of services have grown at a compound rate of 8.56
percent. However, the entire growth in India‟s service exports has occurred mainly in
the post reform period at 19.34 percent (Table 2). Conversely, in the case of world
exports there has not been much change in the growth rates in the pre and post-
reform periods. In fact, in the case of world exports, the rate of growth in the post-
reform period has been marginally lower. In the case of India, it is quite evident that
service exports have greatly benefited from opening up of the economy.
Though transportation and travel services have also seen higher growth in the
post-reform period, it is the Other Commercial Services (OCS) category which is the
driving force behind the growth in India‟s exports of services. OCS has witnessed an
ACGR of 15.77 percent, which has surpassed the growth in transportation and travel
services for the entire 27 year period (Table 2). In fact, in the pre-reform period, the
growth in India‟s exports of the OCS category was less than a percent. However, the
post-reform period registered phenomenal growth in the category, thus registering a
growth rate of 25.53 percent.
Table 2: ACGR of Exports of Services of India and the World (Percent)
Services
Pre-Reform Period*
(1980-1991)
Post-Reform Period
(1991-2007)
Total Period
(1980-2007)
India World India World India World
Transportation 8.39 5.80 12.49 6.92 10.97 6.51
Travel 3.51 11.89 10.78 6.54 8.05 8.48
OCS 0.72 9.62 25.53 10.25 15.77 10.02
Total 2.49 9.08 19.34 8.27 12.85 8.56 *The terms pre-reform and post-reform period are used only in the context of India.
Figure 2: Trend in ACGR of Exports of Services of India and the World (Percent)
As mentioned in the methodology, invisible services in the BOP data of the
IMF is divided into three categories of services. Of these three categories, OCS
0
5
10
15
20
25
30
India World India World India World
1980-1991 1991-2007 (1980-2007)
Pre-Reform Period Post-Reform Period Total Period
Transportation Travel OCS Total

13
(which includes all commercial services excluding travel and transport) has emerged
as the most significant contributor to the earnings on the invisible account (Table 3).
In 1980, OCS comprised 30.16 percent of India‟s total service exports. By
1984, the share had doubled to 60.57 percent but between 1985 and 1997 OCS
witnessed a downward swing. In 1987, travel services took the lead with 41.12
percent of the countries total exports, while OCS recorded a share of 39.46 percent
followed by transportation services with a 19.43 percent share. By 1997 OCS again
became the largest sector with a 45.86 percent share in total exports. Since then OCS
has been the largest sector of service export and in 2006 it accounted for 77.93
percent of the total export of services.
Table 3: Percentage Share of Service Categories in Total Exports of Services
(India and World)
Year India World
Transportation Travel OCS* Total Transportation Travel OCS* Total
1980 15.60 54.24 30.16 100.00 36.82 28.36 34.82 100.00
1981 17.30 48.52 34.18 100.00 36.63 27.78 35.59 100.00
1982 15.71 42.07 42.23 100.00 35.05 27.76 37.19 100.00
1983 13.79 37.01 49.20 100.00 34.06 28.39 37.56 100.00
1984 15.92 23.51 60.57 100.00 33.56 30.06 36.38 100.00
1985 15.74 27.41 56.86 100.00 32.68 30.35 36.98 100.00
1986 17.01 36.88 46.11 100.00 29.74 31.93 38.33 100.00
1987 19.43 41.12 39.46 100.00 29.00 33.06 37.94 100.00
1988 23.25 37.83 38.93 100.00 29.70 33.78 36.52 100.00
1989 20.77 35.40 43.83 100.00 29.40 33.62 36.98 100.00
1990 20.81 33.81 45.38 100.00 28.60 33.93 37.48 100.00
1991 19.88 37.54 42.58 100.00 27.73 33.55 38.72 100.00
1992 21.16 46.91 31.94 100.00 26.42 34.52 39.06 100.00
1993 24.67 42.89 32.44 100.00 25.88 34.33 39.79 100.00
1994 28.42 37.67 33.91 100.00 25.72 34.00 40.28 100.00
1995 27.95 38.17 33.88 100.00 25.80 34.72 39.49 100.00
1996 27.70 39.44 32.86 100.00 24.58 34.83 40.59 100.00
1997 21.76 32.38 45.86 100.00 24.17 33.68 42.15 100.00
1998 16.02 26.64 57.34 100.00 23.33 33.02 43.66 100.00
1999 13.16 21.49 65.35 100.00 23.25 32.87 43.88 100.00
2000 12.34 21.58 66.07 100.00 23.46 32.17 44.37 100.00
2001 12.20 19.04 68.76 100.00 23.21 31.43 45.36 100.00
2002 12.93 16.22 70.85 100.00 22.54 30.60 46.86 100.00
2003 12.79 18.88 68.33 100.00 22.29 29.38 48.33 100.00
2004 11.53 16.27 72.21 100.00 23.05 29.04 47.91 100.00
2005 10.30 13.50 76.20 100.00 23.31 27.92 48.77 100.00
2006 10.16 11.90 77.93 100.00 22.67 27.26 50.07 100.00
2007 10.43 12.62 76.95 100.00 22.78 26.47 50.74 100.00 *Other Commercial services (Commercial Services excluding Travel and Transport)
The growing significance of OCS exports is in line with world trends. In the
case of world service exports too, OCS has been the largest sector since 1982, closely

14
followed by transportation and travel. In 1982, OCS accounted for 37.19 percent of
the world‟s total service exports and its share grew to 50.74 percent by 2007. The
comparative study of service export data of India and world revealed that the OCS
sector holds the major share of total exports in both. However India also enjoys
comparative advantage in exports of the OCS category as reflected in Table 4. It is
significant to understand why India has RCA in one particular sector of services.
Other sectors of services are neither experiencing much growth nor have any
comparative advantage. From a broader perspective it is evident that transport and
travel are associated with infrastructure while OCS is a more human intensive sector.
Table 4: India‟s RCA in Service Exports (1980-2007)
Figure 3: India‟s RCA in Service Exports
3.1.1. Transportation
Transportation services cover all transport services which are carried out by
the people of one economy for the citizens of another nation. It involves air, ship and
Year Transport Travel OCS
1980 0.42 1.91 0.87
1981 0.47 1.75 0.96
1982 0.45 1.52 1.14
1983 0.41 1.30 1.31
1984 0.47 0.78 1.66
1985 0.48 0.90 1.54
1986 0.57 1.16 1.20
1987 0.67 1.24 1.04
1988 0.78 1.12 1.07
1989 0.71 1.05 1.19
1990 0.73 1.00 1.21
1991 0.72 1.12 1.10
1992 0.80 1.36 0.82
1993 0.95 1.25 0.82
1994 1.11 1.11 0.84
1995 1.08 1.10 0.86
1996 1.13 1.13 0.81
1997 0.90 0.96 1.09
1998 0.69 0.81 1.31
1999 0.57 0.65 1.49
2000 0.53 0.67 1.49
2001 0.53 0.61 1.52
2002 0.57 0.53 1.51
2003 0.57 0.64 1.41
2004 0.50 0.56 1.51
2005 0.44 0.48 1.56
2006 0.45 0.44 1.56
2007 0.45 0.47 1.51

15
other transport of passengers and goods, chartering of transporters along with crew
and supporting services (United Nations 2002). This is the service sector which is
closely linked with trade of merchandise. Better transportation services of a country
immensely affect its trade of goods and other services.
While exports of transportation services from India did not comprise a major
share of India‟s total service exports even in 1980, the share declined further by 2007
(Table 3). This may be attributed to the expansion of the OCS category in the export
basket of services, since in comparison to the world; growth in India‟s exports of
transportation services has been higher at 10.97 percent for the entire 27 year period
i.e. from 1980 to 2007, while for the world it is 6.51 percent (Table2). Not only has
the post-reform period seen higher growth than the pre-reform period as far as India
is concerned, but the growth in exports during this period has been twice that of the
world exports of transportation services (Table 2). Economic growth in India in the
post-reform has accelerated. Increased economic activity has resulted in greater
volume of trade and thereby the use of transportation services.
The European Union, United States and Japan are the leading exporters of
transportation services in the world, with a combined share of 60 percent in 2006.
India‟s share in world exports of transportation services however, was much smaller
at 1.22 percent in 2006, while China‟s share was higher at 3.3 percent (WTO 2007).
Nonetheless, India does feature amongst the top 15 exporters in the world. However,
the sector did not display any revealed advantage in the entire period of the study,
except for a three year period between 1994 and 1996.
3.1.2. Travel
In the Indian context, travel services are the second largest contributor to the
export basket of services. According to the UN Service Trade Manual (United
Nations 2002), travel services comprise collection of commodities and services
consumed by travellers in the foreign countries during their stay of less than one
year. The World Economic Forum Report (WEF 2008) on Travel and Tourism
Competitiveness across the World placed India at the 65th
position in overall growth
among 130 nations. According to the Report (p.19), „India is well assessed for its
natural resources (ranked 13th
) and cultural resources, with many World Heritage
16
sites, both natural and cultural. The country also benefits from good price
competitiveness (ranked 20th
overall), despite somewhat high comparative hotel
prices. India also has quite a good air transport network (ranked 35th
), particularly
given the country‟s stage of development, and a reasonable ground transport
infrastructure (ranked 39th
)‟. The number of foreigners arriving in India has more
than doubled between 1991 and 2007, as can be seen from the Table 5 below. There
was a dip mainly in 2001 and 2002, with tourist arrivals witnessing negative growth,
which may be attributed to the terrorist attacks in September 2001 in the US.
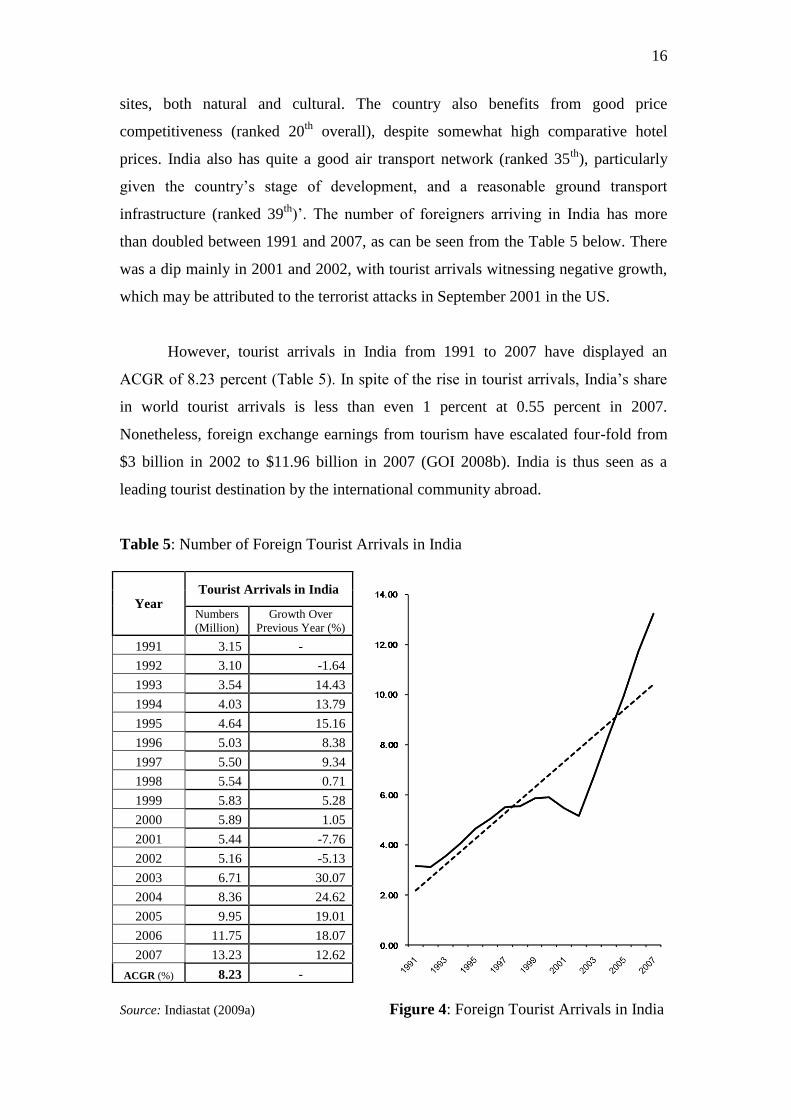
However, tourist arrivals in India from 1991 to 2007 have displayed an
ACGR of 8.23 percent (Table 5). In spite of the rise in tourist arrivals, India‟s share
in world tourist arrivals is less than even 1 percent at 0.55 percent in 2007.
Nonetheless, foreign exchange earnings from tourism have escalated four-fold from
$3 billion in 2002 to $11.96 billion in 2007 (GOI 2008b). India is thus seen as a
leading tourist destination by the international community abroad.
Table 5: Number of Foreign Tourist Arrivals in India
Source: Indiastat (2009a) Figure 4: Foreign Tourist Arrivals in India
Year Tourist Arrivals in India
Numbers
(Million)
Growth Over
Previous Year (%)
1991 3.15 -
1992 3.10 -1.64
1993 3.54 14.43
1994 4.03 13.79
1995 4.64 15.16
1996 5.03 8.38
1997 5.50 9.34
1998 5.54 0.71
1999 5.83 5.28
2000 5.89 1.05
2001 5.44 -7.76
2002 5.16 -5.13
2003 6.71 30.07
2004 8.36 24.62
2005 9.95 19.01
2006 11.75 18.07
2007 13.23 12.62
ACGR (%) 8.23 -

17
In spite of this rapid expansion, the growth in India‟s exports of travel
services has been below the growth rate of total services, at 8.05 percent for the 27
years that the study covers (Table 2). The growth in world exports of travel services
has been marginally higher at 8.48 percent. A stark contrast is observed, if the growth
in the two sub-periods is considered. During the pre-reform period, the growth in
world exports of travel services exceeded that of India. On the other hand, in the post
reform period, the growth in India‟s exports of travel services was much higher than
the world at 10.78 percent (Table 2). The opening up of the economy may have led to
an increase in business travellers. Also medical and health tourism received a boost
during this period.
However, travel services at large have seen a poor performance in comparison
to the OCS category. Unfortunately, India lost its RCA in the travel category by
1997. The financial carnage in the Asian markets in the post 1997 period may have
impacted business and leisure travel immensely, thus reducing the number of
travellers arriving in India. India had a revealed comparative advantage right from
1980 which remained only till 1983. In 1984 and 1985 the sector did not illustrate
any advantage. However, the entire decade from 1986 to 1996 was good for the
Indian travelling sector since during this period India displayed a comparative
advantage. This can be attributed to the fact that in the year 1986 the Indian airline
industry started relaxing which resulted in additional capacity. India could not
maintain its RCA and from 1997 onwards right until 2007, it did not demonstrate any
revealed advantage. Inept government policies proved detrimental for the air travel
industry. On the other hand, China has become the third largest exporter of travel
services, surpassed only by the EU and the United States. In fact, Africa too has
emerged as an important tourist destination because of natural environs and
adventure tourism it offers. India, with less than a percent share of international
tourist arrivals, does not even feature among the top 15 travel service providers in the
world.
Although India has a great potential in providing a wide array of travel
services such as medical tourism, education tourism etc. it does require to upgrade its
infrastructure before results from this sector can be expected. The low cost of highly

18
skilled health professionals in India in conjunction with the shifting demographic
trends in the developed world present an enormous opportunity for India. On an
average, treatment costs in India are a fraction of the costs in developed countries
like the UK and the US Still India fails to lure foreigners due to poor infrastructure,
unhygienic and dirty surroundings that our cities offer (Marcelo 2003).
India also has the potential to be a great tourist destination for varied types of
tourism such as adventure tourism, rural tourism, religious tourism (for Indians
abroad), spiritual tourism (for foreigners), business tourism and cruise tourism. To
convert this potential into reality a lot of work has to be done. For example, safety
and security of tourists arriving in India is mandatory and therefore steps in this
regard must be initiated. A world-class infrastructure and diversifying the source of
tourist arrivals are few other aspects that should be considered. Initiative and
assistance from the government is also forthcoming in terms of announcements of
various schemes like Assistance to Large Revenue Generating Projects, Creation of
Land-Bank for Hotels and Scheme for Product/Infrastructure Development for
Destination to name a few. Yet, India seems to have a long way to go and this can be
gauged from the fact that the number of hotels approved by the Ministry of Tourism
is as low as 1437 with a total of 84327 rooms as on December 31, 2007 (GOI 2008b).
3.1.3. Other Commercial Services (OCS)
This category not only has the largest share of India‟s service exports, but this
is the only sector which showed RCA in 21 out of 27 years covered in this study.
(OCS is the total of all the commercial services excluding travel and transport
services). Business process outsourcing (BPO) activities, which are a part of IT-
enabled services, fall under other business services as per IMF classifications. The
growth in India‟s exports of this category during the post-reform period has enabled
India to achieve a growth rate of 19.34 percent for total services (Table 2).
India evidently has advantages in services sector which are skilled and
semiskilled labour intensive. Computer and information sector has been the fastest
growing segments. The factors which have helped India to gain an edge in this sector
are as follows -

19
3.1.3.1. Abundance of Human Resource
India is endowed with the wealth of population. India is the second most
populated country in the world. The population in India as at 0:00 hours on 1st March
2001 stood at 1,027,015,247 persons (GOI 2001). With this, India became only the
second country in the world after China to cross the one billion mark. China also
enjoys a great advantage in terms of large pool of people but the Chinese could not
capture the service industry as they have limitation in terms of an English speaking
workforce. Abundance of educated workforce has helped India to become a strong
contender in trade of services across the world.
3.1.3.2. Superior Competency
India is home to a huge number of educated, English speaking, technology -
savvy personnel. In fact India produces a large number of graduates every year and
most of these graduates have knowledge of the English language. Every year,
approximately 19 million students are enrolled in high schools and 10 million
students in under-graduate degree courses across India. Moreover, 2.1 million
graduates and 0.3 million post-graduates pass out of India's non-engineering colleges.
The government‟s continued investment in higher education since independence in
terms of the establishment of educational institutes as well as subsidisation of
education have produced a pool of knowledgeable workers capable of performing
skilled and specialised tasks. India has one of the largest Higher Education systems
in the world. This has helped in human resource development of the nation. India is
also emerging as a hub of good and affordable technical education. The Indian
education system provides immense attention to mathematics and science, the quality
of professionals churned out by the Indian system is at par with international
standards. Quantitative concepts coupled with English proficiency make India one of
the favourite contenders for IT/BPO work.
3.1.3.3. Factor Cost Advantage
One of the most important features of the Indian workforce is its cost
effectiveness. In India, the manpower cost is almost one-tenth of overseas. For

20
example, one person cost per annum in the US is approximately $40,000 while in
India it is only $5,000 (indobase.com). Despite the fast pace of growth of the Indian
economy in the last decade, the average income of a person has barely crossed
Rs.3000 per month (Economic Times 2009). Along with lower wages compared with
the overseas wages, the exchange rate of the Indian rupee and the US dollar also
makes the Indian work force more attractive.
3.1.3.4. Different Time Zone
India has an 8 to 12 hours time difference with respect to the overseas markets
like the US, which enables India to offer round-the-clock services to its clients.
Indian companies are able to work in a shift system which helps in better utilisation
of their resources. Most of the Indian call centres serve clients from US between 5:30
p.m. to 9:30 am and during the day utilise the same resources to serve clients from
other parts of the world.
3.1.3.5. Improved Infrastructure
There has been a notable expansion and up gradation of power availability,
international bandwidth condition, status of roads and highways. Along with these
improvements the privatisation of the telecom sector has helped India give better
results in the IT/BPO sectors.
3.1.3.6. Initiatives by the Government
The Indian government has comprehended the potential of the IT sector to
influence economic growth in the country. Some of the government‟s policies have
been of immense value in the growth of the computer and information sector. These
policies have helped India emerge as a BPO/IT hub. India definitely needs to
maintain the momentum of growth in the computer and information segment but it
needs to nurture other service sectors as well. Countries like China, Philippines,
Mexico, Malaysia and Canada can give India tough competition in the same
segments if essential steps are not undertaken. China with its largest pool of people
has already surpassed other countries in the area of manufacturing. With

21
improvement in the language skills of its workforce, China could easily challenge
India‟s supremacy in the service sector. Certain problems that the sector in India is
facing include –
High marketing, travelling and transportation costs. This makes exploration of
new markets very expensive and adversely affects the expansion of business.
High attrition rate and poaching are pushing manpower costs upward resulting in
reduced profit margins.
Lack of privacy regulations and data protection acts are accumulating as major
threat for further development.
3.2. Exports of Services – Disaggregate Level
The BOP data of the IMF presents a broader picture from 1980 onwards with
service transactions classified only in three categories. For empirical judgment it is
vital to examine transaction of services under more categories and other existing
data. The paper thus analyses UN Service Trade which classifies trade of services in
eleven categories. However, the data is available only from 2000 to 2005. This
additional data enables us to present a slightly detailed picture of the Indian service
sector.
As per the UN Service Trade data, the share of transportation services in total
service exports has been in the range of 11 percent to 14 percent from 2000 to 2005
and in the world it hovered around 22 percent to 24 percent (Table 6). Although the
overall volume and value of transport services in India as well as in the world has
been increasing its share in total exports does not fluctuate much. The share of travel
service exports from India also plummeted from 22.98 percent in 2000 to 13.68
percent by 2005. Thus, both data-sets point towards the declining contribution of
these services in India‟s export earnings.
If we look at the components of the other commercial services (OCS)
category which include the entire range of services from serial no. 3 to 11 in Table 6
above, we realise the significance of computer and information services in India‟s
exports. In fact computer and information services make up almost 40 percent to 50
percent of our earnings from exports of services. This is mainly owing to a number of

22
reasons presented in the earlier paragraphs. Moreover, the laying down of fibre-optic
cables and the threat of the Y2K bug affecting all the computers in the world by the
end of 1999 presented India with an immense opportunity.
The tedious task could be performed at competitive prices only by Indian
software engineers and this gave a boost to the Indian software industry. India thus
emerged on the global map as an important outsourcing destination for the IT
industry the world over (Friedman 2005). This enabled the service to comprise a
major share of India‟s export basket. However in world exports, the sector did not
reflect the kind of vibrancy which has been observed in the Indian scenario. The
share of the sector in world exports ranged between 1 percent and 3 percent between
2000 and 2005.
Table 6: Percentage Share of Exports of Services in India and World as per the
EBOPS Classification
Sr.
No. Service
Description
2000 2001 2002 2003 2004 2005
India World India World India World India World India World India World
1 Transportation* 13.44 24.26 14.04 23.66 13.63 22.81 12.94 22.31 12.31 24.57 11.02 24.75
2 Travel* 22.98 30.67 20.38 29.73 17.80 28.42 20.33 27.27 17.52 29.02 13.68 28.29
3 Communication 7.48 2.05 4.89 2.14 4.36 2.12 4.00 2.16 3.64 1.98 3.83 2.15
4 Construction 3.52 1.85 0.94 1.87 0.96 1.85 1.85 1.82 1.29 1.86 1.61 1.95
5 Insurance 1.77 1.92 1.87 2.16 1.98 3.02 1.69 3.25 2.29 2.24 1.83 2.02
6 Financial 2.28 5.59 1.90 5.25 3.63 5.99 1.21 6.15 1.35 4.99 2.99 5.45
7 Computer and
Information 41.66 1.97 49.10 2.45 51.60 2.59 51.66 2.99 46.52 2.78 41.44 2.85
8 Royalties and License Fees
0.39 5.83 0.14 5.65 0.12 5.53 0.13 5.72 0.19 6.63 0.23 6.03
9 Other Business
Services@ 2.19 22.38 3.37 23.05 4.34 23.43 5.23 24.13 13.58 21.86 22.61 22.59
10 Personal, Cultural and
Recreational
0.00 0.99 0.00 1.53 0.00 1.63 0.00 1.53 0.28 1.39 0.22 1.27
11 Government Services, n.i.e.
4.28 2.48 3.37 2.50 1.57 2.61 0.97 2.67 1.05 2.69 0.54 2.64
Total 100.00 100.00 100.00 100.00 100.00 100.00 100.00 100.00 100.00 100.00 100.00 100.00
* The figures are slightly different from the aggregate level due to different sources of database.
@ Other business services include merchanting and other trade-related services, operational leasing services, miscellaneous
business, professional and technical services.
In case of world exports, apart from the two major categories of travel and
transportation, it is the financial, royalties and other business services which are more
important. In fact, the share of other business services in India‟s exports too has
phenomenally escalated since 2004. Nonetheless, the figures clearly advocate that
India has an advantage in computer and information services. India is among the key
traders of Asia of these services (WTO 2007).

23
The share of communication, construction and government services has on
the other hand witnessed a decline in the case of India while it has stagnated in the
case of the world. Nevertheless, India does enjoy a comparative advantage in exports
of communication and computer and information services (Table 7). Both these
sectors have demonstrated RCA right since 2000. The RCA in case of computer and
information services has been much higher, although it is declining in case of both.
In fact, along with computer services, India is also a leading exporter in
communication services and featured in the top 5 exporters in the world in 2005
(WTO 2007).
Table 7: RCA Index of India‟s Service Exports as per the EBOPS (2000-2005)
Service
Code
Sr.
No. Services
RCA Index
2000 2001 2002 2003 2004 2005
205 1 Transportation* 0.55 0.59 0.60 0.58 0.50 0.45
236 2 Travel* 0.75 0.69 0.63 0.75 0.60 0.48
245 3 Communications 3.65 2.28 2.06 1.85 1.84 1.78
249 4 Construction 1.90 0.50 0.52 1.01 0.70 0.83
253 5 Insurance 0.92 0.87 0.66 0.52 1.02 0.91
260 6 Financial 0.41 0.36 0.61 0.20 0.27 0.55
262 7 Computer and Information 21.11 20.03 19.91 17.29 16.73 14.53
266 8 Royalties and License Fees 0.07 0.03 0.02 0.02 0.03 0.04
268 9 Other Business Services 0.10 0.15 0.19 0.22 0.62 1.00
287 10 Personal, Cultural & Recreational 0.00 0.00 0.00 0.00 0.20 0.18
291 11 Government Services, n.i.e. 1.73 1.34 0.60 0.36 0.39 0.20 *The figures are slightly different from that of the aggregate level due to different sources of database.
Globally, the banking, financial and insurance services (BFIS) are the fastest
emerging segments in outsourcing businesses. Although India may not have revealed
an advantage in exports of financial services, it has displayed RCA in exports of
insurance services in 2004 (Table 7). Construction is yet another category where
India has displayed an advantage in a few years. Thus, it is this space that India
should pursue, not only because of its importance in world exports, but also due to
the advantage that India can offer. Then, our service exports will not be heavily
concentrated in computer and information services and some degree of diversity will
be achieved.
4. INDIA’S IMPORTS OF SERVICES
India‟s imports of services is also analysed as per two different classifications
mentioned in the methodology. The first sub-section uses the IMF balance of
payments data to discuss imports at the aggregate level, whereas the second sub-

24
section relies on the EBOPS classification for examining imports at a disaggregated
level.
4.1. Imports of Services –Aggregate Level
From less than one percent, India‟s share in the world service imports in 1980
escalated to 2.55 percent by 2007. Interestingly, it took 18 years for India to import
about one percent of the total world services by 1998. However, it took only 7 years
for India to double its share in world imports of services to 2.01 percent in 2005
(Table 8). Moreover, in conformity to the export scene, India‟s imports of services
have also witnessed higher growth compared to world imports (Table 9). While
world total service imports have displayed an ACGR of 7.96 percent, imports of
services in India have showcased a ACGR of 11.93 percent for the period 1980 to
2007 (Figure 6). As in the case of exports, imports of services from India also have
witnessed tremendous growth in the post-reform period. The growth in India‟s
imports of services trebled to 15.91 percent, while growth in world imports registered
slower growth in the post-reform period.
In line with world trends, the growth in service imports is primarily seen in
travel and other commercial services (Table 9). In terms of contribution to the import
bill also, it is essentially these two categories which have augmented their
importance. In 1980 the OCS category comprised 34.77 percent of India‟s import
bill. By 2007, about 50.81 percent of India‟s total service imports consisted of other
commercial services (Table 10). Especially since 1999, the share of the OCS
category in the import basket has been more than 45 percent in most of the years.
Transportation services on the other hand have seen a decline in their percentage
share of total service imports in India as well as the world. In fact, in the case of
India, the category has seen a massive downslide in its share as it almost halved from
a whopping 61.35 percent in 1980 to 38.87 percent in 2007.
4.1.1. Transportation
The growth in imports of transportation services has been below average for
India as well as the world. Nonetheless, in comparison to the world, India‟s imports
have witnessed higher growth (Figure 6) if we consider the entire 27 year period.

25
Table 8: India‟s Share of World Imports of Services (Percent)
Figure 5: India‟s Share of World Imports of Services
With reference to the two sub-periods, the growth in India‟s imports doubled
in the post-reform period and interestingly enough it was about twice the growth in
world imports also (Table 9). India has a comparative advantage in the imports of
transportation services. Table 11 highlights that India has enjoyed comparative
advantage in imports of transportation services right since 1980. Amongst all the
three categories, it is only transportation which has shown a comparative advantage
in imports consistently for the entire period of the study. This advantage in imports
arises from the absence of a well-developed transport sector in the domestic
economy. The transport sector mainly comprises air transport, sea transport and the
others category. The growth in India‟s air and sea transport services has been
constrained due to lack of investment.
These services have failed to keep pace with the growth in demand, thus
leading to their imports. In fact the participation of Indian ships in India‟s overseas
Year
India’s Share of
Imports of Services
1980 0.72
1981 0.76
1982 0.84
1983 0.95
1984 0.90
1985 0.95
1986 0.84
1987 0.83
1988 0.83
1989 0.84
1990 0.72
1991 0.68
1992 0.70
1993 0.66
1994 0.77
1995 0.84
1996 0.87
1997 0.95
1998 1.07
1999 1.24
2000 1.29
2001 1.34
2002 1.33
2003 1.38
2004 1.66
2005 2.01
2006 2.40
2007 2.55

26
0
5
10
15
20
25
India World India World India World
1980-1991 1991-2007 (1950-2007)
Pre-Reform Period Post-Reform Period Total Period
Transportation Travel OCS Total
Table 9: ACGR of Imports of Services of India and the World (Percent)
Services
Pre-Reform Period
(1980-1991)
Post-Reform Period
(1991-2007)
Total Period
(1980-2007)
India World India World India World
Transportation 5.54 5.00 12.49 6.97 9.88 6.25
Travel 10.06 11.46 19.82 6.14 16.14 8.06
OCS 4.68 9.33 19.06 9.46 13.57 9.41
Total 5.40 8.35 15.91 7.74 11.93 7.97
Figure 6: Trend in ACGR of Imports of Services of India and the World (Percent)
trade has declined from 36 percent in 1984-85 to 29.80 percent by 1996-97. Over-
regulation and procedural constraints have marred the progress of the port and
shipping sector. Even in terms of investments, the sector could garner only 3 percent
of the total investments in 2007 (Commodity Online 2008).
4.1.2. Travel
The share of travel in India‟s total imports of services surged by about five
times from 3.88 percent in 1980 to 15.19 percent in 2001. However, since 2002, the
share witnessed a steady downslide to touch 10.32 percent in 2007. Nevertheless, this
category has displayed the highest growth in the 27 years that the study covers at
16.14 percent (Table 5). The growth in India‟s imports of travel services is almost
twice as that of the world. With regard to both pre and post-reform periods, India has
witnessed above average growth in the imports of travel services. Table12 shows that
the number of Indians travelling abroad has gone up by almost five times between
1991 and 2007. The number of Indians going abroad has grown at an ACGR of 9.32

27
Table 10: Percentage Share of Services in Total Imports of Services
(India and World)
Year
India World
Transportation Travel OCS Total Transportation Travel OCS Total
1980 61.35 3.88 34.77 100.00 41.67 26.89 31.44 100.00 1981 61.13 4.55 34.32 100.00 42.15 25.06 32.79 100.00 1982 61.81 5.58 32.61 100.00 40.45 25.01 34.54 100.00 1983 57.64 6.25 36.11 100.00 39.96 25.28 34.76 100.00 1984 59.38 8.56 32.06 100.00 39.14 27.02 33.84 100.00 1985 58.32 9.28 32.39 100.00 37.72 28.07 34.21 100.00 1986 56.45 7.89 35.66 100.00 34.74 30.11 35.15 100.00 1987 56.23 7.78 35.99 100.00 33.92 31.44 34.64 100.00 1988 58.61 7.69 33.70 100.00 33.70 32.43 33.87 100.00 1989 57.50 7.25 35.25 100.00 33.71 31.95 34.34 100.00 1990 57.52 6.62 35.86 100.00 32.06 32.19 35.75 100.00 1991 55.93 7.48 36.59 100.00 31.66 31.94 36.40 100.00 1992 60.55 7.11 32.34 100.00 30.42 33.22 36.36 100.00 1993 62.56 7.46 29.98 100.00 30.01 32.21 37.78 100.00 1994 56.83 9.57 33.60 100.00 30.21 32.21 37.58 100.00 1995 56.68 9.90 33.42 100.00 30.48 31.87 37.65 100.00 1996 58.61 8.30 33.09 100.00 29.01 31.87 39.12 100.00 1997 55.50 10.93 33.58 100.00 28.77 31.19 40.03 100.00 1998 49.98 12.07 37.95 100.00 27.75 30.82 41.43 100.00 1999 40.95 11.79 47.26 100.00 27.41 30.83 41.77 100.00 2000 46.06 14.24 39.70 100.00 28.57 30.03 41.39 100.00 2001 42.93 15.19 41.88 100.00 27.78 29.11 43.11 100.00 2002 41.02 14.38 44.59 100.00 26.69 29.15 44.16 100.00 2003 37.73 14.53 47.74 100.00 26.94 28.53 44.53 100.00 2004 37.50 13.65 48.86 100.00 28.26 28.05 43.70 100.00 2005 42.36 12.65 44.99 100.00 28.89 27.22 43.89 100.00 2006 39.96 11.66 48.38 100.00 28.77 26.19 45.04 100.00 2007 38.87 10.32 50.82 100.00 28.45 25.56 45.99 100.00
percent. Outbound travel from India is increasing substantially, given the rising
disposable incomes of the urban population. The emergence of low cost carriers has
also led to an increase in the number of people travelling abroad for leisure as well as
for business purposes.
Travelling within the country is far more cumbersome and expensive in
comparison to travelling abroad. In recent times the number of students pursuing
higher studies abroad is increasing substantially. Easy availability of education loans
and capacity constraints in quality institutions in the home country has led many
students to pursue higher studies in foreign lands. In spite of this spike in
contribution to the import bill, India does not have a comparative advantage in
imports of travel services.

28
Table 11: India‟s RCA in Service Imports
Figure 7: India‟s RCA in Service Imports
4.1.3. Other Commercial Services (OCS)
This category enjoys almost 50 percent share of the import basket of services.
In 1999, the share of the category in total imports of India took an immense leap
from 37.95 percent in 1998 to 47.26 percent (Table 10). Nevertheless, the RCA index
has fluctuated between an advantage and a disadvantage, throughout the period of the
study (Table 11). However, for the period 1986-1991 and since 2002, the category
has displayed consistent comparative advantage in imports. Since the category
includes many services in its fold, the following section looks at a slightly detailed
Level 1 of the EBOPS classification. The Level 1 of the EBOPS classification
comprises eleven categories of services, which are summed up as the OCS category
in the IMF Balance of Payments data.
Year Transportation Travel OCS
1980 1.47 0.14 1.11
1981 1.45 0.18 1.05
1982 1.53 0.22 0.94
1983 1.44 0.25 1.04
1984 1.52 0.32 0.95
1985 1.55 0.33 0.95
1986 1.63 0.26 1.01
1987 1.66 0.25 1.04
1988 1.74 0.24 1.00
1989 1.71 0.23 1.03
1990 1.79 0.21 1.00
1991 1.77 0.23 1.01
1992 1.99 0.21 0.89
1993 2.08 0.23 0.79
1994 1.88 0.30 0.89
1995 1.86 0.31 0.89
1996 2.02 0.26 0.85
1997 1.93 0.35 0.84
1998 1.80 0.39 0.92
1999 1.49 0.38 1.13
2000 1.61 0.47 0.96
2001 1.55 0.52 0.97
2002 1.54 0.49 1.01
2003 1.40 0.51 1.07
2004 1.33 0.49 1.12
2005 1.47 0.46 1.03
2006 1.39 0.45 1.07
2007 1.37 0.40 1.10

29
0
2
4
6
8
10
12
Indian Nationals Going Abroad (Millions)
Linear (Indian Nationals Going Abroad (Millions))
Table 12: Indian Nationals Going Abroad
Source: Indiastat (2009b) Figure 8: Indian Nationals Going Abroad
4.2. Imports of Services – Disaggregate Level
As per the EBOPS classification, India‟s share in imports of transportation
services has declined between 2000 and 2005 (Table 13). Travel on the other hand
has witnessed some fluctuations. However, financial services have seen a massive
decline in their share between 2000 and 2005. Notably the share of this service in
India‟s imports was considerably higher than world imports in 2000. However, a
consistent fall in share of this service in India‟s imports led to the category enjoying
an almost similar share as of world imports.
Nonetheless, the share of financial services in India‟s imports has plummeted
at the cost of an immense leap in the share of the other business services category.
An interesting trend that emerges is that financial and computer services have
displayed comparative advantage consistently. As a result of the reforms, a number
of financial services providers were allowed to enter India. Being a nascent market,
India was seen as a lucrative market for financial services by established companies
abroad.
Year
Indian Nationals Going
Abroad
Numbers
(Million)
Growth
Over
Previous
Year (%)
1991 1.9 -
1992 2.2 15.79
1993 2.7 22.73
1994 2.7 0.00
1995 3.1 14.81
1996 3.5 12.90
1997 3.7 5.71
1998 3.8 2.70
1999 4.1 7.89
2000 4.4 7.32
2001 4.6 4.55
2002 4.9 6.52
2003 5.4 10.20
2004 6.2 14.81
2005 7.2 16.13
2006 8.4 16.67
2007 9.8 16.67 ACGR
(%) 9.32 -

30
Table 13: Percentage Share of Imports of Services in India and World as per the
EBOPS Classification
*The figures are slightly different from that of the aggregate level due to different sources of database.
However, the RCA index has declined in the case of both the services,
although the fall in case of the former has been greater (Table 14). Banking and
financial sectors were moderately liberalised in the 1990s and India enjoyed a
comparative advantage in the imports of these services. The foreign banks and
financial service providers have displayed greater efficiency when compared to the
Indian service providers. The foreign audit forms in India for e.g., are much bigger in
terms of the number of accountants employed per firm. Indian audit firms on the
other hand are more fragmented. Similarly, the business generated per employee in
the case of foreign banks far exceeds that of the Indian banks because foreign banks
are mostly located in the urban centres in India. In fact, the non-performing assets of
Indian banks exceed those of the foreign banks (World Bank 2004).
Communication and construction services, on the other hand, have gained
comparative advantage since 2001. Many of these services were liberalised during
the 1990s and foreign direct investment norms were also eased. Telecommunication
services received the maximum liberalisation along with software services. In fact, in
case of the former, India went beyond its commitments in the GATS and
aggressively opened up the sector. As a result the sector received almost 19.70
percent of the total FDI approvals between 1991 and 2002. FDI inflows from
Sr.
No. Service
Description
2000 2001 2002 2003 2004 2005
India World India World India World India World India World India World
1 Transportation* 32.29 27.13 29.56 26.06 23.76 24.89 19.11 24.79 20.89 26.85 24.37 27.02
2 Travel* 25.45 30.82 25.70 29.76 24.26 29.25 29.56 28.69 24.16 29.09 21.17 28.42
3 Communication 1.15 2.20 3.15 2.33 7.01 2.27 6.34 2.27 3.40 1.96 2.66 2.00
4 Construction 1.51 1.50 4.41 1.65 9.63 1.70 6.06 1.65 3.30 1.70 2.81 1.76
5 Insurance 2.02 3.06 2.39 3.92 2.54 4.60 2.98 4.85 3.32 4.54 3.25 4.28
6 Financial 17.91 3.06 10.78 2.78 10.08 3.09 5.74 3.04 3.83 2.87 4.31 3.14
7 Computer and
Information 5.36 0.93 5.73 0.96 5.35 1.33 3.91 1.46 3.68 1.25 4.41 1.43
8 Royalties and
License Fees 2.13 6.11 3.08 6.19 2.56 6.26 3.64 6.61 3.28 6.67 2.40 6.38
9 Other Business
Services 9.28 21.08 12.80 22.21 13.16 22.32 20.93 22.25 33.68 20.82 34.29 21.33
10 Personal,
Cultural and Recreational
0.00 1.37 0.00 1.31 0.00 1.34 0.00 1.31 0.00 1.21 0.00 1.21
11 Government
Services, n.i.e. 2.90 2.73 2.41 2.84 1.66 2.95 1.74 3.08 0.47 3.04 0.32 3.03
Total 100.00 100.00 100.00 100.00 100.00 100.00 100.00 100.00 100.00 100.00 100.00 100.00

31
Table 14: RCA Index of India‟s Imports of Services as per the EBOPS
Classification (2000-2005) Service
Code
Sr.
No. Services
RCA Index
2000 2001 2002 2003 2004 2005
205 1 Transportation* 1.18 1.12 0.94 0.76 0.77 0.89
236 2 Travel* 0.82 0.86 0.82 1.02 0.82 0.73
245 3 Communications 0.52 1.34 3.04 2.76 1.71 1.31
249 4 Construction 0.99 2.65 5.59 3.63 1.91 1.58
253 5 Insurance 0.66 0.60 0.55 0.61 0.72 0.75
260 6 Financial 5.80 3.85 3.22 1.86 1.32 1.36
262 7 Computer and Information 5.79 5.97 4.03 2.67 2.94 3.08
266 8 Royalties and License Fees 0.35 0.49 0.40 0.54 0.49 0.37
268 9 Other Business Services 0.44 0.57 0.58 0.93 1.60 1.59
287 10 Personal, Cultural & Recreational 0.00 0.00 0.00 0.00 0.00 0.00
291 11 Government Services, n.i.e. 1.05 0.84 0.55 0.56 0.15 0.10 *The figures are slightly different from that of the aggregate level due to different sources of database.
Netherlands in the telecommunication sector between 1991 and 2007 have been
substantial. Out of the total FDI approvals from the Netherlands, 41.48 percent have
gone to this sector. Moreover, phenomenal growth in this sector led to an advantage
in the imports of construction services also, since these services include installation
services for telephone network equipment. India‟s imports of personal, cultural and
recreational services and government services are negligible and have stagnated in
general. Both export and import of government services has displayed a decreasing
trend.
5. CONCLUSIONS
India has emerged as a leading services provider in the post-reform period.
The paper thus attempts to assess the growth, composition and comparative
advantage of India‟s service trade for a 27 year period from 1980 to 2007. A
comparison is also made between the growth in services exports and imports in the
pre-reform and the post-reform period. Results suggest that services exports in the
post-reform period have witnessed tremendous growth in all the three categories. But
it is the OCS category which has led India‟s success story. A deeper probe into the
OCS category as per the EBOPS classification indicates the unparalleled importance
of computer services in India‟s export basket. However, India needs to spruce up
exports in other categories as well, since computer services form a small portion of
world exports. Along with OCS, India has displayed a comparative advantage in
exports of Other Business Services, construction and insurance services as well.
Hence, these are the service categories where India needs to diversify its attention.

32
As far as the import scene is concerned, India‟s share in world imports is
almost similar to its share in world exports. The growth in imports of services of all
the three categories in the post-reform period has also been higher. The imports of
travel and OCS have been above average for the entire 27 year period. Transportation
has seen below average growth, although India has a comparative advantage in
imports of the same. In terms of the EBOPS classification, transportation, travel and
other business services contribute significantly to the import bill. Communication
and construction services too are gaining ground in the import basket with India
displaying comparative advantage in their imports as well. The index of RCA in the
case of financial and computer services has seen some decline between 2000 and
2005. These are, hence, the service categories which need to be evaluated carefully
for further liberalisation.
The development in the Indian service sector is not a result of a well planned
program or a policy. The change in the global scene and other economic and political
factors are responsible for propelling the growth in India‟s service sector. India
definitely has the right elements for becoming the preferred service provider as
discussed in the present paper. This growth has helped India gain economic stability,
confidence and respect at the international level. Now it is crucial to develop a long
term perspective. Otherwise India will lose its sheen as a preferred service provider.
Where India‟s GDP has grown at 8.4 per cent during 2005-06 and its Services trade
balance in US $ 32727 million, it is imperative to improvise and remain innovative to
retain markets and maintain stability. India must develop marketability for higher-
end services. India needs to work for the recognition of its professional qualifications
like, law, medicine etc. at the international level. Indian graduates must gain
proficiency in other languages like Chinese, Spanish, and Japanese. India needs to be
more transparent in its system with lesser and reduced bureaucracy. Better
infrastructure for all sectors should be a priority. Reforms in the Intellectual Property
Act, data security and privacy protection will prove advantageous. To minimise the
effect of the slowdown of developed economies on the service sector, focused
attention is required to develop other sectors of services.

33
References
Balassa, Bela (1965). “Trade Liberalization and Revealed Comparative Advantage”,
Manchester School of Economic and Social Studies, No.33: 99-123.
Banga, Rashmi (2005). “Trade and Foreign Direct Investment in Services: A
Review”, Indian Council for Research on International Economic Relations
(ICRIER), Working Paper No. 154, New Delhi.
Batra, Amita and Zeba Khan (2005). “Revealed Comparative Advantage: An
Analysis for India and China”, Working Paper No. 168, Indian Council for
Research on International Economic Relations (ICRIER), August, New Delhi.
Baumol, William (1967). “Macroeconomics of Unbalanced Growth”, American
Economic Review, Vol. 57: 415-26.
Bhagwati, Jagdish (1984). “Splintering and Disembodiment of Services and
Developing Nations”, The World Economy: 133-143.
Boyce, J. (1986). “Kinked Exponential Models for Growth Rate Estimation”, Oxford
Bulletin of Economics and Statistics, Department of Economics, University of
Oxford, Vol. 48, No. 4, November: 385-391.
Commodity Online (2008). “Shipping Sector Attracts Least Investment in 2008”.
Retrieved on 15-12-08 from
http://www.commodityonline.com/news/Shipping-sector-attracts-least-
investment-in-2008-11628-3-1.html
Das, Kasturi (2006). “GATS Negotiations and India Evolution and State of Play”,
Centre for Trade and Development (CENTAD), New Delhi.
Dash, Shailey (2006). “Services Outsourcing: Evaluating Changes in Revealed
Comparative Advantage - The Case of the US and India”, Market Rx India Pvt.
Ltd., Paper presented at the Fourth International Conference on Globalization and
Sectoral Development. Retrieved on 30-03-08 from
http://papers.ssrn.com/sol3/papers.cfm?abstract_id=779005
Dash, Shailey (2005). “The Economic Implications of Outsourcing”, Market Rx India
Pvt. Ltd, Social Site Research Network (SSRN), Social Science Electronic
Publishing. Retrieved on 30-03-08 from
http://papers.ssrn.com/sol3/papers.cfm?abstract_id=779005
Deardorff, Alan (2005). “How Robust is Comparative Advantage?”, Review of
International Economics, Vol. 13, No. 5: 1004-1016, Department of Economics,
University of Michigan, USA.
Friedman Thomas (2005). The World is Flat, Penguin Books, London.
34
Gordon Jim and Poonam Gupta (2003). “Understanding India's Services Revolution”,
International Monetary Fund- NCAER Conference on ‘A Tale of Two Giants:
India’s and China’s Experience with Reform’, November 14-16, New Delhi.
Government of India (2001). Census of India 2001, Ministry of Home Affairs, New
Delhi.
http://www.censusindia.net
Government of India (2008a). Economic Survey 2007-08, Ministry of Finance,
Economic Division, New Delhi.
Government of India (2008b). “Future Strategy for Tourism Development”, Annual
Report 2007-08, Ministry of Tourism, Government of India.
Government of India (2009). “Strategy for India‟s Services Sector: Broad Contours”,
Ministry of Finance, Working Paper 1, New Delhi.
http://www.esocialsciences.com/data/articles/Document11812008260.2728235.pdf
Hill, T. P. (1977). “On Goods and Services”, Review of Income and Wealth, Vol. 23
(4): 315-38, December.
Hoekman, Bernard (2006). “Liberalizing Trade in Services: A Survey”, World Bank-
Development Research Group (DECRG); Policy Research Working Paper No.
4030, Centre for Economic Policy Research (CEPR).
Hoekman, Bernard (2000). “The Next Round of Service Negotiations: Identifying
Priorities and Options”, Federal Reserve Bank of St. Louis, Economic Review,
July-August: 315-38.
IMF (2001a). “Balance of Payment Statistics Year Book”, International Monetary
Fund, Washington D. C. (Various Issues).
IMF (2001b). “International Financial Statistics”, International Monetary Fund,
Washington D. C. (Various Issues).
Indiastat (2009a). “Foreign Tourists Arrival in India”, Datanet India Pvt. Ltd., New
Delhi. Retrieved on 23-07-09 from
http://www.indiastat.com/tourism/29/foreigntourists/280/398502/data.aspx
Indiastat (2009b). “Indian Nationals Going Abroad”, Datanet India Pvt. Ltd., New
Delhi. Retrieved on 10-05-09 from
http://www.indiastat.com/table/tourism/29/outboundtourists/49894/283722/data.a
spx
Indobase (2009). BPO: Why India: Cost-Effective, Retrieved on 18-05-09 from
http://www.indobase.com/why-india/cost-effective.html
Karmakar, Suparna (2005). “India–ASEAN Cooperation in Services – An
Overview”, Indian Council for Research on International Economic Relations
(ICRIER), Working Paper No. 176, New Delhi.
35
Kumar, Pranav (2005). “Services Negotiations in the Doha Round: Concerns of
South Asia”, World Development Indicators, Presented on 9-10 March, World
Bank, Colombo.
Langhammer, R. (2004). “Revealed Comparative Advantages in the Services Trade
of the United States, the European Union and Japan: What Do They Tell Us?”,
The Journal of World Investment & Trade, Vol. 5: 887-896.
Makoto, Hisanaga (2007). “Comparative Advantage Structure of U.S. International
Services”, Kyoto Institute of Economic Research, Discussion Paper No. 633,
Kyoto University, Japan.
Marcelo, Ray (2003). “India Fosters Growing: Medical Tourism Sector”, The
Financial Times. Retrieved on 02-07-08, from
http://yaleglobal.yale.edu/display.article?id=2016
Rajeev, Meenakshi and B. P. Vani (2008). “Services Trade and IT-enabled Services:
A Case Study of India”, Department of International Economics, Working Paper
No. 733, Norwegian Institute of International Affairs, Institute of Social and
Economic Change, Bangalore, India.
Reserve Bank of India (2006-07). Handbook of Statistics on the Indian Economy,
Reserve Bank of India, Mumbai.
Ricardo, David (1817). On the Principles of Political Economy and Taxation,
McMaster University, Canada.
Seyoum, B. (2007). “Revealed Comparative Advantage and Competitiveness in
Services: A Study with Special Emphasis on Developing Countries”, Journal of
Economic Studies, Vol. 34, No.5: 376-388.
Smith, A. D. (1992). International Financial Markets: The Performance of Britain
and its Rivals, Cambridge University Press, London.
Takatoshi, Itō and Anne O. Krueger (2003). “Trade in Services in the Asia-Pacific
Region”, NBER-EASE, Vol.11, University of Chicago Press Telecommunication.
The Economic Times (2009). “Monthly income of average Indian crosses Rs 3000:
CSO”, 29th
May, The Economic Times, Retrieved on 27-07-09 from
http://economictimes.indiatimes.com/articleshow/4593918.
United Nations (2002). “Manual on Statistics of International Trade in Services”,
EC, IMF, OECD, UNCTD and WTO, Department of Economics and Social
Affair, Statistic Division Services, Manual No. 86, New York.
United Nations (2008). “UN Service Trade Database”, Retrieved on 14-08-08 from
http://unstats.un.org/unsd/servicetrade/default.aspx
UNCTAD (2007). “Review of Maritime Transport”, Report by UNCTAD
Secretariat, United Nation Conference on Trade and Development, Geneva.
36
World Bank (2004). Sustaining India’s Services Revolution: Market Access,
Domestic Reform and International Negotiations, June 14, Washington, D. C.:
World Bank, Retrieved on 15-1208 from
http://www.ficci.com/media-room/speeches-presentations/2004/june14-wto.pdf
World Economic Forum (2008). “The Travel and Tourism Competitiveness Report
2008”, World Economic Forum, Geneva. Retrieved on 15-12-08 from
http://www.weforum.org/pdf/TTCR09/TTCR09_Rankings.pdf.
WTO (2001). “Share of Goods and Commercial Services in the Total Trade of
Selected Regions and Economies”, Table 1.8, International Trade Statistics,
Switzerland. Retrieved on 07-10-08 from
http://www.wto.org/english/res_e/statis_e/its2002_e/its02_overview_e.htm.
WTO (2007). “Leading Exporters and Importers of Transportation Services 2006”,
Table III 4, International Trade Statistics, Switzerland. Retrieved on 04-12-08
from http://www.wto.org/english/res_e/statis_e/statis_e.htm