green co · pdf fileindia’s biggest sea port for exports ... gad supplier cluster -...
TRANSCRIPT
Green Co Summit
17th June 2016, Hyderabad
Shree Ashtavinayak Glass Pvt.Ltd(A Toughened Glass Unit)
Works :-Gat No.216,Dhawadwadi Road, Khandala, Dist:- Satara-412802.
Maharashtra, India.
Tel: +91 2169 252906
Website: www.saglass.in

Company Profile
• Established in 2009
• Evolution from Glass Trading to Glass
Processing.
• Unique combination catering
architecture, white goods and
automobile segment
• State of art plant located in rural
Maharashtra giving employment to
rural people for avoiding urbanization
• An ISO 9001:2015,14001,18001
company
• Proximity to Western, Central and
Southern India. Just 200 Km from
India’s biggest Sea port for Exports
• Experienced, enthusiastic and
innovative team
3.5
16 17.526.5
32
43 44.5
01020304050
Turnover (Rs. Cr)
16%
73%80%
66%80% 78% 81%
0%
20%
40%
60%
80%
100%
Capacity Utilization

Products & Customers
Tempered Glass Double Glazed Glass Laminated Glass
Ceramic Frit Glass Mirror

Vision - Build the best product, surpass stakeholder expectations, inspire business to protect environment.
Mission - To attract and attain customers with high quality products and services.
Values -– Customer orientation– Be the Change you seek– Simplify– Co Exist
Culture by Choice
VISION,
MISSION,
VALUES

Preferred Vendor
Successful completion of GAD Supplier Cluster - 2014
Best Supplier (Green Supply Chain) - 2015
Green Initiative Regional Champion (West)
Saint-Gobain 350 years celebration at Bali - 2015
Best Support : Localization 2016
Best Support : Green Journey 2016

Active Participants
CII 8th National Cluster Summit - 2015
CII Energy Management - 2014
CII Green Conclave - 2015
Go Green : Sustainable Supply Chain- 2015
Championship Award Green Manufacturing - MSME
CII 8th National Cluster Summit - 2015

The Starting Point

Lean SAG
Place for everything & everything at it’s place
Well organised Quality labShadow board for tool Designated area for trolley parking
Hospital clean inside, Garden Green outside
Journey towards Waste Management & Control

Green SAG
Transparent sheets for roofing at regular intervals
Bio-Gas Plant
Induction LampsWind Turbine
Sprinklers for watering lawns in garden
Drip irrigation for garden
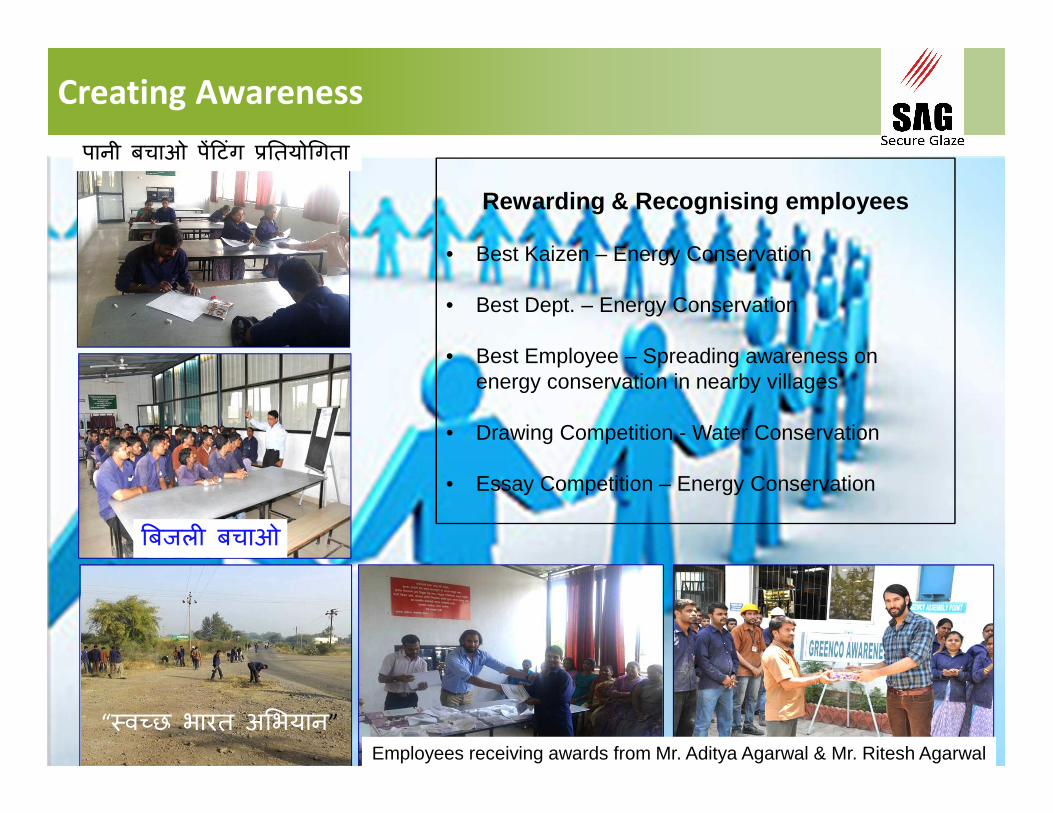
Creating Awareness
Rewarding & Recognising employees
• Best Kaizen – Energy Conservation
• Best Dept. – Energy Conservation
• Best Employee – Spreading awareness on energy conservation in nearby villages
• Drawing Competition - Water Conservation
• Essay Competition – Energy Conservation
“�व�छ भारत अ�भयान”
पानी बचाओ प��टगं ��तयो�गता
�बजल� बचाओ
Employees receiving awards from Mr. Aditya Agarwal & Mr. Ritesh Agarwal

Encouraging Green
Best Green kaizen Award at the CII 8 th
National Cluster Summit - 2015

What prompted for Green Co???
• Green means
– Maximize resource utilization
– Pushes to evolve continuously
– Builds competitiveness
– Adds new customer
Green makes Business Sense

Green Vision
Green Vision
Waste Reduction
Green Products
RoHS Compliant Products &Processes
Zero waste to landfill
Energy Conservation
Water Conservation
SAG will strive to be the benchmark for
fresh water consumption in the Glass
processing industry.
Green Policy derived from Green Vision
SAG will strive to be the benchmark for
electrical consumption in the Glass
processing industry.


Energy Conservation
Changing location of lamps reduced wattage from 160 to 30
Screw Compressor instead of Reciprocating Compressor
VFD for Furnace blower
Use of renewable source of energy (Solar Power)
Reduction in Induction Lamps height on shop floor
Height 35 feet 200W
Lux 134
Height 20 feet 100W
Lux 150
Additional 2 switches to stop compressor air flow.
Previously Only one switch
Two switches makes
ease to switch off air
immediately
Two switches makes
ease to switch off air
immediately

Energy Conservation
SN
Initiative Benefit YearInvestment
(Rs.)ROI (Yrs)
1 VFD’s for furnace blowerEnergy Savings –80000 kWh / Year
2014 Rs.25 Lacs 1.5
2Screw Compressor instead of Reciprocating Compressor
Energy Savings –30000 kWh / Year
2015 Rs.12 Lacs 4.5
3Use of renewable source of energy – Installation of 225 kW solar panel on roof top
Energy generation - Avg. 1000 kWh / day
2016 Rs.160 Lacs 9
4
Height reduction of induction lamps from 35 feet to 20 feet with reduction in wattage from 200 W to 100W
Energy savings –6864 kWh / Year
2016Rs.2.20
Lacs4.0
5Location change of lamps forreducing consumption wattage and improving LUX.
Energy Savings –517 kWh / Year
2016 Rs.1000 0.3
6
Installation of additional switches for stopping compressor immediately after finishing work.There are 250 cycles in 24 hours, saving of 1 min per cycle
Energy Savings –2859 kWh / Year
2016 Rs.220 4 Days

Benchmarking
** Source – Saint Gobain India Pvt. Ltd
0.68
0.77
0.71 0.710.73
0.710.74
0.720.68
0.67 0.65 0.66
0.3
0.4
0.5
0.6
0.7
0.8
Apr'15 May'15 Jun'15 Jul'15 Aug'15 Sep'15 Oct'15 Nov'15 Dec'15 Jan'16 Feb'16 Mar'16
Ene
rgy
(kW
h / m
m*
sq m
tr)
Month
Benchmark for Energy Consumption by Tempering Furna ce( kWh / mm * sq m )
SAG Benchmark

Energy Conservation


Water balance diagram
Fresh Water Intake ( 625 KL )
Bore well
Process DM(57 KL)
Domestic(151 KL)
Garden / Farm(317 KL)
Process Others(338 KL)
Toilet(106 KL)
RO Drinking(38 KL)
Grinding m/c
(260KL )
Washing m/c(170KL)
Bio Gas ETP
Unmonitored(41 KL)
Washroom(135 KL)
Canteen(16 KL)
94% water consumption monitored through 11 water meters
Almost 97%
water reused

Water Conservation
ETP of 15 M3 / Day
Eco- Urinal blocksWater channelizing
through trays
Use of flucoolant for grinding
Push Type Taps
New age WM

Water Conservation
SN Project YearWater Consumption
(kl)Reductionachieved
Investment in (Rs. Lacs.)
ROI (Yrs.)
Before After
1Flocculent for
reuse of water in Grinding machines
2014 5292 1764 66% 2.1 1.5
2 Installation of ETP 2014 8892 6250 30% 6.5 2.5
3 New age WM 2015 250 101 60% - -
4 Tray for water channelizing
2015 16 1.5 90% - -
5
Restructuring of water flow to
improve water balance
2016 430 423 97% 1.5 0.6
6 Push Type Taps 2016 28 14 50% 0.1 1.5
7Eco urinal blocks
for urinals 2016 120 0 100% 0.05 1
Savings worth Rs.7 lacs

Rain Water harvesting
Use of rain water for Process & Domestic
Roof top of main
building
Roof top rain water to
underground tank
Tank overflow water to Rain water harvesting pit
Rain water collected in tank
to Process & Domestic
Underground Tank
Replaced chillier water to
tank
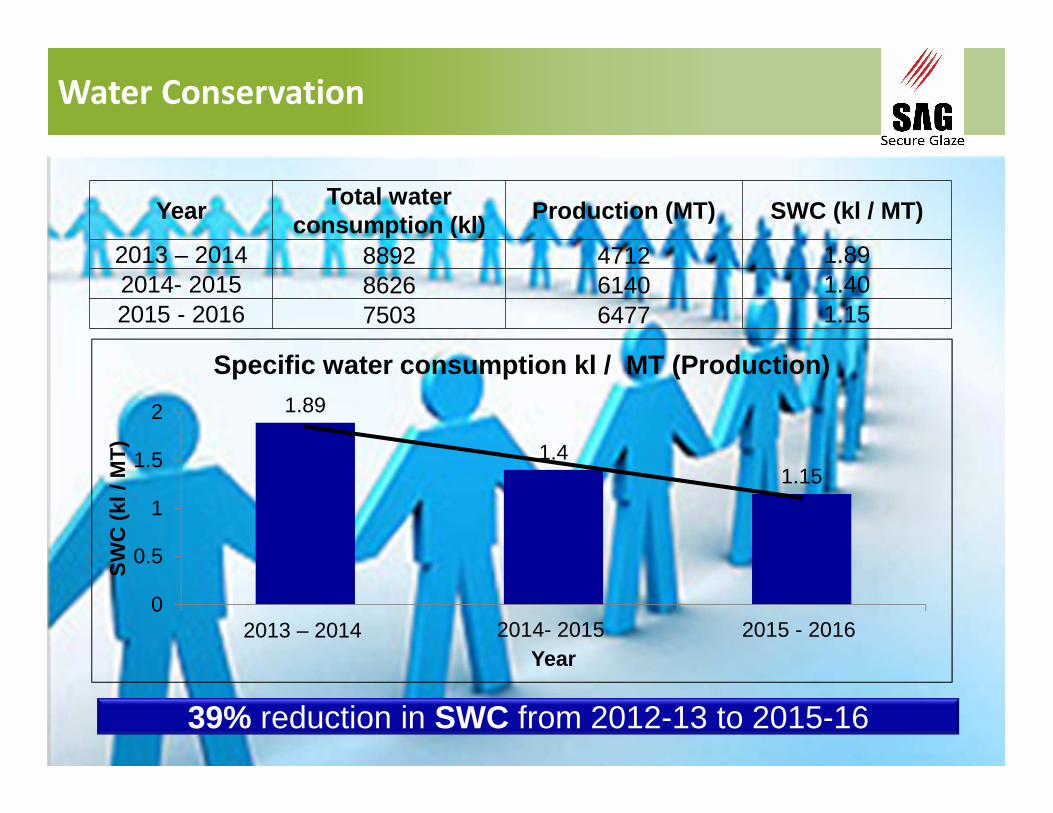
Water Conservation
39% reduction in SWC from 2012-13 to 2015-16
Year Total water
consumption (kl) Production (MT) SWC (kl / MT)
2013 – 2014 8892 4712 1.892014- 2015 8626 6140 1.402015 - 2016 7503 6477 1.15
1.89
1.41.15
0
0.5
1
1.5
2
2013 – 2014 2014- 2015 2015 - 2016
SW
C (
kl /
MT
)
Year
Specific water consumption kl / MT (Production)

Beyond the fence
Tree plantation inside factory premises
Tree plantation outside factory premises Farming in open area
Poly House
Monitoring & controlling parameters
Awareness Program in nearby villages
Construction of “Bund” at village - Salav for collecting rainwater (Capacity – 12 Lacs Litre)


Renewable Energy
Solar Power Generating electricity 3,28,500 kWh / Year
Bio Gas Generating cooking gas912 kg gas / Year
• PPA contract for 5 MW Green Power signed with Lean Way Energy on 20.05.2016
• Use of 100% Green Power from Aug’2016.
17%
83%
Renewable Energy Non-renewable Energy

Beyond the fence
� Installation of 20 Nos. of Bio Gas Plant in Village – Salav
� Methane gas generated from Bio Gas plant is utilised by 50 families
� Generation of gas – 10950 kg / Year
Equivalent Energy Generation through Bio- Gas Plant - 18615 kWh / Year

Future is Renewable
Projects Budget Allocation
(Rs. Lacs)
Short Term Plan(Up to Year 16-17)
1. Use of alternate fuel for generators.
2. Installation of 10 more Bio Gas plants in nearby villages.
170
Mid Term Plan(Up to Year 18-20)
1. Roof top solar power generation system for new manufacturing facility (2000 kWh / day).
2. 2nd Bio Gas plant in factory.3. Installation of additional 20 Bio
Gas plant in nearby villages.
325
Long Term Plan(Up to Year 22-23)
1. Power Purchase Agreement (PPA)2. Installation of 50 biogas plants in
nearby villages.48


GHG
Development of trolley for optimization of GAD glass
loading
Transport optimization of schindler mirror glasses
Milk Run for Customer Delivery
5,5675,180
4,141
0
1000
2000
3000
4000
5000
6000
GH
G E
mis
sion
(M
T)
26% Reduction in GHG emission intensity
Localisation Distance Reduction
Glass from
Saint Gobain
Chennai to Jagadiya –
529 km
Glass from
Asahi
Roorkie to Talojia –
1498 km
Molecular
Sieve for DGU
Silvasa to Talojia –
179 km

Waste Management

Create decorative/
innovative products
from waste
Waste Management & Control

• Waste food from canteen
• Human Waste
Waste
• Generation of Methane Gas for cooking food.
Bio Gas Plant • Used as organic
fertilizer for garden & farm
Slurry – Bio Gas Plant
Effluent System
Sewage System
Zero Water Discharge

Non – hazardous waste
100% Reuse of ETP sludge for making bricks Recycling wooden scrap for making
Exports consignment
Vermicomposting / De-composting
Green House from recyclable & waste
material
Organic fertilizer from Bio Gas Plant

Waste management
699597
443
0
200
400
600
800
2013-14 2014-15 2015-16
Was
te (
kg)
Year
Hazardous Waste Reduction
243211 192
0
100
200
300
2013-14 2014-15 2015-16Was
te (
Kg
/ MT
)
Year
Non - Hazardous Waste Reduction
Material Conservation Recycling & Recyclability
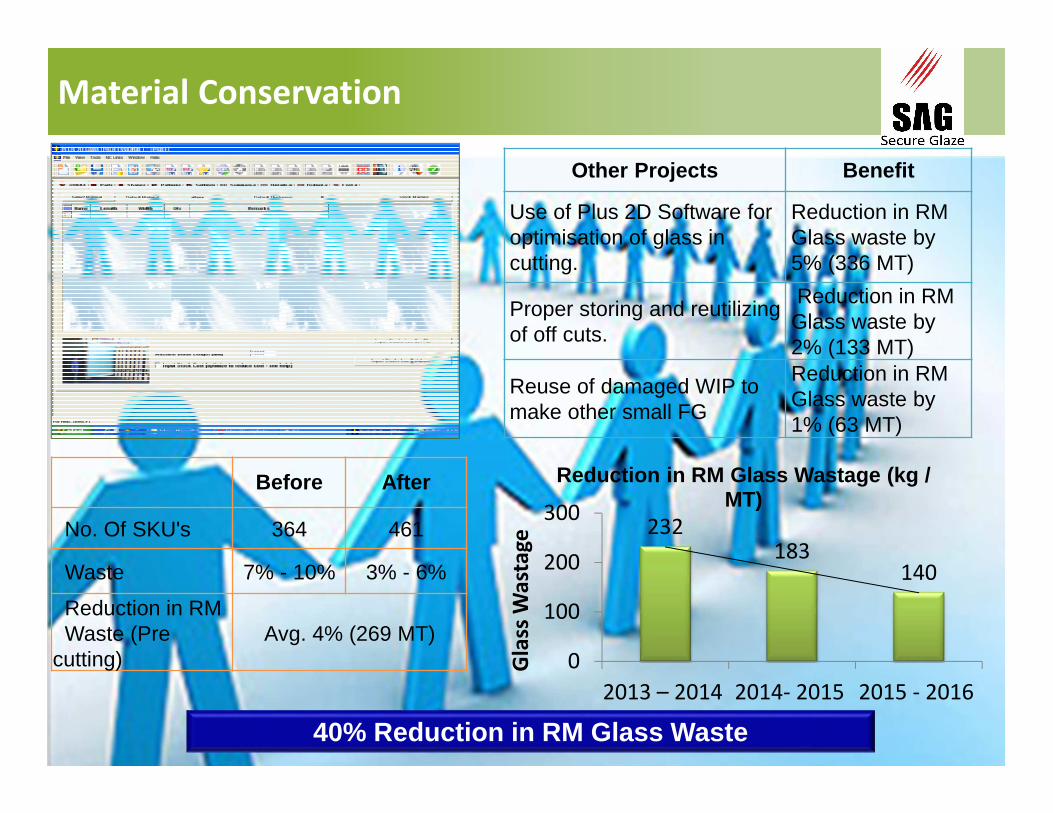
Material Conservation
Other Projects Benefit
Use of Plus 2D Software for optimisation of glass in cutting.
Reduction in RM Glass waste by 5% (336 MT)
Proper storing and reutilizing of off cuts.
Reduction in RM Glass waste by 2% (133 MT)
Reuse of damaged WIP to make other small FG
Reduction in RM Glass waste by 1% (63 MT)
232183
140
0
100
200
300
2013 – 2014 2014- 2015 2015 - 2016
Gla
ss W
ast
ag
e
Reduction in RM Glass Wastage (kg / MT)
40% Reduction in RM Glass Waste
Before After
No. Of SKU's 364 461
Waste 7% - 10% 3% - 6%
Reduction in RM Waste (Pre
cutting)Avg. 4% (269 MT)

Consumable & Packaging
40% unused polishing wheel Bonding of two used polishing wheels togetherUsed polishing wheels
Recycling brown paper for packing reflective glasses
Recycling wooden scrap for making Exports consignment
Trolleys with rubber pads in place of paper.

Green Supply Chain

Green Purchase Guidelines
Benefits –
� Production – 400%� Electricity – 25%� Water – 50%
Machine –Edge GrindingMake - SK Glass, Delhi
Machine – Edge GrindingMake – Golive, China
Machine - WashingMake – BSJ, China
Machine - WashingMake – Bentler, Germany
� Production – 50%� Electricity – 21%� Water – 50%
Capital Goods
� Production – 40%� Electricity – 12%� Water – 0%

Green Purchase Guidelines
Procurement of Environment Friendly Consumable Products
Metal Bonded Wheels with extended life
Environment friendly Aerosol Spray AC 90
Non lead based ink for glass printing
Low VOC Silicon for DGU
Environment friendly housekeeping material
Environment friendly molecular sieve for DGU
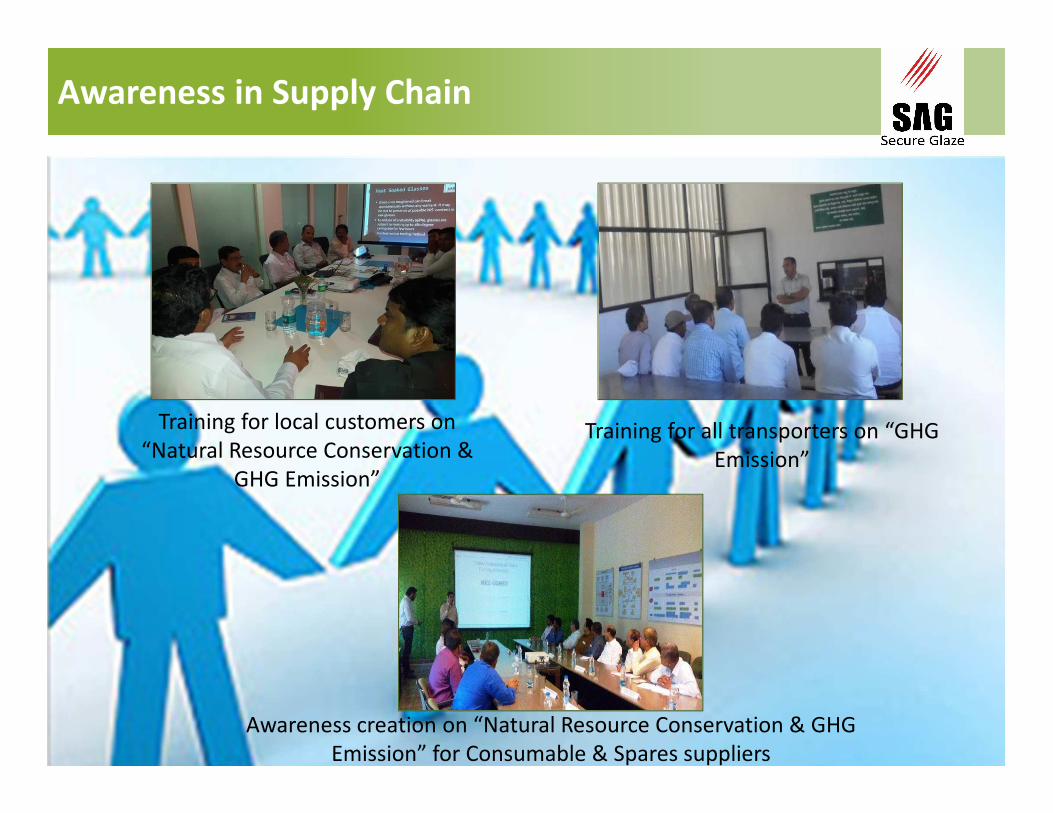
Awareness in Supply Chain
Training for local customers on
“Natural Resource Conservation &
GHG Emission”
Training for all transporters on “GHG
Emission”
Awareness creation on “Natural Resource Conservation & GHG
Emission” for Consumable & Spares suppliers


Maintaining Bio-diversity
Tree plantation inside factory premises
Tree plantation outside factory premises Farming in open area
Poly House
Monitoring & controlling parameters
Awareness Program in nearby villages
List of Key Initiatives for Maintain Bio-diversity
� Tree Plantation – plantation of 305 nos. of trees inside the factory & @ 28,000 Nos. in nearby area outside factory
� Farming on 1.5 acres open land inside the factory
� Development of poly house from waste
� Monitoring & controlling environment parameters inside and outside the plant like air quality, noise and stack emission.
� Awareness program for near by villages

Achievement…

Green Co Certification
Awarded “Platinum Rating” with a score of around 600 points
Score Card Benchmark Score
across all
categories

Thank you