individual differences in phoneme categorization
TRANSCRIPT

Individual differences in phoneme categorization
Effie Kapnoula, Bob McMurray, Eunjong Kong, Matthew Winn, & Jan Edwards
19th Mid-Continental Phonetics & Phonology Conference

The problem of lack of invariance• There is no one-to-one relation between a sound (i.e. formant
frequencies) and the perceived phoneme
Hillenbrand, Getty, Clark & Wheeler, 19952

The problem of lack of invariance• There is no one-to-one relation between a sound (i.e. formant
frequencies) and the perceived phoneme
• One solution: categorical perception
3

The problem of lack of invariance• There is no one-to-one relation between a sound (i.e. formant
frequencies) and the perceived phoneme
• One solution: categorical perception
bar par
1 2 3 4 5 6 7
par
bar
4

The problem of lack of invariance• There is no one-to-one relation between a sound (i.e. formant
frequencies) and the perceived phoneme
• One solution: categorical perception+Simple solution+Fast commitment bar par
1 2 3 4 5 6 7
par
bar
5

Two alternative forced choice (2AFC)
Werker & Tees, 1987; Joanisse et al, 2000; López-Zamora et al, 20106

The problem of lack of invariance• There is no one-to-one relation between a sound (i.e. formant
transitions) and the perceived phoneme
• One solution: categorical perception+Simple solution+Fast commitment
• Alternative: gradient perception
bar par
1 2 3 4 5 6 7
par
bar
bar par
1 2 3 4 5 6 7
par
bar
7

The problem of lack of invariance• There is no one-to-one relation between a sound (i.e. formant
transitions) and the perceived phoneme
• One solution: categorical perception+Simple solution+Fast commitment
• Alternative: gradient perception +Flexibility +Late commitment+Keep useful within-category information
bar par
1 2 3 4 5 6 7
par
bar
bar par
1 2 3 4 5 6 7
par
bar
8
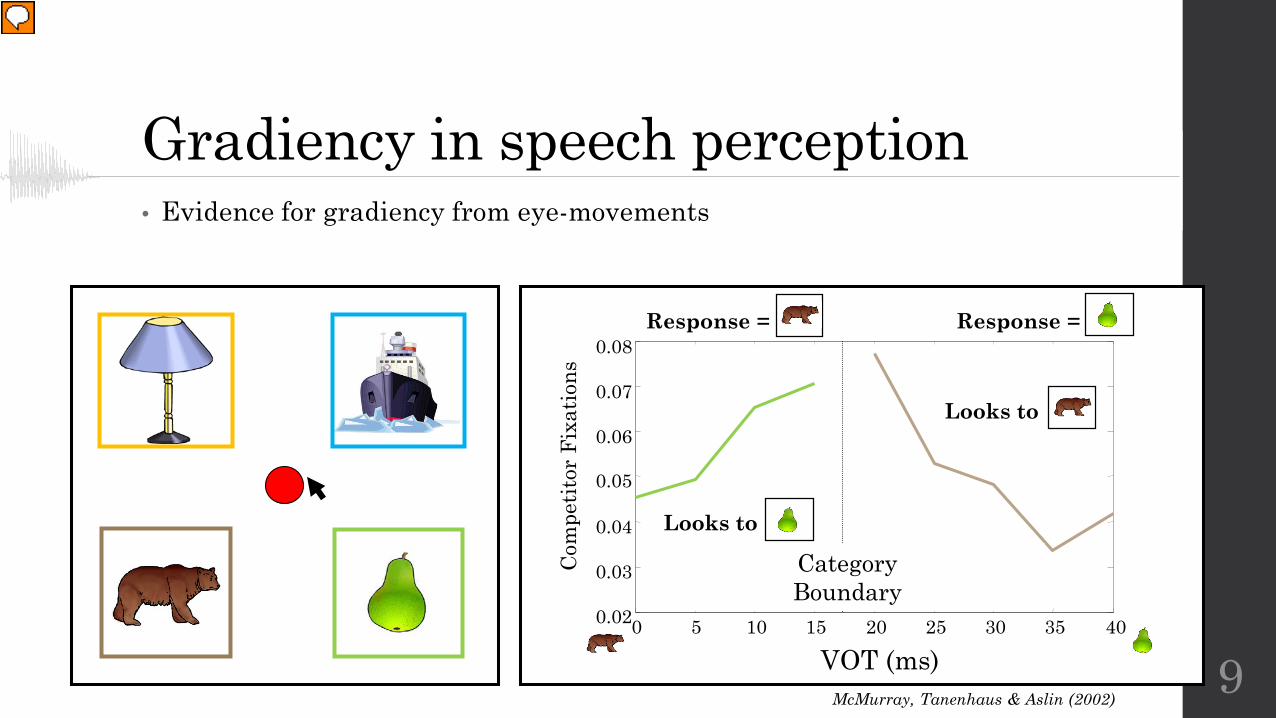
Gradiency in speech perception
0 5 10 15 20 25 30 35 400.02
0.03
0.04
0.05
0.06
0.07
0.08
VOT (ms)
CategoryBoundary
Response = Response =
Looks to
Looks to
Com
petit
or F
ixat
ions
McMurray, Tanenhaus & Aslin (2002)
• Evidence for gradiency from eye-movements
9

Two alternative forced choice (2AFC) • Is gradiency good or bad for speech perception?
Werker & Tees, 1987; Joanisse et al, 2000; López-Zamora et al, 2010
?10

Gradiency in speech perception
bull pull
bull• Measuring gradiency: Visual analog scaling (VAS) task
11

Gradiency in speech perception
Kong, E. J., & Edwards, J. (2011)12

Gradiency in speech perception
Kong, E. J., & Edwards, J. (2011)13

• Summary points: Listeners are capable of gradient categorization of phonemes The VAS task allows for this gradiency to be expressed in participants’ responses
Summary and aims
14

• Summary points: Listeners are capable of gradient categorization of phonemes The VAS task allows for this gradiency to be expressed in participants’ responses
• Where does gradiency come from? Is it good or bad for speech perception?
Summary and aims
15

• Summary points: Listeners are capable of gradient categorization of phonemes The VAS task allows for this gradiency to be expressed in participants’ responses
• Where does gradiency come from? Is it good or bad for speech perception?
Establish a way of quantifying gradiency via the VAS task
Summary and aims
16

• Summary points: Listeners are capable of gradient categorization of phonemes The VAS task allows for this gradiency to be expressed in participants’ responses
• Where does gradiency come from? Is it good or bad for speech perception?
Establish a way of quantifying gradiency via the VAS task
1. Investigate possible sources of gradiency (e.g. executive function)
2. Link gradiency to multiple cue use
3. Examine whether gradiency is good or bad for speech perception
Summary and aims
17

• Stimuli:
• Seven (7) VOT steps (primary cue) and five (5) F0 steps (secondary cue)
Methodlabial alveolar
Real words bull-pull den-tenNonwords buv-puv dev-tevCVs buh-puh deh-teh
F0 s
teps
54321
1 2 3 4 5 6 7VOT steps
18

• Stimuli:
• Seven (7) VOT steps (primary cue) and five (5) F0 steps (secondary cue)
• Tasks:• Visual analog scaling (VAS) task
• Two alternative forced choice (2AFC)
Methodlabial alveolar
Real words bull-pull den-tenNonwords buv-puv dev-tevCVs buh-puh deh-teh
bull pull
pullbull
19

• Additional tasks:
Trail making task (cognitive flexibility)
N-Back task (working memory)
Flanker task (inhibition)
Method
non-speech cognitive processes
20

• Additional tasks:
Trail making task (cognitive flexibility)
N-Back task (working memory)
Flanker task (inhibition)
AZ-bio (sentences in babbling noise - 1:1 STN ratio)
Method
non-speech cognitive processes
21

• Additional tasks:
Trail making task (cognitive flexibility)
N-Back task (working memory)
Flanker task (inhibition)
AZ-bio (sentences in babbling noise - 1:1 STN ratio)
• Participants: 130 undergraduates at the U of Iowa
Method
non-speech cognitive processes
22

Results
23
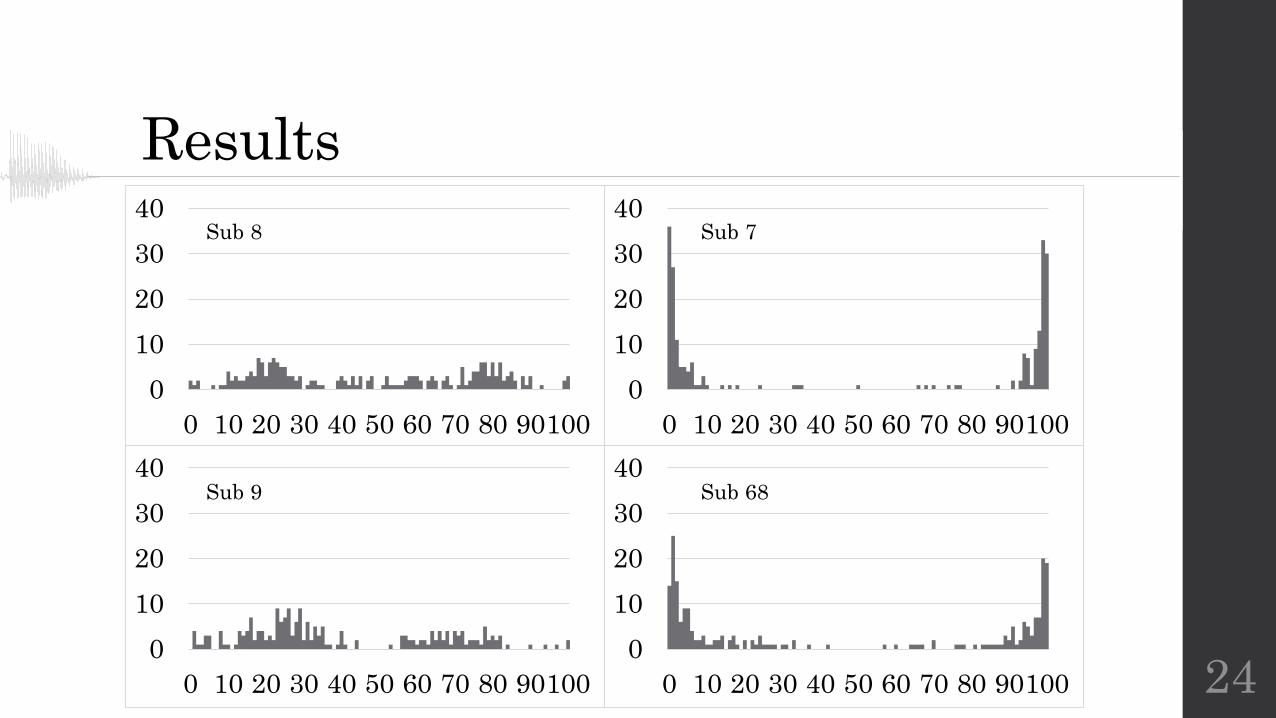
Results
010203040
0 10 20 30 40 50 60 70 80 90100
010203040
0 10 20 30 40 50 60 70 80 90100
010203040
0 10 20 30 40 50 60 70 80 90100
010203040
0 10 20 30 40 50 60 70 80 90100
Sub 8
Sub 9
Sub 7
Sub 68
24

Results: Quantifying gradiency
25

Results: Quantifying gradiency• Extracting gradiency from VAS data
F0 s
teps
54321
1 2 3 4 5 6 7VOT steps
F0 s
teps
54321
1 2 3 4 5 6 7VOT steps
VOT steps
F0 s
teps
θ
s
VOT steps
F0 s
teps
θ
s
26

Results: Quantifying gradiency• Extracting gradiency from VAS data
F0 s
teps
54321
1 2 3 4 5 6 7VOT steps
F0 s
teps
54321
1 2 3 4 5 6 7VOT steps
VOT steps
F0 s
teps
θ
s
VOT steps
F0 s
teps
θ
s
Steep s slope
Shallow s slopegradient
categorical
27

Results: Quantifying secondary cue use• Extracting F0 use from 2AFC data
0
0.2
0.4
0.6
0.8
1
1 2 3 4 5 6 7
b
2AFC
resp
onse
p
VOT step
12F0 = 90 hZF0 = 125 hZ
28

Results
29

Results: Stimulus and place effects
0
20
40
60
80
100
1 2 3 4 5 6 7b
VA
S re
spon
se
p
VOT step
NPNWRW
0
0.2
0.4
0.6
0.8
1
1 2 3 4 5 6 7
b
2A
FC
res
pons
e
p
VOT step
Real words
0
0.2
0.4
0.6
0.8
1
1 2 3 4 5 6 7b
2AF
C r
espo
nse
pVOT step
Nonwords
0
0.2
0.4
0.6
0.8
1
1 2 3 4 5 6 7
b
2A
FC
res
pons
e
p
VOT step
CVs
90hZ 125hZ
0
20
40
60
80
100
1 2 3 4 5 6 7b
V
AS
resp
onse
p
VOT step
alvlab
30

Results: Stimulus and place effects
0
0.2
0.4
0.6
0.8
1
1 2 3 4 5 6 7
b
2A
FC
res
pons
e
p
VOT step
Real words
0
0.2
0.4
0.6
0.8
1
1 2 3 4 5 6 7b
2AF
C r
espo
nse
pVOT step
Nonwords
0
0.2
0.4
0.6
0.8
1
1 2 3 4 5 6 7
b
2A
FC
res
pons
e
p
VOT step
CVs
90hZ 125hZ
0
20
40
60
80
100
1 2 3 4 5 6 7b
VA
S re
spon
se
p
VOT step
NPNWRW
0
20
40
60
80
100
1 2 3 4 5 6 7b
V
AS
resp
onse
p
VOT step
alvlab
F<1
F<1
31

Results: Place differences in F0 useF(1,250) = 27.8, p < 0.001
0
0.2
0.4
0.6
0.8
1
1 2 3 4 5 6 7
b
2A
FC r
espo
nse
p
VOT step
Labials
0
0.2
0.4
0.6
0.8
1
1 2 3 4 5 6 7VOT step
Alveolars
1590hZ 125hZ
32

Results1. Do individual differences in gradiency derive from differences in
general cognitive function?
33

Results1. Do individual differences in gradiency derive from differences in
general cognitive function?
EF measures did not account for a statistically significant amount of variance in VAS slope, F(3,108)=1.75, p=.162, or F0 use, F<0
gradient
categorical
gradient
categorical
gradient
categorical
34

Results1. Do individual differences in gradiency derive from differences in
general cognitive function?
EF measures did not account for a statistically significant amount of variance in VAS slope, F(3,108)=1.75, p=.162, or F0 use, F<0
Speech perception processes may be played out on a different level of processing than higher cognitive processes, such as working memory
35

Results1. Do individual differences in gradiency derive from differences in
general cognitive function?
2. Are individual differences in gradiency linked to multiple cue use?
36

Results1. Do individual differences in gradiency derive from differences in
general cognitive function?
2. Are individual differences in gradiency linked to multiple cue use?
Positive relationship: Better encoding of fine-grained detail (more gradiency) enables access to multiple cues
Negative relationship: Listeners who use more cues have more accurate, sharper boundaries
37

Resultsβ=-0.305, t=-3.4, p < 0.01
gradient
categorical
38

Results1. Do individual differences in gradiency derive from differences in
general cognitive function?
2. Are individual differences in gradiency linked to multiple cue use?
Positive relationship: Better encoding of fine-grained detail (more gradiency) enables access to multiple cues
Negative relationship: Listeners who use more cues have more accurate, sharper boundaries
39

Results1. Do individual differences in gradiency derive from differences in
general cognitive function?
2. Are individual differences in gradiency linked to multiple cue use?
3. In what way are these differences important for speech perception?
40

Results• Gradiency and perception of speech-in-noise
r = .164, p=.068
gradientcategorical
41
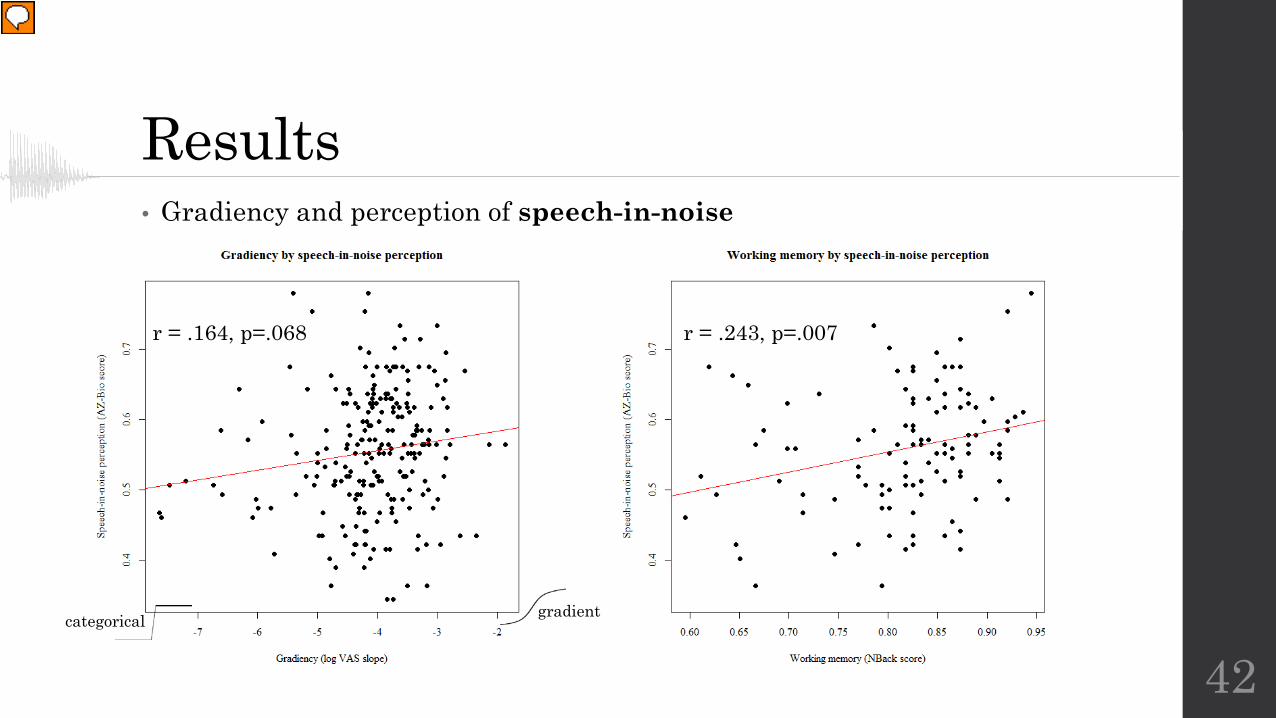
Results• Gradiency and perception of speech-in-noise
r = .243, p=.007r = .164, p=.068
gradientcategorical
42

Results• Gradiency and perception of speech-in-noise
Gradiency Speech-in-noise
Gradiency Speech-in-noise
Working Memory
1)
2)
43

Results• Gradiency and perception of speech-in-noise
R2 = 0.019
β=-0.14, t=-1.48, p = .143
categorical gradient
44

Results• Gradiency and perception of speech-in-noise
Gradiency Speech-in-noise
Gradiency Speech-in-noise
Working Memory
1)
2)
45

Results1. Do individual differences in gradiency derive from differences in
general cognitive function?
2. Are individual differences in gradiency linked to multiple cue use?
3. In what way are these differences important for speech perception?
More gradient listeners tend to better perceive speech in noise
46

Summary and conclusions1. Do individual differences in gradiency derive from differences in
general cognitive function? Probably not. Maybe speech perception operates on a different level than higher cognitive processes.
47

Summary and conclusions1. Do individual differences in gradiency derive from differences in
general cognitive function? Probably not. Maybe speech perception operates on a different level than higher cognitive processes.
2. Are individual differences in gradiency linked to multiple cue use? Yes, more gradient listeners tend to rely more on the secondary cue (F0). Better encoding of fine-grained detail (more gradiency) enables access to multiple cues. And/or more gradient listeners commit later to a category.
48

Summary and conclusions1. Do individual differences in gradiency derive from differences in
general cognitive function? Probably not. Maybe speech perception operates on a different level than higher cognitive processes.
2. Are individual differences in gradiency linked to multiple cue use? Yes, more gradient listeners tend to rely more on the secondary cue (F0). Better encoding of fine-grained detail (more gradiency) enables access to multiple cues. And/or more gradient listeners commit later to a category.
3. In what way are these differences important for speech perception? More gradient listeners do a bit better (marginally) in perceiving speech in noise. Gradiency is not all that bad - maybe good for some things.
49

Take home messages
1. Gradiency indicates more accurate, true-to-the-signal perception.
50

Take home messages
1. Gradiency indicates more accurate, true-to-the-signal perception.
2. Some listeners are more gradient than others in categorizing phonemes.
51

Take home messages
1. Gradiency indicates more accurate, true-to-the-signal perception.
2. Some listeners are more gradient than others in categorizing phonemes.
3. This gradiency may be a good thing.
52

Thank you!
53