indonesiacritical development constraints critical development constraints iv the report also...
TRANSCRIPT

Coun
try
Dia
gnos
tics S
tudi
es
IndonesiaCriticalDevelopmentConstraints

Country Diagnostics Studies
Indonesia: CriticalDevelopmentConstraints

Indonesia: Critical Development Constraints
ii
© 2010 Asian Development Bank (ADB), International Labour Organization (ILO), and Islamic Development Bank (IDB)All rights reserved. Published 2010.
ISBN 978-92-9092-076-2Publication Stock No. RPT102217
Cataloguing-In-Publication Data
ADB, ILO, and IDB. Indonesia: critical development constraints.Mandaluyong City, Philippines: Asian Development Bank, 2010.
1. Economic development. 2. Indonesia. I. Asian Development Bank. II. International Labour Organization. III. Islamic Development Bank.
The views expressed in this publication do not necessarily reflect the views of ADB or its Board of Governors or the governments they represent, ILO, or IDB.
ADB, ILO, and IDB do not guarantee the accuracy of data included in this publication and accept no responsibility for any consequence of their use.
In this report, “$” refers to US dollars unless otherwise specified.
Asian Development Bank 6 ADB Avenue, Mandaluyong City1550 Metro Manila, PhilippinesTel +63 2 632 4444Fax +63 2 636 2444www.adb.org/economics
International Labour Organization 4 route des Morillons CH-1211 Genève 22 Geneva, Switzerland Tel +41 22 799 6111 Fax +41 22 798 8685 www.ilo.org
Islamic Development BankP.O.Box 5925, Jeddah, 21432 Kingdom of Saudi ArabiaTel +966 2 636 1400Fax +966 2 636 6871www.isdb.org

iii
Foreword
The Government of Indonesia, in its National Long-Term Development Plan 2005–2025 envisions an Indonesia that will be an independent, just, and prosperous country. Achievement of this vision is a formidable challenge, as it will require high and sustained inclusive economic growth
that does not come at the cost of our natural resources and is environmentally sustainable. The challenge may, however, be more manageable if the constraints on such economic growth are carefully diagnosed and prioritized in terms of the urgency required for tackling them.
Therefore, the Government welcomes this report on the critical development constraints that the Indonesian economy faces in the medium term. Diagnostic frameworks underpinning the study attempt to identify the most binding constraints to high and sustained levels of economic growth and to poverty reduction. The analysis supporting the diagnostics is rigorous and the recommendations will be of immense help to the policymakers’ attempts to set the conditions right in the medium term for achieving the National Long-Term Development Plan’s vision.
We have, as the report notes, implemented a program of wide-ranging policy reforms, especially since the 1997 Asian Financial Crisis. As a result, we have a more resilient economy, which has been able to weather the recent global economic crisis and in 2009 posted one of the region’s highest growth rates of gross domestic product. We have also seen progress in governance, with substantial improvements in the major indicators. On the social development front, we have been whole-heartedly pursuing the Millennium Development Goals and are on track to achieving the majority of them. All these efforts and more have helped achieve economic growth and poverty reduction in Indonesia.
The Government, however, is aware that much more needs to be done. We may have been able to achieve sustained economic growth, but the growth is still not at par with the rates before the 1997 Asian Financial Crisis. Employment growth has barely been keeping up with the growth in the labor force, and the unemployment levels remain rather high. We are also concerned that the development gaps between the regions and the urban and rural areas remain large. Thus, the report is a very timely and valuable input for improving and finalizing our next medium-term national development plan, 2010–2014.

Indonesia: Critical Development Constraints
iv
The report also provides insights that can help enrich development cooperation between the Indonesian Government and its development partners, especially the Asian Development Bank (ADB), International Labour Organization (ILO), and Islamic Development Bank (IDB). In particular, we are highly appreciative of the consultative process that the study adopted to ensure that views of all the key stakeholders were taken into account in diagnosing the constraints. The Government graciously acknowledges the ADB, ILO, and IDB efforts for the timely conduct of the study.
Dr. Ir. Lukita Dinarsyah TuwoVice Minister Badan Perencanaan Pembangunan Nasional

v
Preface
Indonesia achieved an annual average GDP growth rate of 5.2% during 2001-2008, among the highest in Southeast Asia. Its economy has also weathered the recent global economic crisis well. Nevertheless, the country’s development challenges remain daunting. The current pace of growth is much lower than
what was achieved before the 1997 Asian financial crisis. If growth is maintained at this level, Indonesia would require about 23 years to reach the per capita income level that Thailand had achieved in 2008. The pace of poverty reduction has weakened in recent years and the poverty incidence, at about 14.2%, is nearly double the target of 8.2% set in the government’s Medium-Term National Development Plan 2004–2009. A further concern is that the natural resources and environment have been deteriorating rapidly. It was estimated that over 5 million hectares of forest disappeared between 2000 and 2005 and that over two-thirds of the country’s coral reefs had lost at least half of their living corals by 2005.
How can Indonesia sustain and improve the pace of its economic growth and poverty reduction in a manner that preserves the environment? The report Indonesia: Critical Development Constraints attempts to diagnose the most critical constraints that the country faces to achieving these goals—the constraints the removal of which could yield the highest welfare gains. The report also attempts to identify the options that the policy makers could adopt in converting the constraints into opportunities over the medium term and setting the country on a path of higher and sustainable economic growth and poverty reduction.
The study was led by the Asian Development Bank (ADB) and jointly undertaken with the International Labour Organization (ILO) and Islamic Development Bank (IDB). The work at ADB was led by Muhammad Ehsan Khan; Juzhong Zhuang, assistant chief economist, Economic Analysis and Operations Support Division, Economics and Research Department, provided the oversight and overall direction. ILO’s work on the study was coordinated by Duncan Campbell, and IDB’s was coordinated by Areef Suleman and Zafar Iqbal. The report was prepared by Muhammad Ehsan Khan, Yoko Niimi, Maria Rowena M. Cham, Niny Khor, Suphachol Suphachalasai, and Jindra Nuella Samson from ADB; Kazutoshi Chatani from ILO; and Areef Suleman and Zafar Iqbal from IDB. Duncan Campbell, Per Ronnas, and Abuzar Asra provided contributions. The report benefited from background papers prepared by a team of experts comprising Asep Suryahadi, Haryo Aswicahyono,

Indonesia: Critical Development Constraints
vi
Imelda Maidir, Priasto Aji, Edimon Ginting, Tariq Niazi, Athia Yumna, Umbu Reku Raya, and Deswanto Marbun. The preparation of the report was assisted by Amador Foronda, Marife Bacate, Damaris Yarcia, Broderick B. Garcia, Lea Ortega, and Juilet Vanta. The report was edited by Jill Gale de Villa; layout and typesetting were by Joe Mark Ganaban.
The study followed a consultative process. Several workshops provided the medium for exchange of information and views between the key stakeholders, including the government of Indonesia, academic and research institutions, civil society, development partners, and the private sector. Feedback received during the workshops greatly assisted the report’s preparation, and we believe that the report will provide valuable inputs to the formulation and enrichment of development policies and reform programs aimed at bringing about high and sustained inclusive green growth.
We are grateful for the support provided by the government of Indonesia. In particular, we would like to thank Vice Minister Dr. Lukita Dinarsyah Tuwo, National Development Planning, for his keen interest in the study and guidance in completing this work. We are also grateful for the support and feedback from Dr. Mohamad Ikhsan, Dr. Erna Witoelar, Mr. Prasetijono W., Mr. Mahendra, Dr. Dedy Priatna, Mr. Bambang Sapto Pratomosunu, Dr. Imron Bulkin, Dr. Endah Murniningtyas, Mr. Kennedy Simanjuntak, Mr. M. Donny Azdan, Dr. Indrajit Kartorejo, Mr. Makhlani, Mr. Bambang Prihartono, Mr. Budy Hidayat, and Mr. Maurine Sitorus, Mr. Rehan Kausar, and Ms. Nina Permatasari. We also thank the civil society and private sector representative organizations that participated in the workshops for their support and interest in the study. We look forward to continued and productive dialogue with the government in pursuing an agenda of inclusive growth and sustained development in Indonesia.
Jong-Wha LeeChief Economist Asian Development Bank (ADB)
Duncan CampbellDirector Policy Planning in Employment International Labor Organization (ILO)
Ifzal AliChief Economist Islamic Development Bank (IDB)

vii
Contents
Foreword iiiPreface vAbbreviations and Acronyms ixHighlights xi
1 Introduction 11.1. Objectives 11.2. Methodology 1
1.2.1. Growth Diagnostic Framework 21.2.2 Poverty and Inequality Diagnostic Framework 4
1.3. Organization of the Study 4
2 Development Performance 62.1. Growth 7
2.1.1. Synopsis 72.1.2. Accounting for Sources of Growth 8
2.2. Trends in Poverty and Inequality 122.2.1. Poverty 122.2.2. Inequality 15
2.3. The Environment, Economic Growth, and Poverty Reduction 152.3.1. Status of the Environment and Natural Resources 162.3.2. Global Environmental Risks 202.3.3. Linking Local Environmental Sustainability and Global Environmental Risks 21
3 Critical Constraints to Growth 223.1. Cost of Finance 223.2. Social Returns to Investments 26
3.2.1. Human Capital 263.2.2. Infrastructure 283.2.3. Transport Network 293.2.4. Electricity 313.2.5. Telecommunications 313.2.6. Irrigation 313.2.7. Regional Disparity in Infrastructure 313.2.8. Key Constraints to Infrastructure Investment 33
3.3. Appropriability of Returns to Investments 343.3.1. Macroeconomic Risks 343.3.2. Microeconomic Risks 373.3.3 Market Failures 45

Indonesia: Critical Development Constraints
viii
4 Critical Constraints to Reducing Poverty and Inequality 524.1. Productive Employment Opportunities 524.2. Access to Opportunities 55
4.2.1. Human Capabilities 574.2.2 Uneven Playing Fields 74
4.3 Social Safety Nets and Poverty Reduction Programs 83
5 Summary, Policy Implications, and Conclusions 865.1. Critical Constraints to Inclusive Economic Growth 865.2. Policy Recommendations 87
5.2.1. Accelerating Infrastructure Development 875.2.2. Strengthening Governance and Institutions 885.2.3. Improving Access to and Quality of Education 895.2.4. Making Growth More Pro-Employment 915.2.5. Greening Economic Growth and Poverty Reduction 91
5.3. Conclusions 92

ix
Abbreviations and Acronyms
Bappenas — National Development Planning Agency
BLKI — public vocational training center institutions (balai latihan kerja industri)
BOS — Bantuan Operasional Sekolah (Operational Aid to Schools)
BRI — Bank Rakyat Indonesia
CBT — competency-based training
DAK — Dana Alokasi Khusus (Specific Allocation Fund)
DAU — Dana Alokasi Umum (General Allocation Fund)
FDI — foreign direct investment
GDP — gross domestic product
GDS — Governance and Decentralization Survey
GHG — greenhouse gas
ha — hectare
IMF — International Monetary Fund
IMT–GT — Indonesia-Malaysia-Thailand Growth Triangle
JPS — Jaring Pengaman Sosial (Social Safety Net Program)
km — kilometer
KPPOD — Komite Pemantauan Pelaksanaan Otonomi Daerah (Committee Monitoring the Implementation of Regional Autonomy)
kWh — kilowatt-hour
NTT — East Nusa Tenggara (Nusa Tenggara Timur)
OECD — Organisation for Economic Co-operation and Development
PLN — PT Perusahaan Listrik Negara (Indonesia’s state electricity firm)
PRC — People’s Republic of China
SMEs — small and medium-size enterprises

xi
Indonesia’s economic performance has compared favorably with that of other countries in Southeast Asia since the turn of this century. However, the country’s growth has not recovered to the level it achieved before the 1997 Asian financial crisis. Poverty, in both income and non-income dimensions, remains high, and regional disparities are significant. Growth in employment has slowed since the
crisis, and is barely keeping up with the pace of labor force growth. Furthermore, the pattern of growth is putting increasing pressure on the environment and natural resources, posing risks to the country’s long-term prosperity
The government is committed to achieving higher growth that reduces poverty, is socially inclusive, and is environmentally sustainable. Following a diagnostic approach, this report identifies a number of critical constraints that are hampering the government’s efforts to achieve its development goals. These include
• inadequate and poor quality of infrastructure, particularly transport networks and electricity supply, as well as irrigation supply in some provinces;
• weaknesses in governance and institutions, especially in the prevalence of corruption, poor government effectiveness, and occasional occurrence of terrorism and violence incidences; and
• unequal access to and poor quality of education, particularly secondary and vocational education.
Overcoming these constraints will push the economy to a higher growth path, and make the opportunities and benefits of growth more widely and equitably shared. Concerted steps are needed to change the current patterns of growth so that (1) sectors with high potential for generating productive and decent employment opportunities will grow faster, and (2) growth will be environmentally sustainable.
Critical Development Constraints
Inadequate and Poor Quality of InfrastructureIndonesia lags behind most major Southeast Asian economies in the adequacy and
quality of its infrastructure. Moreover, the availability and conditions of key infrastructure vary significantly across geographic regions and provinces—and are a key cause of regional disparities. Deficiencies in the transport networks and electricity supplies are a particular concern. The geographical areas where infrastructure improvements are needed most have received far less private investment than other regions—both from domestic and international sources. In the outer islands, availability of irrigation services is also a critical constraint, as their economies depend on agriculture.
Highlights

Indonesia: Critical Development Constraints
xii
• Indonesia has one of the lowest road densities among major economies in Southeast Asia, both per 100 people and per square kilometer. The length of paved roads per 100 people is also one of the lowest in the region. Moreover, about 36% of the road network was reported damaged or severely damaged in 2007.
• The performance of the country’s major ports ranks well below that of most other ports in the region. The performance of smaller ports, which mainly cater to inter-island cargoes, is also poor.
• Indonesia has the largest and most intensively used rail network in Southeast Asia. However, the network is limited to Java and Sumatra, and is mainly single track and hence inefficient.
• Air transport has expanded rapidly in recent years. The rapid expansion, however, has not been accompanied by investments needed in the related infrastructure, resulting in overcrowded terminals and non-compliance with international flight safety standards.
• The electricity sector is characterized by a low electrification rate, low consumption, and high inefficiency in transmission and distribution. Moreover, investment in generation, transmission, and distribution has not been able to keep up with growing demand, resulting in power shortfalls.
• Irrigation infrastructure is inadequate, inefficient, and poorly maintained, especially in the outer islands where the economy relies largely on agriculture. It is estimated that only a fraction of the irrigable land in Kalimantan, Maluku, and Papua has been irrigated. As a result, there are large disparities in crop productivity between Java and Sumatra on the one hand and the outer islands on the other.
• Inadequacies in infrastructure are more severe outside Java and Sumatra, with significant adverse implications for investment flows, economic growth, and reduction of poverty and inequality in lagging regions.
• Major constraints to investment in infrastructure include (1) difficulty with acquiring land, (2) weak human and institutional capacity, (3) poor governance, (4) shortage of financing, and (5) laws and regulations that are unfriendly to investment.
Weak Governance and InstitutionsDecentralization through the “big bang” approach in 1999 weakened governance
and institutions generally. In recent years, significant improvements have been made in most dimensions of governance, but much more is needed to catch up with other major economies in Southeast Asia. Of particular importance are areas of control of corruption, government effectiveness, and prevention of recurrent acts of terrorism and violence. Prevalence of corruption and low government effectiveness, in particular, are reducing the development impact of public sector investment and adding to investors’ cost of doing business. The occasional recurrence of acts of terrorism and violence, too, has adversely affected the investment climate, deterring both domestic and foreign investors.
• The World Bank Governance Indicators and Transparency International’s Corruption Perception Index suggest that Indonesia has fared rather poorly compared with some other major economies in Southeast Asia in control of corruption. The country’s control of corruption is still perceived to be somewhat less effective than what it was prior to the 1997 Asian Financial Crisis.

xiii
Highlights
• Investment climate surveys indicate that businesses identify corruption as a major constraint to investment at the national level and is even more problematical at the regional level.
• While much more needs to be done, the government’s efforts in curbing corruption are seen to be effective by the populace and have brought about substantial improvement.
• Indonesia also compares unfavorably with most other major economies in the region in government effectiveness. The World Bank Governance Indicators suggest that the country’s government effectiveness plummeted between 1996 and 1998 and declined again with the introduction of decentralization, but has been improving steadily since 2002.
• The introduction of decentralization reforms through the big bang approach hampered the delivery of government services, especially at the subnational level. Inequitable distribution of well-qualified personnel and lack of effective coordination among levels of government made it difficult to deliver high quality services and infrastructure.
• The perception of political stability and absence of violence in the country is generally poor, due largely to incidences of terrorism, social violence, and civil unrest. While separatist tensions have eased, Indonesia remains prone to sectarian and ethnic violence and terrorism. Occasional occurrences such incidents serve as reminders of the seriousness of the threats.
Unequal Access to and Poor Quality of EducationDespite good progress in primary school enrollment rates, inequality in access to
secondary and vocational education remains high in Indonesia. The quality of education is not at par with that in some comparable countries in Southeast Asia. Unequal access to and poor quality of education, along with poor physical access due to inadequate infrastructure, is a key factor behind inequality in access to productive employment opportunities.
• School enrollment rates have improved overall, but rural areas and less-developed regions such as Kalimantan; Maluku, Papua, and Nusa Tenggara; and Sulawesi continue to lag behind.
• The quality of education needs improvement, as the country’s education system continues to suffer from, among other things, poor conditions of school facilities; insufficient supplies of school materials; and high absenteeism among teachers, particularly in remote and rural areas.
• Despite concerted efforts to improve vocational education in recent years, much needs to be done to make the system more responsive to the demand and needs of job markets, and to enhance the earning ability of the graduates.
• Root causes of unequal access to education lie in both the demand and supply sides. On the demand side, financial burdens, including non-fee costs such as transport, prevent the poor from accessing higher levels of education. Supply-side factors include the inefficient use of public spending on education; unequal distribution of teachers and (to a lesser extent) schools across the regions; and the poor quality of teaching and education infrastructure.

Indonesia: Critical Development Constraints
xiv
The Way Forward
The national development plan 2005–2025 sets forth the vision of an Indonesia that is independent, developed, just, and prosperous, Moving forward toward that vision, the country will need to overcome the critical constraints discussed and to make its economic growth more pro-employment and environmentally sustainable. The study proposes policy options to address these considerations. For the proposals that are already central to the government’s development agenda, the need is to strengthen the resolve to implement them expeditiously. Some of the key recommendations of the report include the following:
Accelerating Infrastructure Development• Invest in planning and implementing capacities of relevant national and regional
agencies.
• Prioritize public sector investment in the short to medium term, aiming to complement rather than compete with the private sector and to primarily focus on addressing the critical constraints.
• Strengthen legal and regulatory frameworks to encourage private sector participation in developing and managing infrastructure.
• Remove price distortions in different types of infrastructure and infrastructure services.
• Undertake pre-feasibility studies on high-priority projects.
• Immediately rehabilitate infrastructure that is in poor condition.
• Explore and implement options for improving the operation and maintenance (O&M) of infrastructure, including strengthened financing mechanisms for O&M, such as maintenance funds and user fees.
• Improve access to long-term financing by issuing bonds and expanding the infrastructure financing facility.
• Institute a comprehensive nationwide program for surveying land, issuing land titles, and establishing a modern land record system.
• Replace existing regulations on land acquisition with a new law that provides for transparent and equitable compensation mechanisms, clarifies roles and responsibilities at national and regional levels, and institutes a dispute resolution mechanism.
Strengthening Governance and Institutions• Strengthen procurement processes by establishing procurement offices in ministries
and local governments, introducing e-procurement and e-bid disclosure, and ensuring the participation of civil society in procurement committees.
• Strengthen and empower internal control and audit mechanisms within ministries and local governments.
• Strengthen and empower audit and anticorruption agencies and anticorruption courts.
• Expedite and expand implementation of measures to prevent proliferation of off-budget accounts.
• Establish a countrywide whistleblower and witness protection system.
• Complete the decentralization-related reforms, including removing inconsistencies between national and regional laws, clarifying roles, and devolving fiscal responsibilities and roles.

xv
Highlights
• Develop a central management information system to manage and monitor planning, implementation, and operation of projects and programs.
• Evolve a clear and transparent cost-sharing formula between national and local governments for public sector investments.
• Reform budgeting and fund release processes to allow efficient and timely availability of funds for development and recurrent expenditures.
• Introduce performance budgeting to reward agencies and local governments for achieving objectives and results.
Improving Access to and Quality of Secondary and Vocational Education• Raise the standard of the school curricula to a level comparable to that of more developed
countries in the region, and institute a comprehensive teacher training program.
• Improve incentives for teachers to enhance their capabilities and performance, and to work in rural and remote areas.
• Improve the availability of equipment and supplies for laboratories (science and computer) and libraries.
• Expand the scholarship program to reward top-performing students, and the conditional cash transfer program to help offset costs and foregone incomes of students from poor and disadvantaged households.
• Ensure vocational education and training are accessible and affordable, particularly in remote and rural areas and for the poor.
• Explore innovative public–private partnerships and close cooperation with local industries and entrepreneurs to ensure that technical and vocational education and training are relevant to the job market’s needs.
• Ensure that the national competency standards and the national certification system reflect the demand for skills and are applied to all vocational education and training schools and institutions.
Making the Growth More Pro-Employment • Reassess the appropriateness of producer subsidies.
• Establish mechanisms for formal dialogue between investors and the government to help ascertain the constraints faced in the development of industry.
• Adopt a new industrial policy that includes mechanisms to reward industries (manufacturing and services) that are new, emerging, and well-performing rather than ones that are established and ailing, and that provides incentives with clear sunset clauses and regular reviews.
• Establish special economic zones.
• Expand access to finance for micro, small, and medium enterprises.
• Fast-track reforms to facilitate doing business; in particular, establish a one-stop shop for licensing and permits required for investment.
• Encourage dialogue between employers’ organizations and trade unions to review labor laws to assure fair treatment of workers while allowing the labor market to adjust to changes.

Indonesia: Critical Development Constraints
xvi
Greening Economic Growth and Poverty Reduction
• Thoroughly analyze the constraints to implementing green growth.
• Mainstream environmental concerns in national- and regional-level development planning.
• Remove subsidies that promote the use of fossil fuel. Introduce disincentives to carbon emissions.
• Develop cost-effective climate change mitigation and adaptation programs.
• Develop a coherent strategy for accessing carbon financing facilities and the Clean Development Mechanism.

Chapter 1 Introduction
1.1. Objectives
The Indonesian economy has performed well in recent years. It recovered from the 1997 Asian financial crisis and grew at an average of 5.2% during 2001– 2008, which compared favorably with other
major Southeast Asian economies. Despite the global economic crisis, the economy posted a growth rate of 4.5% in 2009—one of the highest in Southeast Asia. Nevertheless, the challenges faced by the economy remain formidable. The pace of economic growth in recent years has not been at par with the average rate the country achieved between 1967 and 1997. The pace of poverty reduction has slowed and the poverty incidence, at 14.2% in 2009, was only 3.5 percentage points lower than that in 1996. Income and non-income disparities across the regions and across the urban–rural divide remain wide. In addition, the expected fall in commodity prices, continued uncertainty about the recovery of the global economy, and tightening of domestic credit further threaten investment and private consumption and in turn hamper the pace of economic growth and poverty reduction.
The Indonesian government is committed to sustaining and improving the growth it has attained in recent years. This commitment is embodied in the current medium-term development plan and will be carried forward in succeeding ones. The creation of a prosperous Indonesia through economic and social development is one of the current plan’s three major agenda items. The plan lays out policy directions for changing the high-cost economic structure by improving the investment climate and enhancing industry’s competitiveness.
This report has two interrelated objectives. The first is to identify the critical constraints to medium-term economic growth and poverty reduction, and to equitable regional development in Indonesia. The second is to provide some recommendations that policy makers can consider in addressing these constraints so as to achieve broad-based growth and the plan’s targets.
1.2. Methodology
The study’s framework is based on the inclusive growth concept presented in Figure 1.1. Inclusive growth is growth that not only generates economic opportunities, but also ensures equal access to them by all members of a society. Growth is considered to be inclusive only when it allows all members of a society to participate in and benefit from the growth process on an equal basis regardless of their individual circumstances (Ali and Zhuang 2007). Hence, a development strategy based on the inclusive growth concept is anchored on two pillars: one is to create and expand economic opportunities through high and sustained growth; and the other is to broaden access to opportunities for all members of a society (Zhuang 2008).
Several requirements need to be met in order to satisfy each of the two pillars of the inclusive growth strategy. Hence the study attempts to diagnose the constraints that may be curtailing efforts to generate high and sustained growth to create jobs and opportunities, and to make the growth inclusive. The study employs the growth diagnostic framework to diagnose constraints to high and sustained growth, and the poverty and inequality reduction

Indonesia: Critical Development Constraints
2
diagnostic framework to diagnose constraints that may be limiting the pace of poverty reduction and inclusiveness of the economic growth.
1.2.1. Growth Diagnostic Framework
The study uses a diagnostic approach, and broadly follows growth diagnostics developed by Hausmann, Rodrik, and Velasco (2005). The growth diagnostics approach provides a consistent framework for identifying the most critical or binding constraints to growth and for discerning the priorities and sequence of policies required to ignite and sustain growth. The growth diagnostics approach differs from the laundry list approach, as implied by the Washington consensus. Instead, it recognizes that the economic and political environment differs a great deal among developing countries; there is no “one-size-fits-all” solution to development problems and, therefore, the ordering of policy priorities contingent on country-specific circumstances is critically important.
Figure 1.1. Inclusive Growth Concept
Maximize Economic Opportunities
Governance and Institutions
Ensure Minimum Economic Well-Being
Inclusive Growth
Ensure Equal Access to Economic Opportunities
Poverty Reduction
Source: ADB (2007).
Further, countries at an early stage of development may not have adequate capacity to implement a wide array of policy reforms at the same time. With the diagnostic approach, reforms can start with easing a few critical areas that truly constrain growth. The approach thus offers a practical tool for policymakers and development planners to use in formulating country-specific growth strategies. The application of growth diagnostics is one of the efforts in the search for new approaches to growth strategy after the Washington consensus was questioned in recent years.
The growth diagnostics approach starts with a set of proximate determinants of growth, investigates which of these pose the greatest impediments or are the most critical constraints to higher growth, and figures out specific distortions behind the impediments. The point of departure of the inquiry is a standard endogenous growth model in which growth depends on the social return to accumulation, private appropriability of this social

Chapter 1. Introduction
3
return, and the cost of financing. Each of these three broad determinants of growth is in turn a function of many other factors, which can be presented in a problem tree (Figure 1.2).
The problem tree provides a framework for diagnosing critical constraints to growth. The diagnosis starts by asking what keeps the level of private investment and entrepreneurship low. Is it low social return to investment, inadequate private appropriability of the social return, or high cost of financing? If it is low social return, is that due to insufficient levels of complementary factors of production—in particular, human capital, technical know-how, and/or infrastructure? If the impediment is poor private appropriability, is it due to macro vulnerability, high taxation, poor property rights and contract enforcement, labor–capital conflicts, information and learning externalities, and/or coordination failures? If high cost of finance is the problem, is it due to low domestic savings, poor intermediation in the domestic financial markets, or poor integration with external financial markets?
Figure 1.2. Growth Diagnostics Framework
Low Social Returns
Poor Geography
Low Human Capital
Poor Infrastructure
Micro Risks:Property Rights,
Corruption, Taxes Macro Risks:Financial, Monetary,
Fiscal Instability
Information Externalities:
“Self-Discovery”
Government Failures
Market Failures
Bad International Finance
Low Domestic Savings
High Cost of Finance
Poor Local Finance
CoordinationExternalities
Poor Intermediation
Low Appropriability
Low Levels of Private Investment and Entrepreneurship
Low Return to Economic Activity
Source: Hausmann, Rodrik, and Velasco (2005).
At each node of the problem tree, the diagnosis looks for signals that would help answer the question. The two types of diagnostic signals that one can look for are price signals and nonprice signals. Examples of price signals are returns to education, interest rates, and cost of transport. For example, if education is undersupplied, returns to skills/education would be high and unemployment of skilled people would be low. If investment is constrained by savings, interest rates would be high and growth would respond to changes in available savings (for example, inflows of foreign resources). If poor transport link is a serious constraint, bottlenecks and high private costs of transport would be evident.
The use of nonprice signals is based on the idea that when a constraint binds, the result is activities designed to get around it. For example, high taxation could lead to “high informality” (e.g., under-reporting of income, resulting in lower tax revenues); poor legal institutions could result in high demand for informal mechanisms of conflict resolution and contract enforcement; and poor financial intermediation could lead to

Indonesia: Critical Development Constraints
4
internalization of finance through business groups. Cross-country and cross-period benchmarking and results of business surveys are useful means to gauge whether particular diagnostic evidence signals a binding constraint for the country concerned.
1.2.2 Poverty and Inequality Diagnostic Framework
Although the growth diagnostics approach was developed to identify the binding constraints to growth and associated policy priorities, the approach can also be applied to other areas of policy analysis, such as identifying critical constraints to the inclusiveness of growth. Inclusive growth not only addresses the inequality issue, but also enhances the poverty reduction agenda (Figure 1.3). Despite a steady decline in poverty in Indonesia in recent years the pace of reduction has been much lower than before 1997 Asian financial crisis. There is also a great geographical disparity in poverty across the country, and the vulnerability of Indonesian households to poverty remains high. The limited reduction in poverty and persistent inequality can be caused by the lack of economic opportunities due to poor growth, unequal access to opportunities, and/or the absence of effective and adequate social safety nets.
Within the inclusive growth conceptual framework presented in Figure 1.1, the availability of productive employment opportunities is a key to a household’s ability to improve its livelihood. However, even if the economy succeeds in creating productive and decent employment, this would not automatically lead to poverty reduction unless there is equal access to the opportunities. Inequitable access to economic opportunities can be attributable to weak human capabilities and/or an uneven playing field, both of which can prevent people from participating in and contributing to the growth process on an equal basis.
Certain groups of people may have weaker human capabilities than others, partly due to unequal access to education, health, and/or other social services, including clean water and sanitation systems. Inequity in accessing opportunities may
also be caused by unequal access to infrastructure and productive assets, such as land and credit. For example, in geographically challenged countries like Indonesia, infrastructure plays a key role in promoting inclusiveness.
Promoting equal access to opportunities also requires the government to provide social safety nets to mitigate the effects of external and transitory livelihood shocks as well as to meet the minimum needs of the chronically poor (Zhuang 2008). The importance of social safety nets cannot be overemphasized in countries like Indonesia where a large percentage of the population is clustered around the poverty line, indicating their vulnerability to unforeseen crisis. The inadequate provision of social safety nets can thus be a constraint to reducing poverty and inequality.
The framework also suggests that each of the above issues (weak human capabilities, uneven playing field, and inadequate social safety nets) can, in turn, be due to a number of factors, including market failures, government failures to deliver adequate public services, and/or social exclusion. The key role of the government in promoting inclusiveness is to address these market, institutional, and policy failures.
1.3. Organization of the Study
The rest of the report is organized as follows. Chapter 2 provides an overview of Indonesia’s development performance and the development challenges it faces. The chapter describes the episodes of growth, discusses key growth drivers, reviews progress in poverty reduction, and examines the trends in the state of the environment and natural resources. Chapter 3 elaborates on growth diagnostics, focusing on the three broad determinants of growth that could act as constraints: social return to investment, private appropriability, and cost of finance. Chapter 4 looks at critical constraints to reducing poverty and inequality. Chapter 5 summarizes the findings and discusses policy implications.

Chapter 1. Introduction
5
Figure 1.3. Diagnostic Framework for Constraints to Reducing Poverty and Inequality
Slow Rate of Poverty Reduction and High Inequality
Lack of productive employment opportunities
due to low economic growth
Inadequate social safety nets
Unequal access to oppotunities
Low levels of private investment and entrepreneurship
(follow the Growth Diagnostic Framework)
Uneven playing field• unequal access to infrastructure
and productive assets (credit, land)
Weak human capabilities• unequalaccesstoeducation• unequalaccesstohealth• unequalaccesstoothersocialservices
Exclusion•Geographicalexclusion•Economicexclusion•Socialexclusion
Inadequate public service delivery•Limitedresources•Poortargeting•Poorgovernance
Market failures
Source: Authors.

Chapter 2 Development Performance
Indonesia has always managed to emerge well from economic slumps, yet some development economists have described its economic history as one of “missed opportunities.” The country has rich natural resources but
has repeatedly experienced economic, political, and social upheavals as well as external shocks, subjecting its economy to a boom and bust cycle. In some periods, the reforms set the Indonesian economy on a path toward high economic growth (Figure 2.1). The latest pick-up in growth started in
2001 after a period of stagnation following the 1997 Asian financial crisis. The global economic crisis that emerged in 2008, however, has threatened the gains Indonesia made in recent years.
During the sustained and high growth preceding the 1997 Asian financial crisis, Indonesia recorded a remarkable decline in poverty. The reduction was evident in income as well as in non-income measures of welfare, including access to education and health. However, the crisis severely
Figure 2.1. Indonesia’s Economic History—Per Capita Real GDP (1961–2008, Rp million)
0
1
2
3
4
5
6
7
8
9
10
11
12
13
1961
1966
1971
1976
1981
1986
1991
1996
2001
2006
Stagnant Growth inFinal Years of
Soekarno
Episodes of Stagnant Growth:
Oil Price Drops
Post Crisis Recovery
Period
Growth rate of 4.0% Due to
Financial Reforms in Post Soeharto
Years
Growth Rate of 5.5% Due to Stabilization and Reconstruction under Soeharto and
Oil Boom following 1973
Growth Rate of 5.5% Due to Structural and Financial Sector
Reforms
GDP = gross domestic product.Source: World Bank, WDI, accessed 25 March 2010.

Chapter 2. Development Performance
7
impacted the economy, which was already suffering from a long drought; as a result, the poverty incidence increased substantially.
Indonesia possesses vast natural resources and a wide biodiversity, but has been using it at a rapid and unsustainable rate. By 2005, over two-thirds of the country’s coral reefs had lost half or more of their living corals, and over 5 million hectares of forest was lost during 2000–2005 alone. During 1988–2007, almost two-thirds of Indonesia’s mangroves disappeared. The continued unsustainable use can exacerbate poverty and impinge severely on economic growth.
2.1. Growth
2.1.1. Synopsis
During 1980−1996, Indonesia, with strong growth on the economic front, was viewed as an emerging Asian Tiger. Its economy grew at an average of 6.6% per annum during 1967−1997, comparable to that of neighboring countries such as Malaysia and Thailand. The pace of growth, however, could not be sustained as the economy contracted in response to the 1997 Asian financial crisis. As in other countries
affected by the crisis, Indonesia’s currency and stock markets plummeted and its real sector suffered heavily. Economic growth has, since then, recovered and Indonesia posted an average annual growth rate of 5.2% during 2001−2008, which compared favorably with other countries in the region. Learning from the crisis, Indonesia introduced wide-ranging key reforms that helped build resilience in its economy and helped it weather the global crisis. In 2008, Indonesia posted a growth rate of 6.1% in its gross domestic product (GDP), compared to about 6.3% in 2007. Indonesia’s GDP grew at 4.5% in 2009, which was one of the highest rates in the Southeast Asia region.
Indonesia has also performed well in improving its per capita GDP level. During 1980−2008, per capita GDP in constant 2000 prices increased from $397 to $1,083 (Table 2.1). Despite this, Indonesia’s per capita GDP remains the lowest among the major Southeast and East Asian economies. While the country was able to narrow the gap with the Philippines during this period, Indonesia has fallen further behind other major economies in the region.
Although the level of per capita GDP has improved, its growth declined—after registering 4.5% during 1981−1990 (Table 2.2), the average
Table 2.1. Per Capita GDP (in 2000 $)
Country 1980 1990 2000 2001 2002 2003 2004 2005 2006 2007 2008
Indonesia 397 612 800 818 844 872 904 943 983 1,033 1,083
Malaysia 1,919 2,608 4,030 3,965 4,096 4,251 4,455 4,609 4,789 5,009 5,155
Philippines 989 901 977 975 999 1,028 1,073 1,106 1,143 1,202 1,225
Singapore 9,043 14,658 23,019 21,869 22,571 23,704 25,651 26,886 28,234 29,185 27,991
Thailand 789 1,400 1,968 1,991 2,072 2,193 2,305 2,387 2,490 2,594 2,645
GDP = gross domestic product.Source: Estimates based on World Bank, WDI, accessed 25 March 2010.
Table 2.2. Annual Average Growth Rate of Real Per Capita GDP (%)
Period Indonesia Malaysia Philippines Singapore Thailand
1951–1960 4.0 3.6 3.3 5.4 5.7
1961–1970 1.9 3.5 1.8 7.4 5.0
1971–1980 5.4 5.3 3.1 7.2 4.4
1981–1990 4.5 3.2 -0.8 5.0 6.0
1991–2000 2.9 4.6 0.8 4.7 3.6
2001–2008 3.9 3.1 2.9 2.6 3.8
GDP = gross domestic product.Source: Estimates for 1951–1960 based on IMF, IFS, accessed 25 March 2010 and for other years, World Bank, WDI, accessed 25 March 2010.

Indonesia: Critical Development Constraints
8
annual growth rate decreased to 3.9% during 2001−2008. At this rate, Indonesia would need 18 years to double its GDP or 23 years to catch up with the level that Thailand enjoyed in 2008. However, if per capita GDP declines for any reason to a more modest level of, say, 2%, Indonesia would require 35 years to double its per capita GDP, or 45 years to achieve Thailand’s level in 2008.
2.1.2. Accounting for Sources of Growth
Growth by Sources of Production. All three major production sectors—agriculture, industry, and services—have been playing an important role in the Indonesian economy. As in other developing countries, Indonesia’s economy was initially dominated by agriculture both in terms of output and employment. At country’s independence in 1945, agriculture accounted for about 55% of GDP while industry accounted for a mere 15% (Figure 2.2).
In the initial years after independence, there was little transformation in the economy; the government’s main focus was on nation building and keeping the country united, and the economy was a secondary consideration. Moreover, the government followed the doctrine of autarky and pursued self-sufficiency in agriculture, which helped the sector maintain its dominance.
This trend, however, changed with the new government in 1967, which initiated active pursuit of industrialization. Industry then grew at the rate of over 10% during the 1970s (Table 2.3). As a result, industry’s relative share in GDP increased by about 168% during 1967−1974 (Figure 2.2). While manufacturing also prospered during this period, transformation was largely due to the oil
Figure 2.2. Sector Shares in GDP (1960–2008)
0
10
20
30
40
50
60
1960 1966 1972 1978 1984 1990 1996 2002 2008
Industry ServicesAgriculture
GDP = gross domestic productSource: World Bank, WDI, accessed on 25 March 2010.
boom, which led to strong performance in the mining subsector. Oil prices, however, continued to fluctuate during 1974−1987, and so did the rest of the non-manufacturing subsectors’ share in GDP. Overall, the growth rate in the non-manufacturing subsectors fell from 8.7% in the 1970s to 3.6% in the 1980s, 3.8% in the 1990s, and 2.9% in the 2000s (Table 2.4). Consequently, the share of the non-manufacturing subsectors fell from 26.1% in the 1970s to 16.8% in the 2000s.
Meanwhile, the manufacturing subsector continued to increase, posting strong growth in the late 1980s. The rate of increase, however, started to slow in the 1990s. Between 2001 and 2008, growth in the subsector had slowed to 4.7%—the slowest since the 1960s. Consequently, the share of manufacturing in the overall GDP rose only slightly during this period and its contribution to GDP declined by 16.9 percentage points.
Table 2.3. Annual Average Real GDP Growth and Contribution of Major Production Sectors to GDP Growth (%)
Period
Agriculture Industry ServicesGDP Growth
RateGrowth
RateContribution
to GDP GrowthGrowth
RateContribution
to GDP GrowthGrowth
RateContribution
to GDP Growth
1961–1970 4.1 2.8 30.4 7.2 43.3 3.5 26.3
1971–1980 7.9 4.5 16.8 10.3 44.5 8.7 38.6
1981–1990 6.4 3.7 14.5 7.4 21.9 7.1 61.8
1991–2000 4.2 2.0 9.0 5.4 57.9 4.0 34.2
2001–2008 5.2 3.4 10.1 4.0 35.0 7.0 54.8
GDP = gross domestic product.Source: Estimates based on World Bank, WDI, accessed 25 March 2010.

Chapter 2. Development Performance
9
Although the agriculture sector’s share of GDP has declined steadily since about 1967, it continued to grow in absolute terms. Indeed, agriculture acted as a safety net when the economy was badly battered by the 1997 Asian financial crisis, absorbing much of the workforce that had been rendered jobless due to the crisis. Rising commodity prices in 2006 and 2007 also helped the sector regain some of its lost share in GDP.
The services sector, however, has expanded its share in GDP more gradually. The share of services grew from about one-third of GDP in the 1960s to about 41% in the 2000s. Like agriculture, services continued to grow during the period, but its growth was overshadowed by that of the industry sector. Like industry, services were shaken up by the 1997 Asian financial crisis, but recovered strongly thereafter.
Growth rates in the three sectors, however, have been erratic in the last 5 decades. While agriculture has been increasing consistently, its contribution to GDP growth has declined considerably, from a high of about 30% in the 1960s to about 9% in the 1990s and 10% in the 2000s. Industry, after contributing about 43%−44% of GDP growth in the 1960s and 1970s, yielded its dominance to services in the 1980s, which accounted for as much as 62% of the growth. Industry regained its status as the dominant contributor to GDP growth in the 1990s, but has since been trailing the services sector, which accounted for roughly 55% of GDP growth in the 2000s.
Indonesia’s sectoral shares of GDP are more or less consistent with those in the other major Southeast Asian economies (Figure 2.3). Agriculture’s share of GDP during 2001−2008
averaged 15%—higher than the shares of Malaysia and Thailand but lower than those of the Philippines and Viet Nam. In the case of industry, Indonesia’s average share in GDP during the same period was about 44%—similar to Malaysia and Thailand but higher than the Philippines and Viet Nam.
Growth by Expenditure Component. On the demand side, private consumption has been the most dominant component of GDP for the last 5 decades, with a share of 55%−60% except during the 1970s, when its share dipped below 50%. Similarly, the share of government consumption has been hovering between 6% and 10% (Table 2.5). Expenditure components that have seen considerable changes in their shares of GDP include investments, imports, and exports. Investments rose from about 9% of GDP in the 1960s to average 30%−32% in the 1980s and 1990s, then slid to an average of about 23% of
Table 2.4. Annual Average Real GDP Growth and Contribution of Manufacturing and Non-Manufacturing Industry Subsectors to GDP Growth (%)
Period
Manufacturing Non-manufacturing IndustryGrowth
RateShare in
GDPContribution to GDP
Growth RateGrowth
RateShare in
GDPContribution to GDP
Growth Rate
1961–1970 4.6 7.2 7.2 8.2 15.9 41.5
1971–1980 14.0 9.5 18.8 8.7 26.1 26.8
1981–1990 12.2 17.8 35.0 3.6 20.5 12.0
1991–2000 6.6 25.2 41.7 3.8 19.1 16.0
2001–2008 4.7 27.8 24.8 2.9 16.8 9.5
GDP = gross domestic product.Source: World Bank, WDI, accessed May 2010.
Figure 2.3. Average Shares of Major Production Sectors in GDP (2001−2008, %)
0
25
50
75
100
Agriculture Industry Services
GDP = gross domestic product.Notes: Based on current market prices. Estimates for Malaysia, Thailand, and Viet Nam are for 2001–2007.Source: Estimates based on World Bank, WDI, accessed 25 March 2010.
Indo
nesia
Mal
aysia
Philip
pine
s
Thai
land
Viet
Nam

Indonesia: Critical Development Constraints
10
GDP in the 2000s. Imports, after rising from about 13% of GDP in the 1960s to about 33% in the 1990s, have been relatively steady. On the other hand, the share of exports has fluctuated the most since 1961. The fluctuations, mainly due to shifting prices of oil and other commodities, have not followed any particular trend (Chapter 3 explores export performance further).
GDP growth too has been dominated by private sector contributions (Table 2.6). After accounting for about 54% of GDP growth in the 1960s, private consumption’s contribution declined to about 40% in the 1970s, below the contribution of the investment component at nearly 44%. However, private consumption has since reclaimed its role as the largest contributor to GDP growth, and accounted for about 55% of growth during 2001−2008. Investment’s contribution, after having climbed to about 41% in the 1980s, plummeted to about −10% in the 1990s but has recovered to about 25% in the 2000s. Government consumption, on the other hand, has been a relatively small contributor, providing between 0.5% and 11% of GDP growth. Contributions to GDP by net exports have been
volatile. In terms of size, net exports’ contribution to GDP growth decreased from 21.6% in the 1990s to 10.4% in the 2000s.
The shares of Indonesia’s major expenditure components in its GDP are comparable with those of other Southeast Asian countries (Figure 2.4). As is the case with Indonesia, private consumption has the largest share in GDP among the comparator countries. Shares of investment and government expenditures are also similar to those of the other Southeast Asian countries. However, net exports stand out. Indonesia, like Malaysia and Thailand, posted positive net exports during 2001−2008, whereas the Philippines and Viet Nam registered negative net exports.
Growth by Geographic Region. Indonesia is large and has diverse geography, culture, and economic activities. Of the main island groups, Java and Bali are economically the most dominant and accounted for about 62% of GDP in 2008 (Table 2.7), with Java higher than Bali. Sumatra is a distant second, accounting for 21.6% of GDP. Kalimantan, Maluku, Nusa Tenggara, Papua, and Sulawesi, despite their
Table 2.5. Share of Expenditure Components in GDP (%)
Consumption Government Investment Exports Imports
PeriodGrowth
RateShare
of GDPGrowth
RateShare
of GDPGrowth
RateShare
of GDPGrowth
RateShare
of GDPGrowth
RateShare
of GDP
1961–1970 4.3 55.8 0.7 6.4 8.3 9.2 4.0 45.7 5.6 –13.1
1971–1980 6.3 48.0 13.1 7.8 17.7 19.5 9.2 60.1 17.4 –28.1
1981–1990 7.8 56.4 5.3 9.9 8.4 30.2 0.9 35.7 4.3 –32.8
1991–2000 5.9 55.7 0.8 7.4 –0.3 31.9 6.6 39.0 5.2 –33.2
2001–2008 4.7 60.0 8.1 7.6 6.1 23.0 7.7 43.3 8.8 –33.9
GDP = gross domestic product.Source: Estimates based on World Bank, WDI, accessed 25 March 2010.
Table 2.6. Contribution to GDP Growth by Expenditure Component (%)
Period
Consumption Government Investment
Exports Growth
Rate
Imports Growth
Rate
Net Exports Contribution
to GDP Growth Rate
Growth Rate
Contribution to GDP
Growth RateGrowth
Rate
Contribution to GDP
Growth RateGrowth
Rate
Contribution to GDP
Growth Rate
1961–1970 4.3 54.1 0.7 3.0 8.3 14.6 4.0 5.6 33.5
1971–1980 6.3 40.1 13.1 14.0 17.7 43.5 9.2 17.4 8.1
1981–1990 7.8 42.2 5.3 7.5 8.4 41.3 0.9 4.3 11.7
1991–2000 5.9 84.6 0.8 0.5 -0.3 -9.8 6.6 5.2 21.6
2001–2008 4.7 53.3 8.1 11.2 6.1 25.2 7.7 8.8 10.4
GDP = gross domestic product.Source: World Bank, WDI, accessed March 2010.

Chapter 2. Development Performance
11
rich natural resources, together account for less than Sumatra’s share of GDP and less than one third that of Bali and Java. Similarly, Bali and Java have been the leading contributors to GDP growth, followed by Sumatra. In 2007−2008, up to 65% of GDP growth was contributed by Bali and Java while Sumatra accounted for about 19%.
Growth by Factors of Production. Empirical studies have attempted to estimate the contributions of labor, capital, and total factor productivity (TFP) to GDP growth. Findings of studies by the Asian Productivity Organization suggest that, during 1980−2000, growth, especially up to the 1997 Asian financial crisis, had largely been due to the accumulation of physical capital, and the contribution of TFP to output growth was negative during this period (Table 2.8). In contrast, except for the Philippines, TFP growth in other major economies in Southeast Asia was positive and significant.
A recent study by the Organisation for Economic Co-operation and Development (OECD), however, suggest that the trends of Indonesia’s TFP growth improved between 2000 and 2007 (Figure 2.5). The OECD study noted that as much as 35%−40% of the period’s growth was due to growth in TFP, which, the authors argued, may have been on account of wide-ranging reforms that the country undertook in the post 1997 Asian financial crisis period (OECD 2008).
Figure 2.4. Average Shares of Major Expenditure Components in GDP (2001−2008, %)
20
0
20
40
60
80
100
120
Indonesia Malaysia Philippines Thailand Viet Nam
Consumption Government
Investment Net Exports
GDP = gross domestic product.Notes: Based on current market prices. Estimates for Malaysia, Thailand, and Viet Nam are for 2001–2007.Source: World Bank, WDI, accessed on 25 March 2010.
Table 2.7. Regional Contributions to GDP and GDP Growth (%)
Year Sumatra Bali and Java Kalimantan SulawesiEastern Provinces (Maluku, Nusa Tenggara, and Papua)
GRDP: Regional Shares2000 22.6 60.1 9.6 4.2 3.52001 22.2 60.3 9.6 4.3 3.62002 22.6 60.3 9.6 4.3 3.32003 22.5 60.3 9.4 4.3 3.52004 22.2 60.9 9.3 4.3 3.22005 21.9 61.2 9.2 4.4 3.42006 21.9 61.5 9.0 4.5 3.12007 21.7 61.8 8.9 4.5 3.12008 21.6 62.0 8.8 4.6 3.0GRDP: Contribution to Growth2000–2001 11.8 65.9 10.8 5.4 6.22001–2002 31.7 58.0 9.2 4.7 –3.62002–2003 21.0 60.9 5.4 4.6 8.02003–2004 15.5 76.4 6.7 5.7 –4.32004–2005 14.8 65.1 6.8 5.1 8.22005–2006 22.2 68.0 6.7 5.8 –2.72006–2007 19.1 67.1 5.6 5.4 2.82007–2008 19.1 65.0 8.3 6.2 1.3
GDP = gross domestic product, GRDP = gross regional domestic product.Source: Estimates based on Badan Pusat Statistik Website March 2010.

Indonesia: Critical Development Constraints
12
2.2. Trends in Poverty and Inequality
2.2.1. Poverty
Indonesia’s poverty fell significantly during 1976−1996, with the poverty incidence declining from about 40.1% to 11.3% (Figure 2.6). In 1996, the methodology for poverty estimation was revised and the poverty incidence was estimated at 17.7% based on the new definition. The poverty incidence then shot up to 24.2% in 1998 due to the 1997 Asian financial crisis. Six years elapsed before the poverty incidence moved below the pre-crisis levels. The poverty incidence then again rose, from 16.7% in 2005 to about 17.8% in 2006 due to the surge in rice prices (World Bank 2006a). The incidence resumed
Table 2.8. Contribution of Total Factor Productivity to GDP Growth (%)
Period Indonesia Malaysia Philippines Thailand Viet Nam
1980–1984 –0.32 –0.03 –2.34 0.37 —
1985–1989 –0.47 0.20 0.49 3.66 2.09
1990–1994 0.82 3.36 –1.68 2.14 4.31
1995–1999 3.67 0.32 1.03 –2.16 3.36
1980–2000 –0.80 1.16 –0.37 1.00 3.41
— = not available, GDP = gross domestic product.Notes: The analysis for Malaysia is for 1981–2000; Thailand, for 1980–1999; and for Viet Nam, 1986–2000.Source: APO (2004).
a downward trend when the rice prices subsided and the safety nets were in place. As of 2009, the poverty incidence had declined to 14.2%, which was still far from the ambitious target of 8.2% for 2009 set in Indonesia’s Mid-Term National Development Plan 2004−2009 (Heriawan 2008). Although the full impact of the global economic crisis is yet to be ascertained, government reports suggest that its impact on the poverty incidence may so far have been marginal.
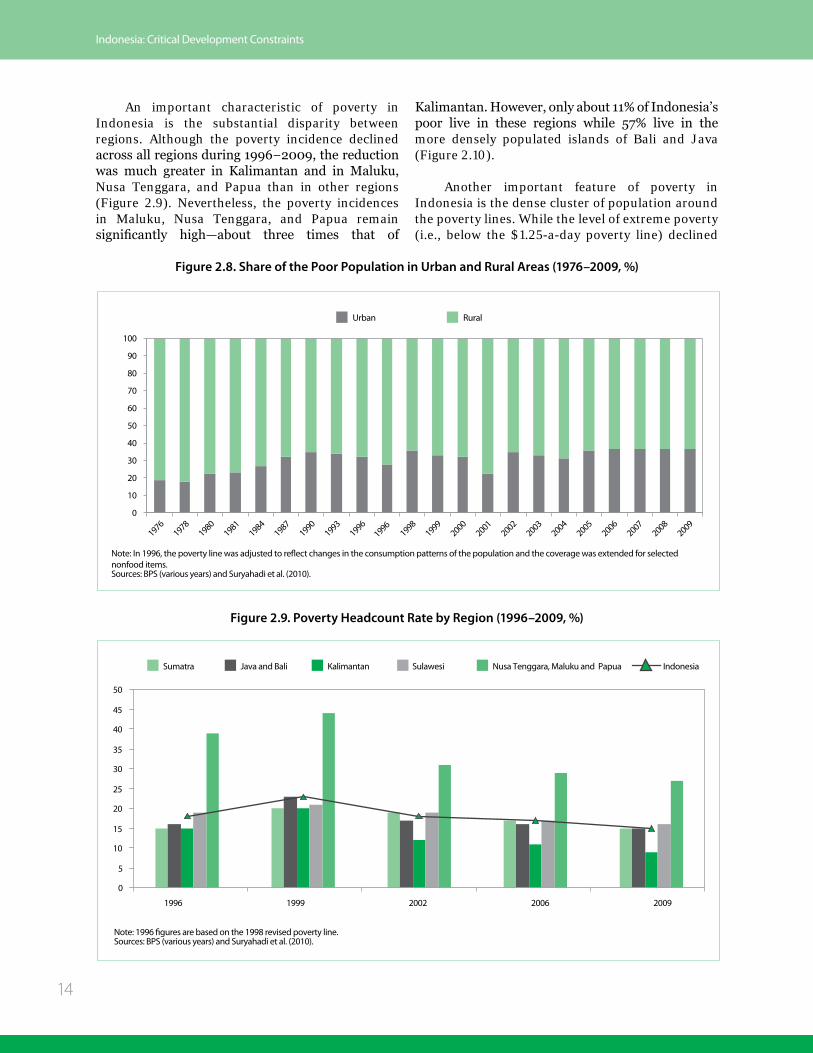
Poverty in Indonesia has predominantly been a rural phenomenon. Although the rural poverty incidence, at 40.4% in 1976, was only slightly higher than the urban poverty incidence of 38.8%, nearly 82% of the poor population was estimated to be residing in rural areas (Figures 2.7 and 2.8). Reduction in poverty during 1976−1996 helped
Figure 2.5. Trends in GDP and Total Factor Productivity Growth Rate (1980–2006, %)
-16.0
-12.0
-8.0
-4.0
0.0
4.0
8.0
12.0
16.0
TFP GDP
GDP = gross domestic product, TFP = total factor productivity.Sources: GDP from World Bank, WDI, accessed 25 March 2010. Others from OECD (2008).
1980
1985
1990
1995
2000
2005

Chapter 2. Development Performance
13
bring the poverty incidence down in both rural and urban areas, with the rural poverty incidence declining to 12.3% and the urban incidence to 9.7%—or 19.9% and 13.6%, respectively, based on the new methodology. With the economic recovery, the rural and urban poverty incidences declined, and then both rose with the surge in rice prices in
2006. In 2009, the disparity in poverty incidence between rural and urban areas widened to about 6.7 percentage points from about 1.6 percentage points in 1976. The proportion of the poor people living in rural areas declined from about 82% in 1976 to about 63% in 2009.
Figure 2.6. Poverty Trends (1976–2009)
0
5
10
15
20
25
30
35
40
45
Revised method/poverty standard
Asian FinancialCrisis
Rice and fuel price increases
Pove
rty
Inci
denc
e
0
10
20
30
40
50
60
No.
of P
oor P
eopl
e
No. of poor people (in million) % of poor people
Note: In 1996, the poverty line was adjusted to re�ect changes in the consumption patterns of the population and the coverage was extended for selected nonfood items.Sources: BPS (various years) and Suryahadi et al. (2010).
1976
1978
1980
1981
1984
1993
1990
1987
1996
1996
1998
1999
2000
2004
2003
2002
2001
2005
2006
2007
2009
2008
Figure 2.7. Poverty Headcount Rate: Urban, Rural, and Total (1976–2009, %)
0
5
10
15
20
25
30
35
40
Urban Rural All
Note: In 1996, the poverty line was adjusted to re�ect changes in the consumption patterns of the population and the coverage was extended for selected nonfood itemsSources: BPS (various years) and Suryahadi et al. (2010).
Revised method/poverty standard
1976
1978
1980
1981
1984
1987
1990
1993
1996
1996
1998
1999
2000
2001
2002
2003
2004
2005
2006
2007
2008
2009
Indonesia: Critical Development Constraints
14
Figure 2.8. Share of the Poor Population in Urban and Rural Areas (1976–2009, %)
0
10
20
30
40
50
60
70
80
90
100
Urban Rural
19761978
19801981
19841987
19901993
19961996
19981999
20002001
20022003
20042005
20062007
20082009
Note: In 1996, the poverty line was adjusted to re�ect changes in the consumption patterns of the population and the coverage was extended for selected nonfood items.Sources: BPS (various years) and Suryahadi et al. (2010).
An important characteristic of poverty in Indonesia is the substantial disparity between regions. Although the poverty incidence declined across all regions during 1996−2009, the reduction was much greater in Kalimantan and in Maluku, Nusa Tenggara, and Papua than in other regions (Figure 2.9). Nevertheless, the poverty incidences in Maluku, Nusa Tenggara, and Papua remain significantly high—about three times that of
Figure 2.9. Poverty Headcount Rate by Region (1996–2009, %)
0
5
10
15
20
25
30
35
40
45
50
1996 1999 2002 2006 2009
Sumatra Java and Bali Kalimantan Sulawesi Nusa Tenggara, Maluku and Papua Indonesia
Note: 1996 �gures are based on the 1998 revised poverty line.Sources: BPS (various years) and Suryahadi et al. (2010).
Kalimantan. However, only about 11% of Indonesia’s poor live in these regions while 57% live in the more densely populated islands of Bali and Java (Figure 2.10).
Another important feature of poverty in Indonesia is the dense cluster of population around the poverty lines. While the level of extreme poverty (i.e., below the $1.25-a-day poverty line) declined

Chapter 2. Development Performance
15
Figure 2.10. Share of Poor Population by Region (1996–2009, %)
0
20
40
60
80
100
1996 1999 2002 2005 2009
Sumatra Java and Bali Kalimantan Sulawesi Maluku, Nusa Tenggara, and Papua
Note: 1996 �gures are based on the 1998 revised poverty line.Sources: BPS (various years) and Suryahadi et al. (2010).
significantly—from about 72% in 1981 to about 21% in 2005, more than half of the population was still living below the $2-a-day poverty line in 2005. Table 2.9, which compares Indonesia with other Southeast Asian countries, shows that although Indonesia’s level of extreme poverty is lower than that of the Philippines or Viet Nam, the proportion of its population living below the $2-a-day poverty line is higher than theirs.
Furthermore, the percentages of chronically poor (people who were poor in both years) and vulnerable people (those who were poor in one of the years), estimated using the panel data, indicate a relatively high proportion of the vulnerable population even in provinces with a relatively lower percentage of the chronically poor (Figure 2.11).
2.2.2. Inequality
Income inequality in Indonesia compares favorably with that in other Southeast Asian countries. During 1981−2008, the Gini coefficient of per capita income hovered at 0.32–0.37. Trends in the Gini coefficient suggest that the inequalities increased during the high-growth period of 1990−1996, declined as a result of the 1997 Asian financial crisis, and increased with the rise in rice prices in 2006.
2.3. The Environment, Economic Growth, and Poverty Reduction
Indonesia is one of the world’s richest countries in natural resources and biodiversity (Table 2.10). Studies and data, however, suggest that the sustainability of these resources is under serious threat. The country’s growing population and economy are placing increasing pressure on the natural resources and, in doing so, are threatening both its environmental and economic sustainability. In addition, global threats such as climate change and rising temperatures will have adverse impacts on crop yields and water resources. Rising sea levels are a serious threat, given Indonesia’s 17,000 islands and extensive coastlines.
Table 2.9. Headcount Indexes Based on Four Poverty Lines in Selected Southeast Asian Countries
(2002–2006, %)
CountrySurvey
Year
Headcount Index
$1/day $1.25/day $1.35/day $2/day
Cambodia 2004 26 40 45 68
Lao, PDR 2002 28 44 50 77
Indonesia 2005 10 21 26 54
Malaysia 2004 0 1 1 8
Philippines 2006 14 23 26 45
Thailand 2004 0 0 1 12
Viet Nam 2006 12 23 25 50
Lao PDR = Lao Peoples’ Democratic Republic.Source: World Bank, PovcalNet database, accessed 3 July 2009.

Indonesia: Critical Development Constraints
16
2.3.1. Status of the Environment and Natural Resources
Studies and data indicate that Indonesia’s natural capital and environment are degrading rapidly. Major issues related to environment and natural resources include (1) loss of forest and terrestrial biodiversity, (2) deterioration of coastal and fisheries resources, (3) degradation of water resources, and (4) wastes and pollution (ADB 2005).
Loss of Forest and Terrestrial Biodiversity. Forest area totals 191 million hectares (ha)—more than 60% of the country’s land area. The country’s vast rainforest is habitat for a wide diversity of species. The rich natural ecosystem and biodiversity provide goods and services that are important in sustaining the country’s water supply, agriculture, coastal fisheries, tourism, and the livelihoods of the country’s population.
Deforestation is a critical problem in Indonesia. Its far-reaching effects have led to a loss of biodiversity, desertification, flooding, food insecurity, and the increased impoverishment of local communities whose existence depends critically on the use of forest resources.
The rate of deforestation rose from about 200,000 ha per annum during 1982−1997 to 500,000 ha per annum during 1997−2005 (Ministry
Figure 2.11. Poverty Dynamics (2005–2007, %)
0
5
10
15
20
25
30
35
Source: BPS, Susenas Panel Dataset, 2005 and 2007.
Chronically Poor VulnerableN
orth
Sum
atra
Wes
t Sum
atra
Riau
Jam
bi
Sout
h Su
mat
ra
Beng
kulu
Lam
pung
Bang
ka-B
elitu
ng
Riau
Isla
nds
Jaka
rta
Wes
t Jav
a
Cent
ral J
ava
Yogy
akar
ta
East
Java
Bant
en Bali
Wes
t Kal
iman
tan
Cent
ral K
alim
anta
n
Sout
h Ka
liman
tan
East
Kal
iman
tan
Nor
th S
ulaw
esi
Cent
ral S
ulaw
esi
Sout
h Su
law
esi
Sout
heas
t Sul
awes
i
Gor
onta
lo
Wes
t Sul
awes
i
Mal
uku
Nor
th M
aluk
u
Wes
t Pap
ua
Papu
a
Wes
t Nus
a Te
ngga
ra
East
Nus
a Te
ngga
ra
of Forestry 2007). A more recent estimate indicated that during 2000–2005 the deforestation rate accelerated to 1.1 million ha per year (Table 2.11). About 26% of Sumatra’s forest was lost during 1990−2000. Similarly, since 1950, tropical lowland and highland forests have contracted rapidly in Kalimantan (Figure 2.12).
The primary causes of deforestation in Indonesia include (1) illegal logging, (2) conversion for agricultural use, (3) forest fires, and (4) mining (ADB 2005).
Large-scale land conversion was the biggest single cause of the 1997–1998 forest fires that destroyed nearly 5 million ha of forest and resulted in $8 billion in economic losses to Indonesia (ADB 2005). As Figure 2.13 indicates, the country’s palm oil production area grew by a multiple of 314 during 1995–2008 (BPS, 2008a). In 2006 alone, approximately 816,000 ha of the forest area in Central Kalimantan were released for palm oil development—the most rapid expansion of palm oil plantation in the country (Forest Watch Indonesia 2007).
Factors such as forest destruction, land-use change and intensification, and rampant forest fires have led to a sizeable loss of Indonesia’s important ecological and forest ecosystems. Deforestation alone has destroyed many species’ habitats and has either threatened or led to extinction of many

Chapter 2. Development Performance
17
Table 2.10. Selected Environmental Indicators
Indicator Value
A. Land Area and Land Usea, 2004 Total land area (million ha) 190.9 Land-use (% of total land area) Non-Agriculture 2.3 Wetland 4.5 Dry land 8.0 Plantation 8.7 Forest 62.9 Others 13.6 Protected area (as % of total land area),b 2008 13.1B Biodiversityb
Total number of species diversity 17,157.0 Total number of endemic species 8,537.0 Number of endangered species 976.0C. Water Resources Internal renewable freshwater resources 2,838.0 (billion m3),b 2007 Freshwater water consumption ratec 766,145.0 (million liters/day), 2004 Water use by sector (% share of total consumption)b
Domestic 3.9 Industry 5.2 Agriculture 58.5 Others 32.4 Water use intensity (m3/ha/y),e 2000 2,250.0 Industrial water pollution (mt/day),e 1997–2000 662.0D. Marine and Coastal Resources Length of coastal line (km),b 2009 108,000.0 Coral Reef area (million ha),f 2009 2.6 Mangrove area (ha),d 2007 1,229,117.0 No. of mangrove speciesd 45.0 No. of seagrass speciesd 13.0 Quantity of captured fisheriesa (t), 2006 Sources: River 175,794.0 Lake 42,276.0 Reservoir 12,159.0 Swamp 62,480.0 Marine 795,019.0E. Air Pollution (million t/year),a 2007 CO 39.2 NOx 1.9 SOx 0.1 Hydrocarbon 3.4 Suspended particles 0.2D. Otherse
Fertilizer use intensity (kg/ha), 2007 99.5 Pesticide use intensity (kg/ha), 1993 0.1
CO = carbon monoxide, ha = hectare, kg = kilogram, km = kilometer, m3 = cubic meter, NOX = nitrogen oxides, SOX = sulfur oxides, t = ton, y = year.Sources: a BPS (2008a), b ASEAN–SEC (2009), c Ministry of Environment (2004), d Burke, Selig, and Spalding (2002). e WRI (2009b). f Leitman, J. et al (2009).
endemic species. The ASEAN Secretariat, (ASEAN–SEC 2009) notes that Indonesia has one of the largest numbers of threatened species in the region (Figure 2.14).
Loss of Coastal and Marine Resources and Biodiversity. Indonesia has 108,000 kilometers of coastline and the world’s 6th most extensive exclusive economic zone. The country is guardian to about 2.7 million square kilometers of coastal and marine ecosystems that contain some of the world’s richest and most diverse natural resour-ces (FAO, Fisheries and Aquaculture Department). However, these resources are being endangered due to inland activities that have increased the discharge of sediments onto the reefs, pollution from agricultural and industrial activities, and damaging harvesting practices.
The cumulative pressures have significantly degraded Indonesia’s reefs over time, affecting most of the breeding grounds and habitats of important marine species. Suharsono (2005) revealed that only about 33.3% of Indonesia’s coral reefs were in excellent to good condition—the rest (66.7%) were assessed to have lost half their living coral cover (Table 2.13).1
Indiscriminate harvesting of fishery and marine resources in return for short-term profits and growing competition among fishermen have resulted in unsustainable fishing practices such as
1 Coral reef monitoring was conducted in 648 stations of 58 localities throughout Indonesian waters during 1993–2003.
Table 2.11. Deforestation in Indonesia’s Main Islands (2000–2005)
LocationTotal Deforested Area (hectares)
Annual Average Loss (hectares)
Bali and Nusa Tenggara 359,800 71,960
Java 712,800 142,560
Kalimantan 1,230,100 246,020
Maluku 214,900 42,980
Papua 718,400 143,680
Sulawesi 866,300 173,260
Sumatra 1,345,500 269,100
Indonesia 5,447,800 1,089,560
Source: Ministry of Forestry (2007).

Indonesia: Critical Development Constraints
18
cyanide and blast fishing in many locations.2 Burke, Selig, and Spalding (2002) estimated that, if left unregulated, the net economic loss to Indonesia
2 About 65% of surveys conducted in the Malaku islands found evidence of blast damage (Hopley and Suharsono 2000).
Figure 2.12. Deforestation in Kalimantan—Actual and Projected
1950 1985 2000
2005 2010 2020
Source: UNEP/GRID-Arendal (2007).
Figure 2.13. Expansion of Plantations (1995–2008)
Rubber Oil palm Cocoa Co�ee Tea Cinchona Sugarcane Tobacco
Source: BPS (2008a).
0
500
1000
1500
2000
2500
3000
3500
4000
4500
Thou
sand
Hec
tare
s
1995
1996
1997
1998
1999
2000
2001
2002
2003
2004
2005
2006
2007
2008
Figure 2.14. Inventory of Threatened Species (2008)
0
200
400
600
800
1,000
1,200
Brun
ei Dar
ussa
lamCa
mbo
dia
Indo
nesia
Lao
PDR
Mala
ysia
Mya
nmar
Philip
pine
sSin
gapo
reTh
ailan
dVi
et N
am
Source: ASEAN–SEC (2009).
Tota
l num
ber o
f Ide
nti�
ed S
peci
es
from blast fishing over a period of 20 years would reach $570 million, while loss from cyanide fishing is estimated to cost the country $46 million annually.

Chapter 2. Development Performance
19
Important coastal and inland wetlands include peat marshes and mangrove systems that are essential breeding grounds for fish and wildlife. At the same time, they are buffers to flooding, storm surges, and sea level rise. Indonesia had an estimated 3.5 million ha of mangrove in 1988 (Wilkie, Fortuna, and Souksavat 2002). In 2007, however, the Ministry of Forestry reported only about 1.2 million hectares of mangrove area (BPS 2008a). Numerous benefits from this ecosystem were lost as a result of agricultural expansion, urbanization, and increased economic activity along the coast. Indonesia had 65% of the total mangrove area in Southeast Asia in 2007 (ASEAN–SEC 2009).
Degradation of Water Resources. Indonesia holds approximately 6% of the world’s and 21% of the Asia and Pacific region’s freshwater reserves (Ministry of Environment 2004). However, Indonesia struggles to supply enough water for its industry and agriculture, and adequate clean water for human consumption. In agriculture alone, water intensity is estimated to be 2,250 cubic meters per hectare per year, higher than in other agricultural countries, such as Cambodia and the Philippines (WRI 2009b). Agriculture consumes the largest portion (58.5%) of Indonesia’s available water supply, followed by industry (5.2%), domestic use (3.9%), and others (32.4%).
Sources of freshwater, including river basins, ground water reserves, lakes, and man-made reservoirs, are under increasing pressure to meet the growing demand of the economy and population. Water use was estimated at 591 billion liters per day in 2005, and is projected to increase to 817 billion liters by 2010 and 1,131 billion liters by 2015.
Wastes and Pollution. Many of the country’s water resources are exploited unsustainably. Rivers
are often used as a catchment for wastewater disposal from industries and waste from households, and intensive extraction of ground water had resulted in seawater intrusion to aquifers. Of the 33 rivers monitored in 2008, over half (about 54%) were polluted (ASEAN–SEC 2009). Some groundwater wells monitored in Jakarta also showed contamination with Escherichia coli and fecal coliform bacteria (Ministry of Environment 2004).
The levels of air pollutants such as suspended particulate matter, sulfur dioxide (SO2), and nitrogen dioxide (NO2), are already over safe limits in many cities (Badan Pusat Statistik 2008), increasing the health risks to society and causing acid rain that damages infrastructure. Although outdoor sources are often the dominant pollutants, indoor air pollution is also a major health threat to many poor Indonesians, as 44% of the country’s households continue to use biomass fuel for cooking. Acidic rainwater, due the increased concentration of SO2 in the air, adversely impacts forests, freshwater, soil, plants, animals (including humans), buildings, and infrastructure
Environmental degradation brings significant economic costs in terms of income and health. Leitman et al. (2009) estimated that inadequate water and sanitation can cause the country a short-term economic loss of about 2% of its GDP (Table 2.14). Thus, water and sanitation rank among the country’s highest priority environmental challenges. In addition, health impacts by outdoor pollution and household exposure to indoor pollution can cost the country a GDP loss of 0.9% and 0.4%, respectively.
Overall, the country’s Environmental Performance Index3 scored 44.6, ranking Indonesia 134th of 163 countries in terms of environmental sustainability and performance (Emerson et al. 2010). Among the 13 Southeast Asian countries, Indonesia ranked 12th—showing that more attention and high priority should be given to protecting, preserving, and improving the country’s environment for sustained development.
3 The 2010 Environmental Protection Index measures the effectiveness of national environmental protection efforts in 163 countries. The index considers 25 indicators that capture the best worldwide environmental data available on the country scale and incorporates criteria from other policy assessments such as the Millennium Ecosystem Assessment, the Intergovernmental Panel on Climate Change, the Biodiversity Indicator Partnership, and the Global Environmental Outlook-4.
Table 2.13. Status of Coral Reefs in Indonesia (%)
AreaNo. of
Locations Excellent Good Fair PoorWest 243 5.76 20.99 33.33 39.92Central 210 6.19 31.43 45.24 17.14East 195 9.23 29.23 33.08 28.46Indonesia 648 6.69 26.59 37.56 29.16
Note: Excellent = 75–100% living coral cover; Good: 50–74%; Fair:= 25–49%; Poor = 0–24%.Source: Suharsono (2005).

Indonesia: Critical Development Constraints
20
While the discussions in Chapter 3 argue that savings from a macroeconomic perspective are high, adjusted net savings (also referred to as “genuine savings”), taking into account natural resource and mineral depletion and damage from pollution, are low and are declining (Figure 2.15).4 Similarly, while the gross national savings have been comparable to savings in other developing countries in Asia, the adjusted net savings levels are very low
4 The “genuine saving” measure is a good starting point for measuring sustainability, but it has limitations. For example, positive genuine saving does not necessarily imply sustainability, because the economy can still be prone to external shocks, e.g., financial crisis, extreme climate impacts, etc. There are also measurement problems, particularly of natural resource depletion and pollution damage, normally leading to overestimating genuine saving. Also, the measure indicates whether total wealth rises or falls, but fails to account for population growth.
Figure 2.15. Savings Rates in Indonesia (% of GNI)
0
5
10
15
20
25
30
35
Gross National Savings Net National SavingsAdjusted Net Savings Linear (Adjusted Net Savings)
GNI = gross national income.Source: World Bank, WDI, accessed 25 March 2010.
1990
1991
1992
1993
1994
1995
1996
1997
1998
1999
2000
2001
2002
2003
2004
2005
2006
Figure 2.16. Saving Gap in Asia (2006, % of GNI)
0
10
20
30
40
50
60
Gross National Savings Adjusted Net Savings
GNI = gross national income.Source: World Bank, WDI, accessed 25 March 2010.
Lao
PDR
Japa
nIn
done
siaNe
pal
Kore
a, Re
p of
Philip
pine
sTh
aila
ndM
alay
sia
Indi
aVi
et N
amM
ongo
lia
PRC
(Figure 2.16). A recent World Bank report argues that the large gap in adjusted net savings is a direct result of the relatively high rate of natural resource depletion (World Bank, WDI). Declining trends in net adjusted savings are an initial sign that growth is environmentally not sustainable.5
2.3.2. Global Environmental Risks
Climate change is likely to be one of the most significant developmental challenges that Indonesia faces in the 21st century. Climate change is already starting to affect Indonesia (for example, see Ministry of Environment 2007 and ADB 2009a). The frequency and intensity of extreme weather events (such as droughts, floods, and storms) has been rising in recent decades. Annual mean temperatures are rising and are exacerbating water stress, constraining agricultural production, causing forest degradation, and increasing health risks. Without urgent global action, the annual mean temperature in Indonesia is projected to increase by 4.7°C by 2100 from the 1990 level and the global mean sea level is projected to rise by 70 centimeters during the same period (ADB 2009a). Indonesia is also projected to experience more extreme weather conditions: a drier dry season and a shorter rainy season with increased intensity of rainfall and risk of flooding. The impact of warming will be felt across sectors. The poor, with low capacity to adapt to these impacts, will be hit soonest and hardest.
5 Alisjahbana and Yusuf (2003) found similar evidence and suggested that the Indonesian economy was on a sustainable path during 1980−2000.
Table 2.14. Estimated Economic Costs of Environmental Degradation in Indonesia
Source of degradation
Economic cost
(% GDP)
Preliminary Ranking of Environmental Challenges
Impact potential
Availability of financial resources
Water, sanitation, and hygiene 2+ +++ ++Outdoor air pollution 0.9 ++ +Indoor air pollution 0.4 ++ +Forest degradation n/a ++ ++Soil degradation n/a ++ +Coastal and marine environment n/a ++ ++
Source: Leitman et al 2009.

Chapter 2. Development Performance
21
same year (Ministry of Environment 2003). About 80% of the carbon stock is stored in the standing forest, which will release large amounts of CO
2 into
the atmosphere if disturbed. Thus, Indonesia has placed a high priority on reducing emissions from deforestation and forest degradation. Efforts toward sustainable forest management, rehabilitation of degraded forest and nonforest land, and protected area management have multiple benefits. They help preserve rich ecosystems that support and service communities and the economy, as well as reduce CO
2
emissions and thus global climate risks. However, it is important to recognize that carbon stock is a global public good that comes with high opportunity cost to Indonesia, and due compensation from the international community is required.
Indonesia’s primary energy demand is projected to grow rapidly and, under a business-as-usual scenario, its energy sector would continue to be dominated by dirty fossil fuel (ADB 2009a). Its power generation will largely be coal-based. Gasoline-powered internal combustion engine vehicles will continue to dominate the transport sector and the numbers will increase dramatically during the next few decades. This could result in a rapid growth of CO
2 emissions as well as local
pollution that could have serious negative impacts on human health and natural systems.
Figure 2.17. Mean Impact on Indonesia under a High Emissions Scenario (% of GDP)
Note: The high emissions scenario assumes the current situation: a very diverse world, continuously increasing population, regionally oriented economic development, and fragmented technological change.Source: Authors.
2000 2020 2040 2060 2080 210010
6
8
4
2
9
5
7
3
1
0
MarketMarket + NonmarketMarket + Nonmarket + Risk of Catastrophe
Assessments based on the PAGE2002 model suggest that Indonesia is likely to suffer a lot from climate change in the future.6 The impact of climate change on the country—if the world is to continue its business-as-usual—could be equivalent to losing 7% of its GDP each year by 2100 on average (Figure 2.17). This is a conservative estimate based on scientific knowledge from the Intergovernmental Panel on Climate Change’s Third Assessment Report, published in 2000. The most recent climate science suggests, however, that the impact could be far more severe and could happen decades earlier than previously projected (Pew Center 2009).7 Further, the analysis does not cover extreme events such as flashfloods and tropical storms. Clearly, climate change, if not addressed, will seriously hinder Indonesia’s growth and poverty reduction efforts. Sustainability cannot be achieved unless Indonesia moves toward a climate-resilient development path. This is a long-term sustainability issue, but the preparation needs to start today.
2.3.3. Linking Local Environmental Sustainability and Global Environmental Risks
As global environmental problems such as climate change have an impact on Indonesia, environmental sustainability or lack of it in Indonesia can have major impacts at the global level, too. Indonesia is currently the world’s third largest emitter of greenhouse gasses (GHGs), with 84% of its GHG emissions in 2000 due to deforestation and land-use changes (WRI 2009a). The National Strategy Study for Clean Development Mechanisms Forestry formulated by the Ministry of Environment estimated Indonesia’s total potential carbon stock in 2000 at 90 billion tons of carbon dioxide (CO
2) equivalent, equivalent to more than
two times the total world GHG emissions in the
6 To put climate change impacts into perspective, PAGE2002, an integrated assessment model, is simulated to calculate the total cost of climate change. The model covers two types of impact: market impact (on the agriculture sector and coastal zones); and non-market impact (on health and ecosystems). The possibility of future large-scale discontinuity is also incorporated to reflect the increased risk of climate catastrophes, such as the melting of the West Antarctic ice sheet. Hope (2006) describes PAGE2002. The assumptions adopted in this analysis are consistent with those used in the Stern Review (Stern 2007).
7 For example, scientists recently observed that the Antarctic ice sheet and Arctic sea ice are melting more rapidly than expected. Taking into account the melting of Greenland and Antarctic ice sheets together with thermal expansion of the oceans, the projection of sea level rise would be 2–3 meters by 2100.

Chapter 3 Critical Constraints to Growth
Indonesia’s investment level was 30%–32% of gross domestic product (GDP) during 1990–1997 but plummeted to 11% of GDP in 1999 following the Asian financial crisis. The investment level has since recovered
somewhat and was about 25% of GDP in 2007 and 2008 (Figure 3.1). However, as in the case of GDP growth, the recovery falls well short of the level that prevailed prior to the crisis. Moreover, it does not compare favorably with the region’s faster growing economies—e.g., Viet Nam’s 41.1% of GDP and Thailand’s 28.8% in 2008.
Attaining the pre-crisis pace of GDP growth may not be possible unless investment is revived to that period’s level. The private sector will need
Figure 3.1. Investment Rate/Gross Domestic Capital Formation (% of GDP)
2008
05
101520253035404550
1990
1992
1994
1996
1998
2000
2002
2004
2006
Indonesia Malaysia Philippines
Thailand Viet Nam
GDP = gross domestic product.Source: IMF, IFS, accessed May 2010.
to be the driver of growth in the medium to long term. Public investment will also need to be boosted to address constraints related to the availability, reliability, and efficiency of infrastructure, and to meet the human capital needs. This chapter looks at the factors that may be constraining the Indonesian economy from attaining its pre-crisis levels of investment and growth. Specifically, the chapter asks if Indonesia’s investment and growth are being constrained by high cost of finance, low social return to investment, and/or low appropriability of that return.
3.1. Cost of Finance
A comparison with other major economies in Southeast Asia suggests that Indonesia’s domestic real interest rate is relatively high. Since the 1997 Asian financial crisis, Indonesia’s real lending rate has remained higher than the rates of the region’s other major economies except during the period of high inflation from late 2005 through early 2006. In December 2009, Indonesia’s real domestic lending rate stood at 10.9%, compared with 3.8% in Malaysia, 3.8% in the Philippines, 6.1% in Singapore, and 2.3% in Thailand (Figure 3.2). As discussed earlier, two possible reasons for the high cost of borrowing are a low level of domestic savings and inefficient financial intermediation.
Indonesia’s level of aggregate domestic savings is relatively low compared with its regional peers, but may not be a constraint to growth. A low level of domestic savings, in the presence of high demand, could push up the

Chapter 3. Critical Constraints to Growth
23
interest rate. Indonesia’s gross domestic savings as a percentage of GDP, after peaking at about 38% in 1992, fell to 31.5% in 1997 and to below 20% in 1999. The level has since recovered and was recorded at 30.6% in 2008. This, while comparable to the pre-1997 Asian crisis level, is relatively low when compared with those of its regional peers: in 2008 Malaysia’s savings rate was 42.3% and Thailand’s was 33.2% (Figure 3.3).
Low domestic savings may constrain growth only if they fall short of investment requirements in the economy. Comparing the trend of domestic savings with that of domestic investment suggests that such a constraint may may not be operating in Indonesia. Figure 3.4 indicates that, while the
Figure 3.2. Real Domestic Interest Rates (%)
10
5
0
5
10
15
Jan-
01
Jan-
02
Jan-
03
Jan-
04
Jan-
05
Jan-
06
Jan-
07
Jan-
08
Jan-
09
Indonesia Malaysia PhilippinesSingapore Thailand Viet Nam
Note: Real domestic rate is the domestic interest rate net of in�ation.Source: Estimates based on IMF, IFS, accessed May 2010.
Figure 3.3. Gross Domestic Savings (% of GDP)
60
50
40
30
20
10
0
1980 1983 1986 1989 1992 1995 1998 2001 2004 2007
Indonesia Malaysia PhilippinesThailand Viet Nam
GDP = gross domestic product.Source: IMF, IFS, accessed May 2010.
Figure 3.4. Domestic Savings and Investment Rates (% of GDP)
4540353025201510
50
1990 1992 1994 1996 1998 2000 2002 2004 2006 2008
Gross Domestic Capital FormationGross Domestic Savings
GDP = gross domestic product.Source: IMF, IFS, accessed May 2010.
level of domestic savings may have constrained investment in the years leading to the Asian financial crisis, investment has remained short of domestic savings since then. In 2008, gross domestic capital formation was reported at 27.8% of GDP while gross domestic savings were at about 30.6%.
The efficiency of Indonesia’s domestic financial intermediation is among the lowest in Southeast Asia. Inefficient financial intermediation can also increase the cost of financing for investors. In 2008–2009, the banking sector accounted for more than 80% of the financial sector assets and was the largest source of domestic financing for the corporate sector, at about 48%. A useful indicator for assessing the efficiency of the banking sector is the size of the spread between the lending and deposit rates, with a higher spread indicating less inefficient financial intermediation and vice versa. In Indonesia, this spread, after narrowing to less than 2 percentage points in the run-up to the Asian financial crisis, rose to 7.7 percentage points in 2004 before declining to 5.1 percentage points in 2008 (Figure 3.5). Moreover, the spread is among the highest in the region. In 2009, the percentage point spread was 3.0 for Malaysia, 4.9 for Thailand, and 5.1 for Singapore. Indonesia’s spread also seems to have been experiencing larger and more frequent fluctuations than the spreads in the other countries.
Growth in real domestic credit has not recovered since the 1997 Asian financial crisis. The volume of domestic credit in real

Indonesia: Critical Development Constraints
24
terms, which was climbing steadily prior to the 1997 Asian financial crisis, has been somewhat stagnant since then. In 2008, the volume of real domestic credit was only about 85% of the 1997 level, a trend similar to that in the Philippines and Thailand. The decline in the domestic credit seems even more pronounced when expansion in the economy is taken into account. In 2008, domestic credit as a percentage of GDP was 36.7%, compared with 59.6% in 1997 and 62.1% in 1999 (Figure 3.6). This decline was observed in other Southeast Asian countries as well. Between 1997 and 2008, the real domestic credit to GDP ratio fell from 177.6% to 105.1% for Thailand, from 163.4% to 115.2% for Malaysia, and from 78.5% to 40.9% for the Philippines. Prior to the onset of the recent global
Figure 3.5. Spreads between Deposit and Lending Rates (percentage points)
-10-8-6-4-202468
10
1990 1993 1996 1999 2002 2005 2008
Indonesia Malaysia PhilippinesSingapore Thailand Viet Nam
Note: Real domestic interest rate is the domestic interest rate net of in�ation.Source: IMF, IFS, accessed May 2010.
Figure 3.6. Ratio of Domestic Credit to GDP (%)
200
150
100
50
01990 1992 1994 1996 1998 2000 2002 2004 2006 2008
Indonesia Malaysia PhilippinesSingapore Thailand Viet Nam
GDP = gross domestic product.Source: IMF, IFS, accessed May 2010.
Figure 3.7. Excess Local Currency Reserves with Banks (Rp billion)
0
50,000
100,000
150,000
200,000
250,000
Jan-03 Jan-04 Jan-05 Jan-06 Jan-07 Jan-08 Jan-09 Jan-10
Required Levels Actual Levels
Source: Bank Indonesia, Bank Weekly Report, Table 6, accessed May 2010.
economic crisis, Singapore and Viet Nam were the only major economies in the region that had been experiencing growth in real domestic credit.
Stagnation or decline in the level of financial intermediation or the degree to which the banking sector puts its deposits back into the economy could be due to a number of factors. One could be that the banks lack funding sources. This does not seem to be the case in Indonesia for two reasons. First, the banking sector has excess liquidity and is holding reserves in excess of Bank Indonesia’s statutory requirements (Figure 3.7). Between July 2009 and March 2010, the level of actual reserves was 55%–72% higher than the required level.
Second, the health of Indonesia’s banking sector has been improving. Nonperforming loans as a percentage of total loans declined from a high of 48.6% in 1998 to about 3.8% at the end of 2008, which compares favorably with about 2.2% in Malaysia (Figure 3.8). Indonesia’s capital adequacy ratio has also improved substantially and was reported at 16.7% at the end of 2008—well above the benchmark level of 12%—and compares well with 9.1% in the pre-crisis period and a low of –15.7% in 1998. The capital adequacy ratio also compares favorably with Malaysia’s 12.1% and Thailand’s 14.2%. The banks’ rate of return on assets has been improving too, and was at 2.3% at the end of 2008, compared with a pre-crisis rate of 1.4% and a low of –18.8% in 1998.
Another factor that may explain the stagnation in real domestic credit growth is the lack of

Chapter 3. Critical Constraints to Growth
25
Figure 3.8. Health of the Banking Sector (%)
-20
-10
0
10
20
30
40
50
1997 1998 1999 2000 2001 2002 2003 2004 2005 2006 2007 2008
Non-Performing Loans Capital Adequacy RatioRate of Return on Assets
Source: Data for the capital adequacy ratio and return on assets are from IMF, Global Financial Stability Report; data for nonperforming loans are from the Bank Indonesia website.
investors’ appetite for bank credit, as they may have access to more attractive financing sources for their investments. This explanation is reasonable given that Indonesian spreads between lending and deposit rates are high, which may make borrowing from the banks less attractive. This view also draws support from a recent International Monetary Fund (IMF) study that found the real demand for credit to be significantly lower than the supply during most of the 2000s (IMF 2007). The trend in bank credit growth also seems to be consistent with the findings of other studies indicating that the corporate sector increased reliance on bonds and equity markets for its financing needs (IMF 2008).
Access to international financial markets is limited, but it may not constitute a critical constraint. Prior to the onset of the global economic crisis, investors had increasingly been tapping into international financial markets. The cost to access the international markets, however, seems high. The sovereign spreads are substantially larger for Indonesia than for the other major Southeast Asian economies (Figure 3.9). Moreover, the spread has spiked since the onset of the global economic crisis even though the Indonesian economy weathered the crisis better than other economies in the region. Between mid 2007 and late 2008, the spread rose by about 1,000 basis points. The high sovereign spread despite extensive reforms or substantial improvements in the economy has been the focus of a number of studies. A new study concluded that the recent spikes in the sovereign spread had several causes, including external factors, political stability, and macroeconomic management (IMF 2009).
Figure 3.9. Sovereign Spreads (basis points)
5
0
5
10
15
20
July-03 July-05 July-07 July-09
Indonesia Philippines ThailandSingapore Malaysia
Source: IMF, IFS, accessed September 2009.
Although the cost of accessing the international financial markets is high, Indonesia has increasingly relied on them. The country’s source of international financing has predominantly been loans from foreign banks, but its use of offshore bonds has grown substantially in recent years. An IMF study notes that, while foreign loans reported to Bank Indonesia grew at just about 1% per annum between 2003 and 2007, the volume of outstanding offshore bonds more than tripled during the same period (IMF 2008). At the end of 2007, outstanding offshore bonds accounted for about 10% of the total corporate nonfinancial financing and were five times the volume of the domestic (onshore) bonds.
Although the access to and cost of finance do not seem to constitute a critical constraint to private investment overall, small and medium-size enterprises find it difficult to access finance. Recent surveys support the view that investors do not consider either the access to or cost of finance as a major constraint to doing business in Indonesia. In an investment climate survey in 2007, firms ranked cost of finance 12th in the list of constraints, a drop from 6th in a similar survey in 2003 (LPEM–FEUI 2007, ADB and World Bank 2005). Similarly, investors ranked access to finance 20th in the list of top constraints in 2007, down from 16th in 2003. The situation may have changed with the onset of the global economic crisis. Recent studies indicate that the impacts of the crisis on the economy are already starting to be reversed and, along with other aspects, the access to finance is also improving to the pre-crisis level.

Indonesia: Critical Development Constraints
26
While financing for larger corporate investors does not seem to be constrained, small and medium-size enterprises (SMEs) may have difficulties in accessing finance. Given the SME sector’s greater reliance on the banking sector, cost of financing may be a larger concern for such enterprises. In addition, a recent IMF study notes that the global economic crisis’ impact on SMEs was disproportionately large, with new lending for them declining more significantly than that for larger investors (IMF 2009).
3.2. Social Returns to Investments
Low economic growth can also be explained by low returns to economic activity, which in turn can be on account of low social returns to investment and/or low private appropriability of the returns. Social returns (or returns to society) can be affected by the level of investment in human capital, infrastructure, and other public goods that complement private investment. Inadequate investment in these complementary factors can lead to low social returns by dampening the productivity of factors of production and increasing the cost of doing business, which in turn lower the returns to investment. A comparison of social returns across the major Southeast Asian economies suggests that, while Indonesia’s social return to investment is at a level similar to the pre-crisis situation, it is lower than that of Malaysia and the Philippines (Figure 3.10). A low level of social returns could be a symptom of deficiencies in human capital and/or infrastructure.
Figure 3.10. Social Returns to Investment in Selected Countries (%)
0
10
20
30
40
1990–1997 1998–2002 2001–2008
Indonesia Malaysia Philippine Thailand
Note: Estimated as the ratio of gross domestic product (GDP) growth rate and gross capital formation as a percentage of GDP.Source: Estimates based on WDI, World Bank (May 2010).
3.2.1. Human Capital
Investment in human capital development is lower than required. The overall educational attainment of Indonesian workers has improved remarkably in recent years. Indonesia, however, still faces a challenge to equip its workers with marketable skills. More than two of every three workers have not completed high school education (Table 3.1). One reason for this is insufficient investment in education in the past. Public investment in education as a percentage of GDP or of total government expenditure lagged behind that of other major economies in the region, such as Malaysia and Thailand (UNDP 2007). Though the government has increased its budget allocation to education in recent years, evidence suggests that the low level of investment has hampered the improvement of quality in education. In addition, due to the country’s vast size and varied geography, access to education is difficult in remote areas. Workers with a low educational attainment tend to engage in low productivity activities. Household survey results unveil the intergenerational transmission of poverty through a vicious cycle of low educational attainment of parents, low household income, and low investment in children’s education.
An international survey by the Organisation for Economic Cooperation and Development (OECD) indicates that low public spending on education appears to have compromised the quality and outcome of education in Indonesia (OECD 2007). The Programme for International Student Assessment surveyed key competencies and cognitive skills of 15-year-old students. Table 3.2 shows the student’s 2006 mean scores for literacy, mathematics, and science. The results revealed that Indonesian students on average performed below Thai students and students from non-OECD middle income countries. These results may stem from the fact that 57.4% of teachers did not meet minimum teaching requirements in Indonesia (MNE 2008). On a positive note, the mean scores of Indonesian students improved considerably between 2000 and 2006. This is in stark contrast with result of other non-OECD countries that participated in the survey, whose achievements tended to decline. The vocational education and training system also has considerable room for improving the effectiveness of the curricula, number of qualified training instructors, capacity, training equipment, and links between training

Chapter 3. Critical Constraints to Growth
27
Table 3.2. Quality of Education
Mathematics Science Reading
Mean PISA Scores, 2006
OECD Average 498 500 492
27 Middle-Income Economies 437 443 425
Thailand 417 421 417
Indonesia 391 393 393
Share of Students below Proficiency Levels, 2006 (%)
OECD average 21.3 19.3 20.1
Thailand 53.0 46.1 44.6
Indonesia 65.7 61.6 58.3
OECD = Organisation for Co-operation and Development, PISA = Programme for International Student Assessment.Note: The 27 middle-income economies are Argentina; Azerbaijan; Brazil; Bulgaria; Chile; Colombia; Croatia; Estonia; Hong Kong, China; Indonesia; Israel; Jordan; Kyrgyz Republic; Latvia; Liechtenstein; Lithuania; Macao, China; Montenegro; Qatar; Romania; Russian Federation; Serbia; Slovenia; Taipei,China; Thailand; Tunisia; and Uruguay. Source: OECD (2007).
Table 3.1. Share of Labor Force by Age Group and Educational Attainment (age 15+, %)
Age Group/ Gender
Junior High School or Below
General High School
Vocational High School
Diploma Academy (college) University
2004 2008 2004 2008 2004 2008 2004 2008 2004 2008
Men
20–24 61.7 57.6 22.8 24.6 13.1 13.8 1.5 2.3 0.9 1.7
25–29 63.2 60.1 20.2 19.9 10.2 11.7 2.5 3.2 3.9 5.1
Age Total 72.4 69.4 14.8 16.2 7.5 8.2 2.2 2.2 3.2 4.1
Women
20–24 56.9 49.9 24.4 27.5 12.4 11.9 3.9 6.7 2.4 4.0
25–29 65.1 57.6 16.5 17.9 8.0 8.3 4.5 7.1 5.8 9.0
Age Total 80.0 72.4 10.8 13.2 5.9 5.9 2.8 4.1 0.6 4.5
Source: Data from BPS, Sakernas.
providers and the private sector’s demand for skills (ILO forthcoming).
Investors do not consider the scarcity of human capital as a priority constraint, but the returns to some categories of highly skilled workers have increased at disproportionately high rates, suggesting skills shortages in some industries. Feedback from the investment climate survey suggests that business is not constrained by the availability of skilled workforce (LPEM–FEUI 2007). Indonesia has a substantial labor surplus and young workers
are willing to move in search of better income opportunities (Sziraczki and Reerink 2004). Hence most investors who are willing to pay efficiency wages will not find it difficult to recruit workers, except for highly skilled workers in certain occupations. Although the share of the workforce with at least high school education is low, the absolute number of high school graduates is substantial. Investment climate surveys thus do not usually detect underlying issues of human capital and skills supply.
Caveats apply to the seemingly sufficient supply of skills in the Indonesian labor market as opinion surveys often fail to reflect potential investors’ views. The perception of managers of existing companies constitutes only a partial picture of the investment climate, because their views are not necessarily the same as those of managers who decided not to invest in Indonesia. Indeed, certain types of investment depend heavily on skills availability. For example, call center businesses and information technology industries would invest in India or the Philippines, where relevant skills are more available. This suggests that, due to the low availability of a skilled workforce, Indonesia is missing opportunities for growth and employment creation.
Another indication of possible skills shortages is that the returns to education have been rising constantly since the 1997 Asian financial crisis and the gap between wages for workers with primary education and those with university education has been widening (Figure 3.11). The ratio of wages for workers with university education to that for workers with primary school education increased from 3.5 in 1998 to 4.4 in 2008.

Indonesia: Critical Development Constraints
28
Figure 3.11. Hourly Nominal Wages by Educational Attainment (Rp)
Primary Junior High
High High-Vocational
University
0
2,000
4,000
6,000
8,000
10,000
12,000
14,000
16,000
1998 2000 2002 2004 2006 2008
Source: BPS, Sakernas.
Figure 3.12. Sectoral Output and Employment Growth (2004–2008, annual %)
Agriculture, livestock, forestry and �shery
Mining and quarrying
Manufacturing Trade, hotel &
restaurants
Transport and communication
Finance, real estate and business services
Community, social & personal services
All sectors
0
2
4
6
8
0 2 4 6 8 10 12 14 16
Empl
oym
ent
Output
Construction
Note: The size of each bubble represents its sector’s share of employment in total employment.Source: Based on BPS, Sakernas.
The increasing return to education may also reflect structural changes in the composition of industry. While service sectors recorded above average growth of output and (consequently) jobs (Figure 3.12), the manufacturing sector, especially labor-intensive manufacturing, has been slowing down. Obviously, demand in the labor market has been increasing for highly skilled workers. If this trend continues, skill shortages may constrain economic growth in the future. In addition, Indonesia has not successfully improved the export performance of technology- and skills-intensive, high value-added activities despite the loss of international competitiveness in labor-intensive manufacturing (Islam and Chowdhury 2009). Rigorous investments in human capital may be needed if the manufacturing sector is to meet the challenge of gradually moving to products with higher value addition.
3.2.2. Infrastructure
Inadequate infrastructure is a constraint to growth and private investment, both at national and subnational levels. Poor availability and quality of infrastructure can reduce the economic returns to (and thereby deter) investment. The low quality of physical infrastructure is a major problem of the Indonesian economy. The 2010 World Economic
Forum Report ranked Indonesia 96th among 133 countries (Figure 3.13) due to the poor state of various components of its infrastructure (World Economic Forum 2009). In contrast, Malaysia was ranked 27th and Thailand 36th. However, Indonesia performed marginally better than the Philippines, at 98th, and Viet Nam, at 111th. Poor infrastructure negatively affects Indonesia’s global competitiveness. The 2010 World Economic Forum Report ranked
Figure 3.13. Quality of Infrastructure and Global Competitiveness
0
20
40
60
80
100
120
Indonesia Malaysia Thailand Philippines Viet Nam
Infrastructure Quality Global Competitiveness
Note: Rankings are for 133 countries. The lower the ranking, the better the infrastructure quality and higher the global competitiveness.Source: World Economic Forum (2009).

Chapter 3. Critical Constraints to Growth
29
Figure 3.14. Quality of Key Infrastructure (rank among 133 countries)
0
20
40
60
80
100
120
RoadsRailroad Ports
Air TransportElectricity
Indonesia Malaysia Philippines
Viet Nam Thailand
Note: A lower rank implies better infrastructure.Sources: World Economic Forum (2009).
Figure 3.15. Investor Feedback on Infrastructure-Related Constraints (% of respondents)
0
10
20
30
40
50
60
Transport Electricity Communication
2003 2005 2007
Sources: ADB and World Bank (2005), LPEM-FEUI (2007).
Indonesia 54th in global competitiveness, which compared unfavorably with Malaysia (24th) and Thailand (36th), but was better than the Philippines and Viet Nam.
Poor infrastructure and its impact on competitiveness are also reflected in the investor feedback in the World Competitiveness Yearbook 2009, which ranked the lack of adequate infrastructure as the second most problematic factor for doing business in Indonesia (IMD 2009). In terms of adequacy of infrastructure, Indonesia was ranked 55th among 57 countries, which was a slip from 53rd in 2008 and was far behind Malaysia (26th) and Thailand (42nd).
Findings of a 2008 survey conducted by the Japan External Trade Organization revealed that 28.4% of the respondent Japanese firms with active or planned investments outside Japan considered inadequacies in infrastructure to be a major constraint to investment in Indonesia (JETRO 2009). That this is 4.5 percentage points higher than the 2007 level is a matter of concern. These findings are an important gauge of the potential foreign investors’ perception of the attractiveness of investing in Indonesia, as businesses that are not yet invested there have greater options to locate elsewhere than do those who have already invested in the country.
Among the key infrastructure subsec-tors, investors consider poor transport networks and inadequate electricity supply to be the most critical. The Global Competi-tiveness Report 2009–2010 ranked Indonesia far behind Malaysia and Thailand in the quality of road network, port and air transport infrastructure, and electricity supply (Figure 3.14). These findings are consistent with the feedback received by investment climate surveys in 2003, 2005, and 2007 (ADB 2005, LPEM–FEUI 2007). The 2007 survey found poor transport the second most binding constraint to doing business in Indonesia, with 49% of the respondents identifying it as a major constraint—up from 29% in 2003 and 42% in 2005 (Figure 3.15). Of particular concern is the spike in the number of respondents that consider transport a major constraint, as this may indicate how fast the infrastructure is deteriorating. The availability of electricity was ranked 6th on the list, with 42% of the respondents identifying it as a major constraint—up from 35% in 2003 and 36% in 2005. On the other hand, respondents did not consider telecommunications as a critical constraint and ranked it 21st among 22 constraints.
3.2.3. Transport Network
Road network. Indonesia had over 396,000 kilometers (km) of roads at the end of 2007. Of that, 75% was paved—56% asphalted and 19% gravel surfaced. The country’s road density is among the lowest in Southeast Asia. This is true whether in terms of the length per 100 people or per square kilometer, and whether one looks at all roads or paved ones (Figure 3.16).
Another concern is that 36% of the road network was either damaged or severely damaged at the end of 2007 (BPS 2008b). Most of the damaged roads were under the purview of the district

Indonesia: Critical Development Constraints
30
governments, and 39% of the 322,000 km of roads under the district governments’ responsibility was considered damaged or severely damaged.
Ports. Most container cargoes in Indonesia are processed through the three main container terminals: Tanjung Priok in Jakarta, Tanjung Perak in Surabaya, and Tanjung Emas in Semarang. Tanjung Priok, with a total peak throughput of 4.2 million 20-foot equivalent units, is the country’s largest international container terminal. However, Tanjung Priok’s performance lags behind that of most other major ports in Southeast Asia. In volume of container handling, Tanjung Priok ranked 25th of the 50 major ports in the 2008 World Port Rankings (Fossey 2008). In comparison, the Singapore port was ranked 1st, Port Klang of Malaysia was 14th, and Laem Chabang of Thailand was 20th. The only major port ranked below Tanjung Priok was Manila Port of the Philippines, at 37th. Other comparisons suggest that Tanjung Priok is also less competitive in terms of the length and number of bureaucratic processes for clearance, waiting time, and port access.
The performance of smaller ports mainly catering to interisland cargoes is also poor. Table 3.3 highlights the underlying problems at the specific ports and shows that the low productivity may be due to the lack of equipment, inefficient work methods, limited berth lengths, and shallow routes.
Railroad Network. Compared with other countries in the region, Indonesia has the largest and most intensively used railway network. Of its
Figure 3.16. Road Network Coverage (km)
0.0
0.2
0.4
0.6
0.8
Indonesia Malaysia Philippines
Thailand Viet Nam
km = kilometer, Km2 = square kilometer.Notes: Latest data available for Indonesia are for 2007; Malaysia, 2006; Philippines, 2003; Thailand, 2006; and Viet Nam, 2004. Data on paved roads are not available for Viet Nam.Sources: ADB sta� estimates based on data from BPS (2008b) and World Bank, WDI, accessed in October 2009.
All Roads/km2 Paved/km2 All Roads/100 people
Paved/100 people
5,824 km of railways, 4,337 km are operational. The network, however, is mainly single track and limited to Java and Sumatra. The network’s operational performance is considered to be generally poor, with delays in both passenger and cargo traffic caused by multiple factors, including institutional problems, weak management, inadequate infrastructure, old and unreliable rolling stocks, and outdated signaling and telecommunication systems.
Air Transport. As of 2008, Indonesia’s air transport infrastructure comprised 182 regional and international airports. Deregulation of the airline industry in 1999 opened the sector to private airline companies, which led to lower fares in real terms and more scheduled flights to existing and new destinations. During 1999–2006, the annual passenger traffic grew from about 7 million to 34 million—almost a five-fold increase during a period of 7 years. The passenger load factor averaged 70% during 2002–2006. The freight load factor increased significantly, from 31.9% in 2002 to 56.0% in 2006 (BPS 2008b). International aircraft arrivals also increased significantly, from 23,000 in 1990 to 48,000 in 2007, an average annual increase of 5.2%. Similarly, aircraft departures rose from 23,000 to 49,400, an annual growth of 5.4% during the same period. Cargo arrivals increased annually by 11.9% and departures grew by 5.6% during 1990–2007 (BPS various years).
The entry of low-cost operators was a major reason for the rapid expansion in air traffic, and is widely credited with major social benefits given the geographical spread and archipelagic nature of Indonesia. At the same time, this has led to severe stress on the infrastructure and Indonesia now has
Table 3.3. Conditions of Regional Ports in Indonesia (2006)
PortsDraft (m) Problems
Banjarmasin 4–9 Congestion and shallow route
Batam 9–10 Underdeveloped
Belawan 7–9 Congestion and lack of loading/unloading facilities
Palembang 4–8 Shallow route
Pontianak 4–6 Congestion and shallow route
Samarinda 6–7 Congestion
Makassar 3–12 Congestion
Source: JICA (2006).

Chapter 3. Critical Constraints to Growth
31
overcrowded airport terminals and inadequate air traffic control. Air transport safety is also a significant concern. The country’s rate of fatal civil aviation accidents was 15 times higher than the world average (BPS 2008b). A government-sponsored study on flight safety in March 2007 reported that none of the country’s airlines were fully compliant with international safety standards. The Ministry of Transport acted quickly on the report’s findings and introduced more stringent controls over domestic flights.
3.2.4. Electricity
Indonesia’s electricity sector is characterized by a low electrification rate, a low consumption level, and high inefficiency in transmission and distribution (Box 3.1). The electrification rate climbed from 55% in 2003 to about 61% in 2007, and varied widely, from 21% in East Nusa Tenggara at one extreme to 88% in Jakarta province. In comparison, the electrification rate in 2003 was 97% in Malaysia, 84% in Thailand, 81% in Viet Nam, and 79% in the Philippines (ADB and World Bank 2005). Per capita electricity consumption in Indonesia was about 566 kilowatt hours (kWh) in 2007, compared with 3,667 kWh in Malaysia, 2,055 kWh in Thailand, 728 kWh in Viet Nam, and 586 kWh in the Philippines (World Bank, WDI). The system transmission and distribution losses of more than 11% in 2007 were also among the highest in the major Southeast Asian economies.
Indonesia had an installed generation capacity of about 44.5 gigawatts at the end of 2007, about 57% of which was owned by the state-owned Perusahaan Listrik Negara (PLN). Of the privately-held generation capacity, 14.8 gigawatts were owned by about 10,000 industrial and manufacturing units that had to generate power on their own because the PLN supplies were not available at their location or were not reliable. Self-generation of electricity is not easy, especially, for SMEs and commercial and residential consumers.
Indonesia’s residential and industrial power tariffs are among the lowest in the region and are below cost recovery levels, which limits PLN’s ability to invest in and expand generation capacity and networks and is a strong disincentive to private investment in the sector. The low power tariffs for industries may not reduce their power bills because many large industrial units have to rely on their own diesel generators, which is expensive.
3.2.5. Telecommunications
Although the business community did not consider telecommunications to be a major constraint, Indonesia lags behind other major Southeast Asian countries in this aspect too. This is evident in
• a low level of teledensity, driven by low investment in and unequal distribution of the infrastructure;
• low internet penetration;• lack of competition in the sector; and • lack of consistent and independent regulations
on telephony and internet services.
3.2.6. Irrigation
Irrigation infrastructure is inadequate and poorly maintained, and may constrain growth, especially in the outer islands that are highly dependent on agriculture. On some of the outer islands, agriculture accounts for a large share of gross regional domestic incomes. Productivity and choices of crops, however, are limited in these areas because of low availability of irrigation services and inefficient irrigation infrastructure. While the exact figures are not readily available, estimates suggest that less than 10% of land areas suitable for irrigation in Kalimantan, Maluku, and Papua had access to irrigation in 2004. In individual provinces, only 26% of the irrigable land in Central Kalimantan, 30% in Papua, and 40% in East Kalimantan had been utilized in 2004 (ADB 2006). Reliability and functionality of the irrigation schemes are also low due to poor management and lack of adequate investment in maintenance.
As a result of inadequate irrigation, crop productivity in the outer provinces is substantially lower than that in Java and Sumatra. For example, while the irrigated rice yield in Kalimantan, Maluku, and Papua was 2.8–3.5 tons per hectare, in Java it was 5.4–5.5 tons per hectare (ADB 2006).
3.2.7. Regional Disparity in Infrastructure
Inadequacy in infrastructure is more severe outside Java and Sumatra. There is large disparity in the availability of infrastructure and infrastructure services between Indonesia’s islands and provinces. The access to safe drinking water ranged from 87% of households in Java to 66% in Sumatra and about 50% in Kalimantan in

Indonesia: Critical Development Constraints
32
Box 3.1. One Step Forward, Two Steps Backward—Second Time Around?
Electricity Law No. 20/2002 was intended to reform the electricity subsector and encourage private invest-ment in it by introducing market competition; unbundling Perusahaan Listrik Negara (PLN), the state elec-tricity agency; establishing a regulatory agency; increasing the role of regional governments in provision of social electricity and price setting to noncompetitive regions; and encouraging private sector participation in the sector. The law was a breakthrough and its implementation would have brought Indonesia to par with other countries in the region that had initiated similar reforms. However, the law was annulled by the Constitutional Court of Indonesia in December 2004 on the grounds that it was not in line with Article 33 of the Indonesian Constitution of 1945, which states that “sectors of production which are important for the county and affect the lives of the people shall be controlled by the state.” The court interpreted the term “control” as to regulate, facilitate, and operate such facilities. The court decision was a major blow to the reforms in the subsector and the possibility of private sector participation.
Annulment of the law meant that the country had reverted to Electricity Law 15/1985. The court decision implied that private ownership of electricity was not in the people’s best interest and the efficiency gains envisaged through unbundling the industry into seven proposed areas (generation, transmission, distribu-tion, market operator, system operator, retail, and wholesale) were not to be achieved.
To formulate and enact a new law took nearly 5 years from the court decision and 8 years since passage of the 2002 law. The Indonesian Parliament passed the Electricity Law of 2009 (Law 30/2009) on 9 September 2009. The new law, although not as ambitious as the 2002 law, introduces changes that would allow enti-ties other than PLN to participate in electricity supply and aims to redefine PLN’s roles and mandates. The law’s implementing rules and regulations, however, are yet to be issued. Due to opposition from different sections, especially within PLN, there are fears that a long time may pass before the intent of the law can be put into action. Another concern is that the new law could also be struck down in court. The country has already lost 8 years by not implementing the 2002 law and the losses from the delay must be monumental in economic terms. Hopefully, any interventions by the Constitutional Court, if warranted, will work in favor of the general public’s welfare.
Main Provisions of Indonesia’s Electricity Laws
Sources: World Bank (2005), ALB Legal News, Purra (2010).
Electricity Law 30/2009
Perusahaan Listrik Negara will no longer have the monopoly on supplying and distributing to end customers. Independent power producers will be allowed these functions, particularly in the regions, although subject to a “right of first priority” provided to Perusahaan Listrik Negara.
Electricity Law 20/2002
The law established a competitive electricity market through multiple power generators and by restruc-turing and unbundling Perusahaan Listrik Negara’s functions. The law also provided the mechanism for adjusting electricity tariffs, rational-ized the mechanism for power purchase for the private sector and established a regulatory mecha-nism for the sector.
Electricity Law 15/1985
The Government of Indonesia is responsible for regulating the electricity sector. Private compa-nies are allowed to participate in the electricity business; however, Perusahaan Listrik Negara is the single buyer of electricity and controls both transmission and distribution functions

Chapter 3. Critical Constraints to Growth
33
2007. In electricity supply, the disparity is also large, with 37%–73% of households having access. Access to asphalt roads ranged from 40% to 72% of the villages within the individual provinces. There are similarly wide disparities in teledensity.
The disparity in access to key infrastructure and services has had implications for poverty and inequalities (see Chapter 4) and for investment patterns and economic growth. For example, Java received over 91% of the total foreign direct investment (FDI) and about 60% of the total domestic investment in 2008 while Sumatra accounted for just under 7% of the FDI and about 24% of the domestic investment (BKPM 2009). The imbalances in the investment flows suggest that the outer islands, Kalimantan, and Sulawesi will continue to lag behind and the gap between them and Java and Sumatra will continue to widen.
Regional disparity in infrastructure can also limit Indonesia’s ability to benefit from important regional initiatives such as the Indonesia-Malaysia-Thailand Growth Triangle (IMT–GT) and Brunei Darussalam-Indonesia-Malaysia-Philippines–East ASEAN Growth Area (BIMP–EAGA). The IMT–GT, in particular, with a potential consumer base of 70 million and possible interregional trade of $16.7 billion per annum, is designed to develop economic corridors that can lead to synergies and cooperation in furthering growth in the member countries. The IMT–GT has identified economic connectivity corridors that cover 10 provinces in Sumatra (Figure 3.17). To fully benefit from the IMT–GT and the preferential trade access, Indonesia would need to boost investments in manufacturing and services in the 10 provinces. However, it could be difficult to attract investment unless the transport networks and electricity supply in the provinces can be significantly improved. As of 2007, only 56% of the roads in the 10 provinces were paved and only 65% were in good to moderate condition (BPS 2008b). Moreover, the regional ports are too small and lack facilities to handle increased vo-lumes of trade. Electricity supply is also constrained and investors in manufacturing and services would have additional costs if they must provide their own generation capacities.
3.2.8. Key Constraints to Infrastructure Investment
A survey of key stakeholders active in the infrastructure sector in Java district in November
Figure 3.17. IMT–GT Economic Connectivity Corridors
IMT–GT = Indonesia-Malaysia-Thailand Growth Triangle.Source: IMT–GT Secretariat and ADB (2007).
and December of 2009 identified a number of critical constraints to infrastructure investment in the country (IDB 2010). These include, in order of severity, (1) difficulty in land acquisition; (2) weak human and institutional capacity; (3) poor governance; and (4) shortage of financing. These results were validated by an in-depth analysis of the key components of infrastructure—roads, railways, ports and airports, electricity, and communications.
In addition, impediments unique to several infrastructure subsectors were also identified by the survey. In road infrastructure, the lack of bankable projects in toll roads warrants particular mention. For seaports, the regulatory framework increases rent-seeking opportunities and encou-rages monopolistic behavior, thereby hindering competition and hampering efficiency of the sector. New investment in air transport infrastructure is discouraged by perceived low returns.
Investment in electricity infrastructure is hindered by social tariff-setting that is below cost recovery levels. Further compounding the problem is the lack of an appropriate risk-sharing mechanism with independent power producers. New investment

Indonesia: Critical Development Constraints
34
in the telecommunications sector is discouraged by the monopolistic environment and anticompetitive behavior such as practices in inter-operator charges.
Difficulty with Land Acquisition. Since 1993, the Indonesian government has promulgated various regulations on land acquisition.1 However, the inability and reluctance to strictly enforce legislation on the fast-track land acquisition process has created uncertainty in project implementation schedules, which adversely affects rates of return. The difficulty has discouraged investment in infrastructure, particularly in roads and electricity, where land is a key component. Further, some of the laws are not mutually supportive,2 and legislation to address speculative activity is not adequately enforced. This indicates weak institutional capacities and, to some extent, lack of strong political will to enforce land acquisition laws, which is needed to facilitate rapid resolution of disputes over land prices. Inefficiencies in spatial planning have also compounded the problem of land acquisition.
Weak Human and Institutional Capacity. Weaknesses in human and institutional capacity are evident in the paucity of bankable projects prepared by the government, and by the slow physical and financial progress of projects as they are implemented. The problem is aggravated by the dissipation of power through decentralization, the lack of coordination and of clarity on roles, and delegation of authority and/or responsibility. This is exacerbated by the laws and regulations that at times explicitly and implicitly discourage private investment in certain sectors. Consequently, the private sector has found interacting with various layers of government to be frustrating and time consuming.
Poor Governance. The lack of institutional and human capacity has been compounded by poor governance. Discussions with the private sector in Indonesia indicate that investors usually factor the cost of rent seeking into their project planning and financing, and view the expense as part of normal business running costs. Rent-seeking activities
1 Presidential Decree No. 55/1993; Presidential Decree No. 36/2005; Presidential Decree No. 65/2006; BPN Regulation No. 3/2007; and Presidential Regulation No. 13/2010.
2 For example, Land Expropriation Act No. 20/1961 (issued under Basic Agrarian Act 1960) and Forestry Law 41/1999 have objectives that do not support each other. These laws are not well-defined and often cause disputes with the National Land Agency (BPN).
adversely impact project viability, and, in some instances, result in quality being compromised. Poor governance is also evident in the complex public procurement procedures and their weak and non-transparent implementation. The issue of governance is covered in more detail elsewhere in this chapter.
Shortage of Financing. By their very nature, infrastructure projects require long-term financing, which the private sector identifies as being in short supply. Short-term financing is not a major constraint for the public or private sector in Indonesia.
3.3. Appropriability of Returns to Investments
Private parties will invest only when they expect to capture adequate returns from their investments. Anything that weakens or lowers such returns discourages investment and, ultimately, slows economic growth. Risks to such appropriability can emanate from government or market failures. Government failures increase macro or micro risks. The macro risks may include fiscal and financial crises; the micro risks may be bad governance such as corruption, weak rule of law, overly burdensome taxation, and labor–capital conflicts. Market failures affecting appropriability normally reflect information and learning externalities and coordination failures.
3.3.1. Macroeconomic Risks
Indonesia’s macro management is sound, with low levels of fiscal deficit, a current account surplus, and manageable levels of debt and inflation. Indonesia’s policy framework has evolved significantly. Gains in the economic front since 2001 have been due to sound macroeconomic management and some key economic reforms. Since 2000, the fiscal position has improved, the current account has been in surplus, domestic and external debts have halved, and inflation is at a manageable level.
Fiscal Position. Indonesia has been recording fiscal deficits since the 1997 Asian financial crisis. The fiscal position, however, has gradually improved from a deficit of 2.5% of GDP in 1999 to a deficit of 0.1% in 2008 (Figure 3.18). Improvements in the fiscal position have been driven by a reduction in

Chapter 3. Critical Constraints to Growth
35
Figure 3.18. Fiscal Position of the National Government (% of GDP)
3
0
3
1990 1993 1996 1999 2002 2005 2008
GDP = gross national product.Source: ADB (2009b).
Figure 3.20. Tax Revenues in Selected Southeast Asian Countries (% of GDP)
0
5
10
15
20
25
1990 1993 1996 1999 2002 2005 2008
Indonesia MalaysiaPhilippines Thailand
GDP = gross national product.Source: ADB, SDBS, accessed October 2009.
Figure 3.19. National Government Revenue (% of GDP)
0
5
10
15
20
25
30
1985 1988 1991 1994 1997 2000 2003 2006
Indonesia MalaysiaPhilippines Thailand
GDP = gross national product.Source: ADB, SDBS, accessed October 2009.
the untargeted fuel and electricity subsidies and an increase in the government revenues.
On the revenue side, the level improved from about 15% of GDP in 2001 to nearly 19% in 2008 (Figure 3.19). Improvements in the level of revenues, although comparable with other major Southeast Asian economies, were partly on account of high commodity prices and may not be sustainable when commodity prices start to subside. The tax effort, too, has been improving. But, at 13.3% of GDP in 2008, the level was still lower than in most of the region’s other major economies: 15.3% for Malaysia, 15.2% for Thailand, and 14.1% for the Philippines (Figure 3.20).
Inflation. Inflation has historically hovered between 8% and 10% (Figure 3.21). At the time of the 1997 Asian financial crisis, inflation climbed to 58%, but then declined to 20% in 1999 and to 4% in 2000. Inflation again breached the 10% level in 2001 and 2002 due to rising fuel and food prices. As a result, monetary policy was directed at achieving a target inflation rate. In 2005, the monetary policy was shifted toward full-fledged inflation targeting, which helped the economy tackle the fuel and food price rises during 2005–2008. Inflation in 2008, at about 9.2%, was higher than the levels in some other major economies in Southeast Asia. Recent data, however, indicate that the inflation rate dropped further and was at about 4.9% by the end of 2009 (BPS Baden Pusat Statistik website).
Figure 3.21. Inflation (%)
05
1015202530354045505560
1982
1985
1988
1991
1994
1997
2000
2003
2006
2009
Source: World Bank, WDI, accessed16 October 2009.

Indonesia: Critical Development Constraints
36
Current Account Balance. The current account has been in surplus since the 1997 Asian financial crisis (Figure 3.22). Factors contributing to the surplus include good export performance due to high commodity prices and strong demand, a stable rupiah, and large remittances from overseas workers. The current account position weakened somewhat in 2004–2005 (partly because of increased freight costs and taxes and duties adversely affecting exports) and came under pressure again more recently, due to the global economic crisis. Nevertheless, the current account was able to post a small surplus in 2008, which increased to 2% of GDP in 2009 (ADB 2010).
Public debt is at a manageable level, and has been steadily declining. Consistent with the improved fiscal position and good growth performance, public sector debt as a share of GDP has been declining, from 80% in 2000 to 35% in 2008 (Figure 3.23). Other contributing factors included passage and implementation of Law No. 17 of 2003 (the Fiscal Law), which introduced caps on the budget deficit and public debt levels. At the same time, the share of interest payments in total government spending also fell, from 25% in 2001 to about 10% in 2009 on account of lower interest rates, a stable stock of debt outstanding, and appreciation of the rupiah (Bank Indonesia website).
Despite improvements in the macroeconomic policy framework and in growth performance, macroeconomic instability remains a key investor concern. In a 2007 survey, more than 50% of responding
Figure 3.22. Current Account Balance (% of GDP)
4
2
0
2
4
6
1990 1993 1996 1999 2002 2005 2008
GDP = gross national product.Source: ADB (2009b).
Figure 3.23. Debt to GDP Ratio (%)
0
20
40
60
80
100
120
1999 2002 2005 2008
External Domestic Total
GDP = gross national product.Source: Bank of Indonesia, Indonesia Economic Monetary Statistics Weekly Report.
firms considered macroeconomic instability and 40% considered uncertainty in economic policies to be major constraints (LPEM–FEUI 2007). The findings were an improvement on those of the 2003 investment climate survey, where nearly 80% of responding firms identified macroeconomic instability and uncertainty in economic policies to be a major constraint (ADB and World Bank 2005). Divergence between investor perceptions and the recent track record of the Indonesian economy and its management tends to suggest that investors have not forgotten the 1997 Asian financial crisis. However, that Indonesia was one of the best-performing countries in Southeast Asia during the recent global economic crisis may help investors regain their faith in the economy and its management.
Budget allocations for key development sectors have been declining while those for public services have been rising. Compared with other major economies in Southeast Asia, Indonesia’s development expenditure has been low; as a result it has not been able to fully meet investment needs of key sectors—particularly infrastructure, health, and education—that may be essential for faster economic growth (Figure 3.24). Budget allocations have been dominated by general public services, which include salaries and recurrent expenditures and have accounted for nearly three-fourths of the total budget allocations since 2001. While the share of economic services has increased somewhat since 2004, current allocations remain well below the vast amount required to improve and expand infrastructure and meet other development needs.

Chapter 3. Critical Constraints to Growth
37
Figure 3.24. Government Expenditure by Type of Services (%)
100
75
50
25
01996 2001 2003 2006 2008
General Public Services DefenseEducation HealthSocial Security/Welfare HousingEconomic Services Others
Source: ADB (2009b) and BPS (various years).
3.3.2. Microeconomic Risks
Control of Corruption
Corruption is perceived to be high in Indonesia, and may be constraining the entry of new businesses and investments. In terms of control of corruption, Indonesia has fared rather poorly compared with some other major economies
Figure 3.25. Control of Corruption Rank (%, various years)
0
10
20
30
40
50
60
1996 1998 2000 2002 2003 2004 2005 2006 2007 2008
Indonesia Regional Average*
E�ectivity of Decentralization Law (Jan 2001)
Establishment of the KPK (2002)
New OrderRegime
TransitionalGovernment of Pres. Habibie (1998–1999)
Susilo Bambang Yudhoyono and Jusuf Kalla elected as President and Vice-President, respectively (2004)
SB Yudhoyono was re-elected with running mate Bank Indonesia Governor Boediono (2009)
Presidential instruction 5/2004—10 instructions to all institutions and 11 special assignments to various Ministers
A. Wahid was elected into o�ce (1999)
Vice Pres. Megawati Sukamoputri takes overs as President (2001)
KPK = Komisi Pembaratasan Korupsi (Corruption Eradication Commission).Note: The regional average is for Indonesia, Malaysia, the Philippines, Thailand, Singapore, and Viet Nam.Source: World Bank, Governance Matters VIII.
in the region. The World Bank’s Governance Indicators rated Indonesia at 34% in control of corruption in 1996, lower than most neighboring countries, including Malaysia, the Philippines, Singapore, and Thailand (Figure 3.25). Indonesia’s rate declined sharply to below 10% in the aftermath of the 1997 Asian financial crisis and the transition from the New Order Regime to a democratic setup. The decline also suggests that the introduction of decentralization through the “big bang” approach in 1999 may have weakened the efforts to control corruption in the country (Box 3.2).
Comparison with other major Southeast Asian countries suggests that Indonesia ranked much lower in control of corruption than Malaysia and Thailand in 2008, although it fared better than the Philippines and Viet Nam (Figure 3.26). Other international surveys paint similar pictures. Transparency International’s 2007 Corruption Perceptions Index placed Indonesia, together with Gambia, the Russian Federation, and Togo, 143rd among 179 countries. In 2008, the ranking improved to 126th out of 180 countries, which was better than the Philippines at 141, but far behind Malaysia at 47, Thailand at 80, and Viet Nam at 121 (TI Surveys and Indices).
A 2007 investment climate survey found that corruption in national institutions, such as tax and

Indonesia: Critical Development Constraints
38
Box 3.2. A Move in the Right Direction with Unexpected Results.
Typical outcomes expected from decentralization of the government roles would include improvements in governance and service delivery. However, the experience from Indonesia suggests that decentralization resulted in major dents in the quality of governance in the country. In particular, quality of government ef-fectiveness and control of corruption plummeted in the early years of decentralization.
One major change brought about by decentralization was the way that the national and regional gov-ernments planned and interacted. Not only did the local governments have full autonomy to plan but they were also not required to report to the national government on their yearly achievements and per-formance. Venues and forums for coordination became weak and led to situations where the national and local level initiatives overlapped. In some cases, the full benefits of investments could not be achieved due to lack of complementary investments from the national or local governments. An example is the Surabaya-Gempol toll road in East Java, which ended up competing with provincial roads that were upgraded and improved in parallel. On the other hand, the Waru-Juanda toll road in East Java could not deliver the envis-aged benefits due to poor connectivity with other major roads in the vicinity.
Empowered to enact local level laws and regulations, the local legislative bodies literally went on a spree of enacting regulations. Perdana and Friawan (2007) noted that the districts had been enacting, on average, 30 laws and regulations a year. Studies point out that these laws and regulations often were not consistent with national laws and regulations, which created additional hurdles to investment. Given that most lo-cal governments were facing a resource crunch and the roles pertaining to revenue generation were not clearly defined, it was of little surprise that majority of these new laws and regulations were focused on gen-erating new revenue. Perdana and Friawan noted that as much as 60% of the new regulations introduced new levies and taxes, which added to the cost of doing business, both in terms of money and time. An ADB study (2004) found that trucks transporting fresh oranges from North Sumatra to Jakarta had to stop at 16 weigh stations operated by different district governments and had to pay Rp268,500–Rp1,008,500 (about $25–$100) at each station.
Decentralization also resulted in fragmentation of corruption, and made the efforts to control it even more difficult. The flurry of new local laws and regulations also created new opportunities for rent seeking. Where the businesses were used to having to pay to one or two officials, now they were expected to pay off officials at district, provincial, and national levels in every district where they operated or through which they trans-ported their goods. A 2008 Asia Foundation study found that, on nine of the surveyed routes, trucks were stopped on average four times and had to pay Rp17,582 in illegal payments to police and other groups.
In part, the unexpected outcome may have been due to the transformation to decentralization through a “big bang” approach with little or no prior preparation at the local government levels. The government introduced several measures to correct for this; nevertheless, aspects of governance have not been able to climb back to the levels that prevailed in 1996.
Source: Asia Foundation (2008).
customs administration, continues to be a major investment constraint (LPEM–FEUI 2007). Of the 420 responding firms that had to deal with the customs administration, 86% acknowledged having to make informal payments and bribes to officials, which averaged 6.1% of firms’ annual production costs. The survey also found that firms’ senior management had to spend 5.9% of
their time dealing with government officials in 2006. The survey found that government officials visited firms frequently, and 50% of respondents reported that they were expected to provide gifts or bribes during the visits. Visits by security agencies (police and military) were reported to be the most frequent, averaging about six per year.

Chapter 3. Critical Constraints to Growth
39
In response, the government has taken several steps. An example is establishing the Corruption Eradication Commission (KPK) in 2002, which has proven highly effective in investigating and prosecuting bribery and graft-related cases. After coming to power in 2004, President Yudhoyono’s administration acknowledged corruption as a major menace to society and a constraint to growth and made the fight against corruption a key government priority. The government took several initiatives in this regard, including launching an anticorruption program directly led and overseen by the President’s office, issuing and implementing Presidential Instruction 5 of 2004 (INPRES 5/2004) and enacting the National Action Plan for the Eradication of Corruption (RAN PK), which sent a strong signal to the bureaucracy and the public about the government’s commitment to fight corruption.
The government also focused on preventing corruption through reforms relating to public procurement and transparency, and to education of the civil services and society. The Ministry of State Apparatus Reform amended the procurement regulations and introduced reforms such as public disclosure of procurement plans and prequalification results through websites and the national media. The Public Procurement Policy Development Agency was established. Moreover, the government has started e-procurement and e-announcements.
Measures such as these have greatly enhanced control of corruption. During 2004–2008,
Figure 3.26. Control of Corruption Indicators of Major Southeast Asian Countries
0
20
40
60
80
100
120
1996 2003 2008
Indonesia
Philippines
MalaysiaViet Nam
Thailand
Singapore
Regional
Average
Source: World Bank, Governance Matters VIII.
Perc
entil
e Ra
nkperceptions of the prevalence and control of corruption in Indonesia improved and the country’s ranking in the World Bank’s Control of Corruption index improved from 19% to 31%. Similarly, in recent surveys by Transparency International for the 2009 Global Corruption Barometer, 74% of respondents assessed the government’s actions in the fight against corruption as “effective,” which compares with 21% for the Philippines and 28% for Malaysia and Thailand (TI 2009).
Government Effectiveness
Despite recent improvements, Indonesia compares unfavorably with most other major economies in the region in terms of government effectiveness. 1996–2002 was a very tumultuous period in Indonesia’s political and economic history, during which government effectiveness seemed to have declined quite substantially. The World Bank Governance Indicators record that Indonesia’s government effectiveness plummeted from a high of 63.03 in 1996 to a low of 19.43 in 1997 (Figure 3.27). The drastic decline was largely brought about by the 1997 Asian financial crisis, which was also instrumental in delegitimizing the political power of an otherwise strong “New Order” regime leading to President Suharto’s resignation (Perdana and Friawan 2007) in May 1998. President Suharto’s departure ushered in an era of transition from a centralized and autocratic government setup to a democratic and pluralist one. His successor, President B. J. Habibie, in his short term, introduced critical reforms, including granting press freedom, revising the electorate law to allow for a multiparty election, and reducing the number of seats in Parliament allocated to the military and police (Perdana and Friawan 2007).
The 1999 election, Indonesia’s first multiparty election, had 48 parties participating. The Indonesian Democratic Struggle Party won. Abdurrahman Wahid was sworn in as President and the party’s Chairperson Megawati Sukarnoputri became Vice President. The change in government and other key related steps helped restore the ranking in government effectiveness to some extent, but the recovery was short-lived. The government effectiveness level dropped with the introduction of key decentralization reforms.
After the initial adjustment period, however, government effectiveness started to improve with a stable government at the national level
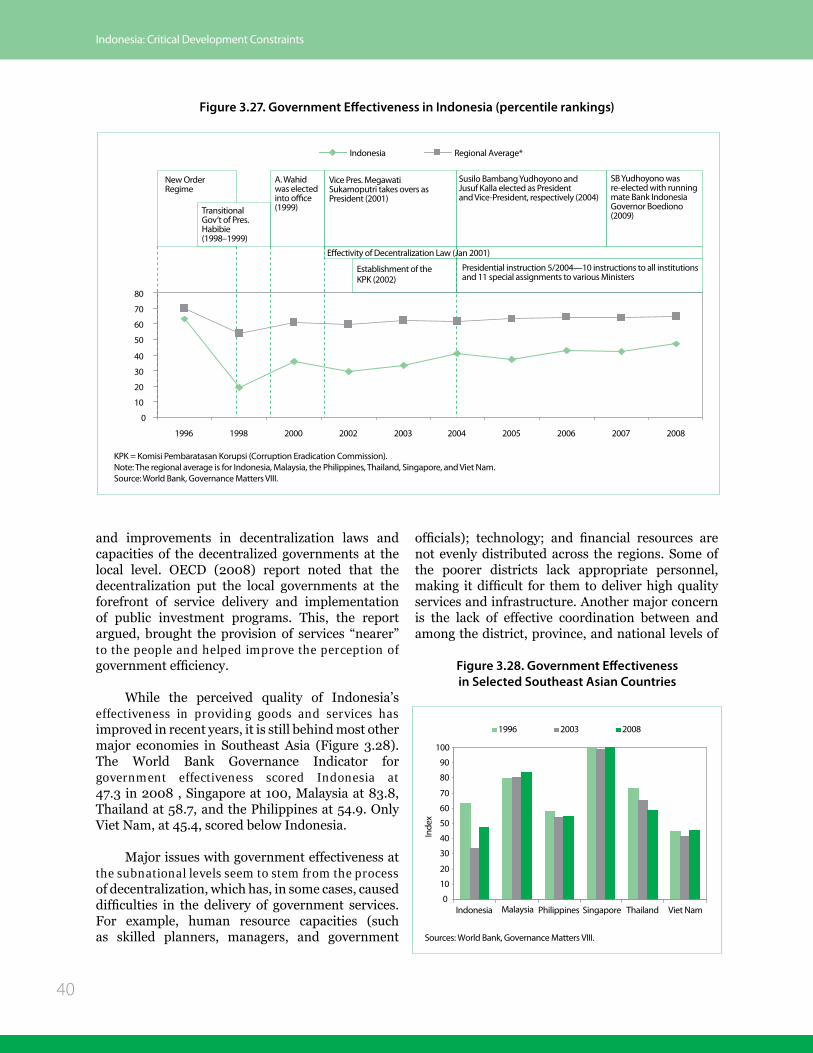
Indonesia: Critical Development Constraints
40
Figure 3.27. Government Effectiveness in Indonesia (percentile rankings)
New OrderRegime
TransitionalGov’t of Pres.Habibie (1998–1999)
Presidential instruction 5/2004—10 instructions to all institutions and 11 special assignments to various Ministers
A. Wahid was elected into o�ce (1999)
Vice Pres. Megawati Sukamoputri takes overs as President (2001)
0
10
20
30
40
50
60
70
80
1996 1998 2000 2002 2003 2004 2005 2006 2007 2008
Indonesia Regional Average*
E�ectivity of Decentralization Law (Jan 2001)
Establishment of the KPK (2002)
Susilo Bambang Yudhoyono and Jusuf Kalla elected as President and Vice-President, respectively (2004)
SB Yudhoyono was re-elected with running mate Bank Indonesia Governor Boediono (2009)
KPK = Komisi Pembaratasan Korupsi (Corruption Eradication Commission).Note: The regional average is for Indonesia, Malaysia, the Philippines, Thailand, Singapore, and Viet Nam.Source: World Bank, Governance Matters VIII.
Figure 3.28. Government Effectiveness in Selected Southeast Asian Countries
0
10
20
30
40
50
60
70
80
90
100
Indonesia Malaysia Philippines Singapore Thailand Viet Nam
Inde
x
1996 2003 2008
Sources: World Bank, Governance Matters VIII.
and improvements in decentralization laws and capacities of the decentralized governments at the local level. OECD (2008) report noted that the decentralization put the local governments at the forefront of service delivery and implementation of public investment programs. This, the report argued, brought the provision of services “nearer” to the people and helped improve the perception of government efficiency.
While the perceived quality of Indonesia’s effectiveness in providing goods and services has improved in recent years, it is still behind most other major economies in Southeast Asia (Figure 3.28). The World Bank Governance Indicator for government effectiveness scored Indonesia at 47.3 in 2008 , Singapore at 100, Malaysia at 83.8, Thailand at 58.7, and the Philippines at 54.9. Only Viet Nam, at 45.4, scored below Indonesia.
Major issues with government effectiveness at the subnational levels seem to stem from the process of decentralization, which has, in some cases, caused difficulties in the delivery of government services. For example, human resource capacities (such as skilled planners, managers, and government
officials); technology; and financial resources are not evenly distributed across the regions. Some of the poorer districts lack appropriate personnel, making it difficult for them to deliver high quality services and infrastructure. Another major concern is the lack of effective coordination between and among the district, province, and national levels of

Chapter 3. Critical Constraints to Growth
41
government. This is especially significant in sectors such as transport and energy, where connectivity with existing and planned national- and provincial-level infrastructure is crucial.
A survey in 2008 by two nongovernment organizations—the Regional Autonomy Watch (KPPOD) and The Asia Foundation—found that across 243 regencies and cities, 35% of the business units surveyed picked problems related to infrastructure and 14% cited access to land as the most important constraint to their business activities. Studies have also noted that decentralization led to overregulation at local levels, which often added significantly to difficulties in and costs of doing business. Similarly, the KPPOD–Asia Foundation report noted that 85% of the 5,140 companies surveyed indicated that attending and responding to legal and illegal demands of local government officials accounted for 2%–10% of their production costs. Although Law 34/2000 restrained the establishment of new local taxes and levies, it is often hard to overturn local regulations enacted before the law came into effect, given that they were approved by local-level parliaments.
Political Stability
The perception of political stability and absence of violence is generally poor, with a high vulnerability to conflict, violence, and terrorism. Indonesia’s rank in the World Bank’s Governance Indicator for Political Stability and
Figure 3.29. Political Stability and Absence of Violence Indicators (percentile rankings)
New OrderRegime
Susilo Bambang Yudhoyono (SBY) and running mate Jusuf Kalla were elected as President and Vice-President, respectively (2004)
SBY was re-elected with running mate Bank Indonesia Governor Boediono (2009)
A. Wahid was elected into o�ce (1999)
Vice Pres. Megawati Sukamoputri takes overs as President (2001)
0
10
20
30
40
50
60
1996 1998 2000 2002 2003 2004 2005 2006 2007 2008
Indonesia Regional Average*
TransitionalGov’t of Pres.Habibie (1998–1999)
Sources: World Bank, Governance Matters VIII.
Absence of Violence has remained in the lowest 20% since the inception of the indicators in 1996 (Figure 3.29). Although Southeast Asia’s rank as a whole has declined over the years, Indonesia’s score has been substantially lower. It declined from about 19% in 1996 to about 10% in 1998 as a result of the civil and political unrest that led to the resignation of President Suharto. Frequent changes in the administration and other threats to political stability led to continued deterioration in the index until the low of about 4% in 2003. The downward trend, however, was reversed in 2004 with the onset of a period of stability brought about by President Yudhoyono’s administration, which helped raise Indonesia’s score to 15.7% by 2008. The reelection of President Yudhoyono for a second term of 5 years in 2009 through a peaceful process should help further lift the perceptions of stability and improve investor confidence in the economy in the medium-term.
Indonesia’s low rank in measures for political stability may be attributed to incidences of terrorism, social violence, and civil riots rather than to a lack of political strength in the current administration. While political stability at the national level is a key factor monitored by the World Bank’s Political Stability and Absence of Violence Indicator, it also covers the presence of separatist movements and insurgencies and violence.
Terrorism is another challenge to the country, with occasional incidents serving as reminders of the

Indonesia: Critical Development Constraints
42
Global Competitiveness and Ease of Doing Business
Investors’ perception of Indonesia’s global competitiveness and ease in doing business has generally been poor. The 2009 Doing Business Survey ranked Indonesia 129th out of 181 countries based on the ease of doing business, placing it behind some of its neighbors (Table 3.4).3 Indonesia ranked very poorly (171st out of 180) in the ease of starting a business—lower than Malaysia, the Philippines, and Thailand. The survey indicated
3 The World Bank and IFC have recently released rankings for 2010; Indonesia’s rank improved to 122nd.
seriousness of the threat. Operations of Al Qaeda-linked groups such as Jemaah Islamiyah have had an extremely adverse impact on investors’ perception of security in Indonesia. Some high-profile terrorist attacks have targeted areas and establishments frequented by western tourists and businessmen. A review of trends in FDI inflows and the World Bank’s Political Stability and Absence of Violence Indicator suggests that the incidences of violence and terrorism have substantially discouraged FDI and depressed the ranking of political stability and absence of terrorism (Figure 3.30).
Figure 3.30. Annual Net Foreign Direct Investment Flows and Political Stability Rank of Indonesia (1990–2007)
1990 1992 1994 1996 1998 2000 2002 2004 2006 2008
Fore
ign
Dire
ct In
vest
men
t ($
mill
ion
)
0
5
10
15
20
25
Polit
ical
Sta
bilit
y Ra
nkin
g (%
)
Foreign Direct Investment Political Stability and Absence of Violence
New Order regime (1965–1998) Height of communal and separatist-related violence (1999–2001)
Bali bombings in Kuta (202 people dead, 240 injured) October 2002
Bali bombings in Jimbara and Kuta, south Bali (20 dead, 129 injured) October 2005
10,000
8,000
6,000
4,000
2,000
0
2,000
4,000
6,000
Sources: World Bank Governance Matters VIII and UNCTAD, FDI Stats, accessed October 2009.
Table 3.4. Cost of Doing Business (selected ASEAN countries, 2009)
CountryOverall
Ranking
Starting a Business Registering Property Enforcing Contracts Closing a Business
Procs. Days
Cost% of
income Procs. Days
Cost% of property
value Procs. Days
Cost% of claim Days
Cost% of
estate
Indonesia 129 11 76 77.9 6 39 10.7 39 570 122.7 5.5 18
Malaysia 20 9 16 14.7 5 144 2.5 30 600 27.5 2.3 15
Philippines 140 15 52 29.8 8 33 4.3 37 842 26 5.7 38
Singapore 1 4 4 0.70 3 9 2.8 21 150 25.8 0.8 1
Thailand 13 8 33 4.9 2 2 1.1 35 479 14.3 2.7 36
ASEAN = Association of Southeast Asian Nations.Source: World Bank and IFC (2008).

Chapter 3. Critical Constraints to Growth
43
that an investor needed to go through 11 procedures, requiring up to 76 days, to start a business.
Another measure considered in the Doing Business Survey is the cost and procedures needed to register property. For this measure too, Indonesia ranked low and was 107th in 2009, down from 101st in the previous year. The survey estimated that it takes about 39 days and 6 procedures to register a property, adding up to 10.7% of the property value in terms of cost. Indonesia’s ranking is again poorer than that of other ASEAN countries, such as Malaysia, the Philippines, and Thailand.
In terms of contract enforcement, Indonesia also has a score on the Doing Business 2009 survey, which ranked Indonesia 140th out of 181 economies in “Enforcing a Contract” (with 1 being the best). The survey showed that it takes 570 days to enforce a contract in Indonesia (for filing and service, trial and judgment, and enforcement of judgment)—one of the lengthiest processes in the region. The cost of enforcing a claim is estimated at 122.7% of the amount of the claim and is much higher than in other countries in the region (in the Philippines, it is 114%; Lao Peoples’ Democratic Republic, 111%; Malaysia, 59%; and Thailand, 29%). The survey found that this issue decreases the number of investments that the firms initiate and that these investments tend to involve only a small group of investors who know each other from previous dealings. Other studies also note that contract enforcement in Indonesia is uncertain, unpredictable, and costly, undermining the adequacy of the law (Booz Allen Hamilton 2007).
Closing a business is also a lengthy process, requiring up to 5.5 years, and it is costly, amounting to 15% of the value of the estate and a recovery rate of $0.137 per dollar invested. Indonesia ranks better in this aspect than the Philippines and Thailand but worse than Malaysia, Singapore, and Viet Nam. According to the World Bank–IFC (2008), bottlenecks in bankruptcy cut into the amount claimants can recover.
Other Aspects of Governance
Indonesia’s performance in other governance-related aspects is improving. Some of the aspects reported by the World Bank’s Governance Indicators 2008 include voice and accountability, regulatory quality, and rule of law (Figure 3.31). In all these aspects, the country’s
rankings declined after 1996 but have recently been improving. In voice and accountability, the transition to democracy and implementation of decentralization has meant major improvements for the country, which is now ranked as a leader in the region.
Improvements in regulatory quality and rule of law are significant, although they are not equally impressive and have not yet reached their 1996 levels.
Tax rates are comparable to those of other major countries in the region, but paying taxes is a cumbersome process. Indonesia compares favorably with other Southeast Asian countries in its personal and corporate income and value-added tax rates (Table 3.5). In personal income tax, the rate for the highest bracket is higher in the Philippines, Thailand, and Viet Nam than in Indonesia. Similarly, rates for corporate income tax are higher in the Philippines and Thailand than in Indonesia. Indonesia’s value-added tax rates are higher than those in Singapore and Thailand but comparable to or lower than those in other major Southeast Asian economies. Thus, the tax rates alone may not make investing in Indonesia less attractive than in the region’s other major economies.
However, the cumbersome process of paying taxes may deter some investment. Doing Business 2009 reports that, on average, a business has to make 22 tax payments a year, requiring about 344 hours of work (Table 3.6). The report ranks Indonesia 104th among 181 countries for overall payment of taxes,
Figure 3.31. Other Governance Indicators (percentile rankings)
0
10
20
30
40
50
60
70
1996 1998 2000 2002 2003 2004 2005 2006 2007 2008
Voice and Accountability Regulatory Quality Rule of Law
Sources: World Bank, Governance Matters VIII.

Indonesia: Critical Development Constraints
44
Table 3.5. Tax Rate in Southeast Asia (%)
Country Personal Income Tax Rate Corporate Income Tax Rate Value-Added Tax Rate
Indonesia 5-30 28 10
Malaysia 0–27 (Progressive and if resident) 25 ...
Philippines 5–32 (Progressive) 30 12
Singapore 3.5–20 (Progressive) 0–18 (depending on profits 7
Thailand 10–37 (Progressive) 2–30 (depending on type of business) 7
Viet Nam 5–35 (Progressive) 25 10
... = Data not available.Sources: For Indonesia and Viet Nam, www.worldwide-tax.com; for Thailand, Revenue Department; for Singapore, AsiaBiz and Janus Corporate Solutions; for Malaysia, Malaysian Industrial Development Authority; for Philippines, Bureau of Internal Revenue.
Table 3.6. Paying Taxes in Southeast Asian Countries
Country
No. of Payments (per year)
Time Spent
(hours per year)
Total Tax Rate (% of
profit)Overall
Rank
Indonesia 22 344 44.2 104
Malaysia 12 145 34.5 21
Philippines 47 195 50.8 129
Singapore 5 84 27.9 5
Thailand 23 234 37.8 82
Viet Nam 32 1050 40.1 140
Source: World Bank and IFC (2008).
substantially worse than the rank for Singapore (5th), Malaysia (21st), and Thailand (82nd).
Tax rates or cumbersome procedures relating to paying taxes do not seem to be of a critical nature. Firms responding to an investment climate survey ranked the tax rates 8th and tax administration 10th in the list of 22 top constraints to investment (LPEM–FEUI 2007). Similarly, a survey by the Japan External Trade Organization in 2008 indicated that only about 10.4% of the Japanese firms with overseas operations considered tax-related risks and issues as a constraint to doing business in Indonesia (JETRO 2009).
While the Indonesian labor markets are perceived to be rigid, this may not be a critical constraint to investment. Indonesia strengthened labor regulations in the early 2000s. The Manpower Act of 2003 that was introduced to govern severance pay reined in the use of contract workers and regulated minimum wages. The Trade Union Act of 2001 stipulated basic labor rights. Critics of these labor regulations argue that rigid regulations
in the labor market increase the cost of adjustment to demand fluctuations, making Indonesia a less attractive destination for potential investors. They often point out that Indonesia belongs to the group of countries with high firing costs.
Indeed, Indonesian labor market flexibility was not rated well among the 133 economies surveyed by the World Economic Forum (2009). Ranked at 98th, Indonesia was among the most rigid economies in labor market regulation and compared unfavorably with many of its neighbors (Table 3.7). Malaysia and Thailand have more flexible labor markets. The index of Economic Freedom shows similar results in labor freedom (Miller et al. 2009).
However, the labor market rigidity does not seem to be a critical constraint to private investment in Indonesia. First, a simple cross-country correlation analysis suggests that the correlation between investment (whether FDI net inflows or gross capital formation as a percentage of GDP) and labor market rigidity is low.4 Second, according to an executive opinion survey, labor rigidity is not among the top five hindrances to business in Indonesia (Miller et al. 2009). Third, an University of Indonesia survey of the country’s investment climate confirmed the findings and ranked labor regulation the 11th in importance as a business constraint (LPEM–FEUI 2007), with the top three constraints related to macroeconomic instability, transport, and corruption. That companies can circumvent
4 Using World Bank, WDI and World Economic Forum, The Global Competitiveness Report 2009–2010 data, the authors ran correlations between labor market efficiency and labor market flexibility, and foreign direct investment inflows (% of GDP) and gross capital formation (% of GDP). Correlation values ranged from –0.07 to –0.56, with negative signs signifying that less rigid and more efficient markets are associated with higher investment inflows.

Chapter 3. Critical Constraints to Growth
45
Table 3.7. Rankings of Labor Market Efficiency (of 133 economies)
Indonesia Cambodia Malaysia Philippines Thailand Viet Nam PRC IndiaLabor market efficiency 75 52 31 113 25 38 32 83A. Flexibility 98 74 28 111 31 68 91 69
Cooperation in labor-employer relations 42 105 19 65 28 49 60 40Hiring and firing practices 34 36 46 110 29 24 77 103Flexibility of wage determination 92 75 54 96 89 79 53 44Firing costs 119 71 96 109 84 104 109 85Regidity of employment 82 92 14 68 24 35 43 54
B. Efficiency use of talent 54 46 47 97 31 27 13 88Pay and productivity 29 50 9 74 38 6 12 46Reliance on professional management 55 109 29 48 61 82 46 30Brain drain 25 51 31 104 32 76 39 41Female participation in labor force 104 28 107 99 53 14 20 122
Source: World Economic Forum (2009).The full report is downloaded at http://www.weforum.org/en/initiatives/gcp/Global%20Competitiveness%20Report/index.htmFor the methodology, please refer to the Appendix A and section 1.2 of the report.
labor regulations by hiring casual employees or by outsourcing, thus avoiding the costs imposed by the regulations, may partly explain employers placing less importance to labor rigidity in Indonesia.
The results of correlation analysis and opinion surveys, however, are not testimonials of a well-functioning labor market in Indonesia. Further, one should not underestimate the impact of the labor rigidity on potential foreign investors, as the opinion surveys reflect the views of business managers already in Indonesia. It has been argued that, together with high costs of capital, and insufficient infrastructure, the labor regulations implemented in the early 2000s may have contributed the country having “a high-cost economy” and losing international competitiveness (Dhanani, Islam, and Chowdhury 2009).
Labor market reform has been on the Indonesian government’s policy agenda for some time. The challenge is that the government, the trade unions, and the employers’ organizations must address labor rigidity and weak social security in tandem. The current social protection system places the financial burden of providing income security for the unemployed on the firms that previously provided employment for these workers through generous severance pay. Shifting the burden of protection to a wider pool participated in by more actors in society would facilitate the process of labor market reform.
3.3.3 Market Failures
In Indonesia, industry is the largest sector in terms of contribution to GDP. During 1990–2008, industry’s share of GDP rose from about 39% to 48% (BPS, various years). However, within industry, the share of manufacturing has stagnated at about 27% of GDP since 2000–2001.
Factors responsible for the manufacturing sector’s poor performance include the constraints discussed in detail earlier in this chapter. Recent literature suggests that market failures such as information and learning externalities and coordination failures could lead to low private appropriability of returns and, therefore, can also deter private investment (Hausmann, Rodrik, and Velasco 2005).5 Such market failures may be at play in the case of Indonesia’s manufacturing subsector and its exports.
5 “Information externality” refers to the situation when the benefits of successfully introducing new products and/or production processes in a country may spill over to third parties, but in case of failure the cost is borne by the original proponent. “Learning externality” refers to the situation when the benefits from investments in building the capacity of the workforce spill over to third parties if the trained workers switch employers or migrate to other countries. “Coordination failure” refers to a situation where a firm’s linkages to upstream and downstream industries are not well developed, or a firm’s access to infrastructure, regulation, and other public goods is poor.

Indonesia: Critical Development Constraints
46
The manufacturing subsector is growing slowly and it is low in technological quality. As previously noted, manufacturing’s value addition as a percentage of GDP has stagnated while the size of its contribution to GDP growth has contracted since 2000. In addition, the subsector has low rates of capacity utilization—58% in 2005 compared with about 70% in 1998–1999 (BPS, various years). Capacity utilization rates, however, varied widely between industries and over the years.
The manufacturing subsector’s composition has also not changed much (Figure 3.32). Between 1998 and 2008, the only significant changes included an expansion in the share of food and beverages at the expense of wood and wood products, and published and recorded media. To analyze changes in technological or sophistication levels of the manufacturing subsector, the study constructed a technology sophistication index (PRODY) following the Product Space Analysis Methodology.6 The results suggested that, similar to the composition of the subsector, the changes in technological content were also marginal—average PRODY scores increased from 10,087 in 2001 to 10,388 in 2005 (Table 3.8).
Indonesia’s exports have grown both in nominal and real terms; however, the growth rate has been one of the lowest in Southeast Asia. In real terms, the exports grew at an annual average rate of 8.6% between 1990 and 2010 (Figure 3.33). In comparison, over the same period, exports of Malaysia, Singapore, and Thailand grew by 10%, 9.6% and 10.8%, respectively. Prior to the 1997 Asian financial crisis, Indonesian exports were growing at rates that were comparable to those of the other major economies in the region. While exports of the other major economies recovered after the crisis, Indonesian exports did not. Indonesian exports further declined in the 1st quarter of 2009—by about 25% on a year-on-year basis. This recent trend, however, is due to the global economic crisis and is consistent with trends in other major Southeast Asian economies.
Exports are also not growing in terms of breadth and technological content. In terms of composition of exports, there have been
6 The methodology is typically used to analyze exports. In the absence of a detailed distribution of value added for domestic manufacturing, the analysis only looked at the breakdown of value added contributed by medium and large enterprises.
Figure 3.32. Composition of Manufacturing Sector Output (%)
0% 25% 50% 75% 100%
1998
2000
2002
2004
2006
2008
Food and Beverages Tobacco Textiles Wearing Apparel Leather and Related Wood and ProductsPaper and Products Media (print and recorded)Chemicals and Products Rubber and PlasticsNon-Metal Minerals Basic Metals Fabricated Metal Products Machinery and EquipmentElectrical Machinery Electronic AppliancesMedical, Waches, Others AutomotivesOther Transport Equipment Furniture and Manufacturing
Source: BPS (various years).
Table 3.8. Technological Sophistication of Medium- and Large-Scale Domestic
Manufacturing
Industry
PRODY Index
2001 2005
Non-Intensive sectors 12,319 12,427
Intensive Sectors 8,629 8,741
Overall 10,087 10,388
Note: A higher score on the PRODY Index implies a higher level of technological sophistication. Nonintensive sectors are those where the country has a revealed comparative advantage of greater than 1.0 while intensive sectors are ones with a revealed comparative advantage of less than one.Source: Estimated based on BPS (2005) and SITC and ISIC2 data using concordance methodology provided by Muendler (2009).
two notable trends during the last three decades (Figures 3.34 and 3.35). First, mineral fuels based exports, accounting for roughly 40% of total exports in 1990, have declined. Second, the volumes of manufactured exports, after having climbed through the 1990s, declined throughout the 2000s—down to about one-third of the exports in 2008 from being the majority component in 2000. While the decline in mineral fuels based exports is partly due to rapidly rising domestic demand, the decline in manufactured exports seems to be primarily because the importance of manufacturing is declining in the country.

Chapter 3. Critical Constraints to Growth
47
Figure 3.33. Growth in Exports of Selected Southeast and East Asian Countries (1997=100)
0
50
100
150
200
250
300
1990
1992
1994
1996
1998
2000
2002
2004
2006
2008
Indonesia Malaysia SingaporeThailand Korea, Rep. of PRC
PRC = People’s Republic of China.Source: CEIC, accessed September 2009.
Figure 3.34. Trends in the Value of the Largest Export Products in Indonesia (1997=100)
0
200
400
600
800
1000
1200
Janu
ary 1
993
Janu
ary 1
995
Janu
ary 1
997
Janu
ary 1
999
Janu
ary 2
001
Janu
ary 2
003
Janu
ary 2
005
Janu
ary 2
007
Janu
ary 2
009
Petroleum Products Vegetable Fats and OilsGas CoalRubber ApparelMetal Ores and Scarp Electrical MachinesNon-Ferrous Metals Paper and Products
Source: CEIC, accessed in September 2009.
Figure 3.35. Composition of Exports
Composition of Exports (% of Total)
1990 1996 2000 2006 20080.0
10.0
20.0
30.0
40.0
50.0
60.0
70.0
80.0
90.0
100.0
FoodCrude MaterialsAnimal and Vegetable OilsManufactured GoodsMiscellaneous Manufactured Articles
Beverages and TobaccoMineral FuelsChemicals and Chemical ProductsMachinery and Transport EquipmentMiscellaneous Manufactured Articles, n.e.s.
n.e.s. = not elsewhere stated.Source: BPS, Badan Pusat Statistik Website.
Analysis of the technological sophistication of Indonesia’s exports indicates that they lag far behind those from other major Southeast and East Asian countries. Moreover, the trends suggest a decline in technological sophistication between 2000–2001 and 2005. The PRODY index was around the 8,000 level in 2005 against about 8,800 in 2000. Figure 3.36 compares Indonesian exports with those of other major Southeast Asian countries
and provides insights into the lower technological sophistication of Indonesian exports. About 52% of Indonesian exports belonged to group 4 (products with the lowest technological content), while only 4% belonged to the more sophisticated group 2.

Indonesia: Critical Development Constraints
48
In contrast, a majority of exports of Malaysia, the Philippines, the Republic of Korea, and Thailand belonged to group 3.
What is more worrying is the lack of evidence indicating a change that may lead to a more vibrant manufacturing sector in the near future. Maidir and Aswicahyono (forthcoming) argue that the expansion in exports between 1998 and 2007 has largely been in the “old stuff” rather than in the “new stuff” (Figure 3.37). These findings are also supported by an analysis of the exports data for the new products that have emerged in pre- and post-Asian financial crisis periods. Table 3.9 indicates that only 69 products that had an export value of below $10 million in 2000 rose above $10 million in 2008. In comparison, the export value of 98 products did so between 1990 and 1996. Although the export volume of more products crossed the $100 million threshold between 2000 and 2008 than between 1990 and 1996, the export volume of more products fell below this threshold between 2000 and 2008 than between 1990 and 1996.
Another point of concern is that the PRODY scores of the products that rose above the $100 million threshold between 2000 and 2008 were lower than those for the products that did so between 1990 and 1996. In other words, the products that rose above the $100 million threshold between 2000 and 2008 were technological less sophisticated than those that rose above the threshold between 1990 Figure 3.36. Disaggregation of Exports
by Technological Sophistication Group
Exports as % of GDP in 2006, by PRODY Groups
-10.0 10.0 30.0 50.0 70.0 90.0 110.0
Indonesia
Malaysia
Philippines
Thailand
Rep. of Korea
Group 4 (PRODY less than 8,000)Group 3 (PRODY between 8,001–16,000)Group 2 (PRODY between 16,001–24,000)Group 1 (PRODY greater than 24,000)
Source: Estimates based on UNCTAD, FDI Stats, accessed October 2009.
and 1996. Another concern is that the products that fell below the $100 million threshold between 2000 and 2008 were more sophisticated than those that did so between 1990 and 1996. The only silver lining is that the products that rose above $100 million between 2000 and 2008 were technologically more sophisticated than those that fell below the threshold during this period.
Stagnation in manufacturing and poor export performance may partly be due to the absence of appropriate and effective industrial and trade policies. A review of the industrial and trade policies since the early 1970s suggests that they fostered a protectionist regime aimed at substituting imports rather than promoting exports and rewarding efficiency and innovation. Maidir and Aswicahyono (forthcoming) note that the country followed a relatively liberal trade regime with little reliance on tariff protection or quantitative import restrictions in the early to mid 1960s. However, prompted by the periods of hyperinflation in the 1960s, the government turned its attention to economic development and embarked on a range of policies that focused on developing its industry by following a protectionist regime. The evolution of the industrial and trade policies can be classified into four distinct phases:
Table 3.9. New Products and Export Dynamism
Category 1990–1996 2000–2008
Export Products that Moved Above $10 Million but Were Less than $100 MillionNumberPRODY
9810,375
6911,302
Export Products that Moved Above $100 MillionNumberPRODY
3711,553
519,824
Products that Regressed to Below $100 MillionNumberPRODY
156,686
278,099
Products that Maintained Levels Around $100 MillionNumberPRODY
1326,851
1137,212
Note: A higher score on the PRODY Index implies a higher level of technological sophistication. Source: Estimates based on UNCTAD, FDI Stats, accessed October 2009.

Chapter 3. Critical Constraints to Growth
49
Figure 3.37. Disaggregation of Exports between Old and New Products
1998 1999 2000 2001 2002 2003 2004 2005 2006 2007
Total Export Change Intensive Margin
Extensive - New Extensive - Exit
2
1
0
-1
Source: Maidar and Aswicahyono (forthcoming).
1967−1975: The First Phase of Import Substitution. The government provided protection to nascent industries through tariff and duties and sales taxes to discourage imports. Ariff and Hill (1985) noted that tariff protection ranged from 40% to 270% for consumer goods, from 15% to 30% for intermediate goods, and from 0% to 10% for capital goods. They added that this led to an anti-export bias, with the import substituting industries enjoying a much higher effective rate of protection than the export industries.
1976 to the mid 1980s: The Second Phase of Import Substitution. Buoyed by increased revenues from the rising oil prices, the government pushed for industrialization by promoting upstream industries, including basic, intermediate, and engineering goods industries. A significant difference in this phase from the first one, however, was the greater reliance on non- tariff barriers, including import restrictions and bans, local-content regulation (the deletion program), and strict regulation of licensed importers. In addition, nascent industries were protected by strictly regulating and even banning new entrants. Soehoed (1981) noted that these policies led to a widening, rather than a deepening, of the industrial base.
The mid 1980s to mid 1990s: Partial Shift to Export Promotion. Deterioration of the balance of payments in the early 1980s due to the decline in foreign exchange earnings from the oil industry hampered the drive toward import
substitution and the government took some steps to promote exports. Several of the steps were aimed at reforming taxes and the financial sector, implementing flexible exchange rate policies, and simplifying investment and customs procedures. However, the highly protectionist trade regime, key to establishing inefficient industries, largely remained intact. Rather, a series of quantitative restrictions were introduced on the imports of intermediate inputs needed by the manufacturing industries, thus reinforcing the anti-export bias. In the mid to late 1980s, the government tried to correct the anti-export bias by providing virtually free trade conditions for industries that exported at least 85% of their output and a duty drawback system to other export industries.
Import controls for the export industries were also relaxed, and a number of nontariff barriers were replaced with tariff barriers. In addition, several specific actions were implemented for plastic, steel, and textiles industries. Pangestu (1987) noted that these reforms covered a relatively small number of industries and several important industries were still being regulated through the “approved importers systems.”
The Post 1997 Asian Financial Crisis Period. The crisis hit the manufacturing sector the hardest. Industries that depended highly on imported inputs, such as transport equipment, footware, textiles, and plastic and metal industries, were the most affected. Following the crisis, Indonesia initiated a series of wide-ranging reforms that have generally improved the investment climate and competitiveness of the economy. However, the industrial and trade policies continue to target and prioritize selected industries, which may introduce further distortions rather than correcting the existing ones. For example, the 2005–2009 5-year development plan lists industrial clusters that were to receive concerted focus, including the (1) food and beverage industry, (2) fisheries processing industry, (3) textile and textile products industry, (4) footware industry, (5) oil palm industry, (6) industrial wood products, (7) industrial rubber and rubber goods manufacture, (8) pulp and paper industry, (9) electrical machinery and equipment industry, and (10) petrochemical industry.
However, the impact of recent reforms on promoting the manufacturing sector and exports seems to have been limited at best, indicating that

Indonesia: Critical Development Constraints
50
much more needs to be done to correct the distortions and market failures and to overcome constraints to investments identified in the preceding discussions. Moreover, focusing on established rather than emerging industries may not yield intended results in the longer term, and may undermine efficiency and discourage innovation.
Although Indonesia and Malaysia started with similar resource endowments, the development of their manufacturing and exports followed different patterns. Product space analysis of the progression reconfirms the earlier discussions that the industrial and trade policies have not been appropriate and effective in improving Indonesia’s manufacturing sector and export performance. In 1985, Indonesia’s and Malaysia’s export patterns had many similarities (Figure 3.38). Their exports were largely in oil and oil-based products, garments, and forest products. Malaysia had some electronics and machinery-related exports, but these industries were still in the nascent stages. From there on, however, exports in the two countries developed along very different paths. Malaysia shifted its focus from garments and commodity-led exports to more sophisticated industries such as machinery, automotives, and
electronics, and by 2000 had positioned itself well to move to an even more sophisticated production base with higher value-added contents. Indonesia, on the other hand, chose to intensify its presence in garments and fish and fishery products. Consequently, Indonesia was trapped in industries with lower levels of technological sophistication and value addition. The impacts of these policies are evident—Malaysia managed to break into more sophisticated industries as early as 2000 and has since strengthened its position in these industries, while Indonesia was unable to enter or sustain a presence in the more sophisticated industries.
A shift toward a more vibrant and efficient manufacturing sector will require concerted efforts to move into industrial clusters that are strategically located in the product space and can provide pathways toward transforming manufacturing into a subsector that is more sophisticated and promises higher levels of value addition. However, a review of the policies enshrined in the recent 5-year development plans does not suggest that this has become a priority. Current policies continue to target existing industries, which presents little opportunity to break into more strategic industries or yield long-term dividends.
Figure 3.38. Export Product Space in Indonesia and Malaysia
A. 1985
Indonesia 1985 Malaysia
Oil and Oil-Based Products
Fish Products
Garments
Forest Products
Electronics
Machinery and Vehicles

Chapter 3. Critical Constraints to Growth
51
B. 2000
Indonesia 2000 Malaysia
C. 2008
Indonesia 2008 Malaysia
Oil and Oil-Based Products
Oil and Oil-Based Products
Fish Products
Fish Products
Garments
Garments
Forest Products
Forest Products
Electronics
Electronics
Machinery and Vehicles
Machinery and Vehicles
Note: Squares represent actual exports while the circles represent the products that the country could export but does not. The size of the product’s squares or circles represents its global trade volume.Sources: Global Product Space based on Hidalgo et al. (2007); data for Indonesia and Malaysia are based on UNComtrade (n.d.).

Chapter 4 Critical Constraints to Reducing Poverty and Inequality
Poverty in Indonesia declined signifi-cantly during 1976–1996, accompanying the strong economic growth that lasted until the 1997 Asian financial crisis, when the poverty rate surged
throughout Indonesia. The poverty rate has been decreasing steadily since the crisis, though at a much slower pace than during the pre-crisis period. Geographical disparity is an important aspect of poverty in Indonesia. Although poverty fell below the pre-crisis level in 2008 throughout the country, poverty reduction was much more pronounced in Kalimantan and Maluku, Papua, and Nusa Tenggara than in other regions. However, the poverty headcount rate for Maluku, Papua, and Nusa Tenggara remains very high—about three times that for Kalimantan. Another important feature of poverty in Indonesia is the dense cluster of population around the poverty line, indicating the vulnerability of Indonesian households to poverty. These observations underline a need for enhancing inclusive growth in order to reduce poverty and inequality. This chapter attempts to identify potential constraints to the inclusiveness of growth using the conceptual framework outlined in Chapter 1.
4.1. Productive Employment Opportunities
The limited availability of productive and decent employment opportunities is a critical constraint to inclusiveness. Strong economic growth during the last decade helped
to lift millions of Indonesians out of poverty. Headcount poverty incidences1 and the share of the working poor2 showed a secular decline after a sharp increase in the aftermath of the 1997 Asian financial crisis (Table 4.1). However, the growth since the 1997 Asian financial crisis has not been generating sufficient productive and decent employment opportunities to absorb the unemployed, underemployed, discouraged workers (i.e., those who have given up their search for a job), and new entrants to the labor market.
1 Defined as the share of the population living below international poverty lines ($1.25 and $2 a day, both measured at purchasing power parity).
2 The working poor are defined as people who are employed, but do not earn sufficient income to meet the basic necessities of life.
Table 4.1. Poverty and Working Poverty (%)
Year
International Poverty Line—
Population Below
$1.25/day
International Poverty line
—Population Below $2/day
Share of Working Poor at
$1.25/day in Total
Employment
Share of Working
Poor at $2/day in Total
Employment
1993 54.4 84.6 65.4 91.2
1996 43.4 77.0 52.5 86.4
1999 47.7 81.5 58.5 91.0
2002 29.3 66.9 37.2 81.4
2005 21.4 53.8 27.8 71.1
Sources: For poverty incidences, World Bank, PovcalNet database; and for the share of the working poor, ILO (2007).

Chapter 4. Critical Constraints to Reducing Poverty and Inequality
53
working age population increasing in recent years. This is putting further pressure on the economy to generate employment opportunities. The gap between the labor force and employment growth is most pronounced among the youth. The labor force aged 15–24 grew by about 13% (or by 2.4 million) between 1991 and 2008, while employment opportunities for it hardly expanded (Figure 4.2).
Without unemployment insurance and other effective social security schemes, most poor people cannot afford a protracted spell of unemployment. In fact, unemployment rates tend to be higher among educated people, as people who can afford higher education are more likely to be able to support themselves during a job search (Table 4.2) than are people with less education. The high incidence of the working poor, therefore, does not necessarily stem from open unemployment.3 The issue is more to do with the quality of jobs being created in recent years. For example, about 30% of the labor force was estimated to be underemployed in 2009 (Figure 4.3). The share of informal employment
3 Open unemployment refers to unemployment captured by official labor statistics. The term is often used to distinguish official unemployment from discouraged unemployment and other forms of underutilized labor.
Figure 4.1. Population by Age Groups1980
Under 55−9
10−1415−1920−2425−2930−3435−3940−4445−4950−5455−5960−6465−6970−7475−7980−8485−8990−9495−99
100+
10 7.5 5 2.5 2.5 5 7.5 10Population (in millions)
Male Female
2000
Under 55−9
10−1415−1920−2425−2930−3435−3940−4445−4950−5455−5960−6465−6970−7475−7980−8485−8990−9495−99
100+
10 7.5 5 2.5 2.5 5 7.5 10
Population (in millions)
Male Female
Source: US Census Bureau, accessed 25 March 2010.
Employment growth (31%) fell short of labor force growth (33%) during 1995–2008. As Figure 4.1 suggests, the demographic structure of Indonesia’s population is changing, with the
Figure 4.2. Population, Labor Force, and Employment Growth Trends (1991=100)
1991
1993
1995
1997
1999
2001
2003
2005
2007
80
90
100
110
120
130
140
150
160
Population (age 15−24)
Labor Force (age 15−24)
Employment (age 15−24)
Population (age 15+)
Labor Force (age 15+)
Employment (age 15+)
Source: ILO (2009).

Indonesia: Critical Development Constraints
54
also remained high despite the recent economic growth: the share was 63.2% in August 2004 and 61.3% in August 2008. The share increased to 62.1% in February 2009, largely due to the impact of the global economic crisis.
Meager earnings in the informal economy, especially casual labor in agriculture, leave the working poor vulnerable to shocks (Dhanani et al. 2009). Figure 4.4 confirms this point: the incidence of the working poor is relatively high among casual, unpaid, and own-account workers.4 According to the labor force survey, the hourly wage of casual workers in the nonagriculture sector was about 59% of employees’ wages in 2008.5 The hourly wage gap was even wider between casual workers in the agriculture sector and employees—the average wage of the former was only about 46% of that of the latter. Increasing decent and productive employment as well as improving the productivity of vulnerable workers is thus a key to reducing poverty.
4 Own-account workers are those who work alone or with one or more partners and do not have employees working for them (ILO, International Classification).
5 Employees are all workers who work for an employer and receive remuneration (ILO, International Classification).
Despite a decade of economic expansion, wage employment failed to recover to the pre-1997 Asian financial crisis level. The share of wage employment stood at about 36% in 1997 and declined to 34% in 2007. The majority of workers are own-account and contributing family workers,6 which constitute a pool of vulnerable workers.7 The share of vulnerable employment actually went up from 62.8% in 1997
6 Contributing family workers are unpaid family members or relatives engaging in a family business (ILO, International Classification).
7 Vulnerable employment here is the sum of own-account and contributing family workers.
Table 4.2. Unemployment and Poverty Rates by Educational Attainment (2005, %)
Educational Attainment
Unemployment Rate
Poverty Incidence
Less than Primary 5.5 19.6Primary 7.0 13.8Junior Secondary 14.1 9.3Senior Secondary 19.9 4.4Tertiary 11.9 0.4
Source: Dhanani et al. (2009).
Figure 4.3. Unemployment Rate, Underemployment Rate, andReal GDP (2000=100, 1980–2009)
1980
1982
1985
1986
1987
1988
1990
1991
1992
1993
1994
1996
1998
1999
2000
2001
2002
2003
2004
2005
2006
2007
2008
1997
1995
1989
0
500
1000
1500
2000
2500
Trilli
on R
upia
h
0
5
10
15
20
25
30
35
40
45
50
%
Real GDP (in trillion Rupiah) Underemployment rate (%) Unemployment rate (%)
Notes: GDP = gross domestic product. 2009 employment data are as of February 2009. Real GDP for 2008 and 2009 are provisional data. Some changes in the de�nition of unemployment took place in 1994 and 2001 (see Suryadarma et al. 2005). There was also a change in the de�nition of economically active age group (i.e., labor force) from population aged 10+ to aged 15+ at the beginning of 1998. While unemployment rates are usually calculated using the annual National Labor Force Survey (Sakernas), the Inter-Census Population Survey (Supas) data were used for the year 1995 as Sakernas was not conducted in that year. Underemployed is de�ned as an employed person working less than 35 hours a week. Sources: BPS (various years). For 2009, BPS (2009b).

Chapter 4. Critical Constraints to Reducing Poverty and Inequality
55
to 63.1% in 2007. The annual growth rate of casual employment is alarming—8.4% (2002–2008 average). The share of casual workers, who are most likely to be part of the working poor, thus increased in total employment—from 8.8% in 2002 to 11.0% in 2008, while that of wage employees remained more or less stable during the same period (Figure 4.5). This trend could undermine Indonesia’s efforts to meet the Millennium Development Goal of halving poverty by 2015.
While Indonesia managed to reduce poverty below the pre-crisis level, that more than 70% of workers live below the $2 poverty line merits further effort to provide them with more productive employment opportunities. A dense distribution of workers earning within the narrow range of $1.25–$2 per day implies that they are highly vulnerable to shocks such as the recent global economic crisis, job loss, injury, or sickness.
The discussions in this section suggest that the limited availability of productive and decent employment opportunities is a constraint to enhancing the inclusiveness of growth and to reducing poverty and vulnerability. Weak generation of productive and decent employment is, at least partly, a consequence of the slowdown in
labor-intensive manufacturing that used to absorb a large number of low- and semi-skilled workers. The pattern of growth has changed since the 1997 Asian financial crisis. Labor-intensive manufacturing lost competitiveness to low-cost producers in the region—the People’s Republic of China, India, and Viet Nam—and insufficient investment. Indonesia has not successfully shifted from labor-intensive manufacturing to high value-adding production (Islam and Chowdhury 2009), as discussed in Chapter 3.
4.2. Access to Opportunities
Even if the economy succeeds in creating sufficient levels of decent and productive jobs, not everyone may benefit if access to the jobs is unequal. In Indonesia, job creation is concentrated in several locations. Rural areas in general lack decent and productive employment opportunities and people in such areas tend to engage in agriculture or are employed in the informal economy.
Figure 4.6 shows that a higher percentage of people are engaged in the informal economy in rural areas (about 76%) than in urban areas (about 42%). Variation is also significant at the provincial
Figure 4.4. Incidence of Working Poor by Employment Status
(2007, $1.25 per day poverty line, %)
0 10 20 30 40
OAW working alone
OAW assisted by temporary unpaid workers
Employer
Employee
Casual worker
Unpaid worker
Total
Note: OAW = Own Account Worker.Source: Calculations based on BPS, Susenas Kore.
Figure 4.5. Shares in Total Employment by Employment Status (%)
0
10
20
30
OAW w
orkin
galo
neOAW
assis
ted
by
tem
pora
ry/u
npaid
worke
rs
Empl
oyee
Casu
al wor
ker
Unpaid
wor
ker
Empl
oyer
2002 2006 2008
Note: OAW = Own Account Worker.Source: Calculations based on BPS, Sakernas.

Indonesia: Critical Development Constraints
56
level (Figure 4.7). About 83% of people in East Nusa Tenggara work in the informal economy, but the corresponding figure is only 26% in Jakarta.
Underemployment rates are also higher in rural areas than in urban areas (Figure 4.6).
Unless workers in rural areas migrate in search of employment opportunities, they are generally less capable than urban residents of earning enough to live above the poverty line. In fact, about 82% of the working poor are in rural areas and about 66% of them are engaged in agriculture.8 In addition, the migration rate in rural areas, particularly in the Maluku, Papua, and Nusa Tenggara region (Figure 4.8) where the informal employment rate tends to be high, is greater than in urban areas.
Both informal employment and underemploy-ment rates vary by the level of education. Figure 4.6 shows that people with primary education or less are more likely to be engaged in the informal economy and/or be underemployed than people who have achieved higher levels of education. And women are more likely to be underemployed than men. The relatively high unemployment rate among the youth is another worrying issue (Figure 4.6).
The evidence presented so far is symptomatic of inequitable access to opportunities. According to the conceptual framework described in Chapter 1, causes that may underlie unequal access to
8 Calculations by the International Labour Organization (ILO) based on data for 2007 from BPS, Susenas Kore.
Figure 4.7. Informal Employment Rates (2009, %)
0
10
20
30
40
50
60
70
80
90
Sumatra Java and Bali Kalimantan Sulawesi Maluku, Papua, and Nusa Tenggara
Source: BPS (2009a).
Nan
ggro
e Ac
eh
Nor
th S
umat
ra
Wes
t Sum
atra
Riau
Jam
bi
Sout
h Su
mat
ra
Beng
kulu
Lam
pung
Bang
ka-B
elitu
ng
Riau
Isla
nds
Jaka
rta
Wes
t Jav
a
Cent
ral J
ava
Yogy
akar
ta
East
Java
Bant
en Bali
Wes
t Kal
iman
tan
Cent
ral K
alim
anta
n
Sout
h Ka
liman
tan
East
Kal
iman
tan
Nor
th S
ulaw
esi
Cent
ral S
ulaw
esi
Sout
h Su
law
esi
Sout
heas
t Sul
awes
i
Gor
onta
lo
Wes
t Sul
awes
i
Mal
uku
Nor
th M
aluk
u
Wes
t Pap
ua
Papu
a
Wes
t Nus
a Te
ngga
ra
East
Nus
a Te
ngga
ra
Figure 4.6. Unemployment, Underemployment, and Informal Employment Rates (2009, %)
0
20
40
60
80
100
Unemployment Underemployment Informal Employment
Indo
nesia
Urba
nRu
ral
Mal
eFe
mal
e
15−2
424
−49
50+
Prim
ary o
r low
erJu
nior
Sec
onda
rySe
nior
Sec
onda
ryTe
rtiar
y
Source: BPS (2009a).

Chapter 4. Critical Constraints to Reducing Poverty and Inequality
57
opportunities are (1) weak human capabilities, and (2) uneven playing fields.
4.2.1. Human Capabilities
One reason for the unequal access to opportunities is that some groups of people have weaker human capabilities than others, partly due to unequal access to education; health; and/or other social services such as clean water and sanitation.
Education
Despite the progress in school enroll-ment, access to secondary and vocational education remains unequal and therefore is a binding constraint to reducing poverty and inequality. One of the most important components of human capabilities is education. Because education is positively linked to access to better employment opportunities (e.g., Card 1999), education attainment is one of the main vehicles for reducing poverty and enhancing economic growth. Empirical studies show that higher educational attainment (of heads and other members of households) is associated with greater household consumption, and that household welfare in Indonesia is generally correlated with higher levels of education (World Bank 2006c).
In Indonesia, basic education consists of 6 years of primary and 3 years of junior secondary school. After completing junior secondary educa-tion, students can choose between general and vocational senior secondary school. The former is the traditional route to academic tertiary education (e.g., universities, academies, or other institutions), while the latter has been the path to vocational tertiary education (e.g., polytechnics or further technical training). Of people who have completed junior secondary education, about 51% go to general secondary schools and about 34% to vocational schools (Riddell 2010).
One of the main channels through which education affects a household’s welfare is employ-ment. Figure 4.9, for example, illustrates that people who have completed senior secondary education or higher are less likely to be underemployed or in the informal economy than are workers in general. The importance of completing higher levels of education is also supported by a cost-benefit analysis that finds increasing returns to higher levels of education. The rates of social returns9 to people with junior and senior secondary school levels are estimated to be about 25% and 28%, respectively, while the rate of returns to primary education is low at about 4% (Arze del Granado et al. 2007). The relatively low returns to primary education underline the oversupply of low-skilled workers in Indonesia.
Similarly, people who are unemployed are more likely to be discouraged from actively seeking work if they have a lower education background. Of those who had not completed primary education, about 64% were discouraged and about 17% were looking for work, while among those who had completed junior secondary schooling only about 33% were discouraged and 58% were looking for work (MNE 2007). Furthermore, Figure 4.10 illustrates that the wage level varies significantly by education attainment. The figure shows a relatively large wage gap, especially between employees with junior secondary and those with senior secondary as well as between senior secondary and tertiary education.
9 Estimates of the returns to education investments are defined as the discount rates that equate a stream of education benefits to a stream of costs for providing education, at different levels, at a given point in time. Education benefits were computed based on wage differentials—additional average earnings from those of the same age group at a previous level of education (see Arze del Granado et al. [2007] for details).
Figure 4.8. Percentage of Households with Migrants (2007, %)
Indo
nesia
Urba
n
Rura
l
Sum
atra
Java
/Bal
iKa
liman
tan
Mal
uku,
Pap
ua, a
ndNu
sa Te
ngga
ra
Sula
wes
i
0
2
4
6
8
10
12
Notes: The �gure shows the percentage of households with members or former members who are migrants abroad.Source: Calculations based on BPS, Susenas Kore.

Indonesia: Critical Development Constraints
58
The observations noted so far clearly illustrate that people with education beyond the primary level have better access to productive and decent
employment opportunities. The education level achieved across age cohorts in Indonesia shows an upward trend over time: only about 20% of people 50 or older completed junior secondary education or higher, while about 70% of those 20–24 did so.10 However, the distribution of educational attainment across the country and across different expenditure quintiles still shows considerable inequality in access to education—people residing in rural areas and relatively poor people tend to receive less education. The average education level of women is also lower than that of men (Figure 4.11), though the disparity is expected to decrease over time given the current insignificant gender gap in school enrollment rates (Figures 4.12 and 4.13).
School enrollment rates have improved at the primary and secondary levels during the last decade. The primary school enrollment rate is now uniformly high across the country. In contrast, only about 67% and 45% of children are enrolled in junior and senior secondary school, respectively. This is disappointing, especially given that National Education System Law No. 20/2003 proclaims that every child aged 7–15 must attend basic education. Moreover, there is a striking discrepancy in enrollment rates across the country, particularly for senior secondary education. The differences are especially significant between
10 Calculations based on data for 2007 from BPS, Susenas Kore.
Figure 4.9. Education Level by Employment Status (2009, %)
0 20 40 60 80 100
Employed
Not Underemployed*
Formal Sector
Primary or Lower Junior Secondary
Senior Secondary More than Secondary
Note: *Working for 35+ hours per week.Source: BPS (2009a).
Figure 4.10. Average Wages per Month by Education Attainments (2009, ’000 Rp)
0 1,000 2,000 3,000
No Schooling
Primary (Incomplete)
Primary (Completed)
Junior Secondary
General Senior Secondary
Vocational Senior Secondary
Tertiary (Incomplete)
Tertirary (Completed)
Note: Based on the wages of employees.Source: BPS (2009a).
Figure 4.11. Education Attainment Among People Aged 15+ (2007, %)
Kalim
anta
n
Java
and
Bali
Sum
atra
Sula
wes
i
Urba
nRu
ral
Mal
eFe
mal
e
Poor
est
Seco
ndM
iddl
eFo
urth
Rich
est
Mal
uku,
Pap
ua,
and
Nusa
Teng
gara
0
20
40
60
80
100
Primary or Lower Junior Secondary
Senior Secondary More than Secondary
Source: Calculation based on BPS, Susenas Kore.

Chapter 4. Critical Constraints to Reducing Poverty and Inequality
59
urban and rural children and among expenditure quintiles. For example, only 22% of children in the poorest expenditure quintile are enrolled in senior secondary school, versus about 70% of children in the richest quintile (Figure 4.13).
Variations in access to education are also observed between and within provinces. Figures 4.14, 4.15, and 4.16 show the provincial average net enrollments (middle points) as well as the minimum (lower points) and maximum (higher points) net enrollment rates at the district level for each province for primary, junior secondary, and senior secondary education. The figures highlight nontrivial variations within provinces. Even for primary education, where Indonesia has achieved high enrollment rates, the net enrollment rate for Papua remains low, at about 81%, compared with the rest of the country, and the lowest rate among districts within Papua is only 51%. The disparity is even more striking for junior secondary education. Papua, again, has the lowest net enrollment rate in the country, about 49%, and the variation within the province is the greatest. Moreover, while East Java has a relatively high provincial average net enrollment rate (about 69%), the rate in its Sampang district, at about 40%, is lower than Papua’s provincial average (about 49%).
Quality is also an issue in Indonesia’s education system. Even if school enrollment rates reach the universal level, this may not contribute to reducing poverty and inequality if the quality of education is poor, because it is likely to affect students’ employability and potential earnings, as discussed in Chapter 3. Some researchers believe that the quality of education in Indonesia needs to be further improved (Arze del Granado et al. 2007). The problem of low learning achievement was also found in the Governance and Decentralization Survey (GDS) 2.11 One of the main problems of education services noted by household respondents was student learning achievements—29% of households thought this needs to be improved; followed by the condition of school buildings and facilities, at 27%; teachers’ attention to their students, at 17%; and affordability of the education services, at 8% (Widyanti and Suryahadi 2008).
Another issue related to Indonesia’s education is the provision of vocational education. Vocational secondary schools are under the Directorate
11 The GDS is one of the initiatives that aim to monitor and evaluate the implementation of the governance and decentralization policy in Indonesia. The GDS 2 was undertaken from April to July 2006 in 133 districts. It is an integrated survey of households, public healthcare facilities, private health practitioners, hamlet heads, and district- and village-level officials (Widyanti and Suryahadi 2008).
Figure 4.12. Net School Enrollment Rates for Junior Secondary (%)
0
20
40
60
80
1996 2002 2007
Kalim
anta
n
Java
and
Bali
Sum
atra
Sula
wes
i
Urba
nRu
ral
Mal
eFe
mal
e
Poor
est
Seco
ndM
iddl
eFo
urth
Rich
est
Mal
uku,
Pap
ua,
and
Nusa
Teng
gara
Source: Calculation based on BPS, Susenas Kore.
Figure 4.13. Net School Enrollment Rates for Senior Secondary (%)
0
20
40
60
80
1996 2002 2007
Kalim
anta
n
Java
and
Bali
Sum
atra
Sula
wes
i
Urba
nRu
ral
Mal
eFe
mal
e
Poor
est
Seco
ndM
iddl
eFo
urth
Rich
est
Mal
uku,
Pap
ua,
and
Nusa
Teng
gara
Source: Calculation based on BPS, Susenas Kore.

Indonesia: Critical Development Constraints
60
Figure 4.14. District-Level Net Enrollment Rates: Primary (2007, %)
Papu
aGo
ront
alo
Wes
t Pap
uaNo
rth S
ulaw
esi
East
Nus
a Ten
ggar
aBa
ngka
-Bel
itung
North
Mal
uku
Cent
ral S
ulaw
esi
Sout
h Su
law
esi
Wes
t Sul
awes
iSo
uth
Sum
atra
Bant
enEa
st K
alim
anta
nJa
karta
Mal
uku
Wes
t Kal
iman
tan
Riau
Isla
nds
Yogy
akar
taSo
uthe
ast S
ulaw
esi
Jam
biNo
rth S
umat
raSo
uth
Kalim
anta
nLa
mpu
ngW
est N
usa T
engg
ara
Wes
t Jav
aBe
ngku
luBa
liEa
st Ja
vaW
est S
umat
raCe
ntra
l Jav
aRi
auCe
ntra
l Kal
iman
tan
Nang
groe
Ace
h
0
20
40
60
80
100
Source: Calculations based on BPS, Susenas Kore.
Figure 4.15. District-Level Net Enrollment Rates: Junior Secondary (2007, %)
Papu
aW
est P
apua
East
Nus
a Ten
ggar
aGo
ront
alo
Wes
t Sul
awes
iBa
ngka
-Bel
itung
Wes
t Kal
iman
tan
Bant
enCe
ntra
l Sul
awes
iSo
uth
Kalim
anta
nCe
ntra
l Kal
iman
tan
Sout
h Su
law
esi
North
Mal
uku
Sout
h Su
mat
raSo
uthe
ast S
ulaw
esi
Jam
biNo
rth Su
law
esi
Bali
Wes
t Jav
aW
est S
umat
raLa
mpu
ngBe
ngku
luCe
ntra
l Jav
aEa
st Ja
vaRi
auM
aluk
uW
est N
usa T
engg
ara
East
Kal
iman
tan
Jaka
rtaRi
au Is
land
sNo
rth Su
mat
raYo
gyak
arta
Nang
groe
Ace
h
0
20
40
60
80
100
Source: Calculations based on BPS, Susenas Kore.
Figure 4.16. District-Level Net Enrollment Rates: Senior Secondary (2007, %)
Wes
t Sul
awes
iW
est N
usa T
engg
ara
Sout
h Ka
liman
tan
Papu
aW
est K
alim
anta
nBa
ngka
-Bel
itung
Goro
ntal
oW
est J
ava
Bant
enCe
ntra
l Sul
awes
iCe
ntra
l Kal
iman
tan
Lam
pung
Sout
h Su
law
esi
Sout
h Su
mat
raW
est P
apua
Cent
ral J
ava
Jam
biSo
uthe
ast S
ulaw
esi
East
Java
Wes
t Nus
a Ten
ggar
aBe
ngku
luJa
karta
North
Sula
wes
iNo
rth M
aluk
uRi
auRi
au Is
land
sEa
st K
alim
anta
nW
est S
umat
raNo
rth Su
mat
ra Bali
Yogy
akar
taM
aluk
uNa
ggro
e Ac
eh
0
20
40
60
80
100
Source: Calculations based on BPS, Susenas Kore.

Chapter 4. Critical Constraints to Reducing Poverty and Inequality
61
of Technical and Vocational Education in the Ministry of National Education. In addition, other ministries, such as the Ministry of Manpower and Transmigration and the Ministry of Industry, provide vocational training centers.
While the senior secondary school enrollment rates have increased steadily in recent years, the increase is largely due to the growth in the number of students enrolled in general senior secondary schools (Chen 2009). However, to address high unemployment rates among the educated youth, in 2006 the Ministry of National Education drafted a strategic plan to reverse this trend and increase the number of vocational senior secondary school graduates (MNE 2006).12 The rationale was that the unemployment rate of vocational school graduates was lower than that of general school graduates.
Empirical evidence across the world on the impact of vocational education on labor market outcomes is mixed.13 The recent empirical assessments of the effect of vocational education on labor market outcomes, based on the longitudinal household survey data, also do not seem to support the government’s strategy (Chen 2009, Newhouse and Suryadarma 2009). Chen finds that attendance at vocational secondary schools results in neither market advantage nor disadvantage in terms of employment opportunities and/or earnings premium. Moreover, Newhouse and Suryadarma find that the returns14 to public vocational schooling for men have decreased in recent years, and male vocational graduates now face a relatively large wage penalty. Although they cannot directly explore the underlying causes behind this decline, Newhouse and Suryadarma suggest that the declining relevance of technical and industrial skills in an increasingly service-oriented Indonesian economy, at least partly explains the declining returns to public vocational education. Nevertheless, the findings of the Newhouse and Suryadarma analysis indicate that vocational schools have a favorable equity effect by improving the opportunity for individuals
12 However, the government will adopt a more balanced approach toward general and vocational senior secondary education (MNE 2010).
13 See Newhouse and Suryadarma (2009) for their literature review. 14 The returns are measured in terms of labor market outcomes,
including labor force participation, unemployment conditional on participation, formal sector work, and hourly wages (Newhouse and Suryadarma 2009).
from disadvantaged socioeconomic backgrounds to be competitive on the job market.
While the government has been enhancing the relevance of vocational education to the needs of businesses in recent years (MNE 2010), the provision of technical and vocational education and training system can be improved further. Challenges include improving the effectiveness of the curricula, increasing the number of qualified training instructors, improving training equipment, and enhancing the links between training providers and the private sector to improve the performance of vocational school graduates in the labor market. For example, some public sector training institutions, particularly those under district ownership, are generally in poor condition and severely underused. In addition, some public supervision or control over private sector training providers may be required to improve the quality and relevance of the training they offer.
Indonesia has recently adopted a competency-based training (CBT) system under Regulation No.31/2006 on the National Skills Training System. CBT helps to link training and certification to placement as the competencies are based on market demand and designed to fit job requirements. The CBT system is supposed to be applied uniformly in the vocational education and training sectors. A speedy implementation of the CBT system remains a challenge. Some training providers face difficulties adopting the system due to lack of training and management support. In addition, not all training courses are designed to meet local skills demand, and many courses need to be formally assessed.
Root causes of unequal access to education lie on both the demand and supply sides. On the demand side, financial burden is an issue. Table 4.3 lists the main reasons for school-age children not attending school or for dropping out. The table indicates that financial impediments are by far the main reason—about 57% of school-age children who never went to school or who dropped out gave financial reasons. Not surprisingly, poorer households are more likely to struggle to secure financial means to send their children to school.
Furthermore, the financial burden of secondary schooling seems to be greater than that incurred for primary education (Table 4.4). While about 36% of primary school age children never went to school or dropped out due to financial difficulties, almost

Indonesia: Critical Development Constraints
62
60% of secondary school age children gave financial reasons for not attending school. Suryadarma et al. (2006) indeed find that household welfare level is a significant determinant of junior secondary school enrollment in Indonesia. They also find that the availability of local employment opportunities negatively impacts children’s continuation to junior secondary school. Paqueo and Sparrow (2006) obtained similar findings. While a similar percentage of urban and rural students cite financial reasons for not attending school, a relatively large share of female children are out of primary and junior secondary school due to financial constraints (Table 4.4).
To increase the poor’s transition rate from primary to junior and then senior secondary education, financial constraints should be eased by further subsidizing secondary schooling and/or providing targeted transfers in the form of scholarships or conditional cash transfers to the poor. Conditional cash transfers, in particular, have been intended to compensate households for the opportunity cost of schooling (Box 4.1).
Table 4.5 reports the distribution of education costs across items for primary, junior secondary, and senior secondary education. The table shows relatively large shares of non-fee costs.
For secondary schooling, both junior and senior, transport has the highest share in total education costs. A relatively large number of households find schools are too far and/or the cost of transport is too high to send their children to school. Indeed, some provinces, such as Papua, West Kalimantan, and West Sulawesi, that have the lowest net enrollment rates for junior secondary schooling in the country also have the longest average travel times to school. Unequal access to education is, therefore, not only due to affordability (i.e., the demand side), but also to some supply-side factors.
Table 4.3. Reasons for Never Having Attended School or Dropped Out of School (2007, %)
Financial ReasonCurrently Employed
Married /Manages Household School is Too Far
Have Enough Education
Indonesia 57.2 7.3 2.5 2.7 5.3
Urban 56.9 9.2 1.7 0.6 6.1Rural 57.3 6.5 2.8 3.7 4.9
Sumatra 55.4 6.1 1.4 2.8 5.6Java and Bali 61.2 7.8 2.8 1.6 5.8Kalimantan 48.9 11.2 2.9 6.6 5.3Sulawesi 49.8 6.4 2.9 4.6 3.3Maluku, Papua and Nusa Tenggara 45.8 5.1 1.9 5.8 3.2
Male 56.3 8.4 0.2 2.6 5.0Female 58.0 6.2 5.0 2.8 5.6
Expenditure QuintilePoorest 60.9 6.2 1.8 3.3 3.9Second 58.0 7.0 2.3 2.4 5.7Third 53.9 7.5 3.4 2.4 7.0Fourth 47.7 10.2 4.2 1.9 7.8Richest 45.5 15.6 2.4 1.3 5.7
Source: Calculations based on BPS, Susenas Kore.
Table 4.4. Percentage of School-Age Children Who Gave Financial Reasons for Not Attending
School, by Education Level (2007, %)
Primary (7–12)
Junior Secondary
(13–15)
Senior Secondary
(16–18)Indonesia 35.8 59.1 59.0
Urban 36.8 58.7 58.1Rural 35.4 59.3 59.4
Male 34.1 56.6 59.1Female 38.0 61.9 58.8
Poor 38.4 64.1 66.0Non-poor 33.3 56.6 56.9
Source: Calculations based on BPS, Susenas Kore.

Chapter 4. Critical Constraints to Reducing Poverty and Inequality
63
Box 4.1. Education, Employment, and Poverty
Education is a key to accessing productive employment and earning one’s way out of poverty. Average wages by educational attainment clearly show a high return to education in Indonesia, as elsewhere. Too many children withdraw prematurely from school and forego opportunities to lift themselves and their future family members out of poverty. Despite the progress in school enrolment rates and the entitlement to education, almost one in five Indonesian children is out of school. The single most important reason is the financial burden families face (Table 4.3).
Although many children work in Indonesia, comprehensible and reliable data on their numbers and socio-economic characteristics were not available. In response, the International Labour Organization, in collabo-ration with Statistics Indonesia (Badan Pusat Statistik), carried out the first Indonesia Child Labour Survey in 2009. The survey found that, of the total of about 58.8 million children, 4.1 million aged 5–17 (6.9%) were working children. Of that, 1.8 million were classified as “child labor”—defined for this survey as all working children aged 5–12 regardless of their working hours, children 13–14 who had worked more than 15 hours a week, and 15–17 year-olds who had worked more than 40 hours a week.
Of the total, 41.2% (24.3 million children) were engaged in housekeeping. Surprisingly, 6.7 million children aged 5–17 (or 11.4% of total) were not in school or working. Working children worked on average 25.7 hours per week. The average working hours for those categorized under child labor was significantly lon-ger, at 35.1 hours per week. About 20.7% of working children worked more than 40 hours weekly, risking their sound physical and mental development.
The Millennium Development Goals recognize productive employment and decent work as one of the most effective means of reducing poverty. Thus, reducing the number of children who drop out of school prematurely, children who work excessive hours, and those who are ”idle”, as well as encouraging and en-abling them to pursue education, help to reduce poverty. Education helps people avoid or emerge from the vicious intergenerational transmission of poverty.
Source: ILO (2010).
On the supply-side, public expenditure on education has trended upward during the last decade except in 2004 (Table 4.6).15 The increase is partly due to the reallocation of public resources from fuel subsidies to education spending through such programs as the Operational Aid to Schools Program (Bantuan Operasional Sekolah [BOS]) and conditional cash transfers (World Bank 2009a). Thanks to the recent increase, Indonesia’s public expenditure has become more comparable to that of other countries in the region (Figure 4.17). However, the largest share of national education spending is allocated to primary levels—in 2005, primary education accounted for 47% of total education spending, while junior secondary, senior secondary, and tertiary education received only 27%, 15%, and 12%, respectively (Arze del Granado et al. 2007).
15 The decline in public expenditure on education in 2004 was caused by low budget execution and a crowding-out effect in most social sectors due to increasing fuel subsidies (World Bank 2009a).
With decentralization, Indonesia has devolved responsibilities for education from the central government to subnational governments. In 2006, for example, about 56% of education expenditure was spent at the subnational level, mostly by district governments (51%) rather than provincial governments (5%). Nevertheless, district government spending on education largely comprises nondiscretionary routine expenditures (about 81% in 2006), while the majority of the development budget is still spent by the central government.16 Because of the central government’s continued dominance in education investments, local governments actually have little discretion in managing funds and shaping the key education sector decisions, even though they are responsible for running, building, and rehabilitating schools.
16 However, since 2005, routine and development budget allocations are no longer separated.

Indonesia: Critical Development Constraints
64
For public spending to be translated into improved performance, the discretion of district governments must be increased and their financial management capacity improved (World Bank 2009a).
Another important issue is the allocation of public resources in the education sector. The bulk of routine expenditures at the subnational level is currently allocated to cover the wage bill (about 96% in 2006), which is still set by the central government, with merely 3% for expenditures on goods and 0.4% for operation and maintenance
(World Bank 2009a).17 This pattern needs to be remedied to achieve more efficient and effective use of public spending on education.
Other supply-side issues include the unequal distribution of teachers and, to a lesser extent, schools across the country. As Indonesia has achieved high enrollment rates for primary education, the availability of schools may not be a major concern at the primary level. However, the number of junior and senior secondary schools is much lower—on average, there are 5 primary schools but only about 2 junior secondary schools and 1 senior secondary school per 1,000 school-age children.18 As a result,
17 Many factors are responsible for the large share of teachers’ salaries in routine expenditures. First, the perception of an undersupply of teachers in Indonesia has led to increasing their numbers. Based on the teacher employment and deployment survey conducted by the World Bank in 2005, 74 of 276 primary schools that claim to have too few teachers actually show an oversupply. Second, district governments inherited many civil servant teachers who were allocated to schools by the central government prior to decentralization. Finally, because civil servant teachers are employed under the national civil service regulation, district governments have little flexibility in employing and deploying them (World Bank 2009a).
18 Calculations are based on the following data sources: the number of schools comes from Departemen Pendidikan Nasional, 2005/2006, cited in the 2008 version of BPS (various years); and the number of school-age children in 2006 is estimated based on BPS, Susenas Kore.
Table 4.5. Distribution of Education Cost by Education Level (2006, %)
Types of Cost PrimaryJunior
SecondarySenior
SecondarySchool Fee 7.79 13.05 23.29Parent Teacher Association Fee 2.72 4.12 6.06Practical Fee 1.13 1.34 2.57Student Organization Fee 0.32 0.83 1.12Examination Fee 0.80 1.25 1.96Study Material 3.65 3.40 2.88Uniform 21.00 14.51 8.42Textbooks 19.68 15.41 11.53Stationary 13.44 9.11 5.87Transport 9.60 21.08 24.35Other Course/ Training Fee 2.08 2.62 2.31Other 17.79 13.29 9.65Total 100.00 100.00 100.00
Source: BPS Susenas Modul Tahun 2006 cited in BPS (2006).
Table 4.6. National Public Expenditure on Education (2001–2008)
Year2006 Prices (Rp Trillion)
Share of Total National Expenditure (%)
Share of GDP (%)
2001 63.4 11.0 2.82002 70.5 14.2 2.72003 83.7 14.7 3.12004 76.7 13.0 2.72005 82.8 13.9 2.62006 102.5 15.3 3.12007* 111.3 15.4 3.02008** 116.4 13.6 3.0
Notes: *= estimated subnational budget, **= central government budget and estimated subnational budget. GDP = gross domestic product.Source: World Bank (2009a).
Figure 4.17. Public Expenditure on Education for Selected Countries (% of GDP)
0 1 2 3 4 5
Cambodia (2007)
Indonesia (2007)
Lao PDR (2007)
Malaysia (2006)
Philippines (2005)
Singapore (2008)
Thailand (2007)
Note: Lao PDR = Lao People’s Democratic Republic.Source: World Bank, WDI, accessed 5 October 2009.
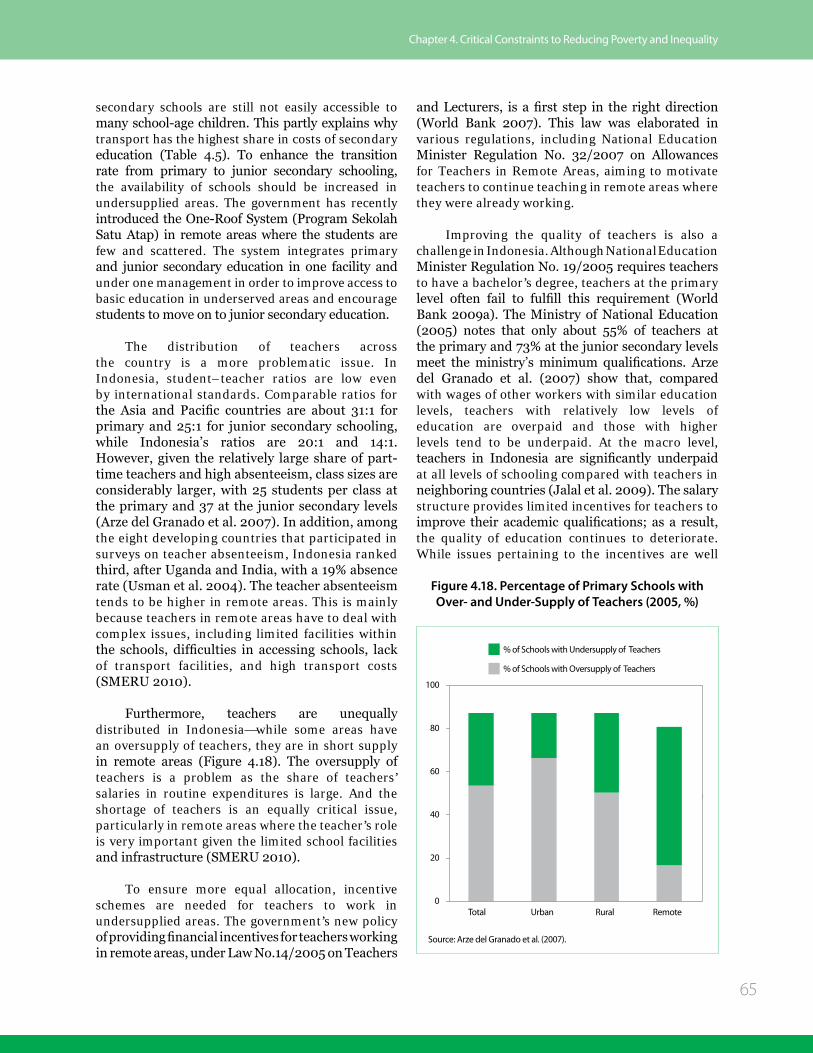
Chapter 4. Critical Constraints to Reducing Poverty and Inequality
65
secondary schools are still not easily accessible to many school-age children. This partly explains why transport has the highest share in costs of secondary education (Table 4.5). To enhance the transition rate from primary to junior secondary schooling, the availability of schools should be increased in undersupplied areas. The government has recently introduced the One-Roof System (Program Sekolah Satu Atap) in remote areas where the students are few and scattered. The system integrates primary and junior secondary education in one facility and under one management in order to improve access to basic education in underserved areas and encourage students to move on to junior secondary education.
The distribution of teachers across the country is a more problematic issue. In Indonesia, student–teacher ratios are low even by international standards. Comparable ratios for the Asia and Pacific countries are about 31:1 for primary and 25:1 for junior secondary schooling, while Indonesia’s ratios are 20:1 and 14:1. However, given the relatively large share of part-time teachers and high absenteeism, class sizes are considerably larger, with 25 students per class at the primary and 37 at the junior secondary levels (Arze del Granado et al. 2007). In addition, among the eight developing countries that participated in surveys on teacher absenteeism, Indonesia ranked third, after Uganda and India, with a 19% absence rate (Usman et al. 2004). The teacher absenteeism tends to be higher in remote areas. This is mainly because teachers in remote areas have to deal with complex issues, including limited facilities within the schools, difficulties in accessing schools, lack of transport facilities, and high transport costs (SMERU 2010).
Furthermore, teachers are unequally distributed in Indonesia—while some areas have an oversupply of teachers, they are in short supply in remote areas (Figure 4.18). The oversupply of teachers is a problem as the share of teachers’ salaries in routine expenditures is large. And the shortage of teachers is an equally critical issue, particularly in remote areas where the teacher’s role is very important given the limited school facilities and infrastructure (SMERU 2010).
To ensure more equal allocation, incentive schemes are needed for teachers to work in undersupplied areas. The government’s new policy of providing financial incentives for teachers working in remote areas, under Law No.14/2005 on Teachers
and Lecturers, is a first step in the right direction (World Bank 2007). This law was elaborated in various regulations, including National Education Minister Regulation No. 32/2007 on Allowances for Teachers in Remote Areas, aiming to motivate teachers to continue teaching in remote areas where they were already working.
Improving the quality of teachers is also a challenge in Indonesia. Although National Education Minister Regulation No. 19/2005 requires teachers to have a bachelor’s degree, teachers at the primary level often fail to fulfill this requirement (World Bank 2009a). The Ministry of National Education (2005) notes that only about 55% of teachers at the primary and 73% at the junior secondary levels meet the ministry’s minimum qualifications. Arze del Granado et al. (2007) show that, compared with wages of other workers with similar education levels, teachers with relatively low levels of education are overpaid and those with higher levels tend to be underpaid. At the macro level, teachers in Indonesia are significantly underpaid at all levels of schooling compared with teachers in neighboring countries (Jalal et al. 2009). The salary structure provides limited incentives for teachers to improve their academic qualifications; as a result, the quality of education continues to deteriorate. While issues pertaining to the incentives are well
Figure 4.18. Percentage of Primary Schools with Over- and Under-Supply of Teachers (2005, %)
0
20
40
60
80
100
Total Urban Rural Remote
% of Schools with Undersupply of Teachers
% of Schools with Oversupply of Teachers
Source: Arze del Granado et al. (2007).
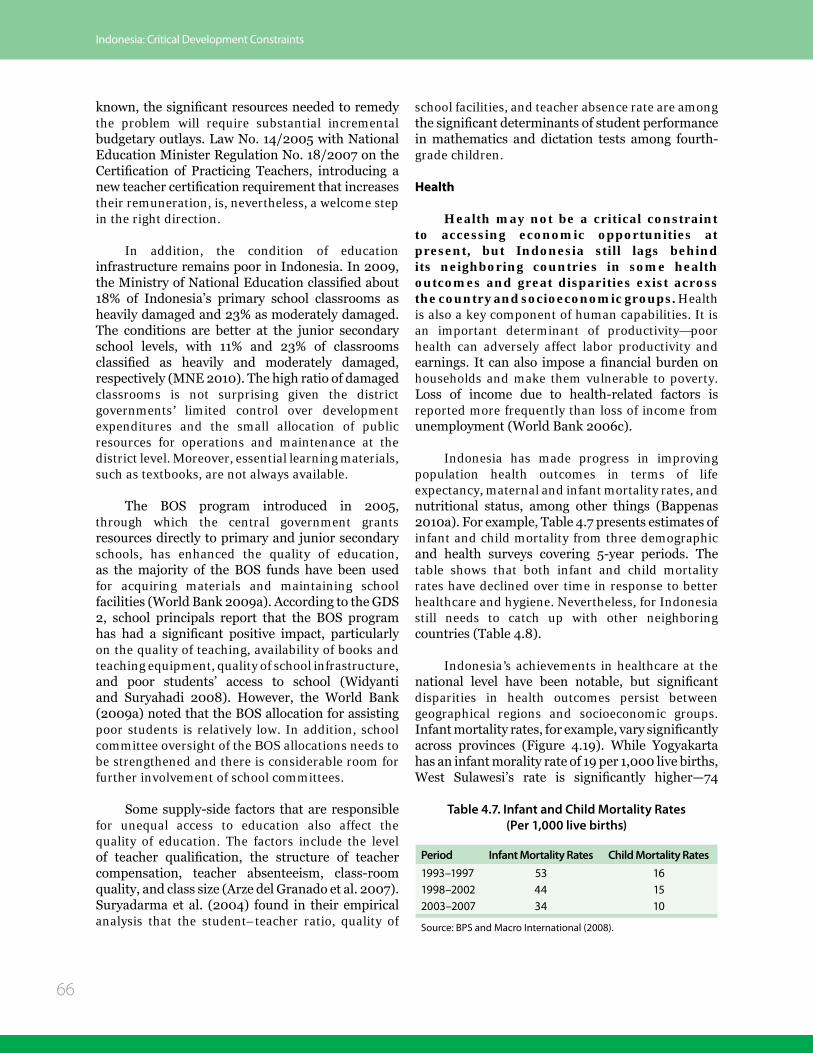
Indonesia: Critical Development Constraints
66
known, the significant resources needed to remedy the problem will require substantial incremental budgetary outlays. Law No. 14/2005 with National Education Minister Regulation No. 18/2007 on the Certification of Practicing Teachers, introducing a new teacher certification requirement that increases their remuneration, is, nevertheless, a welcome step in the right direction.
In addition, the condition of education infrastructure remains poor in Indonesia. In 2009, the Ministry of National Education classified about 18% of Indonesia’s primary school classrooms as heavily damaged and 23% as moderately damaged. The conditions are better at the junior secondary school levels, with 11% and 23% of classrooms classified as heavily and moderately damaged, respectively (MNE 2010). The high ratio of damaged classrooms is not surprising given the district governments’ limited control over development expenditures and the small allocation of public resources for operations and maintenance at the district level. Moreover, essential learning materials, such as textbooks, are not always available.
The BOS program introduced in 2005, through which the central government grants resources directly to primary and junior secondary schools, has enhanced the quality of education, as the majority of the BOS funds have been used for acquiring materials and maintaining school facilities (World Bank 2009a). According to the GDS 2, school principals report that the BOS program has had a significant positive impact, particularly on the quality of teaching, availability of books and teaching equipment, quality of school infrastructure, and poor students’ access to school (Widyanti and Suryahadi 2008). However, the World Bank (2009a) noted that the BOS allocation for assisting poor students is relatively low. In addition, school committee oversight of the BOS allocations needs to be strengthened and there is considerable room for further involvement of school committees.
Some supply-side factors that are responsible for unequal access to education also affect the quality of education. The factors include the level of teacher qualification, the structure of teacher compensation, teacher absenteeism, class-room quality, and class size (Arze del Granado et al. 2007). Suryadarma et al. (2004) found in their empirical analysis that the student–teacher ratio, quality of
school facilities, and teacher absence rate are among the significant determinants of student performance in mathematics and dictation tests among fourth-grade children.
Health
Health may not be a critical constraint to accessing economic opportunities at present, but Indonesia still lags behind its neighboring countries in some health outcomes and great disparities exist across the country and socioeconomic groups. Health is also a key component of human capabilities. It is an important determinant of productivity—poor health can adversely affect labor productivity and earnings. It can also impose a financial burden on households and make them vulnerable to poverty. Loss of income due to health-related factors is reported more frequently than loss of income from unemployment (World Bank 2006c).
Indonesia has made progress in improving population health outcomes in terms of life expectancy, maternal and infant mortality rates, and nutritional status, among other things (Bappenas 2010a). For example, Table 4.7 presents estimates of infant and child mortality from three demographic and health surveys covering 5-year periods. The table shows that both infant and child mortality rates have declined over time in response to better healthcare and hygiene. Nevertheless, for Indonesia still needs to catch up with other neighboring countries (Table 4.8).
Indonesia’s achievements in healthcare at the national level have been notable, but significant disparities in health outcomes persist between geographical regions and socioeconomic groups. Infant mortality rates, for example, vary significantly across provinces (Figure 4.19). While Yogyakarta has an infant morality rate of 19 per 1,000 live births, West Sulawesi’s rate is significantly higher—74
Table 4.7. Infant and Child Mortality Rates(Per 1,000 live births)
Period Infant Mortality Rates Child Mortality Rates1993–1997 53 161998–2002 44 152003–2007 34 10
Source: BPS and Macro International (2008).

Chapter 4. Critical Constraints to Reducing Poverty and Inequality
67
per 1,000 live births. The main diseases leading to mortality in children include malaria, pneumonia, diarrhea, and measles (Bappenas 2010a).
The prevalence of infectious disease varies significantly across the country. The incidence of malaria, as indicated by the annual parasite index, for example, varies between 0 and about 28 per 1,000 people (Figure 4.20). The index tends to be high in the eastern part of Indonesia, with West Papua being the highest (27.7), followed by East Nusa Tenggara (15.6), and Papua (9.9). Diarrhea
is the second leading cause of infant mortality and the fifth for all age groups. While about 9% of children under 5 years old had diarrhea in 2007, the incidence of diarrhea varies widely across the country (Figure 4.21). Nanggroe Aceh has the highest rate—about 18.9%—followed by Gorontalo (16.5%) and West Nusa Tenggara (13.2%).
Limited use of healthcare services, unequal access to healthcare, and unequal access to clean water and sanitation systems affect people’s health conditions. A key cause of Indonesia’s relatively poor health outcomes is the limited use of healthcare services. Figure 4.22 shows the treatment-seeking behavior among people who had a health complaint during the month prior to the survey. The proportion of people who sought treatment in a healthcare facility has increased somewhat in recent years, partly due to the introduction of the Askeskin program, which was subsequently reformed into the Jamkesmas program. This program provides the targeted poor with free healthcare at community health centers (puskesmas) and free inpatient treatment in third-class hospital wards. Nonetheless, the figure shows that utilization levels have not yet returned to the pre-crisis level. In addition, access to all types of healthcare facilities, particularly to puskesmas, declined after the crisis, though the trends are reversing in recent years (Figure 4.23).
Table 4.8. Health Outcomes for Selected Southeast Asian Countries (2007)
Country
Life Expectancy
at Birth (years)
Infant Mortality Rate (per 1,000 live
births)
Maternal Mortality Rate (per 100,000 live births)
Cambodia 61 70 540Indonesia 70 34 228Malaysia 72 10 62Philippines 71 23 230Singapore 81 2 14Thailand 70 6 110Viet Nam 72 13 150
Note: In case of Indonesia, the figure for life expectancy at birth is for 2009.Source: For Indonesia, Bappenas (2010a); for other countries, WHO (2009).
Figure 4.19. Infant Mortality Rates by Province (per 1,000 live births)
0
10
20
30
40
50
60
70
80
Nan
ggro
e Ac
eh
Nor
th S
umat
ra
Wes
t Sum
atra
Riau
Jam
bi
Sout
h Su
mat
ra
Beng
kulu
Lam
pung
Bang
ka-B
elitu
ng
Riau
Isla
nds
Jaka
rta
Wes
t Jav
a
Cent
ral J
ava
Yogy
akar
ta
East
Java
Bant
en Bali
Wes
t Kal
iman
tan
Cent
ral K
alim
anta
n
Sout
h Ka
liman
tan
East
Kal
iman
tan
Nor
th S
ulaw
esi
Cent
ral S
ulaw
esi
Sout
h Su
law
esi
Sout
heas
t Sul
awes
i
Gor
onta
lo
Wes
t Sul
awes
i
Mal
uku
Nor
th M
aluk
u
Wes
t Pap
ua
Papu
a
Sumatra Java & Bali Kalimantan Sulawesi Maluku, Papua, Nusa Tenggara
Notes: Infant mortality rates are for the 10-year period preceding the survey (i.e., 1998–2007).Sources: BPS and Macro International (2008).

Indonesia: Critical Development Constraints
68
Figure 4.20. Annual Parasite Index (2009, per 1,000 people)
0
5
10
15
20
25
30
Nan
ggro
e Ac
eh
Nor
th S
umat
ra
Wes
t Sum
atra
Riau
Jam
bi
Sout
h Su
mat
ra
Beng
kulu
Lam
pung
Bang
ka-B
elitu
ng
Riau
Isla
nds
Jaka
rta
Wes
t Jav
a
Cent
ral J
ava
Yogy
akar
ta
East
Java
Bant
enBali
Wes
t Kal
iman
tan
Cent
ral K
alim
anta
n
Sout
h Ka
liman
tan
East
Kal
iman
tan
Nor
th S
ulaw
esi
Cent
ral S
ulaw
esi
Sout
h Su
law
esi
Wes
t Sul
awes
i
Sout
heas
t Sul
awes
i
Gor
onta
lo
Mal
uku
Nor
th M
aluk
u
Papu
a
Wes
t Pap
ua
Wes
t Nus
a Te
ngga
ra
East
Nus
a Te
ngga
ra
Source: Bappenas (2010a).
Figure 4.21. Incidence of Diarrhea among Under-5 Children (2007, %)
0
5
10
15
20
Nan
ggro
e Ac
eh
Nor
th S
umat
ra
Wes
t Sum
atra
Riau
Jam
bi
Sout
h Su
mat
ra
Beng
kulu
Lam
pung
Bang
ka-B
elitu
ng
Riau
Isla
nds
Jaka
rta
Wes
t Jav
a
Cent
ral J
ava
Yogy
akar
ta
East
Java
Bant
enBali
Wes
t Kal
iman
tan
Cent
ral K
alim
anta
n
Sout
h Ka
liman
tan
East
Kal
iman
tan
Nor
th S
ulaw
esi
Cent
ral S
ulaw
esi
Sout
h Su
law
esi
Wes
t Sul
awes
i
Sout
heas
t Sul
awes
i
Gor
onta
lo
Mal
uku
Nor
th M
aluk
u
Papu
a
Wes
t Pap
ua
Wes
t Nus
a Te
ngga
ra
East
Nus
a Te
ngga
ra
Source: Bappenas (2010a).
The utilization of healthcare services varies by geographical region and socioeconomic group (Table 4.9). People living in urban areas, Java, and Bali, and those covered by health insurance are more likely to have visited a healthcare facility than are others. A higher utilization rate of healthcare facili-ties is also observed among better-off households.
There are great variations in the type of facilities accessed across the country and among expenditure quintiles (Table 4.10). For example, puskesmas are the service most frequently accessed nationwide but the utilization rate is greater among poorer people. In contrast, people living in urban areas and wealthier people are

Chapter 4. Critical Constraints to Reducing Poverty and Inequality
69
The use of maternal and child healthcare services varies among wealth quintiles and with the mothers’ education level (Table 4.11). The disparities are particularly striking among mothers’ education levels: less than 20% of infants whose mothers received no education were fully immunized, whereas about 73% of infants whose mothers completed secondary schooling or higher were fully immunized. Infant mortality rates are also higher among infants with less educated mothers or from poor families.
Other Social Services
Other important social services that could affect health outcomes include the provision of clean water and sanitation systems. Figure 4.24 shows that provinces with relatively low access to clean water and sanitation systems, particularly the latter, tend to have a higher incidence of diarrhea. For instance, in Yogyakarta, where diarrhea in the month prior to the survey was the lowest (1.3% of people), about 73% of people had access to a private toilet facility. In contrast, only about 52% of people had such access in Nanggroe Aceh, where the incidence of diarrhea was the highest (4.0%). Disparities in access to clean water and sanitation
Figure 4.23. Type of Healthcare Facilities Accessed (1997–2007, %)
2007
2006
2005
2002
2001
1997
0
20
40
60
80
Puskesmas
Public hospital
Paramedic (nurse/midwife) practitioner
Polyclinic/Doctor's practice
Private hospital
Note: Puskesmas are community health centers.Source: Calculations based on BPS, Susenas Kore.
Figure 4.22. Utilization of Healthcare Services (1993–2007, %)
2007
2006
2006
2005
2002
2001
1997
1993
0
20
40
60
80
100
No Treatment Self-treatment only
Facility visit
Source: For 1993–2006, World Bank (2008a); and for 2007, calculations based on BPS, Susenas Kore.
Table 4.9. Utilization of Healthcare Services (2007, %)
No Treatment
Self-Treatment
Facility Visit
Indonesia 11.7 44.2 44.1
Urban 10.8 43.6 45.6Rural 12.3 44.6 43.1
Sumatra 13.9 44.0 42.1Java and Bali 9.9 43.6 46.5Kalimantan 11.9 51.9 36.2Sulawesi 13.7 49.0 37.3Maluku, Papua, and Nusa Tenggara 17.2 38.0 44.8
Has no Insurance 11.7 46.2 42.2Has Insurance 11.8 39.4 48.8
Expenditure QuintilePoorest 14.7 47.2 38.1Second 11.7 46.0 42.3Third 10.7 44.2 45.1Fourth 10.1 42.1 47.8Richest 10.6 40.1 49.3
Source: Calculations based on BPS, Susenas Kore.
more likely to access other healthcare facilities, including public and private hospitals, polyclinics, and doctor’s practices.

Indonesia: Critical Development Constraints
70
systems are also found among different expenditure groups (Table 4.12). Clearly, Indonesia needs to improve the provision of these services, particularly in lagging areas and for the poor.
Causes of unequal access to healthcare services are found on both the demand and supply sides. On the supply side, one main issue is the relatively limited allocation of public expenditure to the health sector. Despite a steady increase during the last decade, health spending as a share of GDP remains low (Table 4.13), particularly in comparison with the neighboring countries (Figure 4.25).
Another issue is that the benefit incidence of public spending on primary healthcare is not particularly pro-poor, but is equally distributed across the income levels. Given the poor’s limited use of public hospitals (Table 4.10), better-off households tend to benefit relatively more from secondary healthcare. However, as the lower quintiles’ use of healthcare facilities has been increasing since the introduction of the Askeskin program, the benefits of public spending on health are likely to have become more pro-poor in recent years (World Bank 2008a).
Along with continued efforts to increase public expenditures for health, the efficiency and
Table 4.10. Type of Healthcare Facilities Accessed (2007, %)
Public Hospital
Private Hospital
Polyclinic/ Doctor’s Practice
Paramedic (nurse/
midwife) Practitioner
Puskes-mas
Indonesia 4.5 2.7 18.6 18.4 25.1
Urban 5.9 4.5 25.2 11.4 23.0Rural 3.5 1.3 14.0 23.3 26.5
Sumatra 5.3 3.0 15.3 20.9 24.7Java and Bali 4.0 3.0 22.4 19.5 22.4Kalimantan 4.3 1.4 11.7 14.2 25.7Sulawesi 5.0 1.1 12.0 12.4 29.5Maluku, Papua , and Nusa Tenggara 5.2 1.3 10.9 11.8 41.5
No insurance 2.9 2.1 18.3 19.8 21.9Insurance 8.2 4.0 19.4 15.0 32.6
Expenditure QuintilePoorest 2.4 0.7 8.3 18.0 28.4Second 3.0 1.2 13.2 21.6 27.8Third 4.4 2.0 17.8 21.1 26.2Fourth 5.6 3.2 24.0 18.8 23.9Richest 7.9 7.2 34.4 11.0 17.1
Note: Puskesmas are community health centers.Source: Calculations based on BPS, Susenas Kore.
Figure 4.24. Access to Clean Water and Sanitation, and Incidence of Diarrhea (2007)
Nan
ggro
e Ac
eh
Gor
onta
lo
East
Nus
a Te
ngga
ra
Cent
ral S
ulaw
esi
Wes
t Sul
awes
i
Nor
th M
aluk
u
Nor
th S
ulaw
esi
Riau
Nor
th S
umat
ra
Wes
t Nus
a Te
ngga
ra
Lam
pung
Wes
t Sum
atra
Wes
t Pap
ua
Sout
h Ka
liman
tan
Mal
uku
Jaka
rta
Riau
Isla
nds
Sout
heas
t Sul
awes
i
Papu
a
Beng
kulu
Wes
t Kal
iman
tan
Bang
ka-B
elitu
ng
Cent
ral K
alim
anta
n
Bali
Sout
h Su
law
esi
East
Kal
iman
tan
Bant
en
Wes
t Jav
a
Sout
h Su
mat
ra
Jam
bi
East
Java
Cent
ral J
ava
Yogy
akar
ta
0
20
40
60
80
100
% o
f hou
seho
lds w
ith c
lean
w
ater
/priv
ate
toile
t fac
ility
0
1
2
3
4
5
% o
f peo
ple
who
su�e
red
from
dia
rrhe
a
% of Households with Clean Water % of Households with Private Toilet Facility
% of People Who Su�ered from Diarrhea in the Past Month
Note: Clean water includes bottled water, tap water, pumped water, protected well water, and protected spring water.Source: Calculations based on BPS, Susenas Kore.

Chapter 4. Critical Constraints to Reducing Poverty and Inequality
71
Table 4.11. Maternal and Child Health-Related Indicators (2007)
Infant Mortality (per 1,000
live births)a
Prenatal Care:
4+ visits (%)b
Birth Delivery
by a Skilled Provider
(%)c
Fully Immunized
Children (%)d
Indonesia 39 81.5 79.4 58.6
Urban 31 89.9 84.3 67.5Rural 45 75.5 75.9 52.3
Mothers' EducationNo Education 73 44.1 49.5 18.6Some Primary 51 63.5 69.1 37.3Complete Primary 44 77.3 79.8 52.1Some Secondary 35 85.9 82.7 60.6Secondary+ 24 93.1 83.8 72.8
Wealth QuintilePoorest 56 61.1 65.0 39.4Second 47 78.3 79.2 53.0Third 33 83.4 82.8 58.1Fourth 29 90.6 86.5 68.0Richest 26 96.4 86.4 74.9
Notes: a Infant morality rates are for the 10-year period preceding the survey (i.e., 1998–2007).b Percentage of women who have given a live birth in the last 5 years and had at least four prenatal care visits during pregnancy.c Percentage of live births in the last 5 years assisted by a skilled provider (doctor, nurse, midwife, or auxiliary nurse/midwife).d Percentage of children aged 12–23 months who received tuberculosis (BCG), measles, and three doses each of diphtheria, pertussis, and tetanus (DPT) and polio vaccines.Sources: For prenatal care, calculations based on BPS, IDHS; and for other indicators, BPS and Macro International (2008).
Table 4.12. Access to Clean Water and Sanitation (2007, %)
Households with Access
to Clean Water
Households with Access to Toilet Facility
Private/Public/ Shared Private
Indonesia 78.9 77.1 59.9
Urban 92.6 90.5 72.1Rural 68.5 67.0 50.6
Sumatra 65.3 78.3 65.0Java and Bali 87.0 78.9 60.0Kalimantan 50.2 78.1 61.3Sulawesi 75.9 68.7 53.8Maluku, Papua and Nusa Tenggara 68.5 62.0 45.9
Expenditure QuintilePoorest 67.8 58.8 39.5Second 73.3 68.0 49.6Third 77.2 76.8 59.2Fourth 83.2 86.3 69.9Richest 92.9 96.0 80.8
Note: Clean water includes bottled water, tap water, pumped water, protected well water, and protected spring water.Source: Calculations based on BPS, Susenas Kore.
Table 4.13. National Public Expenditure on Health (2001–2008)
Year2006 Prices (Rp Trillion)
Share of Total National Expenditure (%)
Share of GDP (%)
2001 8.3 2.6 0.52002 8.8 3.2 0.62003 12.1 3.9 0.82004 11.8 3.6 0.72005 12.2 3.5 0.72006 18.0 4.4 0.92007* 20.9 4.8 1.12008** 20.3 4.4 1.1
Notes: *= allocation, **= estimated.Source: World Bank (2008a).
effectiveness of budget allocation needs to be improved. As in the education sector, the share spent at the subnational level is larger than that at the central level (though the central level share has been increasing in recent years, largely due to the Askeskin–Jamkesmas program). Nonetheless, the bulk of subnational health expenditure goes for routine expenditure, particularly on personnel. As a consequence, funds allocated to operation and maintenance tend to be limited at the subnational level (World Bank 2008a).
The spending structure is reflected in the insufficient provision of healthcare facilities. Despite the impressive expansion of the pubic health system in the 1970s and 1980s, the growth of public sector
health infrastructure has slowed, failing to keep pace with population growth (World Bank 2008a). An international comparison of the provision of healthcare facilities and providers highlights Indonesia’s insufficient supply (Table 4.14). For example, the Philippines, with a per capita GDP similar to that of Indonesia, performs better on these indicators of healthcare provision.
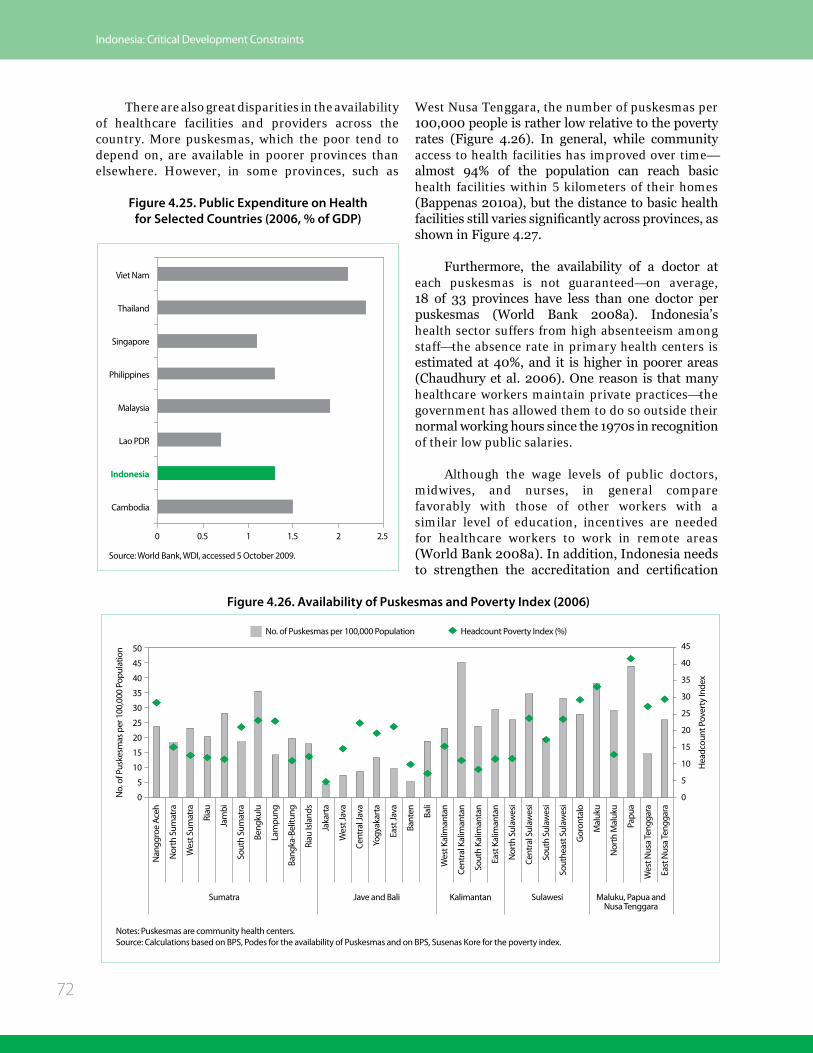
Indonesia: Critical Development Constraints
72
There are also great disparities in the availability of healthcare facilities and providers across the country. More puskesmas, which the poor tend to depend on, are available in poorer provinces than elsewhere. However, in some provinces, such as
West Nusa Tenggara, the number of puskesmas per 100,000 people is rather low relative to the poverty rates (Figure 4.26). In general, while community access to health facilities has improved over time—almost 94% of the population can reach basic health facilities within 5 kilometers of their homes (Bappenas 2010a), but the distance to basic health facilities still varies significantly across provinces, as shown in Figure 4.27.
Furthermore, the availability of a doctor at each puskesmas is not guaranteed—on average, 18 of 33 provinces have less than one doctor per puskesmas (World Bank 2008a). Indonesia’s health sector suffers from high absenteeism among staff—the absence rate in primary health centers is estimated at 40%, and it is higher in poorer areas (Chaudhury et al. 2006). One reason is that many healthcare workers maintain private practices—the government has allowed them to do so outside their normal working hours since the 1970s in recognition of their low public salaries.
Although the wage levels of public doctors, midwives, and nurses, in general compare favorably with those of other workers with a similar level of education, incentives are needed for healthcare workers to work in remote areas (World Bank 2008a). In addition, Indonesia needs to strengthen the accreditation and certification
Figure 4.25. Public Expenditure on Health for Selected Countries (2006, % of GDP)
0 0.5 1 1.5 2 2.5
Cambodia
Indonesia
Lao PDR
Malaysia
Philippines
Singapore
Thailand
Viet Nam
Source: World Bank, WDI, accessed 5 October 2009.
Figure 4.26. Availability of Puskesmas and Poverty Index (2006)
Cent
ral K
alim
anta
n
Nan
ggro
e Ac
eh
Nor
th S
umat
ra
Wes
t Sum
atra
Riau
Jam
bi
Sout
h Su
mat
ra
Beng
kulu
Lam
pung
Bang
ka-B
elitu
ng
Riau
Isla
nds
Jaka
rta
Wes
t Jav
a
Cent
ral J
ava
Yogy
akar
ta
East
Java
Bant
en Bali
Wes
t Kal
iman
tan
Sout
h Ka
liman
tan
East
Kal
iman
tan
Nor
th S
ulaw
esi
Cent
ral S
ulaw
esi
Sout
h Su
law
esi
Sout
heas
t Sul
awes
i
Gor
onta
lo
Sumatra Jave and Bali Kalimantan Sulawesi Maluku, Papua andNusa Tenggara
Mal
uku
Nor
th M
aluk
u
Papu
a
East
Nus
a Te
ngga
ra
Wes
t Nus
a Te
ngga
ra
Notes: Puskesmas are community health centers.Source: Calculations based on BPS, Podes for the availability of Puskesmas and on BPS, Susenas Kore for the poverty index.
No. of Puskesmas per 100,000 Population Headcount Poverty Index (%)
0
5
10
15
20
25
30
35
40
45
0
5
10
15
20
25
30
35
40
4550
Hea
dcou
nt P
over
ty In
dex
No.
of P
uske
smas
per
100
,000
Pop
ulat
ion

Chapter 4. Critical Constraints to Reducing Poverty and Inequality
73
Figure 4.27. Average Distance to Puskesmas (2006, km)
Bali
0
5
10
15
20
25
30
35
40
Riau
Nan
ggro
e Ac
eh
Nor
th S
umat
ra
Wes
t Sum
atra
Jam
bi
Sout
h Su
mat
ra
Beng
kulu
Lam
pung
Bang
ka--B
elitu
ng
Riau
Isla
nds
Jaka
rta
Wes
t Jav
a
Cent
ral J
ava
Yogy
akar
ta
East
Java
Bant
en
Wes
t Kal
iman
tan
Cent
ral K
alim
anta
n
Sout
h Ka
liman
tan
East
Kal
iman
tan
Nor
th S
ulaw
esi
Cent
ral S
ulaw
esi
Sout
h Su
law
esi
Sout
heas
t Sul
awes
i
Gor
onta
lo
Mal
uku
Nor
th M
aluk
u
Papu
a
Wes
t Nus
a Te
ngga
ra
East
Nus
a Te
ngga
ra
Sumatra Java and Bali Kalimantan Sulawesi Maluku, Papua, andNusa Tenggara
Notes: Puskesmas are community health centers. The average distance to the nearest puskesmas is calculated among the villages without a puskesmas. Source: Calculations based on BPS, Podes .
system for healthcare staff to improve the quality of healthcare services.
Some demand-side factors are also responsible for unequal access to healthcare. A main issue is the financial burden on individual households. Given the limited public spending on health, out-of-pocket payments are relatively high and comprise a significant part of health spending in Indonesia (World Bank 2008a). In maternal and child healthcare, for example, financial difficulties seem
Table 4.14. International Comparison of Healthcare Facilities and Providers (per 100,000 people)
Country
Hospital Beds Physicians Nurses Midwives
Year No. Year No. Year No. Year No.
Cambodia 2004 1 2000 16 2000 62 2000 23
Indonesia 2002 6 2003 13 2003 57 2003 25
Malaysia 2006 19 2002 71 2002 144 2002 37
Philippines 2006 13 2002 115 2002 436 2002 178
Singapore 2006 32 2003 150 2003 431 2003 9
Thailand 2000 22 2002 31 2002 135 2000 1
Viet Nam 2005 26 2002 56 2002 58 2002 19
Sources: For hospital beds, except for Indonesia and Thailand, WHO, WHOSIS, accessed October 2009; for hospital beds for Indonesia and Thailand, WHO, WHO Regional Office for South-East Asia accessed October 2009; and for other figures, WHO, WHO Global Health Atlas accessed October 2009.
to be the main problem in accessing healthcare services. And poorer households are more likely to have difficulties financing medical treatments (Table 4.15).
The Askeskin program (which became the Jamkesmas program) was a welcome step toward enhancing access to healthcare. Although the program’s coverage needs to be extended and better targeted, Sparrow et al. (2008) find that the program has been targeted to the poor and has

Indonesia: Critical Development Constraints
74
allocated proportionally more funding to people who are most vulnerable to health shocks. Their analysis also finds that the program has had a positive effect on the use of healthcare services. Furthermore, in November 2009, the Ministry of Health presented a blueprint for a new health insurance scheme targeting universal coverage in 2012 (Suryahadi et al. 2010). If implemented as planned, this is likely to enhance people’s access to healthcare services.
However, while Askeskin cardholders in-creased their use of puskesmas, they did not significantly increase their use of hospital services (World Bank 2008a) and the impact of the program for secondary healthcare is greater among the non-poor (Sparrow et al. 2008). Thus, barriers other than financial issues seem to prevent some people from accessing healthcare services. Table 4.15, for example, shows that the distance to healthcare facilities is a main problem in accessing maternal and child healthcare—the distance implies extra cost, which is likely to increase the financial burden, particularly for poor households.
Within households, other obstacles hamper the access of women and children to healthcare services—for about 14% of women, getting permission to go to healthcare facilities and/or not wanting to go alone is a problem. These problems tend to be identified more frequently by less educated women (Table 4.15) and may partly explain why educated mothers are more likely to use services such as immunization, prenatal care, and assisted birth delivery (Table 4.11). Hence, increasing peoples’ education levels, particularly of mothers, and increasing the awareness of the potential benefits of modern healthcare, including preventative care, are critical to increasing the utilization of healthcare services in Indonesia.
Unequal access to and limited use of healthcare may also be due to a lack of trust in the public health system. In general, the quality of healthcare services in Indonesia is said to be low, with limited availability of medication, inadequate infrastructure, and often insufficient healthcare personnel. In addition, puskesmas are often reported to have limited access to clean water and electricity (World Bank 2007). The GDS 2 lists the main aspects of healthcare services requiring improvement as the (1) availability of medicines and vaccines (24% of households thought this needs to be improved), (2) affordability of medical
services (20%), (3) physical condition of healthcare services (19%), (4) attention and attitude of medical personnel (15%), and (5) waiting time at healthcare service providers (7%). Nonetheless, about 71% of household respondents reported improvements in public healthcare service delivery in recent years (Widyanti and Suryahadi 2008).
4.2.2 Uneven Playing Fields
Unequal access to economic opportunities may also be caused by unequal access to infrastructure and to productive assets such as land and credit.
Infrastructure
Good infrastructure, especially high quality roads and reliable electricity supply, can enhance access to key services and to economic opportunities. In geographically
Table 4.15. Main Problems in Accessing Maternal and Child Healthcare (2007, %)
Getting Money
Needed
Distance to Health Facilities/
Having to Take
Transport
Knowing Where to go
Concern There May
Be No Female
Healthcare Provider
Getting Permission To Go/Not Wanting to Go Alone
Indonesia 25 17 5 11 14
Urban 20 8 3 10 10Rural 29 24 7 11 17
Mothers’ EducationNo Education 28 18 8 11 16Some Primary 22 14 4 11 12Complete Primary 27 30 5 11 20Some Secondary 35 26 9 6 18Complete Secondary (and higher) 39 32 11 11 18Wealth QuintilePoorest 41 34 11 10 24Second 32 23 7 11 18Third 28 19 5 11 14Fourth 24 15 5 11 14Richest 14 9 4 10 10
Source: Calculations based on BPS, IDHS.

Chapter 4. Critical Constraints to Reducing Poverty and Inequality
75
challenged countries such as Indonesia, infrastructure plays a key role in promoting inclusiveness. The state of infrastructure affects people’s access not only to economic opportunities, but also to public services. Numerous studies illustrate the importance of infrastructure in poverty reduction, income growth, and access to nonfarm economic activities (e.g., Gibson 2009, Gibson and Olivia 2008, Yamauchi et al. 2009, and World Bank 2006c). Poverty diagnostics, for example, show that access to asphalt roads is a key variable associated with increases in household expenditure in Indonesia (World Bank 2006c). The same analysis also illustrates the importance of the quality of roads
Similarly, based on data from the Indonesia Family Life Survey and the Rural Investment Climate Survey, Gibson (2009) finds that lack of access to and poor quality of infrastructure (such as roads and electricity) constrain nonfarm economic activities of rural households. Furthermore, Gibson finds poor quality of infrastructure, especially roads and electricity, to be a major problem.
Because enhancing nonfarm activities is a key driver for reducing poverty in rural areas, these empirical findings underline the importance of infrastructure for inclusiveness. Land transport is the main system for connecting villages in most provinces. Roads are, therefore, essential for
people’s livelihoods in Indonesia, although in some areas (e.g., Kalimantan, Maluku Islands, Nusa Tenggara Islands, Papua and West Papua, Riau Islands, and Sumatra) water transport is also a main connectivity system.
Despite the importance of roads, the supply of good quality roads is limited in many parts of the country. For example, asphalt and concrete roads seem to be concentrated in the Java and Bali region (Figure 4.28), whereas roads in the Kalimantan; Maluku, Papua, and Nusa Tenggara; and Sulawesi regions are in particularly poor condition. Moreover, among the roads managed by the central government, no roads in Jakarta are in damaged condition, whereas more than 60% of such roads in Papua are reported as damaged (Figure 4.29).
About 10% of roads are under the purview of provincial governments and 81% are under district governments. Unfortunately, no accurate subdistrict-level data are available on the condition of provincial and district roads. But, at the national level, about 18%, 24%, and 40% of the roads managed by the central, provincial, and district governments, respectively, are in poor condition (BPS 2008b). Given the poorer condition of provincial and district roads, the disparity in the quality of roads across the country presented in Figure 4.29 is likely to be an underestimation.
Figure 4.28. Type of Surfaces of the Widest Road (2008, %)
0
20
40
60
80
100
Nan
ggro
e Ac
eh
Nor
th S
umat
ra
Wes
t Sum
atra
Riau
Jam
bi
Sout
h Su
mat
ra
Beng
kulu
Lam
pung
Bang
ka-B
elitu
ng
Riau
Isla
nds
Jaka
rta
Wes
t Jav
a
Cent
ral J
ava
Yogy
akar
ta
East
Java
Bant
en Bali
Wes
t Kal
iman
tan
Cent
ral K
alim
anta
n
Sout
h Ka
liman
tan
East
Kal
iman
tan
Nor
th S
ulaw
esi
Cent
ral S
ulaw
esi
Sout
h Su
law
esi
Sout
heas
t Sul
awes
i
Gor
onta
lo
Wes
t Sul
awes
i
Mal
uku
Nor
th M
aluk
u
Papu
a
Wes
t Pap
ua
Wes
t Nus
a Te
ngga
ra
East
Nus
a Te
ngga
ra
Sumatra Java and Bali Kalimantan Sulawesi Maluku, Papua, and Nusa Tenggara
Asphalt/Concrete Gravel
Source: Calculations based on BPS, Podes .

Indonesia: Critical Development Constraints
76
Figure 4.29. Percentage of Damaged Roads (2007, %)
0
20
40
60
50
70
Nan
ggro
e Ac
eh
Nor
th S
umat
ra
Wes
t Sum
atra
Riau
Jam
bi
Sout
h Su
mat
ra
Beng
kulu
Lam
pung
Bang
ka-B
elitu
ng
Jaka
rta
Wes
t Jav
a
Cent
ral J
ava
Yogy
akar
ta
East
Java
Bant
en Bali
Wes
t Kal
iman
tan
Cent
ral K
alim
anta
n
Sout
h Ka
liman
tan
East
Kal
iman
tan
Nor
th S
ulaw
esi
Cent
ral S
ulaw
esi
Sout
h Su
law
esi
Sout
heas
t Sul
awes
i
Gor
onta
lo
Wes
t Sul
awes
i
Mal
uku
Nor
th M
aluk
u
Papu
a
Wes
t Pap
ua
Wes
t Nus
a Te
ngga
ra
East
Nus
a Te
ngga
ra
Sumatra Java and Bali Kalimantan Sulawesi Maluku, Papua, and Nusa Tenggara
Notes: Based on the roads under the responsibility of the central government.Source: BPS (2008b).
30
10
A direct consequence of poor road conditions is increased travel time (and thus also travel costs). For example, in Manggarai district in East Nusa Tenggara, road conditions are much worse and resulting travel times much longer between Manggarai and its main business destinations than from other parts of the country to equivalent destinations—travel over the 140 kilometers from
Ruteng to Labuanbajo is usually 3.5–4 hours, whereas it only takes about 1.5 hours to traverse the 128 kilometer from Jakarta to Bandung (World Bank 2006b). Box 4.2 provides details.
There are also great regional discrepancies in accessing markets. Figure 4.30 shows that markets are more commonly found in provinces such as
Figure 4.30. Percentage of Villages with Markets (2008, %)
0
20
30
40
50
70
Nan
ggro
e Ac
eh
Nor
th S
umat
ra
Wes
t Sum
atra
Riau
Jam
bi
Sout
h Su
mat
ra
Beng
kulu
Lam
pung
Bang
ka-B
elitu
ng
Riau
Isla
nds
Jaka
rta
Wes
t Jav
a
Cent
ral J
ava
Yogy
akar
ta
East
Java
Bant
en Bali
Wes
t Kal
iman
tan
Cent
ral K
alim
anta
n
Sout
h Ka
liman
tan
East
Kal
iman
tan
Nor
th S
ulaw
esi
Cent
ral S
ulaw
esi
Sout
h Su
law
esi
Sout
heas
t Sul
awes
i
Gor
onta
lo
Wes
t Sul
awes
i
Mal
uku
Nor
th M
aluk
u
Papu
a
Wes
t Pap
ua
Wes
t Nus
a Te
ngga
ra
East
Nus
a Te
ngga
ra
Sumatra Java and Bali Kalimantan Sulawesi Maluku, Papua, andNusa Tenggara
Markets in Permanent Buildings Markets without Permanent Buildings
Source: Calculations based on BPS, Podes .
60
10
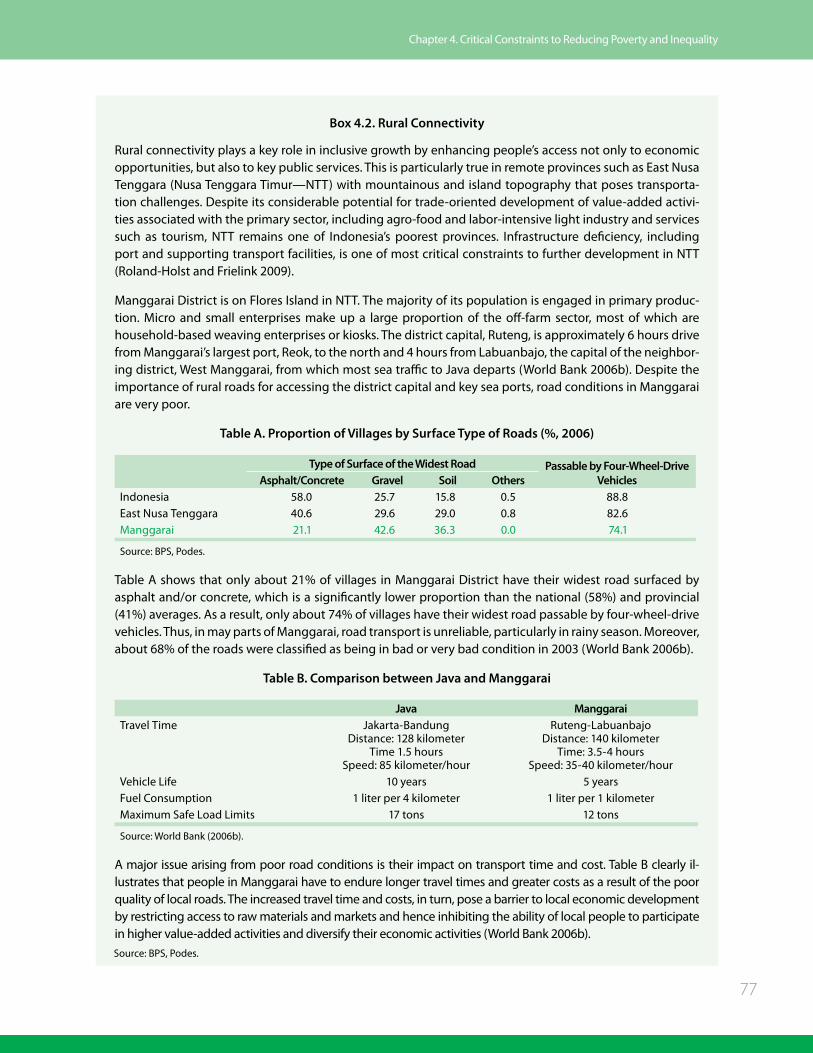
Chapter 4. Critical Constraints to Reducing Poverty and Inequality
77
Box 4.2. Rural Connectivity
Rural connectivity plays a key role in inclusive growth by enhancing people’s access not only to economic opportunities, but also to key public services. This is particularly true in remote provinces such as East Nusa Tenggara (Nusa Tenggara Timur—NTT) with mountainous and island topography that poses transporta-tion challenges. Despite its considerable potential for trade-oriented development of value-added activi-ties associated with the primary sector, including agro-food and labor-intensive light industry and services such as tourism, NTT remains one of Indonesia’s poorest provinces. Infrastructure deficiency, including port and supporting transport facilities, is one of most critical constraints to further development in NTT (Roland-Holst and Frielink 2009).
Manggarai District is on Flores Island in NTT. The majority of its population is engaged in primary produc-tion. Micro and small enterprises make up a large proportion of the off-farm sector, most of which are household-based weaving enterprises or kiosks. The district capital, Ruteng, is approximately 6 hours drive from Manggarai’s largest port, Reok, to the north and 4 hours from Labuanbajo, the capital of the neighbor-ing district, West Manggarai, from which most sea traffic to Java departs (World Bank 2006b). Despite the importance of rural roads for accessing the district capital and key sea ports, road conditions in Manggarai are very poor.
Table A. Proportion of Villages by Surface Type of Roads (%, 2006)
Type of Surface of the Widest Road Passable by Four-Wheel-Drive VehiclesAsphalt/Concrete Gravel Soil Others
Indonesia 58.0 25.7 15.8 0.5 88.8East Nusa Tenggara 40.6 29.6 29.0 0.8 82.6Manggarai 21.1 42.6 36.3 0.0 74.1
Source: BPS, Podes.
Table A shows that only about 21% of villages in Manggarai District have their widest road surfaced by asphalt and/or concrete, which is a significantly lower proportion than the national (58%) and provincial (41%) averages. As a result, only about 74% of villages have their widest road passable by four-wheel-drive vehicles. Thus, in may parts of Manggarai, road transport is unreliable, particularly in rainy season. Moreover, about 68% of the roads were classified as being in bad or very bad condition in 2003 (World Bank 2006b).
Table B. Comparison between Java and Manggarai
Java ManggaraiTravel Time Jakarta-Bandung
Distance: 128 kilometerTime 1.5 hours
Speed: 85 kilometer/hour
Ruteng-LabuanbajoDistance: 140 kilometer
Time: 3.5-4 hoursSpeed: 35-40 kilometer/hour
Vehicle Life 10 years 5 yearsFuel Consumption 1 liter per 4 kilometer 1 liter per 1 kilometerMaximum Safe Load Limits 17 tons 12 tons
Source: World Bank (2006b).
A major issue arising from poor road conditions is their impact on transport time and cost. Table B clearly il-lustrates that people in Manggarai have to endure longer travel times and greater costs as a result of the poor quality of local roads. The increased travel time and costs, in turn, pose a barrier to local economic development by restricting access to raw materials and markets and hence inhibiting the ability of local people to participate in higher value-added activities and diversify their economic activities (World Bank 2006b).
Source: BPS, Podes.

Indonesia: Critical Development Constraints
78
Figure 4.31. Average Distance to Markets (with a permanent building, 2006, km)
0
20
40
50
60
Nan
ggro
e Ac
eh
Nor
th S
umat
ra
Wes
t Sum
atra
Riau
Jam
bi
Sout
h Su
mat
ra
Beng
kulu
Lam
pung
Bang
ka-B
elitu
ng
Jaka
rta
Riau
Isla
nds
Wes
t Jav
a
Cent
ral J
ava
Yogy
akar
ta
East
Java
Bant
en Bali
Wes
t Kal
iman
tan
Cent
ral K
alim
anta
n
Sout
h Ka
liman
tan
East
Kal
iman
tan
Nor
th S
ulaw
esi
Cent
ral S
ulaw
esi
Sout
h Su
law
esi
Sout
heas
t Sul
awes
i
Gor
onta
lo
Mal
uku
Nor
th M
aluk
u
Papu
a
Wes
t Nus
a Te
ngga
ra
East
Nus
a Te
ngga
ra
Sumatra Java and Bali Kalimantan Sulawesi Maluku, Papua, andNusa Tenggara
Km = kilometer.Note: The average distance is calculated among the villages without any market. Source: Calculations based on BPS, Podes.
30
10
Bali, Jakarta, and Yogyakarta than in the rest of the country. Furthermore, people living in some provinces need to travel long distances to reach the nearest market, particularly in Central Kalimantan, East Kalimantan, Maluku, and Papua (Figure 4.31). As discussed in previous sections, distance to other facilities, such as schools and healthcare centers, also poses a barrier to accessing these key services. Connecting the rural poor through improvements in rural infrastructure should, therefore, be a priority for reducing poverty and inequality.
As for electricity, household access does not seem to be very low in many parts of the country, except in provinces such as Papua and West Papua (Figure 4.32). However, because the connection rate at the village level tends to be higher than at the household level, connection within a village seems to be an issue for some provinces, such as East Nusa Tenggara. Moreover, the quality of the electricity provision varies significantly across the country, with outer regions suffering from frequent blackouts (Gibson 2009).
Unequal access to good quality infrastructure is mainly due to insufficient allocation of resources to the poorer regions; limited allocation of expenditures to maintenance; and local governments’ limited capacity for planning, budgeting, and executing their spending. Chapter 3 identifies several factors that are responsible for
the limited availability of infrastructure and for its low quality in Indonesia. This part of the report will raise additional issues that are more specific to the unequal distribution of infrastructure, particularly roads, and disparities in the quality of infrastructure across the country.
One of the main problems for the infras-tructure sector in Indonesia is that the allocation of resources does not reflect the needs. Conse-quently, it tends to exacerbate geographical inequalities in access to and quality of infrastruc-ture. In response to the “big-bang decentra-lization” in 2001, which marked the post New Order era, the responsibility for providing basic services has been shifted from the central to subnational governments, and it is now funded from the regional budget. Nevertheless, due to the limited ability of many of subnational govern- ments to raise their own revenues, the central government continues to play an important supporting role, particularly in fiscal matters—the central government remains responsible for ensuring the balance of fund allocations among regions (Usman et al. 2008). As a result, the majority of the regional budget consists of transfers from the central government. The main components of the transfers are the General Allocation Fund (DAU), Specific Allocation Fund (DAK), and Shared Revenue Fund. The objective of the transfers is to reduce financial discrepancies between the center and regions as

Chapter 4. Critical Constraints to Reducing Poverty and Inequality
79
well as among regions, and to reduce interregional disparity in the provision of public services.
The DAU grant is a general purpose grant that is intended to equalize subnational fiscal resources. The current DAU formula has two components: “basic allocation” and “fiscal gap.” While the former is made on the basis of the district-level salary bill of the civil service, the latter is allocated to the districts pro rata of their fiscal gap and this component is the main driver of equalization. While the share of the fiscal gap component is increasing, it comprises only a minor part of the allocation mechanism (World Bank 2007). Even though a poverty variable is included for calculating the fiscal gap component, its share is small. Moreover, the DAU fund has to be allocated first to cover 100% of the local civil service wage bill. As a result, poorer districts tend to have limited funding to invest even though they have the greater need for maintenance and investment.
In contrast, the DAK grant is a special purpose grant. While the DAU fund is mostly used to cover administrative costs, the DAK is mainly used for capital expenditure and it is the main source for the development of physical infrastructure for subnational governments. The DAK’s primary
objective is to improve the provision of public services that have not met certain standards. In this way, the DAK may ensure that funding is targeted by sector and by region, and thus reduces disparity in growth rates between sectors and regions (Usman et al. 2008).
Nevertheless, the government has not maximized the use of the DAK for addressing the needs of resource-deficient regions and sectors. There are several explanations for the disappointing results. First, the amount of DAK funding available is still relatively small, even though its share has been increasing in recent years (Figure 4.33). This is partly because almost all regional governments receive the DAK, while the fund is supposed to target resource-deficit regions. The allocation process has not been entirely transparent either—the allocation mechanisms set forth in the regulations are not yet well understood by many regional governments (Bappenas 2010a). Moreover, the DAK has to be allocated to a relatively large number of sectors—in addition to key sectors such as education, health, and infrastructure, it is allocated to public administration infrastructure, agriculture, maritime affairs and fisheries, and the environment.
Figure 4.32. Access to Electricity (%)
0
20
40
60
80
100 N
angg
roe
Aceh
Nor
th S
umat
ra
Wes
t Sum
atra
Riau
Jam
bi
Sout
h Su
mat
ra
Beng
kulu
Lam
pung
Bang
ka-B
elitu
ng
Riau
Isla
nds
Jaka
rta
Wes
t Jav
a
Cent
ral J
ava
Yogy
akar
ta
East
Java
Bant
en Bali
Wes
t Kal
iman
tan
Cent
ral K
alim
anta
n
Sout
h Ka
liman
tan
East
Kal
iman
tan
Nor
th S
ulaw
esi
Cent
ral S
ulaw
esi
Sout
h Su
law
esi
Sout
heas
t Sul
awes
i
Gor
onta
lo
Wes
t Sul
awes
i
Mal
uku
Nor
th M
aluk
u
Papu
a
Wes
t Pap
ua
Wes
t Nus
a Te
ngga
ra
East
Nus
a Te
ngga
ra
Sumatra Java and Bali Kalimantan Sulawesi Maluku, Papua, andNusa Tenggara
% of Households that Use Electricity for Lighting % of Villages with Families Using Electricity
Sources: For the connection at the household level, calculations are based on data for 2007 from BPS, Susenas Kore; and for the connection at the village level, calculations are based on data for 2008 from BPS, Podes .

Indonesia: Critical Development Constraints
80
Second, unlike the DAU and Shared Revenue Fund, no government regulation specifically applies to the DAK. While this makes the DAK a flexible instrument for addressing interregional imbalances, subnational governments can not be certain about the amount they will receive. Moreover, the timetable for the central government’s release of the allocation decisions and of DAK funds often conflicts with the budget preparation. These issues unnecessarily complicate the budget preparation process for subnational governments (Usman et al. 2008).
Another issue is that the central government determines the DAK recipient sectors based on national priorities as set out in the government’s work plan.19 In addition, for each sector, the use of the DAK must follow the centrally determined technical guidelines that set which activities can be funded. For example, according to the technical guidelines, at least 70% of the DAK should be used for periodic maintenance and a maximum of 30% is used for rehabilitation, upgrading, or new road development. Routine maintenance is, in principle, the responsibility of local governments from the regional budget, with exceptions subject
19 In practice, subnational governments are only asked to send data on the state of regional infrastructure in sectors that receive DAK allocations, and the central government uses that data as a determinant for allocating DAK by sector and region. The allocation also follows the development priorities laid out in the government’s work plan (Usman et al. 2008).
to approval from the Ministry of Public Works (Bappenas 2010a). However, such guidelines may limit the usefulness of the DAK fund. For example, Kabupaten Kupang requires a greater allocation of funds for upgrading activities because most of its roads have not been asphalted. This example illustrates the limited scope for subnational governments to design interventions that are most appropriate to local needs and conditions (World Bank 2006c).
The DAK, due to the foregoing issues and despite its potential, is not effectively reducing disparities in the provision of public services across the country. It is important to make the DAK allocation process more transparent, predictable, and fairer to improve the efficiency and effectiveness with which DAK funds are used.
In addition to the general issues discussed so far, some specific issues pertain to road infrastructure. First, district governments do not have control over road user tax, which still lie under the control of the central and provincial governments. As a consequence, they are unable to raise funds to cover the costs imposed by road users (World Bank 2006b).
Another problem is the relatively low allocation of expenditure to road maintenance, particularly at the subnational level. Road expenditure is biased toward new road construction and upgrading, which, at least partly, is because routine maintenance is less effective in gaining local political support than the construction of new roads. Financial incentives should be provided to subnational governments to ensure adequate road maintenance (World Bank 2007). Thus, in addition to increasing the volume of infrastructure investment, improving the efficiency and effectiveness of spending is also critical.
Other issues include subnational governments’ development spending on infrastructure lagging behind their growing revenues (World Bank 2007). This may reflect their limited capacity for planning, budgeting, and executing their spending.
As for electricity, retail tariff levels are below cost and are far below those of other Association of Southeast Asian Nations (ASEAN) countries. The current uniform tariff policy provides no incentive to extend the networks and adequately maintain existing assets, particularly in rural and remote areas
Figure 4.33. Proportion of Balance Funds in Total Regional Budget Expenditure (2001–2007, %)
25
20
15
10
5
02001 20062005200420032002 2007
DAK DAU DBH
Notes: DAK = Speci�c Allocation Fund, DAU = General Allocation Fund, DBH = Shared Revenue Fund.Source: Usman et al. (2008).

Chapter 4. Critical Constraints to Reducing Poverty and Inequality
81
where costs tend to be relatively high. Moreover, the consumption subsidy, in the form of low tariffs, encourages excessive consumption and is regressive because poor households are likely to consume less electricity (or have no connection) than the better-off ones (World Bank 2007).
Land
Limited availability of irrigated land constrains poverty reduction in provinces that rely on rice production for livelihood. Given that a relatively large proportion of poor households work in the agriculture sector, boosting agricultural capability remains important for poverty reduction. Land is one of the main productive assets, particularly in countries like Indonesia, where many people are engaged in agriculture for their livelihood. Equality in accessing productive land is thus important for enhancing the inclusiveness of economic growth.
In Indonesia, limited availability of irrigated land poses a constraint in provinces that rely on rice production. Figure 4.34 illustrates the unequal distribution of irrigated land across provinces. It also highlights the importance of irrigation for increasing agricultural productivity, because land productivity increases with irrigation.
Land titling is another issue. The National Land Administration Agency grants titles to nonforest land in Indonesia. Less than 25% of rural landholders have formal land certificates, while almost all farmers possess land-use certificates in the People’s Republic of China and Viet Nam and close to 90% in Malaysia and Thailand (World Bank 2006c). Efforts to hasten the lengthy process of land titling, along with a reallocation of degraded, deforested land to productive uses, are needed to enhance equal access to land.
Credit
Despite the successful development of microfinance, access to financial services remains unequal. Accessibility to financial services plays a key role in ensuring equal access to economic opportunities. Along with infrastructure, limited availability of credit can be an obstacle for nonfarm enterprises in rural areas (Ikhwan and Johnston 2009). For poor households, access to financial services can also play a critical role
in enabling them to meet their daily needs and cope with crisis. Indeed, both poor and non-poor households commonly use loans for non-business purposes such as school fees, medical treatment, housing, and daily consumption needs (Johnston and Morduch 2008, Usman et al. 2004).
Indonesia is one of the leading countries in developing microfinance. Bank Rakyat Indonesia (BRI) has the largest microfinance operation among formal financial institutions in the country. In addition to microfinance branches of commercial banks, there are people’s credit banks and cooperatives; microfinance institutions established under government programs (including the Rural Credit and Funds Institution in West Java, the Kecamatan Credit Board in Central Java, Credit for Small-Scale Businesses in East Java, and Credit for People’s Business); and informal institutions, such as moneylenders (Usman et al. 2004).
The development of microfinance for enhancing access to credit in Indonesia has been a success, but much can still be done to improve the poor’s access to credit. A survey of 392 microfinance institutions in 23 countries ranked BRI 7th for market penetration, calculated as a share of borrowers in the total number of poor people in the country.20 Yet BRI’s market penetration is limited to 5.8%. Moreover, there is considerable disparity in the distribution of financial institutions across Indonesia (Figure 4.35). Banks are concentrated in the Jakarta area and even informal microfinance institutions are primarily found in the Java and Bali area.
The unequal access to credit is due to both supply- and demand-side factors. On the supply side, given the limited economic activities and, thus, the relatively small size of the potential market, poor provinces are less likely to attract banks and other financial institutions. Furthermore, the limited network of branch offices and the limited number of credit officers imply the difficulty and high cost of accessing information that allows financial institutions to identify potentially successful borrowers, constraining the provision of loans in rural and remote areas (Ikhwan and Johnston 2009).
20 Source: MIX Market 2006 data cited in ADB and MIX (2008).

Indonesia: Critical Development Constraints
82
Figure 4.34. Percentage of Irrigated Rice Land and Land Productivity
Nan
ggro
e Ac
eh
Gor
onta
lo
East
Nus
a Te
ngga
ra
Cent
ral S
ulaw
esi
Nor
th M
aluk
u
Nor
th S
ulaw
esi
Riau
Nor
th S
umat
ra
Wes
t Nus
a Te
ngga
ra
Lam
pung
Wes
t Sum
atra
Sout
h Ka
liman
tan
Mal
uku
Jaka
rta
Riau
Isla
nds
Sout
heas
t Sul
awes
i
Papu
a
Beng
kulu
Wes
t Kal
iman
tan
Bang
ka-B
elitu
ng
Cent
ral K
alim
anta
n
Bali
Sout
h Su
law
esi
East
Kal
iman
tan
Bant
en
Wes
t Jav
a
Sout
h Su
mat
ra
Jam
bi
East
Java
Cent
ral J
ava
Yogy
akar
ta
0
20
40
60
80
100
%
0
1
2
3
4
6
5
100
kg p
er h
ecta
re
Productivity of Paddy (100 kg per ha, 2008)Irrigated Paddy Land (as % of Total Paddy Land, 2006)
ha = hectare, kg = kilogram.Sources: For the percentage of irrigated land, calculations based on BPS, Podes and for land productivity, BPS (various years).
Figure 4.35. Access to Financial Institutions (2006, %)
0
10
30
50
70
90
Nan
ggro
e Ac
eh
Nor
th S
umat
ra
Wes
t Sum
atra
Riau
Jam
bi
Sout
h Su
mat
ra
Beng
kulu
Lam
pung
Bang
ka-B
elitu
ng
Riau
Isla
nds
Jaka
rta
Wes
t Jav
a
Cent
ral J
ava
Yogy
akar
ta
East
Java
Bant
en Bali
Wes
t Kal
iman
tan
Cent
ral K
alim
anta
n
Sout
h Ka
liman
tan
East
Kal
iman
tan
Nor
th S
ulaw
esi
Cent
ral S
ulaw
esi
Sout
h Su
law
esi
Sout
heas
t Sul
awes
i
Gor
onta
lo
Mal
uku
Nor
th M
aluk
u
Papu
a
Wes
t Nus
a Te
ngga
ra
East
Nus
a Te
ngga
ra
Sumatra Java and Bali Kalimantan Sulawesi Maluku, Papua, andNusa Tenggara
% of Village with Banks % of Village with Cooperatives % of Village with Informal Micro-Finance Institutions
Source: Calculations based on BPS, Podes .
80
60
40
20

Chapter 4. Critical Constraints to Reducing Poverty and Inequality
83
On the demand side, BRI’s 2002 Microfinance Access and Services Survey21 revealed that a large proportion of nonborrowing households were unaware that they could qualify for a micro scale loan, indicating a lack of information on whether and from where they could successfully obtain a loan. Although creditworthiness increases with income, nearly 40% of poor households were recorded as creditworthy (Johnston and Morduch 2008). Using data from the Indonesia Family Life Surveys, Okten and Osili (2004) empirically show that social networks help enhance access to credit by playing an important role in the diffusion of knowledge about credit opportunities. These observations suggest that market failures are, at least partly, responsible for unequal access to credit in Indonesia.
Another issue is that some potential borrowers are averse to taking debt. The Microfinance Access and Services Survey showed that about half of poor households found to be creditworthy would not take loans even if it were possible. The incidence of debt aversion is relatively consistent across all income groups. The prevalence of debt aversion implies that improved availability of credit would not automatically contribute to reducing poverty (Johnston and Morduch 2008).
4.3 Social Safety Nets and Poverty Reduction Programs
The provision of adequate social safety nets is one of the three key drivers for promoting inclusive growth (Figure 1.3). As discussed in Zhuang and Ali (2010), social safety net programs help mitigate the effects of transitory livelihood shocks, such as ill health, macroeconomic crisis, industrial structuring, and natural disasters, and meet the minimum needs of the chronically poor. While Indonesia’s poverty incidence has been declining steadily over the years, more than 10% of the population are still poor and a large percentage of households remain vulnerable to poverty. Hence, social safety nets can play an important role in helping poor and vulnerable households improve their welfare and cope with shocks.
21 The survey was conducted by BRI during July–August 2002, covering 1,438 households in six provinces: East Java, East Kalimantan, North Sulawesi, Papua, West Java, and West Kalimantan (Johnston and Morduch 2008).
Because Indonesia has made good progress in providing social safety net programs since the 1997 Asian financial crisis, social safety nets may not currently be a critical constraint to the inclusiveness of growth. Indonesia has significantly improved its provision of social safety nets and poverty alleviation programs. The improvement has taken place in two stages. The country first increased the provision of such programs in response to the 1997 Asian financial crisis, which pushed a great number of households into poverty. To help the poor cope with the economic shock, the government introduced social safety net programs under the Jaring Pengaman Sosial (JPS). The JPS was designed as temporary short-term interventions to ensure the poor’s access to food, health, and education.
The Special Market Operation program, which was subsequently renamed the Raskin program, was also introduced in response to the 1997 crisis, to help poor households meet their food needs by providing subsidized rice. Another main social safety net program the government introduced was commodity price subsidies, most notably the fuel subsidy. The fuel subsidy was a universal price subsidy and by fixing fuel prices at subsidized levels, the government aimed to protect households from price fluctuations. However, the subsidy was regressive and it was a great strain on the government’s budget. As a result, the government reduced the fuel subsidy in 2005.
The second phase of the improvement in the provision of social safety net programs came when commodity price crises occurred in the mid-2000s. To mitigate the impact of reducing the fuel subsidy, the government introduced the Compensation for Fuel Subsidy Reductions Program. This was a bold step that the government took to make its social safety programs more pro-poor. The program included the Unconditional Cash Transfer (Bantuan Langsung Tunai) program, the Operational Aid to Schools (BOS) program, the Askeskin program, and the Kecamatan Development Project. The BOS and Askeskin (and later Jamkesmas) programs were aimed at improving access to education and healthcare services, while the Kecamatan Development Project aimed at reducing poverty, improving access to infrastructure and services, and strengthening local governance.
Indonesia has further shifted some of its social safety net programs to conditional cash

Indonesia: Critical Development Constraints
84
transfer programs in recent years. The government introduced the Hopeful Family Program (Program Keluarga Harapan) and the PNPM Healthy and Bright Generation Program (PNPM Generasi) in 2007. They are still being implemented on a pilot basis and certainly need to be extended. The former is a conditional cash transfer program directed to households, while the latter is directed to communities. Both are designed to reduce poverty and improve health and education outcomes.
The government has recently formulated the concept of poverty alleviation programs in three clus-ters—social assistance, community empowerment, and small and micro-enterprise empowerment—in Presidential Regulation No. 13/2009 on the Coordination of Poverty Alleviation. The purpose is to accelerate the poverty reduction programs and give clear guidance for every level of adminis-tration (i.e., national, provincial, and district). Furthermore, the National Team for Accelerating Poverty Reduction has been formed under the Vice President on the basis of Presidential Regulation No. 15/2010 on Accelerating Poverty Reduction.
As shown in this chapter, Indonesia has made significant progress in providing social safety nets since the 1997 Asian financial crisis. The recent shift toward conditional cash transfer programs is a particularly welcome step to enhance the effectiveness and efficiency with which limited resources are used. The provision of social safety nets is not currently a critical constraint to promoting the inclusiveness of growth in Indonesia. Nevertheless, there is still scope to improve the programs’ coverage and effectiveness. The provision of such programs also needs to be institutionalized so that the government is capable of providing timely and effective social assistance in a crisis.
In expanding the depth and breadth of the social safety nets, continued focus on improving the targeting and monitoring capacity of central and local governments, and on governance is needed. A key challenge Indonesia faces in improving the provision of social safety nets is to address the general weakness of targeting. One issue is that various agencies use different definitions of the poor. It is critical that all the relevant agencies use uniform data on poverty for their programs and activities, especially those
that are targeted at the poor, in order to enhance the accuracy of targeting and effectiveness of the programs. A good candidate for the poverty targeting mechanism might be the BPS’ poverty figures comprising very poor and near poor households based on the results of the 2008 Social Protection Program Data Compilation (Bappenas 2010a).
The central and local governments’ capacity to implement and monitor welfare programs is also a critical issue, and needs to be strengthened in Indonesia. Olken (2006), for example, examined the extent of corruption in the extensive transfer program, Raskin, under which subsidized rice was distributed to poor households. A comparison between administrative data on the amount of rice distributed and survey data on the amount actually received by households resulted in an estima- tion that at least 18% of the subsidized rice disappeared. The extent of corruption was also found to be greater in ethnically fragmented and in sparsely populated areas. Such findings suggest that corruption can substantially inhibit the government’s ability to implement redistributive programs, especially in rural areas where monito-ring is likely to be challenging.
Other issues include coordination failure among different players and the local governments’ and communities’ limited involvement in designing and implementing programs (Suryahadi et al. 2010). Given the multidimensionality of poverty as well as significant variations in the needs of the poor across the country, it is important to enhance the involvement of local governments and communities in designing and implementing social safety net programs by strengthening their capacity for doing so and promoting a participatory decision-making process. In recent years, the government has been undertaking pilot programs (e.g., Pro-Poor Planning and Budgeting) in several regions to increase the planning and budgeting capacity of regional governments and improve the relevancy of the programs to the needs of local poor communities (Bappenas 2010a).
The importance of community participation is formally endorsed by Law No. 25/2004 on National Development Planning in Indonesia. It institutionalizes multistakeholder consultation

Chapter 4. Critical Constraints to Reducing Poverty and Inequality
85
forums, commonly known as musrenbang, at all levels of government. However, the effectiveness of musrenbang has been limited due, among other things, to limited local government support, limited transparency and accountability, and the limited capacity of civil society organizations. Given the great potential of musrenbang to accommodate the voice of the poor in the development planning process and the formulation of poverty reduction program, its involvement should be enhanced.
Finally, social security is still in the early stage of development in Indonesia. With the 2004 National Social Security System Law No. 40/2004, Indonesia made landmark progress toward
universal coverage. The law’s intention is to overhaul the social protection programs and provide universal protection against the risks associated with old age, illness, and work-related injury and death. The implementation of the law, however, has been delayed. A council was nominated to elaborate the law only in early 2009. The most recent data show that about 17% of employees are covered by social security (ILO and PT Jamsostek, forthcoming). The majority of the people who enjoy the coverage work in the formal sector and most informal workers, who constituted over 61% of the workforce in 2008, are without social security coverage. The government’s efforts to improve the social security system need to be accelerated.
Chapter 5 Summary, Policy Implications, and Conclusions
Since the turn of the century, Indonesia’s economy has grown at an annual average rate of about 5.1%, which compares favorably with many of its neighbors. The economy has also weathered the
recent global economic crisis well and was able to achieve one of the highest growth rates in Southeast Asia in 2009.1 However, the current pace of growth is substantially lower than that registered during 1967–1997. Moreover, growth in the last decade has not been accompanied by significant employment generation.
The country made impressive progress in reducing poverty during 1976–1996. However, the pace of poverty reduction has slowed since the 1997 Asian financial crisis. In fact, the current level of poverty is reported to be only slightly less than that prevailing in 1996. The poverty incidence is substantially higher in rural areas than in urban areas, and it is much higher in some of the outer islands than in Java and Sumatra. While income inequality in Indonesia has been lower than in other major Southeast Asian economies, it could be reduced further. Non-income inequalities—among income groups, between rural and urban areas, and across geographic regions—are also a major concern.
A further issue is how to make economic growth environmentally sustainable. The current pattern of growth is putting increasing pressure
1 Gross domestic product registered a growth rate of 4.5% in 2009, compared with –1.7% for Malaysia, 0.9% for the Philippines, –2.0% for Singapore, –2.3% for Thailand, and 5.3% for Viet Nam.
on the environment and natural resources, posing significant risks to both economic growth and poverty reduction in the long run.
Clearly, Indonesia faces formidable challenges in attaining and maintaining a high level of economic growth that is socially inclusive and environmentally sustainable. This raises questions as to what are the most critical impediments to achieving such economic growth, and how to overcome the impediments.
5.1. Critical Constraints to Inclusive Economic Growth
The study employed a diagnostic approach in an attempt to identify the most critical constraints to economic growth and poverty reduction in Indonesia. The constraints identified are
• inadequate and poor quality of infrastructure, particularly transport networks and electricity supply, as well as irrigation supply in some provinces;
• weaknesses in governance andinstitutions, especially in the areas of control of corruption, government effectiveness, and prevention of terrorism and incidences of violence; and
• unequal access to and poor qualityof education, particularly secondary and vocational education.

Chapter 5. Summary, Policy Implications, and Conclusions
87
Overcoming these constraints will push the economy to a higher and more sustainable growth path, and make opportunities and benefits more widely and equitably shared. Concerted steps are also needed to change the current patterns of economic growth so that (1) sectors with high potential for generating productive and decent employment opportunities could grow faster, and (2) growth will be environmentally sustainable.
The study proposes policy options to address these considerations. For the proposals that are already central to the government’s development planning and agenda, the need is to strengthen the resolve to implement them expeditiously.
5.2. Policy Recommendations
5.2.1. Accelerating Infrastructure Development
In terms of availability and quality of infrastructure, Indonesia lags behind most major Southeast Asian economies. Moreover, the availability of key infrastructure varies greatly across geographic regions and provinces, which is a key cause underlying the lagging regions’ poor performance. Deficiencies in the transport networks and electricity supply are a particular concern. As discussed in previous chapters, the areas where improvements in transport and electricity supply are needed most have received far less private investment—both from domestic and international sources—than other regions. In the outer islands, the availability of irrigation services is also a critical constraint, as the island economies depend on agriculture.
The government’s medium-term infrastructure plan of investing approximately $143 billion during 2010–2014 aims to accelerate development of infrastructure in the key areas at national and regional levels. The areas include electricity; transport (roads, railways, ports and airports); communication; and irrigation-both at national and regional levels). The requirements, however, far exceed the available resources and the government will need to prioritize investment for the short, medium, and long term. While the infrastructure at the regional level may not be attractive to private sector investment, there is good potential for the private sector to lead development in national-level infrastructure. To unleash this potential, the
government will need to adopt a proactive approach toward expanding the use of public–private partnerships. To that end, many reforms have already been implemented and several laws are in progress and will be enacted soon to ensure a more streamlined approach. The government is confident that, under the improved business conditions, public–private partnerships in infrastructure will flourish. A requisite underlying principle will be that the public sector should invest in areas that may not be attractive to the private sector and should not crowd out private investment in infrastructure.
Going forward, the process-oriented options that the government may consider for relaxing the binding constraints for infrastructure development in the short and medium term include the following:
Short-Term Measures
• Develop infrastructure master plans, clearly delineating public and private sector roles.
• Prescreen and prioritize projects identified in the master plans.
• Outsource preparation of prefeasibility studies on priority projects.
• Implement strictly the prevailing regulations on land acquisition.
Medium-Term Measures
• Increase public sector investment in infrastructure to at least 5% of gross domestic product.
• Strengthen the Project Development Facility within the National Development Planning Agency (Bappenas).
• Replace existing regulations on land acquisition with a new law that, among other things, provides transparent and equitable compensation mechanisms, assigns land acquisition responsibility to proponent agencies both at national and local levels, and institutes a dispute resolution mechanism.
• Initiate a comprehensive exercise for establishing a land record system based on a geographic information system and satellite mapping. The system should include mechanisms for clarifying land ownership and resolving disputes, with due regard to ancestral rights and indigenous peoples’ claims.
• Improve access to long-term financing by issuing bonds and expanding the infrastructure financing facility.

Indonesia: Critical Development Constraints
88
Transport
Short Term• Shift to a system of tendering wherein contracts
include construction and maintenance for a specified number of years.
• Fast-track implementation of reforms with respect to sea ports and airports, aiming to transfer ownership and/or management of key facilities and services to the private sector.
Medium Term• Have a concerted focus on improving multi-
modal links between districts and subdistricts and national-level infrastructure.
• Provide key infrastructure in special economic zones, on a priority basis.
• At the national and local levels, create and strengthen maintenance funds such as the Road Preservation Fund, that are financed through various levies such as user fees.
Electricity
Short Term• Formulate the implementing regulations for the
Electricity Law of 2009 (Law 30/2009), and initiate the reforms outlined in the law.
• Review and rationalize the setting of power tariffs based on a predetermined formula and allowing for full recovery of costs.
• Replace the regressive consumption subsidy with targeted subsidies for the poor and disadvantaged.
• Strengthen the legal and regulatory framework to encourage private sector participation in the sector.
Medium Term• Reduce dependence on fossil fuel generation
plants and explore renewable energy sources to generate power, especially in remote areas.
• Pursue electrification in rural and undersupplied areas, particularly in the less developed regions.
Irrigation
Short Term• Review the budgeted resources for the upkeep,
rehabilitation, and development of irrigation infrastructure and reduce the shortfalls to the extent possible.
• Implement a program to rehabilitate and maintain irrigation systems that are in very poor condition.
• Review and revise the water law and Government Regulation PP No. 20/2006 to allow the transfer of secondary irrigation infrastructure to water users’ associations and farmer cooperatives.
Medium Term• Transfer secondary- and tertiary-level irrigation
infrastructure and services to water users’ associations and farmer cooperatives.
• Develop and rehabilitate irrigation infrastruc-ture and expand irrigation services, in colla-boration with users’ groups, especially in the eastern islands with relatively low rainfall and arid and semi-arid environments (Central and East Kalimantan, East Nusa Tenggara, Maluku, and Papua).
• Promote irrigation efficiencies through investments in high-efficiency irrigation and micro-irrigation initiatives, particularly in areas with water stress.
5.2.2. Strengthening Governance and Institutions
Weak governance and institutions undermine all economic activity and poverty reduction efforts. In recent years, Indonesia has improved greatly on most of the six dimensions of governance that are monitored and tracked by the World Bank’s governance indicators. However, the improvements in some of the dimensions are still not sufficient to catch up with other major economies in Southeast Asia, and efforts in this regard need to be sustained and scaled up. Of particular concern are control of corruption, government effectiveness, and recurring acts of terrorism and violence.
Presence of corruption and weak government effectiveness, in particular, reduce the development impact of public sector investments and add to investors’ cost of doing business. While weaknesses in control of corruption and government effectiveness are constraints both at the national and local levels, they are more pronounced at the local levels. Although the occasional recurrence of acts of terrorism and violence has had substantial adverse impacts on domestic and foreign investment levels, the government may not be able to fully prevent such

Chapter 5. Summary, Policy Implications, and Conclusions
89
incidences, which have typically been in response to global issues and are linked to global terror groups and networks. Keeping this in view, the proposed policy options largely focus on control of corruption and government effectiveness.
Control of Corruption
Short Term• Fast-track the introduction and
institutionalization of e-procurement and e-disclosure of bids and contract details at the national and local government levels.
• Establish specific offices within the ministries and local governments tasked with procurement, and strengthen their capacities.
• Expedite and expand implementation of the “Treasury Single Account,” automation of treasury payments, and other measures to prevent proliferation of off-budget bank accounts.
• Introduce a countrywide whistle blower and witness protection system.
Medium Term• Institutionalize civil society representation in
procurement committees for both small and large contracts at local and national levels.
• Strengthen the internal control and audit mechanisms within the line ministries and local governments by adopting the principles of the Committee of Sponsoring Organizations of the Treadway Commission and strengthening offices of inspectorate generals within the ministries.
• Continue strengthening and empowering key agencies such as the Audit Board, the Corruption Eradication Commission, and anticorruption courts. Continue clarifying their roles, responsibilities, and authorities.
Government Effectiveness
Short Term • Assess and enhance the human and institutional
capacity for project development, sector planning, coordination, and implementation of projects within Bappenas, the Ministry of Public Works, the Ministry of Environment and Natural Resources, and the Ministry of Home Affairs at the national level and planning agencies (BAPPEDA) at district levels.
• Complete the decentralization-related reforms, including removal of inconsistencies between national and regional laws, clarification of the relationship between provinces and districts and cities, devolution of property tax and resource use tax. Ensure the flow of information on the progress and fund utilization from district to provincial and ministries.
• Allow unutilized budget to roll over into the next year.
• Revisit restrictions on the use of the Specific Allocation Fund (DAK) and make it more flexible to allow for local needs and conditions.
• Evolve a clear and transparent formula for sharing costs between national and local governments for public sector projects.
Medium Term • Continue and expand the civil service reforms
in the key ministries tasked with delivering public services.
• Strengthen the monitoring and evaluation system with deployment of a central manage-ment information system to track projects from identification to completion. Institute a review mechanism at the coordinating minister level to resolve bottlenecks.
• Reform the budgeting and fund release processes toward efficient and timely availability of funds for implementation.
• Introduce a system of performance-based budgeting to reward the agencies and local governments for achieving objectives and performance targets.
• Evolve a transparent formula for allocating funds between the local governments through the use of the General Allocation Fund (DAU) and Specific Allocation Fund (DAK), with due consideration for the poverty levels and quality of available public services and infrastructure.
5.2.3. Improving Access to and Quality of Education
Evidence suggests that limited access to employment opportunities is a major challenge to reducing poverty in the country. In particular, poor access to opportunities is largely due to lack of required skills and physical access. While the lack of physical access results from the inadequacies in infrastructure, the key reason underlying the lack of required skills is unequal access to and poor

Indonesia: Critical Development Constraints
90
quality of education—particularly secondary and vocational education—and vocational training. While the poor quality is a constraint that pertains to the nation as a whole, inequality in access is more pronounced in the lagging regions. In moving forward, the government may need to focus on making the access to secondary and vocational education and training more equitable and making a concerted effort to improve the quality of education. The government has taken some encouraging steps, including forming the high-level Education Committee headed by the Vice President, but numerous challenges remain for the short and medium term. The agenda, for short to medium term, needs to include at least the following:
Secondary Education
Short Term• Undertake a thorough review of the curricula
and formulate a road map to raise standards to par with the region’s more developed economies.
• Revise the teachers’ salary structure and expand rewards for teachers who improve their academic qualifications and performance.
• Strengthen and expand the program for providing allowances to teachers in remote areas through greater involvement of local governments.
• Increase the allocation for equipment and supplies for laboratories (science and computer) and libraries. Provide internet connectivity in junior and senior secondary schools.
• Increase lifelong learning opportunities for drop-outs and adults by offering part-time, evening, and distance-learning courses.
Medium Term• Roll out the curricula upgrade road map.• Institute a comprehensive teacher training
program, aiming to gradually improve teacher skills in line with the requirements of improved curricula and modern teaching methods.
• Expand the coverage of 9-year compulsory education through the Program Sekolah Satu Atap or the One Roof System in undersupplied areas, and ensure suitably qualified teachers are available.
• Expand and target the conditional cash transfer program (Program Keluarga
Harapan) to help offset the costs and forgone earnings of the students from poor and/or disadvantaged households.
• Expand and target the scholarship program for top-performing students in each school, to provide an incentive for performance.
• Mainstream gender considerations in designing school facilities—in particular, provide dormitories for female teachers in remote and rural areas.
Vocational Education/Training
Short Term• Abolish the move toward a dual vocational
education and vocational training system. Ensure that the national competency standards and the national certification system are compulsory for all vocational education and training schools and institutions.
• Explore innovative public–private partnerships to ensure the relevance of technical and vocational education and training by involving local industries and entrepreneurs in planning, training, and apprenticeship.
• Accelerate the revitalization program for all public vocational training center institutions (BLKIs) under the Ministry of Manpower and Transmigration and under provincial and district administrations.
• Assist private training institutions to develop market-oriented courses in accordance with national competency standards.
• Intensify efforts to streamline the national competency-based training system in all BLKI and private training institutions. Set up Professional Competency Certification organizations in each provincial capital covering the 3–5 most common skills.
• Initiate a comprehensive training and capacity building program, particularly at the management and trainer levels of BLKIs and private training institutions.
• Set up stakeholder communication systems such as training advisory boards or through a coordinating board for professional certification organizations.
• Strengthen the Indonesian Professional Certification Authority so it becomes a truly independent certification body with budget and personnel adequate to undertake its mandated tasks.

Chapter 5. Summary, Policy Implications, and Conclusions
91
• Develop entrepreneurship courses for vocational training institutions based on close cooperation with business development service providers and microfinance institutions. Integrate the courses in the vocational training scheme.
Medium Term• Mainstream entrepreneurship education
in secondary- and tertiary-level vocational education.
• Make use of the national training system obligatory in the provinces and districts by making needed revisions to pertinent laws.
• Set up national management and instructor training to help meet international standards.
• Thoroughly revise the national competency standards in close cooperation with industry and other stakeholders.
• Review the assessment and certification system to make it more affordable and inclusive in terms of geographical coverage.
• Establish for all training institutions a compulsory accreditation system that includes minimum requirements for quality assurance systems.
5.2.4. Making Growth More Pro-Employment
Economic growth since the 1997 Asian financial crisis has largely lacked substantial expansion of productive employment opportunities, and the unemployment and underemployment rates have been rather high as a result. One important reason has been low or no growth in manufacturing due to the constraints of inadequate and poor infrastructure, weak governance and institutions, and poor access to and quality of education, and because policy and market failures have not been addressed. These failures have been increasingly eroding the subsector’s competitiveness within Indonesia’s economy and in the Southeast Asia region. These constraints have also been hampering the services sector from modernizing and expanding. If this situation is left unremedied, the economy will have difficulty generating sufficient employment opportunities to keep up with the demand. Recommendations are therefore as follows:
Short Term• Reassess the appropriateness of producer
subsidies.• Establish mechanisms for formal dialogue
between investors and the government to help ascertain the constraints faced in the development of industry.
• Fast-track reforms to facilitate doing business; in particular establish a one-stop shop for licensing and permits required for investment.
• Encourage dialogue between employers’ organizations and trade unions to review labor laws to assure fair treatment of workers while allowing the labor market to adjust to changes.
Medium Term• Adopt a new industrial policy that
includes mechanisms to reward industries (manufacturing and services) that are emerging and well-performing rather than ones that are established and ailing, and that provides incentives with clear sunset clauses and regular reviews.
• Establish special economic zones.• Expand access to finance for micro, small, and
medium enterprises.
5.2.5. Greening Economic Growth and Poverty Reduction
As discussed in Chapter 2, economic growth and poverty reduction in Indonesia have often been carried out in environmentally unsustainable ways. Natural capital and the environment are being degraded and the impacts of climate change are becoming increasingly severe. Any effort to increase economic activity and reduce poverty without due consideration of environmental concerns will jeopardize the long-term sustainability of the economy and of poverty reduction.
A key step needed in this regard is to further mainstream environmental considerations into the development planning processes—both at national and regional levels. The mainstreaming in turn needs to be guided by a thorough diagnosis of the constraints on shifting to green inclusive economic growth.

Indonesia: Critical Development Constraints
92
Some policy actions that the government can take in the short and medium term to mainstream the environmental concerns in development planning may include the following:
Short Term• Diagnose the constraints to implementing green
inclusive growth.• Strengthen policy coordination between
relevant agencies and ministries.• Review and prioritize existing policies and
action plans to identify gaps and reconcile conflicts.
• Run a program to raise awareness in households and communities about the need for sustaining the environment.
• Set up efforts to improve know-how at all levels, including households and communities, and research and development for understanding the linkages between the degradation of natural resources and environmental problems, including climate change.
• Develop cost-effective mitigation and adaptation programs.
• Remove subsidies that promote the use of fossil fuels and introduce disincentives to carbon emissions.
Medium Term• Establish a framework to support and promote
“south–south” cooperation on environmental issues and climate change.
• Develop a coherent strategy for accessing carbon financing facilities and the Clean Development Mechanism.
5.3. Conclusions
The government, in its national development plan for 2005–2025, set a vision of an Indonesia that is independent through reliance on its own capacity and strength; developed, with highly educated and capable human resources; just,
with no toleration for discrimination against any individual, gender, or group; and prosperous, having fulfilled the needs of its population (F 2010b). The vision is noble and all encompassing; it is also ambitious. Its achievement will require high levels of economic growth that is socially inclusive and environmentally sustainable. Addressing the critical constraints and other important considerations identified in the current report will help set the stage for such growth.
Improvements in the availability and quality of infrastructure will help reduce the costs of doing business in the country, and will thereby help restore and enhance the Indonesian economy’s competitiveness. The impact of these improvements will not be limited to increased private sector investments in the economy; they will also help improve all peoples’ physical access to services, productive assets, and markets. Improvements in access to and the quality of education will likewise enhance the population’s abilities’ to both contribute to and benefit from economic growth. An educated and capable workforce can in turn help improve productivity and can complement the efforts to revive and expand the depth and breadth of Indonesia’s manufacturing industries. The revival of manufacturing will open up productive and decent employment opportunities that can help bring the unemployment and underemployment rates down. Delivery of these services and initiatives, however, will not be effective and efficient unless accompanied by substantial improvements in governance and institutions—both at national and regional levels.
Improvements in infrastructure and governance, and revival of a competitive manufacturing sector will, however, need to be implemented in a manner that is harmonious and not destructive to the environment and natural resources; otherwise gains will be short-lived and the country will not be able to achieve the vision set by the national development plan.

Bibliography and ReferencesALB Legal News. A Closer Look at the Power
Sector in Indonesia—The Latest Initiatives. ht t p://asia. lega lbusinessonl ine.com/industry-updates/indonesia-soemadipradia-taher/a-closer-look-at-the-power-sector-in-indonesia-the-latest-initiatives/45834 (accessed 13 May 2010).
Ali, I., and J. Zhuang. 2007. Inclusive Growth Toward a Prosperous Asia. ERD Working Paper No. 97, Economics and Research Department. Manila: Asian Development Bank.
Alisjahbana, A., and A. Yusuf. 2003. Assessing Indonesia’s Sustainable Development: Long-Run Trend, Impact of the Crisis, and Adjustment During the Recovery Period. MPRA Paper No. 1736, November 2007.
Ariff, M., and H. Hill. 1985. Export-Oriented Industrialization: the ASEAN Experience. Sydney: Allen and Unwin.
Arze del Granado, F., W. Fengler, A. Ragatz, and E. Yavuz. 2007. Investing in Indonesia’s Education: Allocation, Equity, and Efficiency of Public Expenditures. World Bank Policy Research Working Paper No.4329. Washington, DC: World Bank.
ASEAN Secretariat (ASEAN–SEC). 2009. Fourth ASEAN State of the Environment Report 2009. Malaysia.
Asia Foundation. 2008. Cost of Moving Goods—Road Transportation, Regulation and Charges in Indonesia. Jakarta.
AsiaBiz. Corporate Tax. http://www.asiabizservices.com/singapore-corporate-tax-rate/ (3 September 2009).
Asian Development Bank (ADB). 2004. Final Report for TA 3843-INO: Agriculture and Rural Development Strategy Study. Manila.
————. 2005. Country Environmental Analysis: Indonesia. Manila.
————. 2006. Indonesia Water Sector Profile. Manila. Unpublished.
————. 2007. Philippines: Critical Development Constraints. Manila.
————. 2009a. The Economics of Climate Change in Southeast Asia: A Regional Review. Manila.
————. 2009b. Key Indicators for Asia and the Pacific 2009. Manila.
————. 2010. Asian Development Outlook. Manila.————. Statistical Database System (SDBS) Online.
http://lxapp1.asiandevbank.org:8030/sdbs/jsp/index.jsp (accessed October 2009).
Asian Development Bank (ADB) and Microfinance Information Exchange (MIX). 2008. 2007 Mix Asia 100: Ranking of Microfinance Institutions. Manila.
Asian Development Bank and World Bank (ADB and World Bank). 2005. Improving the Investment Climate in Indonesia. Manila: Asian Development Bank.
Asian Productivity Organization (APO). 2004. Total Factor Productivity Growth: Survey Report. Tokyo.
Badan Koordinasi Penanaman Modal (BKPM–Indonesia Investment Coordinating Board). 2009. http://www.bkpm.go.id
Badan Perencanaan Pembangunan Nasional (Bappenas—National Development Planning Agency). 2010a. Letter to ADB. 16 July 2010.
————. 2010b. Regulation of the President of the Republic of Indonesia No. 5 of 2010 Regarding the National Medium-Term Development Plan 2010–2015 Book 1. Jakarta.
Badan Pusat Statistik (BPS—Statistics Indonesia). 2005. Large and Medium Manufacturing Indicators (Indikator Industri Besar Dan Sedang). Jakarta.
————. 2006. Statistics of Education. In National Socio-Economic Survey. Jakarta.
————. 2008a. Environment Statistics of Indonesia 2008. Jakarta.
————. 2008b. Transportation and Communication Statistics 2007 (Statistik Perhubungan 2007). Jakarta.
————. 2009a. Labor Force Situation in Indonesia on February 2009. Jakarta.
————. 2009b. Trends of the Selected Socio-Economic Indicators of Indonesia October 2009. Jakarta.
————. various years. Statistical Yearbook of Indonesia (Statistik Indonesia). Jakarta.
————. Badan Pusat Statistik Website. http://www.bps.go.id/ (accessed October 2009).
————. Indonesia Demographic and Health Survey Data 2007. Jakarta.

Indonesia: Critical Development Constraints
94
————. Podes (Village Potential Statistics of Indonesia—Statistik Potensi Desu Indonesia). Jakarta.
————. Sakernas (National Labor Force Surveys—Survei Tenaga Kerja Nasional). Jakarta.
————. Susenas Kore (National Social Economic Surveys). Jakarta.
————. Susenas Panel Datasets. Jakarta. Badan Pusat Statistik (BPS) and Macro International.
2008. Indonesia Demographic and Health Survey 2007. Calverton: BPS and Macro International.
Bank Indonesia. Indonesia Economic Monetary Statistics Weekly Report. http://www.bi.go.id/web/en/Statistik/Statistik+Ekonomi+Moneter+Indonesia, (accessed May 2010).
————. Bank Indonesia Website. http://www.bi.go.id/web/en/Statistik/Statistik+Ekonomi+dan+Keuangan+Indonesia/Versi+HTML/Sektor+Moneter/ (accessed in October 2009)
Booz Allen Hamilton. 2007. Southeast Asia Commercial Law and Institutional Reform and Trade Diagnostics—Indonesia. A Final Report prepared for USAID. http://www.bizclir.com/cs/countries/asia/indonesia/contractlaw
Bureau of Internal Revenue. National Internal Revenue Code. http://www.bir.gov.ph/taxcode/1900.htm (accessed 3 September 2009).
Burke, L., E. Selig, and M. Spalding. 2002. Reef at Risk in Southeast Asia. Washington, DC: World Resources Institute.
Card, D. 1999. The Causal Effect of Education on Earnings. In O. Ashenfelter and D. Card, eds. Handbook of Labor Economics Vol. 3A. Amsterdam: Elsevier.
CEIC. http://www.ceicdata.com (accessed September 2009).
Chaudhury, N., J. Hammer, M. Kremer, K. Muralidharan, and H. Rogers. 2006. Missing in Action: Teacher and Worker Absence in Developing Countries. Journal of Economic Perspectives, 20 (1): 91–116.
Chen, D. 2009. Vocational Schooling, Labor Market Outcomes, and College Entry. World Bank Policy Research Working Paper No. 4814. Washington, DC: World Bank.
Dhanani, S., I. Islam, and A. Chowdhury. 2009. The Indonesian Labour Market: Changes and Challenges. London and New York: Routledge.
Emerson, J., D. Esty, M. Levy, C.H. Kim, V. Mara, A. De Sherbin, and T. Srebotnjak. 2010. 2010 Environmental Performance Index. New Haven: Yale Center for Environmental Law and Policy.
Food and Agriculture Organization (FAO). Fisheries and Aquaculture Department. http://www.fao.org/fishery/countrysector/FI-CP_ID/en
Forest Watch Indonesia. 2007. Palm Oil Threats: Deforestation and Peat Land Degradation in Central Kalimantan. Brief Notes. Posted 31 March 2007.
Fossey, J. 2008. Containerisation International Yearbook 2008. UK: Informa Maritime & Transport. http://www.iaphworldports.org/world_port_info/statistics/container-4.pdf
Gibson, J. 2009. The Constraints Associated with Infrastructure Faced by Non-Farm Enterprises at the Kabupatan Level. In N. McCulloch, ed., Rural Investment Climate in Indonesia. Singapore: Institute of Southeast Asian Studies.
Gibson, J., and S. Olivia. 2008. The Effect of Infrastructure Access and Quality on Non-Farm Enterprises in Rural Indonesia. Department of Economics Working Paper in Economics. No.17/08. Hamilton, NZ: University of Waikato.
Hausmann, R., D. Rodrik, and A. Velasco. 2005. Growth Diagnostics. Cambridge, MA: John F. Kennedy School of Government, Harvard University.
Heriawan, R. 2008. Provision of Macro and Micro Data for Anti-Poverty Program in Indonesia: Challenges and Responses. Jakarta: BPS.
Hidalgo C., B. Klinger, A-L Barabasi, and R. Hausmann. 2007. The Product Space Conditions of the Development Nations. Science 317: 482–87.
Hope, Chris. 2006. The Marginal Impact of CO2 from PAGE2002: An Integrated Assessment Model Incorporating the IPCC’s Five Reasons for Concern. The Integrated Assessment Journal 6(1): 19–56.
Hopley, D., and Suharsono. 2000. The Status of Coral Reefs in Eastern Indonesia. Townsville, Australia: Australian Institute of Marine Science.
Ikhwan, A., and D. Johnston. 2009. The Constraints in Accessing Credit Faced by Rural Non-Farm Enterprises. In N. McCulloch ed. Rural Investment Climate in Indonesia. Singapore: Institute of Southeast Asian Studies.

Bibliography and References
95
IMT–GT Secretariat and ADB. 2007. Indonesia-Malaysia-Thailand Growth Triangle—Building a Dynamic Future:A Roadmap for Development 2007–2011. Manila: ADB.
International Institute for Management Development (IMD). 2009. World Competitiveness Yearbook 2009. Geneva. www.worldcompetitiveness.com
International Labour Organization (ILO). 2007. Key Indicators of the Labour Market. 5th edition. Geneva.
————. 2009. Key Indicators of the Labour Market. 6th edition. Geneva.
————. 2010. Working Children in Indonesia 2009. Jakarta: ILO and Statistics Indonesia.
————. Forthcoming. Labour and Social Trends in Indonesia 2009: Recovery and Beyond through Decent Work. Jakarta.
————. International Classification. http://laborsta.ilo.org/applv8/data/icsee.html
International Labour Organization (ILO) and PT Jamsostek. Forthcoming. Social Security for Informal Economy Workers in Indonesia. ILO.
International Monetary Fund (IMF). 2007. Indonesia: Selected Issues. IMF Country Report No. 07/273. http://www.imf.org/external/pubs/ft/scr/2007/cr07273.pdf
————. 2008. Indonesia: Selected Issues. IMF Country Report No. 08/298. http://www.imf.org/external/pubs/ft/scr/2008/cr08298.pdf
————. 2009. Indonesia: Selected Issues. IMF Country Report No. 09/231. http://www.imf.org/external/pubs/ft/scr/2009/cr09231.pdf
————. various years. Global Financial Stability Report. Washington DC.
————. International Financial Statistics (IFS) Online. Washington, DC. http://www.i m f s t a t i s t i c s . o r g / i m f / i m f b r o w s e r .aspx?branch=ROOT (accessed September 2009 to May 2010).
Islam, I., and A. Chowdhury. 2009. Growth, Employment and Poverty Reduction in Indonesia. Geneva: ILO.
Islamic Development Bank (IDB). 2010. Indonesia: Critical Constraints to Infrastructure Development. Jeddah.
Jalal, F., M. Samani, M. C. Chang, R. Stevenson, A. Ragatz, and S. Negare. 2009. Teacher Certification in Indonesia: A Strategy for Teacher Quality Improvement. Jakarta: World Bank and Ministry of National Education.
Janus Corporate Solutions. Guide Me Singapore: Singapore Goods and Services Tax Guide. ht t p://w w w.g u ideme si ngap ore .c om/business/c668-singapore-goods-and-services-tax-gst.htm (accessed 3 September 2009).
Japan External Trade Organization (JETRO). 2009. Survey on International Operations of Japanese Firms (FY 2008). Tokyo.
Japan International Cooperation Agency (JICA). 2006. Study on the Development of Domestic Sea Transportation and Maritime Industry in the Republic of Indonesia (STRAMINDO). Tokyo.
Johnston, D., and J. Morduch. 2008. The Unbanked: Evidence from Indonesia. World Bank Economic Review, 22 (3): 517–37.
Komite Pemantauan Pelaksanaan Otonomi Daerah (KPPOD—Committee Monitoring the Implementation of Regional Autonomy), United States Agency for International Development (USAID), and The Asia Foundation, 2007. Local Economic Governance in Indonesia, a Survey of Business in 243 Regencies/Cities in Indonesia. Jakarta.
Lembaga Penyelidikan Ekonomi dan Masyarakat–Fakultas Ekonomi Universitas Indonesia (LPEM–FEUI—Institute for Economic and Social Research, Department of Economics, University of Indonesia). 2007. Investment Climate Monitoring. Round IV. Jakarta.
Leitman, J. et al. 2009. Investing in a More Sustainable Indonesia. Country Environmental Analysis. CEA Series, East Asia and Pacific Region. Washington DC: World Bank.
Maidir, I., and H. Aswicahyono. Forthcoming. A Review and Diagnostic of Industrial Performance and Policies.
Malaysian Industrial Development Authority. Invest in Malaysia: Taxation. http://www.mida.gov.my/en_v2/index.php?page=taxation-2 (accessed 3 September 2009)
Miller, T., K. Holmes, A. Kim, D. Markheim, J. Roberts, and C. Walsh. 2009. 2009 Index of Economic Freedom. Washington and New York: The Heritage Foundation and Dow Jones & Company.
Ministry of Environment. 2003. National Strategy Study on CDM in Forestry Sector. Jakarta.
————. 2004. Indonesia State of Environment. Jakarta.

Indonesia: Critical Development Constraints
96
————. 2007. Indonesia Country Report: Climate Variability and Climate Change, and their Implications. Jakarta.
Ministry of Forestry. 2007. Indonesia Strategic Forestry Data 2007. Jakarta.
————. 2008. Statistik Kehutanan Indonesia 2008 (Forestry Statistics of Indonesia 2008). Jakarta. http://www.dephut.go.id/index.php?q=id/node/6122
MNE. 2005. Educational Statistics in Brief 2004/2005. Jakarta.
————. 2006. MNE Strategic Plan (Rencana Strategis Departemen Pendidikan National Tahun) 2005–2009. Jakarta.
————. 2007. EFA Mid-Decade Assessment Indonesia. Jakarta: EFA Secretariat, MNE.
————. 2008. Statistics of Education (Statistik Pendidikan). Jakarta.
————. 2010. Letter to ADB. 16 July.Muendler, M. 2009. Converter from SITC to ISIC.
University of California, San Diego. http://econ.ucsd.edu/muendler/html/resource.html
Newhouse, D., and D. Suryadarma. 2009. The Value of Vocational Education: High School Type and Labor Market Outcomes in Indonesia. World Bank Policy Research Working Paper. No. 5035. Washington, DC: World Bank.
Okten, C., and U. Osili. 2004. Social Networks and Credit Access in Indonesia. World Development, 32 (7): 1225–46.
Olken, B. 2006. Corruption and the Costs of Redistribution: Micro Evidence from Indonesia. Journal of Public Economics, 90: 853–70.
Organisation for Economic Co-operation and Development (OECD). 2007. Programme for International Student Assessment (PISA) 2006 Volume 2: Data. Paris. http://www.oecd.org/dataoecd/30/18/39703566.pdf?bcsi_scan_B90AE85AF6AB15C6=0&bcsi_scan_
————. 2008. Indonesia: Economic Assessment. OECD Economic Surveys, 2008 (17): i–131. Paris.
Pangestu, M. 1987. Survey of Recent Developments. Bulletin of Indonesian Economic Studies (April).
Paqueo, V., and R. Sparrow. 2006. Free Basic Education in Indonesia: Policy Scenarios and Implications for School Enrolment. Project Report. Jakarta: World Bank.
Perdana, A., and D. Friawan. 2007. Economic Crisis, Institutional Changes and the Effectiveness of Government: the Case of Indonesia. CSIS Economics Working Paper Series WPI102. Jakarta: Center for Strategic and International Studies.
Pew Center on Global Climate Change. 2009. Key Scientific Developments Since the IPCC Fourth Assessment Report. Science Brief 2, June 2009. Arlington, VA.
Purra, M. 2010. The Indonesian Electricity Sector: Institutional Transition, Regulatory Capacity and Outcomes. Working Paper. Singapore: National University of Singapore.
Revenue Department. Tax Structures. http://www.rd.go.th/publish/6045.0.html (accessed 3 September 2009).
Riddell, A. 2010. Indonesia Education Sector Assessment, Development Partner Interventions, Lessons Learned and Opportunities for Investment in Post-Basic Education. Unpublished.
Roland-Holst, D., and B. Frielink. 2009. Trade and Growth Horizons for Nusa Tenggara Timur and Timor-Leste. Southeast Asia Working Paper Series No. 4. Manila: ADB.
SMERU. 2010. Remote Area Allowance and Absentee Levels for Teachers in Remote Areas. Policy Brief. Jakarta: The SMERU Research Institute.
Soehoed, A. 1981. Japan and the Development of the Indonesian Manufacturing Sector. The Indonesian Quarterly. October.Jakarta.
Sparrow, R., A. Suryahadi, and W. Widyanti. 2008. Public Health Insurance for the Poor in Indonesia: Targeting and Impact of Indonesia’s Askeskin Programme. Paper prepared for the Annual Bank Conference on Development Economics (ABCDE Conference), June 2008.
Stern, N. 2007. The Economics of Climate Change: The Stern Review. Cambridge: Cambridge University Press.
Suharsono. 2005. Status of Coral Reefs in East Asia Seas Region. International Coral Reef Research and Monitoring Center. Tokyo: Ministry of Environment of Japan.
Suryadarma, D., A. Suryahadi, and S. Sumarto. 2005. The Measurement and Trends of Unemployment in Indonesia: The Issue of Discouraged Workers. SMERU Working Paper. Jakarta: The SMERU Research Institute.

Bibliography and References
97
————. 2006. Causes of Low Secondary School Enrollment in Indonesia. SMERU Working Paper. Jakarta: The SMERU Research Institute.
Suryadarma, D., A. Suryahadi, S. Sumarto, and H. Rogers. 2004. The Determinants of Student Performance in Indonesian Public Primary Schools: The Role of Teachers and Schools. SMERU Working Paper. Jakarta: The SMERU Research Institute.
Suryahadi, A., A. Yumna, U. Raya, and D. Marbun. 2010. Binding Constraint to Poverty Reduction in Indonesia. SMERU Working Paper. Jakarta: The SMERU Research Institute.
Sziraczki, G., and A. Reerink. 2004. Report of Survey on the School-to-Work Transition in Indonesia. GENPROM Working Paper No. 14. Series on Gender in the Life Cycle. Geneva: ILO. http://www.ilo.org/public/engl
Transparency International (TI). 2009. 2009 Global Corruption Barometer. Transparency International. http://www.transparency.org/publications/publications/gcb2009
————. Surveys and Indices. http://www.transparency.org/policy_research/surveys_indices/cpi/2007 (accessed May 2010).
UN Comtrade. UN Comtrade Database. http://comtrade.un.org/db/dqQuickQuery.aspx.
United Nations Conference on Trade and Statistics (UNCTAD). 2009. FDI Stats. http://stats.unctad.org/FDI/Repor tFolders/reportFolders.aspx?sCS_referer=&sCS_ChosenLang=en (accessed October 2009).
United Nations Development Programme (UNDP). 2007. Human Development Report 2007/2008 Fighting Climate Change: Human Solidarity in a Divided World. http://hdr.undp.org/en/media/HDR_20072008_EN_Complete.pdf
United Nations Environment Programme–Global Resource Information Database (UNEP/GRID)–Arendal. 2007. Extent of Deforestation in Borneo 1950–2005 and Projection Toward 2020. UNEP/GRID-Arendal Maps and Graphics Library.
US Census Bureau. www.census.gov (accessed 25 March 2010).
Usman, S., Akhmadi, and D. Suryadarma. 2004. When Teachers are Absent: Where do They Go and What is the Impact on Students? SMERU Field Report. Jakarta: The SMERU Research Institute.
Usman, S., M. Mawardi, A. Poesoro, A. Suryahadi, and C. Sampford. 2008. The Special Allocation Fund (DAK): Mechanisms and Uses. SMERU Research Report. Jakarta: The SMERU Research Institute.
Widyanti, W., and A. Suryahadi. 2008. The State of Local Governance and Public Services in the Decentralized Indonesia in 2006: Findings from the Governance and Decentralization Survey 2 (GDS2). SMERU Research Report. Jakarta: The SMERU Research Institute.
Wilkie, M., S. Fortuna, and O. Souksavat. 2002. FAO’s Database on Mangrove Area Estimates. Forest Resources Assessment Working Paper No. 62. Rome: Food and Agriculture Organization.
World Bank. 2005. Electricity for All: Options for Increasing Access in Indonesia. Jakarta.
————. 2006a. At Loggerheads? Agricultural Expansion, Poverty Reduction and Environment in the Tropical Forest. Washington, DC.
————. 2006b. The Impact of Roads Upon Local Small and Medium Enterprises in Manggarai District, NTT Province. Washington, DC.
————. 2006c. Making the New Indonesia Work for the Poor. Washington, DC.
————. 2007. Spending for Development: Making the Most of Indonesia’s New Opportunities. Indonesia Public Expenditure Review 2007. Jakarta.
————. 2008a. Investing in Indonesia’s Health: Challenges and Opportunities for Future Public Spending. Washington, DC.
————. 2008b. Second Infrastructure Development Policy Loan Project. Washington, DC.
————. 2009a. Investing in Indonesia’s Education at the District Level: An Analysis of Regional Public Expenditure and Financial Management. Washington, DC.
————. 2009b. World Development Report 2010. Washington DC.
————. Governance Matters VIII: Worldwide Governance Indicators, 1996–2008. http://info.worldbank.org/governance/wgi/pdf_country.asp.
————. PovcalNet database. http://iresearch.w o r l d b a n k . o r g / P o c a l N e t / j s p /CChoiceControl. jsp?WDI_Year=2007 (accessed July 2009).

Indonesia: Critical Development Constraints
98
————. World Development Indicators (WDI) Online. http://ddp-ext.worldbank.org/ext/DDPQQ/member.do?method=getMembers&userid=1&queryId=6 (accessed October 2009 to May 2010).
World Bank and International Finance Corporation (IFC). 2008. 2009 Doing Business. Washington, DC: World Bank.
World Economic Forum. 2009. The Global Competitiveness Report 2009–2010. Geneva. http://www.weforum.org/pdf/GCR09/GCR20092010fullreport.pdf?bcsi_scan_B90AE85AF6AB15C6=0&bcsi_scan_filename=GCR20092010fullreport.pdf
World Health Organization (WHO). 2009. World Health Statistics 2009. Geneva.
————. Global Health Atlas. http://apps.who.int/globalatlas/ (accessed July and October 2009).
————. WHO Regional Office for South-East Asia. Regional Health Situation Country Health System Profile. http://www/searo.who.int/EN/Section313.htm (accessed October 2009).
————. WHO Statistical Information System (WHOSIS). http://www.who.int/whosis/gho/en/ (accessed July and October 2009).
World Resources Institute (WRI). 2009a. Climate Analysis Indicators Tool (CAIT). 2009. Version 6.0. Washington, DC.
————. 2009b. Earthtrends database. http://earthtrends.wri.org/ (accessed 10 March 2010).
www.worldwide-tax.com. Tax Rates Around the World. http://www.worldwide-tax.com/index.asp#partthree (accessed 3 September 2009)
Yamauchi, F., M. Muto, S. Chowdhury, R. Dewina, and S. Sumaryanto. 2009. Spatial Networks, Labor Supply and Income Dynamics: Evidence from Indonesian Villages. IFPRI Discussion Papers. No.894. Washington, D.C.: International Food Policy Research Institute.
Zhuang, J. 2008. Inclusive Growth toward a Harmonious Society in the People’s Republic of China: Policy Implications. Asian Development Review Vol. 25 (1 and 2). Manila: ADB.
Zhuang, J., and I. Ali. 2010. Poverty, Inequality, and Inclusive Growth in Asia. In J. Zhuang ed., Poverty, Inequality, and Inclusive Growth in Asia: Measurement, Policy Issues, and Country Studies. London and Manila: Anthem and ADB.

Indonesia: Critical Development Constraints
Indonesia, despite steady economic growth in recent years, faces formidable challenges going forward. Economic growth has not returned to the level that prevailed before the 1997 Asian financial crisis. Progress toward reducing poverty and inequalities too has been slow during the recent years. Moreover, economic growth in the last decade has not been accompanied by significant employment generation. The country diagnostic study—Indonesia: Critical Development Constraints—presents a diagnosis of the critical development constraints the country faces. The report proposes policy options to help overcome constraints and to set the country on a path of high and sustained inclusive economic growth in the medium term.
About the Asian Development Bank
ADB’s vision is an Asia and Pacific region free of poverty. Its mission is to help its developing member countries substantially reduce poverty and improve the quality of life of their people. Despite the region’s many successes, it remains home to two-thirds of the world’s poor: 1.8 billion people who live on less than $2 a day, with 903 million struggling on less than $1.25 a day. ADB is committed to reducing poverty through inclusive economic growth, environmentally sustainable growth, and regional integration. Based in Manila, ADB is owned by 67 members, including 48 from the region. Its main instruments for helping its developing member countries are policy dialogue, loans, equity investments, guarantees, grants, and technical assistance.
About the International Labour Organization
ILO is devoted to advancing opportunities for women and men to obtain decent and productive work in conditions of freedom, equity, security, and human dignity. Its main aims are to promote rights at work, encourage decent employment opportunities, enhance social protection, and strengthen dialogue in handling work-related issues. ILO was founded in 1919 to pursue a vision based on the premise that universal, lasting peace can be established only if it is based upon decent treatment of working people. In 1946, ILO became the United Nations’ first specialized agency.
About the Islamic Development Bank
The Islamic Development Bank (IDB) formally commenced operations on 15 Shawwal 1395H (20 October 1975) with the objectives of fostering economic development and social progress of member countries and Muslim communities in non-member countries in accordance with the principles of Shari’ah (Islamic Law). The IDB’s vision is transforming human development in the Muslim world to restore its dignity. Its priority areas of focus are alleviating poverty, improving health, promoting education, improving gover-nance and prospering the people. Headquartered in Jeddah, Kingdom of Saudi Arabia, it has 56 member countries from Africa, Asia, Middle East, Europe and Latin America. The Islamic Development Bank: “Providing Resources, Fighting Poverty, Restoring Dignity”
Asian Development Bank 6 ADB Avenue, Mandaluyong City 1550 Metro Manila, Philippines Tel +63 2 632 4444 Fax +63 2 636 2444 www.adb.org/economics [email protected]
ISBN 978-92-9092-076-2Publication Stock No. RPT102217
International Labour Organization 4 route des Morillons CH-1211 Genève 22 Geneva, Switzerland Tel +41 22 799 6111 Fax +41 22 798 8685 www.ilo.org [email protected]
Islamic Development BankP.O.Box 5925, Jeddah, 21432Kingdom of Saudi ArabiaTel +966 2 636 1400Fax +966 2 636 [email protected]