industrial ecology analysis-final report - digital library/67531/metadc690173/... · ·...
TRANSCRIPT

UCRL-CR- 13227 1
s/c- B291817
Industrial Ecology Analysis-Final Report
W. E. Kastenberg
October 19,199s October 19,199s

DISCLAIMER
Work performed under the auspices of the U.S. Depart- ment of Energy by Lawrence Livermore National Labora- tory under contract number W-7405ENG-48.
This document was prepared as an account of work sponsored by an agency of the United States Government. Neither the United States Government nor the University of California nor any of their employees, makes any warranty, express or implied, or assumes any legal liability or respon- sibility for the accuracy, completeness, or usefulness of any information, apparatus, product, or process disclosed, or represents that its use would not infringe privately owned rights. Reference herein to any specific commercial prod- ucts, process, or service by trade name, trademark, manufac- turer, or otherwise, does not necessarily constitute or imply its endorsement, recommendation, or favoring by the United SLates Government or the University of California. The views and opinions of authors expressed herein do not neces- sarily state or reflect those of the United States Government or the University of California, and shall not he used for advertising or product endorsement purposes.

ELSEVIER Resources. Conservation and Recycling 24 ( 1998) 51-63
resources, conservation andrecycling
Industrial ecology and energy systems: a first step
Micah D. Lowenthal, William E. Kastenberg *
Received 23 March 199s: accepted 5 Ma); 199s
Abstract
This work is intended to contribute to the foundations for formalizing industrial ecology analyses of energy systems (systems for energy generation, transfer. or transformation) and to examine how the tools for performing these analyses can also enhance the field of industrial ecology in other applications. We discuss requirements for studying materials and energy
, cycling in industrial processes. with particular emphasis on energy generating systems, through explicit inclusion of entropy concepts in industrial ecology considerations. This perspective is intended to contribute to the theoretical basis for industrial ecology, to the development of tools for comparing the ecological (human and environmental health. and institutional) impacts of energy generating and other industrial processes, and to possible changes in engineering curricula with emphasis on design. % 1998 Elsevier Science B.V. All rights reserved.
KCJY~YNY~.S: Industrial ecology: Energy: Electricity
1. Introduction
The term ‘industrial ecology’ refers to a set of tools, principles, and perspectives borrowed and adapted from ecology for the analysis of industrial systems including the impacts on society and the environment of the systems’ material. energy, and information flows. Industrial ecology perspectives can help to optimize industrial
* Corresponding author. ‘rd.: + I 510 6J3057-I: tin: + 1 510 6439685: e-mail: kas- tcnhcltr.nuc.herkele~.cdu

order to complete the picture for traditional industrial systems [I]. Thus to see what we can learn about energy systems from ecology models we begin by looking carefully at ecological systems. followin g flows of materials, energy, and entropy.
3. Energy systems and entropy considerations
Taking the edges of the Earth’s biosphere to define the boundaries of the ecosystem for our energy analysis, energy flows in from four major natural sources: by far the largest is solar energy imparted by the sun in the form of radiant energy; gravitational forces transfer translational kinetic energy from the Earth (as a
Type II System
Energy and Limited Resource
Limited Waste.7
Type III System
M.D. Lowenthul, W.E. Kustenber!: j Resources. Conservation and Recycling 24 (1998) 51-63 55
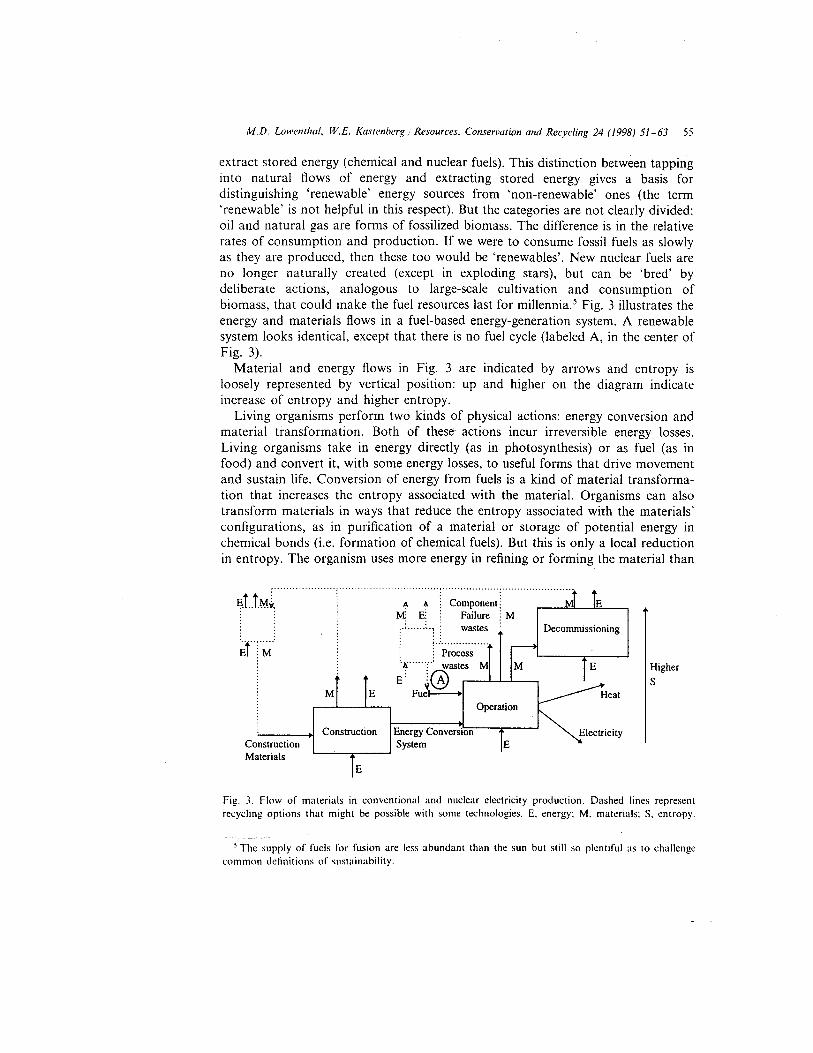
extract stored energy (chemical and nuclear fuels). This distinction between tapping into natural flows of energy and extracting stored energy gives a basis for distinguishing ‘renewable’ energy sources from ‘non-renewable’ ones (the term ‘renewable’ is not helpful in this respect). But the categories are not clearly divided: oil and natural gas are forms of fossilized biomass. The difference is in the relative rates of consumption and production. If we were to consume fossil fuels as slowly as they are produced, then these too would be ‘renewables’. New nuclear fuels are no longer naturally created (except in exploding stars), but can be ‘bred’ by deliberate actions, analogous to large-scale cultivation and consumption of biomass, that could make the fuel resources last for mil1ennia.5 Fig. 3 illustrates the energy and materials flows in a fuel-based energy-generation system. A renewable system looks identical, except that there is no fuel cycle (labeled A, in the center of Fig. 3).
Material and energy flows in Fig. 3 are indicated by arrows and entropy is loosely represented by vertical position: up and higher on the diagram indicate increase of entropy and higher entropy.
Living organisms perform two kinds of physical actions: energy conversion and material transformation. Both of these actions incur irreversible energy losses. Living organisms take in energy directly (as in photosynthesis) or as fuel (as in food) and convert it, with some energy losses, to useful forms that drive movement and sustain life, Conversion of energy from fuels is a kind of material transforma- tion that increases the entropy associated with the material. Organisms can also transform materials in ways that reduce the entropy associated with the materials’ configurations, as in purification of a material or storage of potential energy in chemical bonds (i.e. formation of chemical fuels). But this is only a local reduction in entropy. The organism uses more energy in refining or forming the material than
Decommissionine
.
Higher
s
Fig. 3. Flow of materials in conventional and nuclear electricity production. Dashed lines represent recycling options that might be possible with some technologies. E, energy; M. materials: S. entropy.
’ The supply of fuels for fusion are less abundant than the sun but still so plentiful as to challenge common definitions of sustainability.

M.D. Lowenthui. W.E. Kastenber,g i Resources. Conservution and Recycling 24 (1998) 51-63 57
degraded state. This is the basis for cogeneration plants and feedwater heaters in power plants.7 In fuel-based systems we specifically transform refined materials into degraded materials for energy, rather than degrade energy for material transforma- tions. One’s objectives in generating electricity differ, then, from one’s objectives in a typical manufacturing process.
In order to get a better handle on these systems and how they manipulate energy we need to have more detailed definitions of entropy. Taking a historical perspec- tive, we first understood entropy in a relative sense. That is. we could calculate the difference in entropy, dS, between two states using the expression, dS = SQ,lT, where S is entropy, SQ is heat transferred into the system, and T is the temperature at which the heat is exchanged. In a reversible process, the total entropy of a system and its surroundings does not change:
CdSi=O I
Further, for a process that changes the state of a system, the change in entropy for the system is only given by d;Q/T if the system is ideal and if the change is carried out reversibly.* Because thermodynamics is a study of equilibria it cannot give us relations for calculation of entropy change in irreversible systems, except to establish minimum values. In other words, we know that the change in entropy of a system undergoing an irreversible change must be greater than the change in entropy for an ideal system undergoing a reversible change. Thus using classical thermodynamics we can utilize ideal systems to represent general principles about entropy and efficiency and their relative increase or decrease.
Statistical thermodynamics offers a more rigorous and demanding definition of entropy. We define n(E) to be the number of configurations of the system such that the system has total energy E. This is called the thermodynamic probability. If two systems are in communication with each other and the total energy between them is fixed, ET, the probability of finding a particular distribution of energy between the two systems is proportional to the product of the thermodynamic probabilities of the two states, expressed as
P(E) cc f2,tE)QJET - E) (2)
According to statistical thermodynamics. the entropy of a system is given by the relation, S = k In 0, where k is the Boltzmann constant and In is the natural
’ In power plants that use steam conversion. the steam delivered to the turbines must be ‘dry’ (superhrated) so as not to degrade the turbines and their efficiency. Between a high pressure turbine and a low pressure turbine the steam passes through a moisture separator and u reheater. The hot water extracted from the steam by the moisture separator is generally used to heat the feedwater for the primary heat transfer from the’boiler.
’ What we mean by an idcal system is one that obeys the tirst and second laws of thermodynamics and that undergoes only reversible changes. In addition 10 excluding obvious irreversible losses like friction. for changes to be reversible they must be driven by wnishingly small differences and occur over an mtinite tlmc.

Even in an ideal system. entropy is generated by the creation of thermal energy in the high-temperature reservoir; every other step in an ideal cycle is reversible. That heat is transferred to the working fluid at a constant temperature. increasing the entropy of the fluid by Q,/ TH. The fluid then undergoes an isentropic expansion that yields work, W,. The Kelvin-Planck statement of the second law of thermo- dynamics is that no cycle can produce net work with only a single thermal reservoir. This is the same as saying that no system can convert heat to work with 100% efficiency. Thus the working fluid must reject heat (at constant temperature) before being isentropically compressed (by the pump exerting work, W,, on the fluid) and beginning the cycle again. The rejection of heat from the working fluid is the opposite of heat transfer to the fluid and entails a decrease in entropy of the fluid by Qo,/TL. In this cycle entropy does not accumulate in the fluid and the expansion and compression steps are isentropic, therefore Qo/T, = f&T,, = ci.S. This idea1 cycle is called the Carnot cycle and the Carnot efficiency. qc, is given by the equation below.
Q, = THdS. so rl, F= v ,I
Q. = T,dS, so qc = 9 = 1-g (5) H H
In real systems the heat exchangers do not function isothermally, the fluid experiences friction, and the expansion and compression are not truly isentropic or even adiabatic. Nonetheless, the conclusion that lowering the temperature of the heat sink increases the efficiency holds true for real systems as well.
The heat deposited in the low-temperature reservoir, Qo, is of lower quality than the heat deposited in the working fluid. Qt. by the high-temperature reservoir. The quality is a measure of the capacity of the system to use the heat to perform useful work. If we compare equal quantities of energy in the two reservoirs we find the difference is quality or concentration, as measured by temperature, and hence the capacity of the energy to be used for work.
TH QI HX C wo >
*
WP ”
Y Pump
I Qo

product of the efficiency and the thermodynamic effectiveness) between 3 and 4, corresponding to an efficiency of around 20-X% in temperate areas.
Looking back now at the earlier example comparing electric heaters to coal heaters, we note that electricity is not a source of energy, but a form of energy. To compare the efficiency of heat sources we should look at the whole system. We now compare the heat provided by I t of coal to the heat provided by an electric heater with electricity produced by I t of coal. The approximate energy equivalent of I t of coal is 2.93 x 10”’ J. A heater that burns coal and yields its heat directly to a compartment might operate with an efficiency of 80%. yielding 3.34 x IO”’ J to the compartment. A coal-fired power plant extracts nearly all of the energy content of the coal, say 95%. and converts that heat at an efficiency of 40% to electricity. Transmission and distribution losses might cut out 5% (in 1993 the average electrical transmission efficiency in California was 95.5% [S]) and the heater itself operates at an efficiency of lOO’%.
(2.93 x 10”) J) x (95%) x (40%) x (9%) x (100%) = 1.06 x IO”’ J
The inefficiencies of conversion make direct heating more efficient. We may still choose the electric heater if the coal-fired power plant is cleaner, or reduces exposures to air pollution. But it is only with the heat pump that electricity competes with respect to efficiency (3 x 1.06 x IO”’ = 3.18 x IO”’ J). and then only for a limited range of reservoir temperatures.
A heat pump displays many of the same characteristics as a material refinement system: as the difference between the quality of the two reservoirs increases, the work required to increase the difference increases. A distinction between refinement of energy and refinement of materials is that the work itself is energy and ultimately adds to the heat rejected into the high temperature reservoir. In material systems the work also manifests as heat and results in a higher temperature product.
400 600
Low Temperature (K)

M.D. Lowm~htrl. W.E. Kusrmherg Rr.wurces. Conserctrrion unti Recycling -34 (1998) 51-63 63
[5] Graedel TE. Allenby BR. Industrial Ecology. Englewood Cliffs. NJ: Prentice-Hall. 1995. [6] Connelly L, Koshland CP. Two aspects of consumption: using an exergy-based measure of
degradation to advance the theory and implementation of industrial ecology. Resour Conserv Recycl 1997:19:199-217.
[7] Ayers RU. Industrial metabolism: theory and policy. In: Allenby BR. Richards DJ. editors. The Greening of Industrial Ecosystems. Washington. DC: National Academy of Engineering. 1994:23- 27.
[S] California Energy Commission. California Historical Energy Statistics. December 1995. Sacra- mento. CA. Publication Number: P300-95-020.

ANS 13th Topical Meeting on the Technology of Fusion Energy, June 7-10, 1998, Nashville, TN.
A BATCH EXTRACTION METHOD FOR PULSED MULTI-FLUX ACTIVATION CALCULATIONS
Jose M. Balmisa Micah D. Lowenthal Ehud Greenspan Javier Sanz Nathan Stone Instituto de Fusion U.C. Berkeley U.C. Berkeley Instituto de Fusion U.C. Berkeley Nuclear/E.T.S.Ing. Dept. of Nuclear Eng. Dept. of Nuclear Eng. Nuclear/E.T.S.Ing. Dept. of Nuclear Eng. Industriales, UNED Etcheverry Hall MC1730 Etcheverry Hall MC1730 Industriales, UNED Etcheverry Hall Madrid, Spain 28006 Berkeley, CA 94720 Berkeley, CA 94720 Madrid, Spain 28006 Berkeley, CA 94720 34-l-3363108 (5 10) 642- 1480 (5 10) 643-9983 34-l-3363 108 (5 10) 643-9273 [email protected] [email protected] [email protected] [email protected] [email protected]
ABSTRACT
A new practical method has been developed for calculating neutron-activation inventories of target material in inertial fusion energy (IFE) reactors such as HYLIFE-II. It accounts for irradiation both in the target and in the internal blanket and for material circulation in and out of the primary loop. The continuous removal of target material in the real system is approximated by a batch extraction (BE). A single target is followed through its lifetime in the reactor using “transition matrices” for activation and decay which are generated by the ACAB code package. The inventory of all the isotopes of interest accumulating in the reactor is obtained by superimposing the contribution of single targets. The new BE model simulates, within minutes, the evolution of more than 150 isotopes over the 30-year reactor lifetime, explicitly accounting for the millions of neutron pulses experienced by a single target and summing the inventories of all the targets.
I. INTRODUCTION
The activation process of target constituents [such as the high Z (Hi-Z) material] in certain Inertial Fusion Energy (IFE) reactor concepts is quite complicated. An example is the HYLIFE-II reactor design’ in which the activated target material is subjected to - 20 second and - 7 day decay periods between irradiations. When in the target, the Hi-Z material is activated by a relatively high- amplitude flux of neutrons emanating from the imploding D-T capsule. Following the implosion, the Hi-Z material is mixed within the Flibe (molten fluorides of Li and Be) coolant/breeder (an internal blanket; between the target and the reactor chamber). The Hi-Z material circulates with the Flibe through the primary coolant (and Flibe on-
line processing loop) before it returns back to the reactor chamber, where it is exposed to neutron irradiation from another target implosion. This in-Flibe irradiation is done by a relatively low-amplitude flux of a different spectrum than the in-target irradiation. The Hi-Z material in the Flibe decays as it circulates with the coolant outside of the reactor chamber (a typical circulation time is 20 s) before being exposed to another activation pulse. Hi-Z material is continuously extracted from the Flibe, stored for a few days for cooling and transferred to the target fabrication plant. A few days later the Hi-Z material returns to the reactor chamber as a new target, and the cycle repeats itself.
Previous modeling of the target Hi-Z activation in HYLIFE-II* separated activation of target material in the target from activation of target material deposited in the Flibe. Moreover, the previous modeling* lumped many pulses (typically one week worth of pulses) of hohlraum activation into one macropulse and approximated activation in the Flibe as a continuous irradiation.
A companion pape? reports on a new model (called PACEM) that has been developed to accurately simulate the evolution of the Hi-Z nuclide inventories in HYLIFE- II-like reactors. It is based on a “control volume” approach and accurately accounts for the activation by each target implosion and for the decay of the Hi-Z material while circulating with the Flibe and while recycling from the Flibe back into the reactor as a constituent of a new target. The extraction of the Hi-Z material from the Flibe and make-up of losses are modeled as well. The PACEM model follows the time evolution of the nuclide inventory in selected point in the system.

m57 = ~32*~[6*~8*&&, (4)
Thus the number of low-flux matrix multiplication operations required for a macrocycle with n = 57 microcycles is reduced to 5+4-t3+1 = 13. The benefits are more dramatic for larger numbers (e.g., n = 5732 requires 12+10+9+6+5+2 = 44 matrix multiplications). Once the macrocycle matrix, a, has been constructed, the same procedure is used to create the matrix representing the full irradiation history over the lifetime of the plant.
C. Formulation - Superposition
With the irradiation history for the first target complete, we calculate the composition of the entire inventory of Hi-Z material in the reactor system from all targets. Fig. 1 illustrates the superposition scheme. The upper line represents the irradiation and decay history of the first target over the reactor life. The end of life (EOL) composition of this target is calculated using the procedure described in Sec. 1I.C. The irradiation history of the second target is identical to that of the first target, except that it is shifted l/fin the time scale, where f is the shot frequency. The second target history starts 2/‘Hz) seconds after that of the first target. The last target made of unactivated material is introduced into the reactor l/flHz) seconds before the end of the first macrocycle. Subsequent targets are made of recycled Hi-Z material- material from the first target in the first macrocycle is used
in the first target in the second macrocycle and in every macrocycle thereafter (see Fig. 1).
Assuming that the reactor lifetime is an integer number of macrocycles long, the irradiation history of each target differs from the others only in the last macrocycle and the starting time. Thus to calculate the composition of any particular target, we can take the inventory of the first target at the end of the macrocycle before the last macrocycle and adjust it only for the difference in the last macrocycle. The sum of all of these targets is the full inventory of Hi-Z material at the reactor’s EOL.
To reduce the computational demands of this approach we take one target as representative of the composition of the composition of its neighbors and weight that target’s contribution to the sum according to the number of targets it represents. For example, in most of the calculations we group 10 minutes worth of targets together (10 minutes at 6.39 Hz is 3834 targets). We investigated the gain in precision from using a 1 minute grouping.
Calculation of the total inventory of targets is broken into two sums of series. The first is the set of targets that still reside in the Flibe at EOL. Their sum, the vector Zi, is Equation 5, where n is the number of microcycles in a macrocycle, ml is the multiplier used for grouping targets that experience different numbers of microcycles, f is the frequency of shots, and nmacro is the number of macrocycles.
nlm,
target Ai.-
first 1 l . . . . . i . .
last
I 1 vie 1 ; low-flux pulses hu!
cooling period
II ,, l4 I I 1 +i&ocycle residence time
II II luullll, . . . . . . . .
I t=O
>
Figure 1. Illustration of the irradiation histories for different targets. They differ only in the last macrocycle and in the time at which they begin.

Table I. Ratios of Nuclide Inventories Produced Without High-Flux Pulses to Those Produced with High-Flux Pulses for Different in-Flibe Residence Times.
VII. SUMMARY
The new “batch extraction” model developed can simulate the evolution of hundreds of isotopes throughout the life of IFE reactors within a fraction of an hour of computer time. It makes realistic approximations of multi- flux activation, decay, and recycling of target material in IFE reactors practical. The method has been tested for simple cases against the activation code ACAB and found to be reliable and much faster. The importance of including both the high-flux experienced by the material as a target and the low-flux experienced by the material as a contaminant in the coolant/breeder has been demonstrated.
Additional study is needed to better assess the improvements the BE model can make in the accuracy of prediction of activation product inventories relative to simpler models.
ACKNOWLEDGMENTS
This work was funded by Lawrence Livermore National Laboratory (Memorandum Number B29 18 17) and Lawrence Berkeley National Laboratory (Memorandum Number LBL-7544500). Help given by Dr. Jeff Latkowski and Dr. Ralph Moir of LLNL is highly appreciated.
REFERENCES
1.
2.
3.
4.
5.
R.W. Moir, et al., “HYLIFE-11: A Molten Salt Inertial Fusion Energy Power Plant Design-Final Report,” Fusion Technology, 25,5-25 (1994).
H.Y. Khater, et al. “Environmental and Safety Aspects of “Osiris”: A Heavy Ion Beam Driven IFE Reactor,” Fusion Technology, 21,2138-44 (1992).
M.J.L. de Hoon, et al., “A Model for Pulsed Activation Accounting for Circulation, Extraction and Makeup,” These Proceedings.
J.Sanz, J.M.Balmisa, “ACAB, Activation Code for Fusion Applications: User’s Manual V3.0”. Institute de Fusion Nuclear, DENIM-464, Madrid, April 1998.
M.D. Lowenthal, et al. “Industrial Ecology For Inertial Fusion Energy: Selection Of High-Z Material For HYLIFE-II Targets” These Proceedings.
ANS 13’h Topical Meeting on the Technology of Fusion Energy, June 7- 10, 1998, Nashville, TN.
INDUSTRIAL ECOLOGY FOR INERTIAL FUSION ENERGY:
SELECTION OF HIGH-Z MATERIAL FOR HYLIFE-II TARGETS
Micah D. Lowenthal Ehud Greenspan Ralph Moir William E. Kastenberg T. Kenneth Fowler U.C. Berkeley U.C. Berkeley Lawrence Livermore U.C. Berkeley U.C. Berkeley Dept. of Nuclear Eng. Dept. of Nuclear Eng. National Laboratory Dept. of Nuclear Eng. Dept. of Nuclear Eng. Etcheverry Hall 1730 Etcheven-y Hall 1730 L-637, PO Box 808 Etcheverry Hall 1730 Etcheverry Hall 1730 Berkeley, CA 94720 Berkeley, CA 94720 Livermore, CA 9455 I Berkeley, CA 94720 Berkeley, CA 94720 (5 10) 642-1480 (5 10) 643-9983 (945) 422-9808 [email protected] [email protected] [email protected]
ABSTRACT
The methods of industrial ecology have been applied to the selection of a high-Z material for indirect-drive targets in the HYLIFE-II reactor. We quantify physical, chemical, and radiological impacts, rate the social-welfare impacts, and identify trends in the economic dimensions of the material selection. Early accident dose, the waste disposal rating, life-cycle volume, gamma dose rate, and resource availability are all considered. Four high-Z materials are considered: Ta, W, Hg, and Pb. A new activation module has been developed to accurately account for the complex activation scenarios of target materials. We explore a range of recycling scenarios and the results of these activation calculations are translated into the indices mentioned above. The recycling scenario can be modified to reduce accident hazards, disposal hazards, maintenance hazards, or fiscal expenditures, but different hazards or costs suggest different recycling scenarios are preferable. The IE methodology and examples of results are presented and areas for further study are identified.
I. INTRODUCTION
The work presented here is a product of the Industrial Ecology for Inertial Fusion Energy project’. Industrial ecology (IE), as used here, comprises life-cycle assessment of the environmental, social-welfare, long- term and short-term safety impacts as well as economic features of an activity (see e.g., References 2 & 3). The objectives are to gain insight into features of inertial fusion energy (IFE) reactors that underly their relative desirability (or undesirability) and to apply the insights in shaping reactor design, operation, and materials selection.
(5 10) 643-0574 (5 10) 642-707 1 [email protected]
We take an IE approach in examining the reactor system as a whole and in assessing the high-Z material options for indirect-drive targets. This paper describes the materials- selection effort for the hohlraums used in the HYLIFE-II reacto9.
In our analysis we quantify physical, chemical, and radiological impacts, rate the social-welfare impacts, and identify trends in the economic dimensions of the material selection. The results presented here are illustrative rather than exhaustive. Although we do discuss features such as resource consumption and regulation of waste disposal, we ‘go into the greatest depth in our discussion of the radiological features of the materials. Early accident doses, the waste disposal rating, life-cycle volume, and exposure rates are all considered. By examining these factors before, during, and after the material utilization in the reactor, we compare the different candidate materials and operating scenarios. A framework developed by the California Comparative Risk Project was used for the social-welfare assessment, but was found to be more useful for assessment of the entire reactor or the industry rather than individual reactor components.
II. THE REACTOR SYSTEM
HYLIFE-II uses a circulating stock of lithium flouride and beryllium flouride molten salts (Flibe) as an internal blanket The target material is dispersed within the Flibe after implosion where it resides until it is extracted by separations equipment in the Flibe circulation loop. After separation the high-Z target material is allowed to cool and is fabricated into new targets. The high-Z material from an imploded target typically remains in the Flibe for a substantial number of trips through the circuit, including through the target chamber. During these passes

hazards or costs suggest different recycling scenarios are preferable.
V. IMPACTS OF HIGH-Z MATERIAL SELECTION
A. Impacts of Unirradiated Material
Industrial ecology analyses trace materials from the point of generation to the point of reuse, recycle, or disposal, assessing the impacts of every stage of the life cycle. We focus our study of material options primarily on assessing the impacts of the induced radioactivity in the material because these effects are expected to outweigh the impacts of provision and handling of the fresh materials.
I. Resource Consumption
We expect that the plant will need on the order of 1 tonne (1Mg) of high-Z material for a week of operation (in round numbers, 6 Hz x 86,400 s x 7 x 0.3 g). The calculations by Latkowski’ assume that a one-week inventory of material is recycled and reused for the lifetime of the reactor (recycling losses are ignored). We take this as a reference rate of recycling. Alternatively, one might use new material for each hohlraum. From these extremes we can get a sense of the scale of the hohlraum material demands for scenarios including those in which material is irradiated, on average, tens to hundreds of times.
To assess the impacts and the implications of the provision of these feed streams for the reactor technology we should consider a generation of reactors, rather than an individual reactor. Thus if 40 reactors were in operation with 30 year operating lifetimes, the demand for new material under the reference scenario wouid be -40 Mg (ignoring the 80% capacity factor) in the first week and no new high-Z material thereafter. Using new material for each hohlraum and assuming a 80% capacity factor, the demand for new material would be -1,664 Mg per year of operation, or -50,000 Mg over the reactors’ lifetimes. This range of material demands, three orders of magnitude, is rather broad. To get a feel for the scale of this demand, the world stocks and flows of the raw candidate metals are discussed below”.
Tantalum is by far the most scarce of the materials considered in this study and the United States has no known natural reserves of the metal. In 1992 the world produced 320 tonnes (measured in metal content) of new Ta. World reserves of Ta are thought to exceed 25,000 tonnes. Tungsten is less rare. The world’s reserves of W are estimated at -2.3 million tonnes and the world’s primary production in 1992 was -28 thousand tonnes.
Mercury is the only metal that is a liquid at room temperature and, unlike other metals, reserves are measured in 76 lb. flasks. While world natural reserves of Hg are substantial (-130,000 tonnes or -3.7 million flasks) industries are increasingly shifting to recovery from manufactured products over primary production due to stringent environmental regulations governing releases and disposal of Hg. Lead is both plentiful, with world reserves estimated at 63 million tonnes, and cheap. Like Hg, Pb is. subject to environmental regulation and recycling accounts for the majority of the world trade. The world consumes around five million tonnes of Pb and around 54% of that is recovered production rather than primary production.
Of the four candidates here considered, the material demand from single-irradiation operation in 40 reactors would exceed known resources for Ta and would constitute a major fraction of the world production for Hg and a lesser fraction for W. Even the single-irradiation scenario would not result in a noticeable change in the world consumption of Pb. If the reactor were to irradiate the hohlraum material ten times, on average, one might still be concerned about Ta resources, but not about those of any of the other candidates. And if the average were to approach one hundred irradiations, the quantity would not be a concern, but simply a significant consumption rate of Ta.
2. Costs and Purity
Material purity is an important factor in safety and environmental considerations for fusion reactors and the market prices of these materials depend strongly on the purity as well *. The simplicity of refining Hg to high purity makes it unlikely that the radiological features of Hg the accident doses would rise as a result of consideration of impurities. In Pb, W, and Ta, however, impurities would likely be considerable (high-purity Pb is more available than high-purity W and Ta) for materials acquired at any reasonable cost. We intend to explore these tradeoffs in future work.
3. Mining and Smelting Impacts
There are environmental impacts from any mining and smelting including the marginal impact from producing one more tonne of metal. For this section of the paper, we use lead as a specific case to give an example of the kinds of considerations that go into a material- selection study. (Except where noted otherwise, this information taken from References I I and 12).
Lead can be acquired as raw material in the form of galena (PbS) or as a trace metal in other ores (particularly zinc) from mines, or as recycled material as from lead- acid batteries or from cable sheathing. Mines tend to

rate in the Ta cases: 180mTa and 18’Ta. By the end of the cooling period (I week, in this example) the “‘“Ta has decayed away but the “?a persists. Figure 2 shows the dose rate during the cooling period for the same plant.
s 900
3 800 e ;; 700
2 600 2 00 .g
500
E 400 2 E 300
'", 200 Y 5 100 P z 0
+Ta-180m
1 .OE+O5 1 .OE+O6 l.OE-1-07 1 .OE+O8 1 .OE+O9
Reactor Operating Time (s)
Figure 1. Gamma dose rate at lm from a single Ta target upon extraction from the Flibe over the operating life of the plant. (Flibe processing rate = 10 liters/s)
2 .$ l.OE+O2
--)-Ta-18Om
E 8 2 \
\ I u 2 8 l.OE+Ol - I a 1 .OE+OO 1 .OE+O2 1 .OE+O4 1 .OE+O6
Time after extraction from Fiibe (s)
Figure 2. Gamma dose rate at lm from a single Ta target at different times after extraction from the Flibe at the end of the plant lifetime. (Flibe processing rate = 10 liters/s)
Our exploration of recycling scenarios reveals an interesting feature of these high-i! materials in IFE reactors that recycle. Because higher processing rates result in shorter residence times in the Flibe (and therefore fewer irradiations of the high-Z material as a contaminant in the Flibe), one would expect that the dose rates would be inversely related to processing rates. Figure 3 shows the peak single-target dose rate at lm at extraction from the Flibe as a function processing rate for different
cooling times. Note that all of the cases except that with a l-day cooling time have a positive slope in over part or all of the range of processing rates, indicating that increasing the processing rate increases the dose rate. Recycling scenarios with long cooling times produce less 18*Ta, making ‘*o”‘T a t e h d ominant contributor to the dose at processing rates of 100 l/s and higher. lgomTa is produced predominately by the high-flux irradiation and has a half- life of 8.15 hours. Because the low-flux pulses have little impact on the inventory, the longer residence time in the Flibe in the 10 l/s cask allows greater decay before discharge. The longer-lived l8?a (tln=l 14 days) is generated in both flux spectra and does not have net losses during the residence time.
1400
1200
t F 1000 z 2? M .; 800
w - tcool=ld
-b- tcool=lw
\. I_ -Cl-- tcool=lm
10 100
Processing Rate (liters/s)
1000
Figure 3. Peak gamma dose rate at lm from a single Ta target upon extraction from the Flibe as a function of processing rate for different cooling times (before refabrication).
A similar effect is observed in W (see Figure 4). For a l-day cooling time the peak single-target dose rate is nearly 2OOmrad/h higher in the case with 1000 l/s processing over the 10 l/s processing case. This effect is due almost entirely to the difference in inventory of ‘@Re. This bad actor is produced through an activation and decay chain that includes decay of “‘W (75 days). Unlike the Ta case, the longer residence in the Flibe does not favor the decay chain. The cross section for destruction of ‘*‘W by (n,y) reaction is orders of magnitude higher in the thermal and epithermal range than in the high-energy range. The dominant production reaction is a high-energy threshold (n,2n*) reaction in I’%‘. Thus the extended exposure of “‘W to the low-flux irradiation in the Flibe in the 10 l/s case bums up the ‘*‘W, leaving other isotopes with more favorable production-to-destruction ratios (such as ‘*‘W) as the major contributors.

low-flux pulses (in cases with processing rates from 10 I/S to 1000 l/s, respectively). The average cross section for the (n,y) reaction in *‘*Hg (weighted according to the low- flux spectrum) is substantially lower than the average cross section for the (n,2n) reaction in 2wHg. While the fluence experienced by any individual target is different, the total high-flux fluence (summed over all targets) is the same in every case, thus the inventory of *03Hg is nearly the same.
0.14 IIll
0.12
VI z 0.1 2 i; 0.08 3 ?i 0.06 2 $ 0.04
-w- tcool=lw
-A-- t.cool=lm
w 0.02 - ‘t
01 IO 100
Processing Rate (liters/s)
1000
Figure 6. Early accident dose for Ta as a function of processing rate for different cooling times (before refabrication).
The early dose results for Pb and W are somewhat anomalous (Figure 7 shows W). The doses match for all cooling times and processing rates except for the series associated with l-day cooling times. In these the results diverge. For W with l-day cooling, the “‘W effects noted in Section V.B.l are responsible for the divergence and result in an inverted relationship between residence time in the Flibe and accident consequences for W targets. Thus if we are concerned about accidents and maintenance-dose rates then for W we should choose longer residence times (lower processing rates). For Pb with l-day cooling, the largest contributors to the dose are *03Pb and *o?l. The differences between the cases are due primarily to difference in *03Pb. We do not yet have an explanation for this phenomenon.
Volatility makes a candidate material simultaneously attractive from the perspective of separation and processing, and unattractive from the perspective of human exposure from routine operations, accidents, and waste. Because ease, of separation affects the recycling scenario and the resulting inventory, safety and processing rate are not simply separable. Separating volatile materials is relatively simple and inexpensive so additional
processing to purify or partition these materials may be a cost-effective way to reduce vulnerable inventories. In Table 2 we give the lowest value of the accident dose achieved in our parametric study for each material and the values of design variables associated with that scenario.
0.3
2 0.25 2 g 0.2
.+ 0.15 $ 2 0.1 d
0.05
0
/’ / l1lll
--e tcooI=ld 4 --a-- tcool=lw
+ tcool-lm
10 100 1000
Processing Rate (liters/s)
Figure 7. Early accident dose for W as a function of processing rate for different cooling times (before refabrication).
Table 2. Lowest early accident dose (Svj and associated
3. Waste-Disposal Hazards
We use the waste disposal rating (WDR, defined by Fetter14) as a measure of the radiological hazards of waste disposal. The WDR is the sum of the ratios of the specific activity each radionuclide to the limit calculated by Fetter, et al.” Thii index is based on the intruder dose 100-500 years after reactor shutdown, so only medium- to long- lived radionuclides affect the results. These radionuclides do not decay appreciably during the operation of the reactor, so any differences between cases we observe are due to two factors: different fluences from the different flux spectra and differences in concentration due to differences in the total mass of high-2 material.
In the W scenarios (see Figure 8) we see that two orders of magnitude variation in processing rate has little impact (at most a factor of 3). The cooling time (which, as noted earlier, affects the total mass and therefore the concentration of activity) has a dramatic impact: a factor

radionuclides produced by activation of high-Z materials in HYLIFE-II are neither significant fission products nor major activation products in steel, the list of limits does not include any of them (except ‘H, which we will ignore because ‘H will be removed and the high-Z material is a small source relative to the Li in the Flibe). Thus . restrictions on near-surface burial of these wastes would arise either from practical considerations such as heat generation or exposure rates or from site-specific limits calculated to prevent exceedance of dose limits.
The Department of Energy operates LLW disposal sites for disposal of government LLW and uses site- specific assessments to establish its SALs. It is still the case that DOE has established limits for very few of the high-Z activation products, but we have nonetheless compared our inventories to the waste acceptance criteria at the Hanford and Nevada Test Site (NTS) disposal facilities. The only material that does not qualify for near surface burial at NTS is the worst Pb case which exceeds the limit for *“Bi by a factor exceeding 5. All of the materials qualify for disposal at Hanford. As with NRC regulation, this is more an indication that the radionuclides relevant for activation of high-Z material in HYLIFE-II have not been a significant part of the DOE waste streams. One would expect that calculations leading to limits for these radionuclides would be performed if IFE were to start generating radioactive waste.
The regulatory picture is actually somewhat more complicated than the above discussion describes. Both Pb and Hg are hazardous wastes because they “exhibit the characteristic of toxicity” if they are found in high enough concentrations. The Environmental Protection Agency regulates hazardous wastes under the Resource Conservation and Recovery Act (RCRA). Wastes that are both radioactive and hazardous are called mixed wastes and are regulated by both the EPA and the NRC or DOE. EPA has actually assigned waste codes to radioactive Pb and Hg (40 CFR 268.40). “Radioactive Lead Solids” is a subcategory of waste code DO08 (Lead) and must be macroencapsulated (in plastic or in a jacket of inorganic compounds) before disposal in a hazardous waste facility is permitted. “Elemental mercury contaminated with radioactive materials” is a subcategory of waste code DO09 (Mercury) and requires amalgamation prior to disposal in a hazardous waste facility. Thus in the case of both Hg and Pb, the high-Z material would require some treatment and/or conditioning prior to disposal and that the disposal site would need to be licensed for disposal of hazardous waste as well as for disposal of radioactive waste.
VII. SELECTION CRITERIA
Another portion of our project focuses on selection criteria, valuation of impacts, and decision making. The methodology is both too lengthy and not ready for publication. As an example of what the results might look like, in Table 4 we present a summary table of a possible optimization (with unstated valuation and only for the ranges considered) over only the radiological features for each material with a self-consistent recycling scenario. In a full industrial ecology analysis this would be one of multiple summary matrices with the others representing the non-radiological features of each material. One fairly clear conclusion that comes out of these preliminary results is that for these materials and these impacts, cooling times should be 1 month or longer.
Table 4. Summary of “best” self-consistent cases. Ta W Hg Pb
Processing rate 100 I/s 100 l/s 10 I/s 10 I/s
VII. CONCLUDING REMARKS
We have presented some of the work from the Industrial Ecology for Inertial Fusion Energy project. We have illustrated our approach in analyzing the features of candidate high-Z materials for hohlraum material in IFE reactors that recycle. We find that materials exhibit different and sometimes counterintuitive responses to changes in recycling parameters such as the separation processing rate and the cooling time before reinjection.
In future work we plan to conduct tradeoff studies: tradeoffs between monetary costs and various radiological features as a function volatility in one study and as a function of purity of the feed material in another.
ACKNOWLEDGMENTS
The authors gratefully acknowledge the assistance of graduate students Jose M. Balmisa, Michiel J.L. de Hoon, Stephanie Neilson, and Nathan Stone who all contributed to this project. This work was funded by Lawrence Livermore National Laboratory (Memorandum Number B29 18 17) and. Lawrence Berkeley National Laboratory (Memorandum Number LBL-7544500).

ANS 13th Topical Meeting on the Technology of Fusion Energy, June 7-10, 1998, Nashville, TN.
A MODEL FOR PULSED ACTIVATION ACCOUNTING FOR CIRCULATION, EXTRACTION, AND MAKEUP
Michiel J. L. de Hoon” Ehud Greenspan Micah D. Lowenthal University of California, Berkeley Department of Nuclear Eng. 4 126 Etcheverry Hall Berkeley, California 94720 (510)4865157 [email protected]
University of California, Berkeley Department of Nuclear Eng. 4107 Etcheverry Hall Berkeley, California 94720 (5 10) 6439983 [email protected]
University of California, Berkeley Department of Nuclear Eng. 4 I6 1 Etcheveny Hall Berkeley, California 94720 (510) 6421480 [email protected]
ABSTRACT
A model has been developed to accurately calculate the nuclide inventories of the target constituents of Inertial Fusion Energy (IFE) reactors such as HYLIFE-II. It can explicitly account for (1) the combined effects of activation during target implosion (by a high-amplitude flux) and while passing through the reactor chamber (by a low-amplitude flux); (2) decay during. circulation in the primary coolant loop, after extraction from the coolant loop, and before re-insertion into the reactor chamber as a new target; (3) continuous extraction and feed-m of target material; and (4) replacement of part of the activation products by makeup materials. The solution strategy uses transition factors - the ratio of the amount of created nuclides to the initial amount - for each system component.
I. INTRODUCTION
The change in the isotopic composition of the target constituents in certain IFE reactors, such as the HYLIFE-II reactor’ considered in this work, is a result of a complex process. Consider, for example, the activation of the target hohlraum high-Z material.” Figure 1 shows the high-Z material circulation in the HYLIFE-II reactor. After being exposed to a high-amplitude flux during the target implosion, the high-Z material is deposited in the Flibe (molten fluorides of Li and Be) coolant/breeder volume which surrounds the target. The high-Z material then circulates with the Flibe many times through the primary
cooling system. Each time it reaches the reactor cavity at the center of which is the next target to be imploded, it is irradiated with a flux of a lower amplitude and a softer spectrum. The radionuclides decay in between their passes through the reactor chamber (approximately every 20 seconds in HYLIFE-II). High-Z material is continuously extracted from the Flibe and circulates through a storage for radioactive cooling, the target fabrication plant and target storage before it is re-introduced, in a new target, into the reactor chamber. Some of the activation and decay products of the high-Z material may be removed and an appropriate amount of unit-radiated high-Z material can be added to make up for the losses.
Approximate activation models have been used in previous studies of hohlraum high-Z material activation.J*5 Common approximations include: (1) Separating the activation in the target and in the Flibe; (2) Continuous irradiation in the Flibe using a reduced flux amplitude to account for the presence of out-of-chamber inventory of high-Z material; (3) Ignoring extraction of high-Z material from the Flibe and its circulation through the target fabrication plant or, alternatively, assuming a batch rather than continuous extraction. The purpose of the present work was to develop a model which is capable of accurate simulation of multi-flux pulsed activation accounting for circulation, gxtraction and makeup of target constituents (PACEM). This model can be used as a reference against which various approximations, such as in Ref. 6, can be tested.
a Currently at Lawrence Berkeley National Laboratory, Fusion Energy Research Program, 1 Cyclotron Road. Mailstop 47- I 12, Berkeley, California 94720.

311, before pulse Reactor Chamber
&ller extraction 21 before extraction
l2 Plant + n
z recovered 1 Heat Recovered Exchanger hohlraum .material
radioactive cooling
I”” New material with abundance2
II. THE “PACEM” MODEL A. Decay in Transport Lines and in Storage Facilities
The exact activation model developed in this work simulates the process shown in Fig. 1. It should be noted that Fig. 1 is not an exact representation of the presently conceived HYLIFE-II design. Whereas Fig. 1 depicts a single Flibe circulation loop, the present HYLIFE-II design has two loops. However, assuming only one loop makes the analysis of the validity of the various activation models more transparent. The model presented here can easily be extended to simulate more complicated scenarios.
A generic model for the time evolution of high-Z nuclide inventory can be set up by analyzing the input and output of high-Z nuclides for each element in the system. We start by calculating the time-dependent nuclide inventory inside the reactor chamber. The inventories at any other location of interest in the system can be easily inferred From the in-chamber inventory.
Waste
Figure 1. Flow cycle of high-Z material in an IFE power plant.
The total inventory of nuclide i inside the reactor chamber is denoted by Xi. In order to simplify the notation and derivation, we shall use the vector & to denote the inventory of all the IV nuclides pertaining to the chain of interest. The rate of flow of nuclides out of a storage tank,
$o,t ) can be related to the incoming flow rate, %. --In , as:
%out(d = exp(- A,+)Zin p (1)
where r is the delay time and 4 is the decay matrix:
I -/I ;1 .*- --/IN 2 I. q 1” :2 . . :-
(2) . .

exists inside the hohlraum. In matrix form, the above equation can be written as
-&$) = g$h&h’
in which the cross section matrix is defined as
(14)
c -01 ~24 ... a,+,\ c,+z -a2 ... =N+2
g=
i 1
(1% -. . .
~I-4 :J g2-.N ..’ -cN
The nuciide inventory at the end of the pulse is given by
Xp(t)f =nmb)+Tirecycled(t)’ (20)
in which the le%hand-side is multiplied by the pulsing frequency f to find the flow rate of hohlraum high-Z nuclides. The sum of all high-Z nuclides available at the target fabrication plant should equal the total fixed number H of high-Z nuclides that are needed for one hohlraum, multiplied by the number of targets to be made. This requirement defines the make-up rate, i.e., the rate of feed-in of high-Z material to the system:
sh, after pulse = exp(flh)zh, before pulse ’ (16)
&,(d = rlHf-ri(l,l,...‘l)~recyc,ed(t)’ (21) - -
in which 12 is the vector that describes the natural abundance of the high-Z material being fed for hohlraum fabrication. In this equation, we multiplied the column vector jc -recycled(t) by the row vector (l,l,... ,1) to find the total number of recycled nuclides.
in which Y’, is the hohlraum neutron fluence in one shot. The hohlraum inventory after a shot, x,,~~,,~,~~, will end up in the Flibe.
E. Closing the Loop
The rate of change of nuclide Xi in the Flibe due to activation in the reactor chamber is given by
The next step is to combine the various elements in the system. First we close the Flibe loop. From equations (4), (5), (8) and (1 I), we get
$z(t) = cy& (17)
in which the subscript c refers to averaging over the neutron spectrum in the reactor chamber Flibe. The nuclide inventory after the pulse is then given by
her pulsect) = exp( flC)&efore pulse(t) (“)
in which Y’, is the neutron fluence in the reactor chamber Flibe in one shot.
si” (t) = exp( - /Ir*)(! - E)exp( - &,)goUt (t - r) (22)
for the flow of nuclides into the reactor chamber. In this equation, 1 denotes the identity matrix of order N. Multiplying both sides of this equation by the time Ilf between two shots yields the change in the nuclide inventory in the reactor-chamber Flibe volume between two shots:
~beforepudt) = exp(-&4(!-!4ex&3~) (23)
--after pulsect - r, X
Combining activation in the hohhaum and in the Similarly we can combine equations (6), (7) (1 l), (12), Flibe (equations (16) and (18)) yields the high-Z nuclide (16), and (18) to find the hohlraum high-Z nuclide inventory after a shot: inventory:
--after pulse(t) = exp(fih)zh, before pulse(t) X c19l
*‘P L 1 o’yC XbefoR pu,se( d
D. Target Fabrication Plant
xh, before pulse = ilH
+exp(-~rp)(!-~(l,l,....l))exp(-~s)
RK exp E- ( 1 - h = Xafter puisc( t - rp - rs - ~1)
(24)
The inventory at the target fabrication plant consists of recycled nuclides as well as makeup nuclides:

IV. SUMMARY
The PACEM model developed is capable of exact simulation of the variation, with time, of the inventory of target constituents in HYLIFE-II like IFE reactors accounting for (1) the combined effects of activation during target implosion - by a high-amplitude flux, and while passing through the reactor chamber - by a low- amplitude flux; (2) decay during circulation in the primary coolant loop, after extraction from the coolant loop, and before re-insertion into the reactor chamber as a new target; (3) continuous extraction and feed-in of target material; and (4) replacement of part of the activation products by makeup materials. It was found to be too time consuming for simultaneous simulation of many isotopes over 30 years time span. Nevertheless, it is expected to be a useful tool against which different approximations and models can be benchmarked.
ACKNOWLEDGMENTS
This work was funded by Lawrence Livermore National Laboratory (Memorandum Number B29 18 17) and Lawrence Berkeley National Laboratory (Memorandum Number LBL-7544500). We highly appreciate the help of Dr. Jeff Latkowski as well as Dr. Ralph Moir of LLNL.
REFERENCES
1. R. W. Moir et al., “HYLIFE-11: A Molten-Salt Inertial Fusion Energy Power Plant Design - Final Report,” Fusion Technology, 25, 5 (1994).
2. J. G. Woodworth and W. R. Meier, “Target Production for Inertial Fusion Energy,” Fusion Technology, 3 1,290 (1997).
3. M. D. Lowenthal et al., “Inertial Ecology for Inertial Fusion Energy: Selection of High-Z material for HYLIFE-II Targets,” These Proceedings.
4. H. Y. Khater, M. E. Sawan, I. N. Sviatlavsky, L. J. Wittenberg, and W. R. Meier, “Environmental and Safety Aspects of “Osiris”: A Heavy Ion Beam Driven IFE Reactor,” Fusion Technology, 21, (May 1992).
5. J. Latkowski and J. L. Vujic, “Inertial Fusion Energy: A Clearer View of the Environmental and Safety Aspects,” Fusion Technology, 33 (May 1998).
6. J. M. Balmisa et al., “A Batch Extraction Method for Pulsed Multi-flux Activation Calculations,” These Proceedings.
7. A. G. Croff, “ORIGEN-2, A Revised and Updated Version of the Oak Ridge Isotope Generation and Depletion Code,” ORNL-5621 (1980).
8. J. Sanz, J. M. Perlado, D. Guerra, A. S. Perez (Fusion Institute of Madrid); J. F. Latkowski, M. T. Tobin (Lawrence Livermore National Laboratory), ACAB: Activation Code for Fusion Applications: Users’ Manual V2.0 (September 1995).
9. B. Noble and J. W. Daniel, Applied Linear Algebra, 3rd edition (1988).
10. S. E. Spangler, J. E. Sisolak, and D. L. Henderson, “Calculational Models for the Treatment of Pulsed/Intermittent Activation within Fusion Energy Devices,” Fusion Engineering and Design, 22, (1993).
11. Paul P. H. Wilson and D. L. Henderson, “Qualitative Analysis of Physical Mathematical Approximations Necessary for Induced Radioactivity Calculations in Fusion Devices,” Fusion Engineering and Design, 36, (1997).
12. Hosny Attaya, “Radioactivity Computation of Steady State and Pulsed Fusion Reactor Operation,” Fusion Engineering and Design, 28, (1995).
13. J. E. Sisolak, S. E. Spangler, and D. L. Henderson, “Pulsed/Intermittent Activation in Fusion Energy Reactor Systems,” Fusion Technology, 21, (1992).
14. Q. Wang and D. L. Henderson, “Pulsed Activation Analyses of the ITER Blanket Design Options Considered in the Blanket Trade-off Study,” Fusion Engineering and Design, 28, (1995).
15. A. B. Pashchenko, H. Wienke, J. Kopecky, J-Ch Sublet and R. A. Forrest, FENDL/A-2.0 Neutron Activation Cross-Section Data Libraty for Fusion Applkations, IAEA-NDS-173, (March 1997). This is the source for the ACAB cross-section library.
16. R. A. Forrest, “FENDLfD-2.0 and testjng of FENDL/D-2.0,” presented at the IAEA Advisory Group Meeting on Extension and Improvement of the FENDL-2 library, Vienna, (March 1997). This is the source for the ACAB decay data library.
_