industry competitiveness analysis
TRANSCRIPT

7/28/2019 industry competitiveness analysis
http://slidepdf.com/reader/full/industry-competitiveness-analysis 1/49
Economics of Strategy
Fifth Edition
Slides by: Richard Ponarul, California State University, Chico
Copyright 2010 John Wiley Sons, Inc.
Chapter 2
Economies of Scale and Scope
Besanko, Dranove, Shanley and Schaefer

7/28/2019 industry competitiveness analysis
http://slidepdf.com/reader/full/industry-competitiveness-analysis 2/49
Economies of Scale
Can create cost advantages
Can determine market structure and entry
Can affect the internal organization of firms
Can determine the horizontal boundaries of firms

7/28/2019 industry competitiveness analysis
http://slidepdf.com/reader/full/industry-competitiveness-analysis 3/49
Economies of Scale
When the marginal cost is less than average cost,there are economies of scale
Average cost declines with output
If average cost increases with output we havediseconomies of scale
7/28/2019 industry competitiveness analysis
http://slidepdf.com/reader/full/industry-competitiveness-analysis 4/49
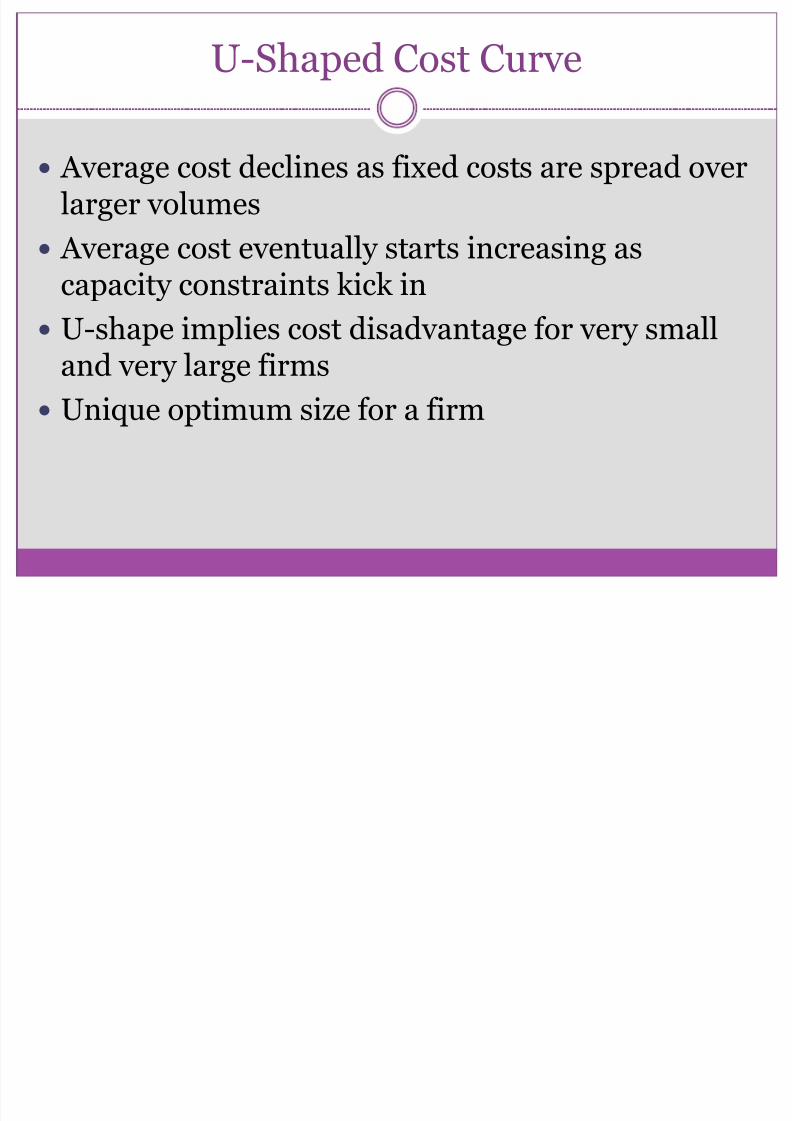
U-Shaped Cost Curve
Average cost declines as fixed costs are spread overlarger volumes
Average cost eventually starts increasing as
capacity constraints kick in
U-shape implies cost disadvantage for very smalland very large firms
Unique optimum size for a firm

7/28/2019 industry competitiveness analysis
http://slidepdf.com/reader/full/industry-competitiveness-analysis 5/49
U-Shaped Average Cost Curve

7/28/2019 industry competitiveness analysis
http://slidepdf.com/reader/full/industry-competitiveness-analysis 6/49
L-Shaped Cost Curve
In reality, cost curves are closer to being L-shapedthan U-shaped (Johnston)
Large firms are rarely at a cost disadvantage
relative to smaller firms A minimum efficient size (MES) beyond which
average costs are identical across firms

7/28/2019 industry competitiveness analysis
http://slidepdf.com/reader/full/industry-competitiveness-analysis 7/49
L-Shaped Cost Curve

7/28/2019 industry competitiveness analysis
http://slidepdf.com/reader/full/industry-competitiveness-analysis 8/49
Economies of Scope
Firm A produces two products: X and Y
Firm B produces only X
When the cost of producing X is smaller for Firm A than for Firm B, there are economies of scope

7/28/2019 industry competitiveness analysis
http://slidepdf.com/reader/full/industry-competitiveness-analysis 9/49
Economies of Scope
It is cheaper for one firm to produce both X and Y than for two different firms to specialize in X and Y each
TC(QX, Q Y ) < TC(QX, 0) + TC(0, Q Y ) TC(QX, Q Y ) – TC(0,Q Y ) < TC(QX, 0)
Production of Y reduces the incremental cost of producing X

7/28/2019 industry competitiveness analysis
http://slidepdf.com/reader/full/industry-competitiveness-analysis 10/49
Economies of Scope
Common expressions that describestrategies that exploit the economies of scope
“Leveraging core competences”
“Competing on capabilities”
“Mobilizing invisible assets”
Diversification into related products

7/28/2019 industry competitiveness analysis
http://slidepdf.com/reader/full/industry-competitiveness-analysis 11/49
Economies of Scope
The terms “Economies of Scale” and “Economies of Scope” are sometimes used interchangeably
Managers may cite economies of scale and scope
(even when they do not exist) to justify investmentin growth

7/28/2019 industry competitiveness analysis
http://slidepdf.com/reader/full/industry-competitiveness-analysis 12/49
Some Sources of Economies of Scale/Scope
Spreading of fixed costs
Increased productivity of variable inputs
Saving on inventories
The cube-square rule

7/28/2019 industry competitiveness analysis
http://slidepdf.com/reader/full/industry-competitiveness-analysis 13/49
Fixed Costs
Indivisibilities: Certain inputs can not be scaleddown below a minimum
Indivisibilities lead to fixed costs and thus
economies of scale and scope Scale and scope economies may obtain at various
levels
Product level
Plant level
Multi plant level

7/28/2019 industry competitiveness analysis
http://slidepdf.com/reader/full/industry-competitiveness-analysis 14/49
Product Specific Fixed Costs
Research and development
Specialized equipment for production
Set up costs for production Training expenses

7/28/2019 industry competitiveness analysis
http://slidepdf.com/reader/full/industry-competitiveness-analysis 15/49
Tradeoff Among Technologies
Long run economies of scale due to choice of production technologies
Capital intensive technologies offer scale
economies due to indivisibilities in productivecapital
The “lower envelope” of the two cost curves is thelong run average cost curve

7/28/2019 industry competitiveness analysis
http://slidepdf.com/reader/full/industry-competitiveness-analysis 16/49
Tradeoff Among Technologies

7/28/2019 industry competitiveness analysis
http://slidepdf.com/reader/full/industry-competitiveness-analysis 17/49
Tradeoff Among Technologies
7/28/2019 industry competitiveness analysis
http://slidepdf.com/reader/full/industry-competitiveness-analysis 18/49
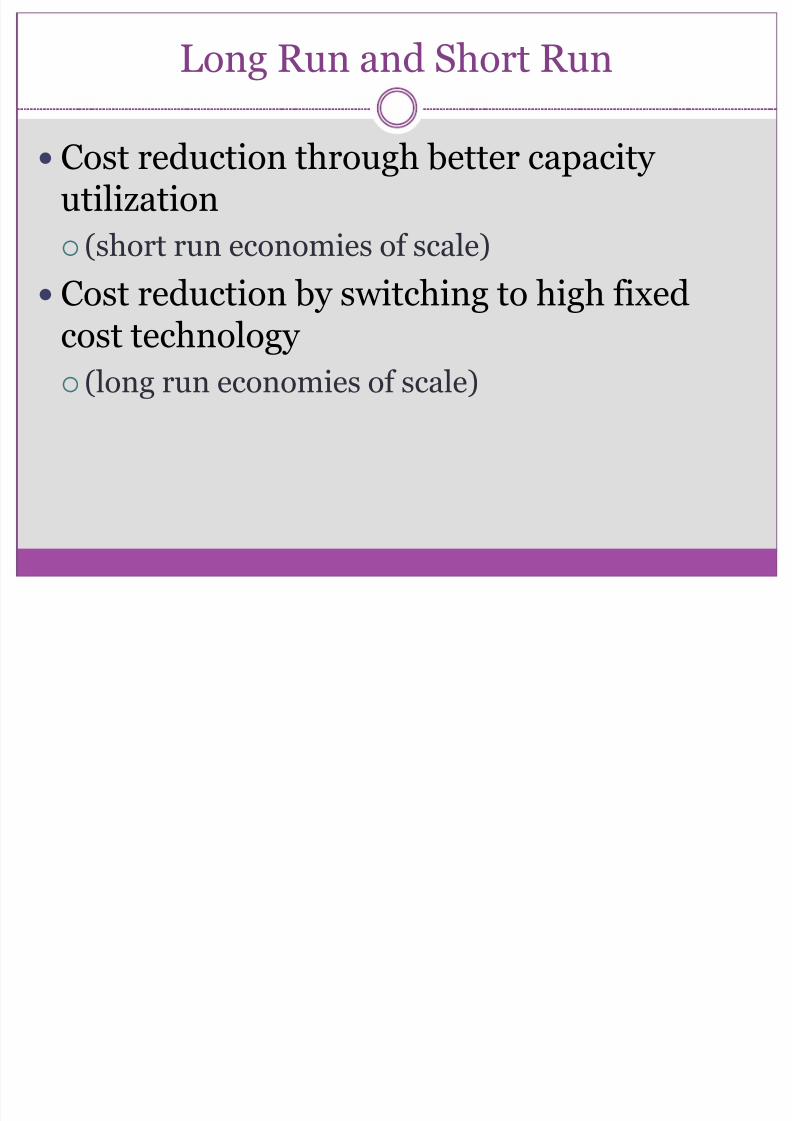
Long Run and Short Run
Cost reduction through better capacity utilization
(short run economies of scale)
Cost reduction by switching to high fixedcost technology
(long run economies of scale)

7/28/2019 industry competitiveness analysis
http://slidepdf.com/reader/full/industry-competitiveness-analysis 19/49
Economies of Scale and Specialization
“The division of labor is limited to the extent of themarket”
As markets increase in size, economies of scale
enables specialization Larger markets support an array of specialized
activities
7/28/2019 industry competitiveness analysis
http://slidepdf.com/reader/full/industry-competitiveness-analysis 20/49
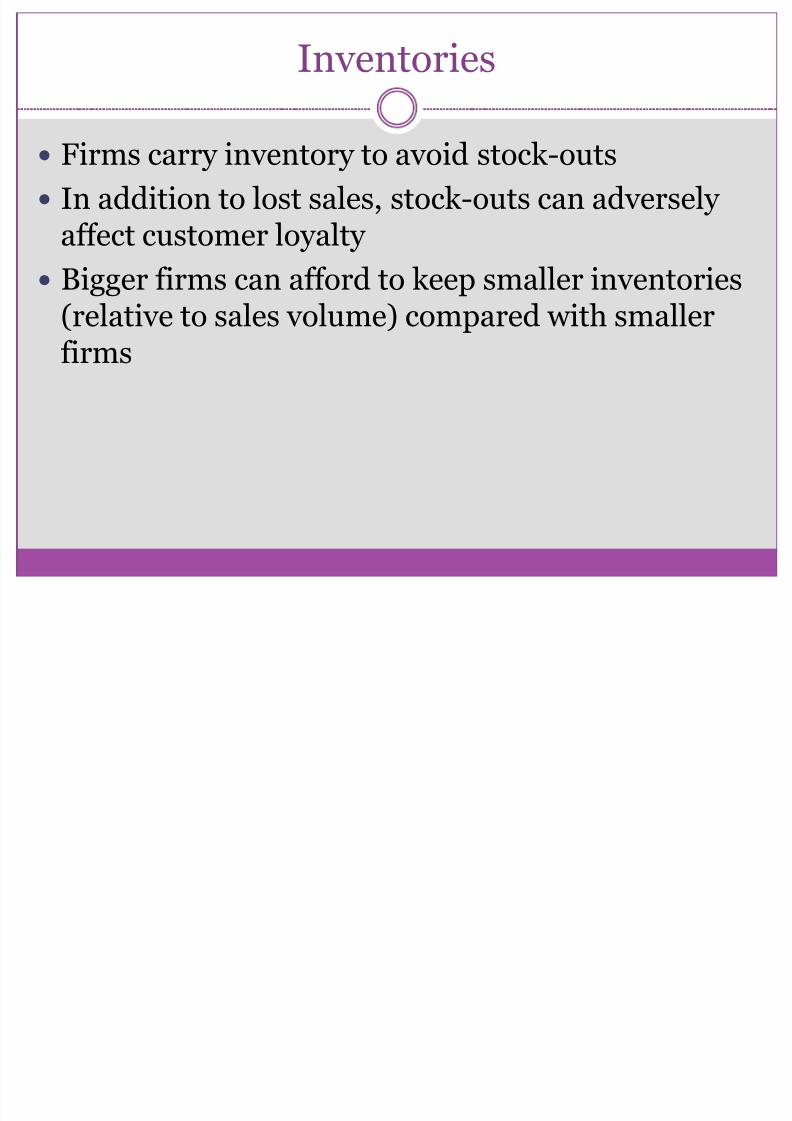
Inventories
Firms carry inventory to avoid stock-outs
In addition to lost sales, stock-outs can adversely affect customer loyalty
Bigger firms can afford to keep smaller inventories(relative to sales volume) compared with smallerfirms

7/28/2019 industry competitiveness analysis
http://slidepdf.com/reader/full/industry-competitiveness-analysis 21/49
Inventories
Two firms may not experience stock-outs at thesame time
Merging the two firms will reduce the probability
of stock out, given the level of inventory
The combined firm can maintain a lower level of inventory for the same probability of stock-out as
before

7/28/2019 industry competitiveness analysis
http://slidepdf.com/reader/full/industry-competitiveness-analysis 22/49
Cube-Square Rule
Doubling the diameter of a hollow sphere increasesits volume eightfold, but the surface area only fourfold
In production processes, the cost of a vessel may vary with surface area and its capacity with volume

7/28/2019 industry competitiveness analysis
http://slidepdf.com/reader/full/industry-competitiveness-analysis 23/49
Cube-Square Rule
Examples of Scale Economies due to theCube-Square Rule
Oil pipelines Warehousing
Brewing tanks

7/28/2019 industry competitiveness analysis
http://slidepdf.com/reader/full/industry-competitiveness-analysis 24/49
Other Sources of Economies of Scale/Scope
Purchasing
Advertising
Research and development

7/28/2019 industry competitiveness analysis
http://slidepdf.com/reader/full/industry-competitiveness-analysis 25/49
Economies of Scale in Purchasing
It is less costly to sell to a single buyer (Example:Group insurance is cheaper than individualinsurance)
Big buyers will be more price sensitive and may drive hard bargains with the suppliers
Supplier may dislike disruption and may offer better deals to bigger buyers

7/28/2019 industry competitiveness analysis
http://slidepdf.com/reader/full/industry-competitiveness-analysis 26/49
Economies of Scale in Purchasing
Small firms can act to overcome diseconomies of scale in purchasing
Small firms can join purchasing alliances
Price sensitive firms may get better bargains even when they are small

7/28/2019 industry competitiveness analysis
http://slidepdf.com/reader/full/industry-competitiveness-analysis 27/49
Economies of Scale and Scope in Advertising
Cost per consumer = (Cost per potential consumer)÷ (Proportion of potential consumers who becomeactual consumers)
Large firms have lower cost of reaching a potentialcustomer (First Term)
Large firms also have a better reach (Second Term)

7/28/2019 industry competitiveness analysis
http://slidepdf.com/reader/full/industry-competitiveness-analysis 28/49
Economies of Scale in Advertising
Large national firms may experience lower cost perpotential customer when compared with smallregional firms
Cost of production of the advertisement and thecost of negotiations with the media can be spreadover different markets

7/28/2019 industry competitiveness analysis
http://slidepdf.com/reader/full/industry-competitiveness-analysis 29/49
Umbrella Branding and Economies of Scope
A well known brand like Samsung covers differentproducts
There are economies of scope in developing and
maintaining these brands New products are easier to introduce when there is
an established brand with the desired image.
7/28/2019 industry competitiveness analysis
http://slidepdf.com/reader/full/industry-competitiveness-analysis 30/49
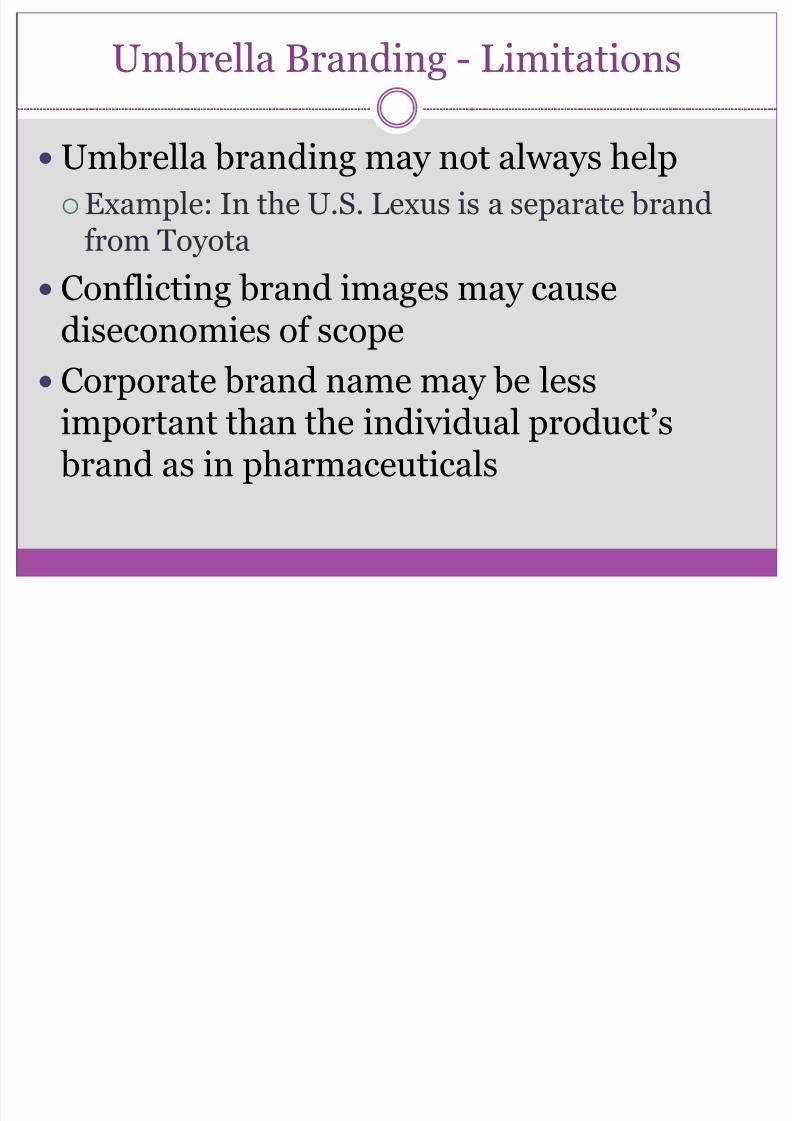
Umbrella Branding - Limitations
Umbrella branding may not always help
Example: In the U.S. Lexus is a separate brandfrom Toyota
Conflicting brand images may causediseconomies of scope
Corporate brand name may be less
important than the individual product’s brand as in pharmaceuticals

7/28/2019 industry competitiveness analysis
http://slidepdf.com/reader/full/industry-competitiveness-analysis 31/49
Economies of Scale in R & D
Minimum feasible size for R & D projects and R &D departments
Economies of scope in R & D; ideas from oneproject can help another project

7/28/2019 industry competitiveness analysis
http://slidepdf.com/reader/full/industry-competitiveness-analysis 32/49
Innovation and Size
Are big firms better at innovating compared tosmall firms?
Size reduces the average cost of innovations
Large firms may pursue a narrow agenda moreaggressively
Smallness may be more suitable for pursuing a variety of approaches to research problems

7/28/2019 industry competitiveness analysis
http://slidepdf.com/reader/full/industry-competitiveness-analysis 33/49
Strategic Fit
Strategic fit is complementarity that yieldseconomies of scope
Strategic fit renders piece-meal copying of
corporate strategy by rivals unproductive Strategic fit is essential for long term competitive
advantage
7/28/2019 industry competitiveness analysis
http://slidepdf.com/reader/full/industry-competitiveness-analysis 34/49
Diseconomies of Scale
Beyond a certain size, bigger may not always be better
The sources of such diseconomies
Increasing labor costs
Spreading specialized resources too thin
“Conflicting out”
Incentive and coordination effects

7/28/2019 industry competitiveness analysis
http://slidepdf.com/reader/full/industry-competitiveness-analysis 35/49
Firm Size and Labor Cost
Workers in large firms tend to get paid morethan workers in small firms
Possible reasons
Unionization is more likely in large firms
Work may be more enjoyable in small firms
Large firms may have to attract workers from far
away places

7/28/2019 industry competitiveness analysis
http://slidepdf.com/reader/full/industry-competitiveness-analysis 36/49
Firm Size and Labor Cost
Large firms experience lower worker turnovercompared to small firms
Savings in recruitment and training costs due tolower turnover may partially offset the higher laborcost

7/28/2019 industry competitiveness analysis
http://slidepdf.com/reader/full/industry-competitiveness-analysis 37/49
Specialized Resources
Certain resources may be limited inavailability (Examples: The chef in arestaurant that is considering expanding)
Other limited resources may bedesirable locations
specialized capital inputs
talented managers

7/28/2019 industry competitiveness analysis
http://slidepdf.com/reader/full/industry-competitiveness-analysis 38/49
“Conflicting Out”
Professional services firms may find it difficult tosign up a client if a competitor is already a client of the firm
When sensitive information has to be shared, suchconflicts may impose a limit to the growth of thefirm

7/28/2019 industry competitiveness analysis
http://slidepdf.com/reader/full/industry-competitiveness-analysis 39/49
Incentive and Coordination Effects
When a firm gets large
it is difficult to monitor and communicate with workers
it is difficult to evaluate and reward individualperformance
detailed work rules may stifle the creativity of the workers

7/28/2019 industry competitiveness analysis
http://slidepdf.com/reader/full/industry-competitiveness-analysis 40/49
The Learning Curve
Learning economies are distinct from economies of scale
Learning economies depend on cumulative output
rather than the rate of output Learning leads to lower costs, higher quality and
more effective pricing and marketing

7/28/2019 industry competitiveness analysis
http://slidepdf.com/reader/full/industry-competitiveness-analysis 41/49
The Learning Curve
7/28/2019 industry competitiveness analysis
http://slidepdf.com/reader/full/industry-competitiveness-analysis 42/49
The Slope as a Measure of Learning Benefits
The slope of a process is the relative size of theaverage cost when cumulative output doubles
A slope of 0.8 (the observed median) indicates that
the average cost will decline by 20% when thecumulative output doubles
Learning flattens out over time and the slopeeventually becomes 1.0

7/28/2019 industry competitiveness analysis
http://slidepdf.com/reader/full/industry-competitiveness-analysis 43/49
Learning Curve Strategy
Expand output rapidly to benefit from the learningcurve and achieve a cost advantage
May lead to losses in the short term but ensure
long term profitability
Rewards based of short term profits may discourage the exploitation of the learning curve

7/28/2019 industry competitiveness analysis
http://slidepdf.com/reader/full/industry-competitiveness-analysis 44/49
BCG’s Growth/Share Paradigm
Product life cycle model combined with an internalcapital market, with the firm serving as a banker
Use the cash generated by “cash cows” to exploit
the learning economies of “rising stars” and“problem children”

7/28/2019 industry competitiveness analysis
http://slidepdf.com/reader/full/industry-competitiveness-analysis 45/49
BCG’s Growth/Share Matrix

7/28/2019 industry competitiveness analysis
http://slidepdf.com/reader/full/industry-competitiveness-analysis 46/49
The Product Life Cycle

7/28/2019 industry competitiveness analysis
http://slidepdf.com/reader/full/industry-competitiveness-analysis 47/49
Individual Learning & Organizational Learning
Learning resides with individuals
Organizational learning includes expertise thatindividuals have and the way they complement
each other Worker mobility can lead to loss of expertise in the
organization
On the other hand, codifying work rules and
reducing job turnover may stifle creativity

7/28/2019 industry competitiveness analysis
http://slidepdf.com/reader/full/industry-competitiveness-analysis 48/49
Learning Curve and Scale Economies
Learning reduces unit cost through experience
Capital intensive technologies can offer scale
economies even if there is no learning Complex labor intensive processes may offer
learning economies without scale economies

7/28/2019 industry competitiveness analysis
http://slidepdf.com/reader/full/industry-competitiveness-analysis 49/49
Learning Curve and Scale Economies
Learning Economies When Scale Economies are Absent