industry focus indonesia industry focus … reiterate towr as our top pick. though both tower-cos...
TRANSCRIPT

Industry Focus
ed-CK / sa- MA, PY
Back to growth mode
Inflexion point in BTS rollout in 2017 – a growth
catalyst for Indonesia tower-cos
More attractive growth outlook vs. regional peers
Market has not priced the growth inflexion point
TOWR is our top pick given its valuation discount
vs. TBIG
2017 is the inflexion year for organic sites and tenants
addition – a catalyst for tower-cos. We believe Indonesia’s largest tower-cos TOWR and TBIG will post stronger organic revenue growth and profitability performance going ahead. TBIG and TOWR’s growth also will continue outperforming the smaller tower-cos given their 1) stable Indonesia tower lease rate, and 2) sustained tenancy ratio of above 1.5x, which enables a lucrative EBITDA margin of 80%. Operators still underinvested in their networks – another
growth catalyst for tower-cos. The expansion of telco operators’ base transceiver station (BTS) has bottomed out last year post the consolidation phase, and we should witness a normalised BTS rollout which also benefit tower-co revenue growth. Indonesian operators in Indonesia are potentially underinvesting in network infrastructure amid the growing data usage and subscriber base. A higher smartphone penetration will lead to growing subscribers and data traffic, a sign that operators need to accelerate their network infrastructure expansion, including towers and BTS rollout.
Market has not priced growth inflexion point. Indonesian tower-cos’ share price underperformed in 2016 on the back of the slower organic revenue growth, given the operators’ network consolidation phase in 2015-2016 – though Indonesian telco operators still posted relatively lucrative topline growth until 9M16. Currently, both TOWR and TBIG are trading at 9.3x and 11.2x FY17 EV/EBITDA, respectively, or at -1SD of their 5-year average, and still at the discount relative to their US peers’ average EV/EBITDA of 15x-16x.
Reiterate TOWR as our top pick. Though both tower-cos are expected to deliver similar revenue and EBITDA CAGR of 13%-14% in FY16-18F, we prefer TOWR to TBIG given the former’s 1) valuation is at the discount to TBIG's, and 2) relatively unleveraged balance sheet, which means that TOWR enjoys better flexibility to pursue both organic and inorganic growth opportunities.
JCI : 5,360.80
Analyst William SIMADIPUTRA +62 2130034939 [email protected] Sachin MITTAL +65 6682 3699 [email protected]
STOCKS
Source: DBS Vickes, DBS Bank, Bloomberg Finance L.P. Closing price as of 3 Feb 2017 Tower Bersama Infrastructure : Bersama provides telecommunication infrastructure services to Indonesian wireless carriers.
PT Sarana Menara Nusantara : PT Sarana Menara Nusantara Tbk, through a subsidiary, builds telecommunications towers. The company constructs and operates the towers as well as rents them to mobile telecommunications services providers
New sites & tenants' addition are tower-co share price catalyst
Source: Companies, DBS Vickers
0
500
1,00
1,50
2,00
2,50
3,00
3,50
4,00
4,50
5,00
(1,000)
(500)
0
500
1,000
1,500
2,000
1Q12
2Q12
3Q12
4Q12
1Q13
2Q13
3Q13
4Q13
1Q14
2Q14
3Q14
4Q14
1Q15
2Q15
3Q15
4Q15
1Q16
2Q16
3Q16
Tower ‐LHS Tenants ‐ LHS Share price ‐ RHS
DBS Group Research . Equity 13 Feb 2017
Indonesia Industry Focus
Telecommunication tower
Refer to important disclosures at the end of this report
Price Mkt Cap 12-mth Target Price
Performance (%)
Rp US$m Rp 3 mth 12 mth Rating
Tower Bersama 5,125 1,742 5,500 (11.6) (13.1) HOLD PT Sarana Menara 3,410 2,610 4,900 (10.3) (24.1) BUY
High growth era, rising share price
Industry Focus
Telecommunication tower
Page 2
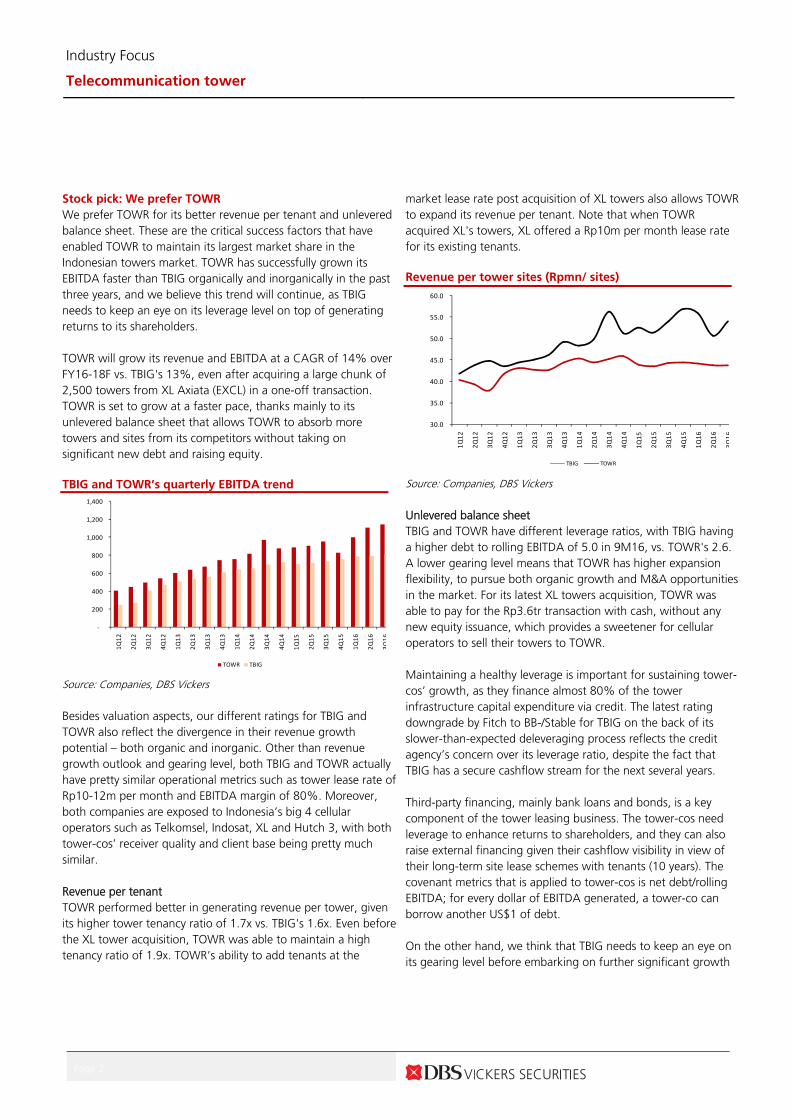
Stock pick: We prefer TOWR We prefer TOWR for its better revenue per tenant and unlevered balance sheet. These are the critical success factors that have enabled TOWR to maintain its largest market share in the Indonesian towers market. TOWR has successfully grown its EBITDA faster than TBIG organically and inorganically in the past three years, and we believe this trend will continue, as TBIG needs to keep an eye on its leverage level on top of generating returns to its shareholders. TOWR will grow its revenue and EBITDA at a CAGR of 14% over FY16-18F vs. TBIG's 13%, even after acquiring a large chunk of 2,500 towers from XL Axiata (EXCL) in a one-off transaction. TOWR is set to grow at a faster pace, thanks mainly to its unlevered balance sheet that allows TOWR to absorb more towers and sites from its competitors without taking on significant new debt and raising equity. TBIG and TOWR’s quarterly EBITDA trend
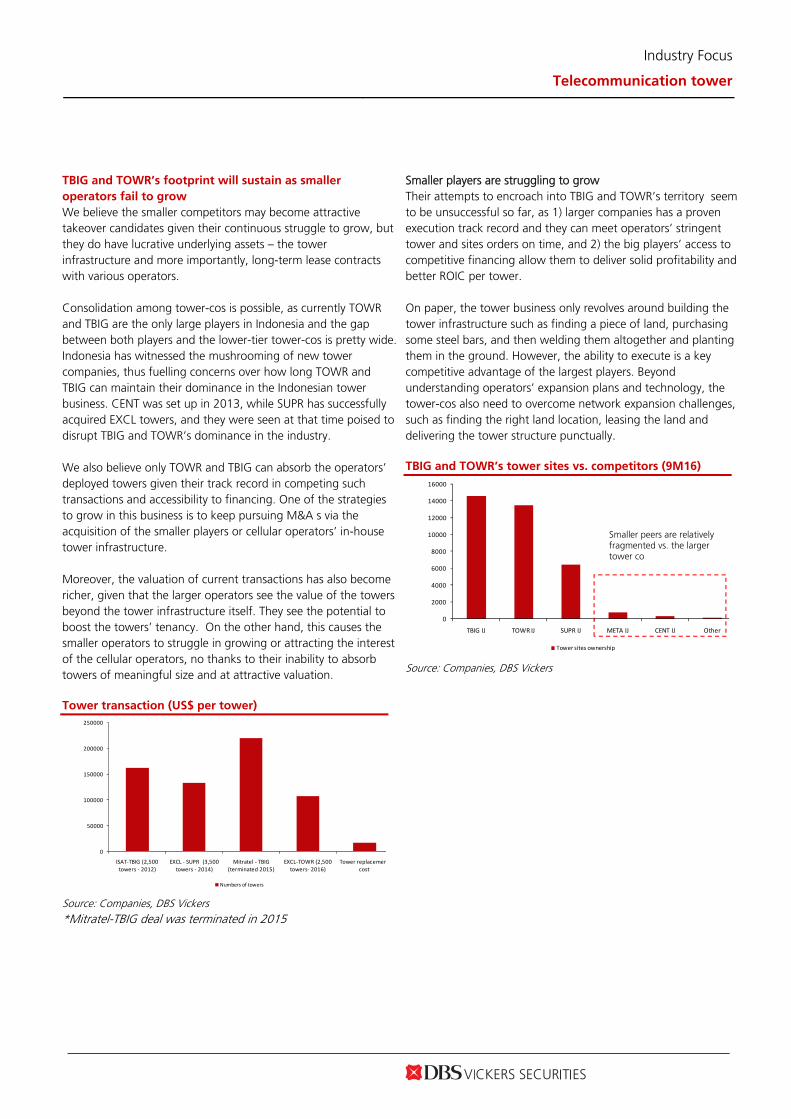
Source: Companies, DBS Vickers Besides valuation aspects, our different ratings for TBIG and TOWR also reflect the divergence in their revenue growth potential – both organic and inorganic. Other than revenue growth outlook and gearing level, both TBIG and TOWR actually have pretty similar operational metrics such as tower lease rate of Rp10-12m per month and EBITDA margin of 80%. Moreover, both companies are exposed to Indonesia’s big 4 cellular operators such as Telkomsel, Indosat, XL and Hutch 3, with both tower-cos’ receiver quality and client base being pretty much similar. Revenue per tenant TOWR performed better in generating revenue per tower, given its higher tower tenancy ratio of 1.7x vs. TBIG's 1.6x. Even before the XL tower acquisition, TOWR was able to maintain a high tenancy ratio of 1.9x. TOWR’s ability to add tenants at the
market lease rate post acquisition of XL towers also allows TOWR to expand its revenue per tenant. Note that when TOWR acquired XL's towers, XL offered a Rp10m per month lease rate for its existing tenants. Revenue per tower sites (Rpmn/ sites)
Source: Companies, DBS Vickers Unlevered balance sheet TBIG and TOWR have different leverage ratios, with TBIG having a higher debt to rolling EBITDA of 5.0 in 9M16, vs. TOWR's 2.6. A lower gearing level means that TOWR has higher expansion flexibility, to pursue both organic growth and M&A opportunities in the market. For its latest XL towers acquisition, TOWR was able to pay for the Rp3.6tr transaction with cash, without any new equity issuance, which provides a sweetener for cellular operators to sell their towers to TOWR. Maintaining a healthy leverage is important for sustaining tower- cos’ growth, as they finance almost 80% of the tower infrastructure capital expenditure via credit. The latest rating downgrade by Fitch to BB-/Stable for TBIG on the back of its slower-than-expected deleveraging process reflects the credit agency’s concern over its leverage ratio, despite the fact that TBIG has a secure cashflow stream for the next several years. Third-party financing, mainly bank loans and bonds, is a key component of the tower leasing business. The tower-cos need leverage to enhance returns to shareholders, and they can also raise external financing given their cashflow visibility in view of their long-term site lease schemes with tenants (10 years). The covenant metrics that is applied to tower-cos is net debt/rolling EBITDA; for every dollar of EBITDA generated, a tower-co can borrow another US$1 of debt. On the other hand, we think that TBIG needs to keep an eye on its gearing level before embarking on further significant growth
‐
200
400
600
800
1,000
1,200
1,400
1Q12
2Q12
3Q12
4Q12
1Q13
2Q13
3Q13
4Q13
1Q14
2Q14
3Q14
4Q14
1Q15
2Q15
3Q15
4Q15
1Q16
2Q16
3Q16
TOWR TBIG
30.0
35.0
40.0
45.0
50.0
55.0
60.0
1Q12
2Q12
3Q12
4Q12
1Q13
2Q13
3Q13
4Q13
1Q14
2Q14
3Q14
4Q14
1Q15
2Q15
3Q15
4Q15
1Q16
2Q16
3Q16
TBIG TOWR

Industry Focus
Telecommunication tower
Page 3
plans, Thus, if any upcoming large orders for tower site construction or any M&A opportunities appear, TBIG will not be able to finalise the transaction immediately – as it needs to devise a financing structure that minimises the equity or cash portion as much as possible, which was seen in the terminated Mitratel transaction back in 2015. Net debt / annualised EBITDA (9M16 )
Source: Companies, DBS Vickers Discount to its regional peers, despite more lucrative
growth outlook Our target EV/EBITDA for TOWR and TBIG stand at FY17F 11.9x and 13.0x, respectively, or at around their 5-year average EV/EBITDA multiple. We believe both tower-cos should re-rate from the current levels, since they are widely expected to maintain their dominance in the Indonesian tower business given their positive EBITDA growth outlook and as their smaller peers struggle to grow. Moreover, both tower-cos’ target multiples are also still at a discount relative to their US peers who are trading at EV/EBITDA multiples of 15.0x (see the relative valuation table on the next page). We believe Indonesia tower-cos should offer better investment opportunities given Indonesia’s superior telco sector growth on the back of a low smartphone penetration rate and Indonesian tower-cos’ better performance, such as higher EBITDA margins, and potential for tenancy ratio improvement. How Indonesian tower-cos compare to regional peers? We believe Indonesian tower-cos are poised to offer more attractive growth opportunities vs. their regional peers given Indonesia’s superior telco industry outlook. Beside industry-wide prospects, the valuation metrics for Indonesian tower-cos are overall more attractive, coupled with their brighter growth outlook vs. their regional peers. American Towers’s international investments outside the US going into emerging countries in the
past three years attest to the superior growth in emerging market vs. the US’s. Indonesian tower-cos’ average tenancy ratio is 1.7x, vs. around 2.0x for regional peers. The lower tenancy ratio relative to regional peers is a sign that Indonesia’s network density has room to improve. The ongoing uptrend for Indonesia’s smartphone penetration rate and data usage means that its telco sector and tower-cos has brighter revenue growth outlooks, coupled with the fact the country’s network intensification initiative means additional BTS in existing locations are required to maintain decent network service quality. Tenancy ratio comparison (X)
Source: Companies, DBS Vickers Despite the lower tenancy ratio per tower, Indonesian tower-cos have the highest EBITDA margins, thanks to the country’s competitive rental rates and lower operational costs – i.e. land lease expenses and electricity tariffs. Indonesia’s lease scheme allows tower-cost pass on electricity tariffs to the operators. Indonesia’s rental rate overall is more affordable compared to that faced by US tower-cos. Indonesia tower-cos’ revenue per tenant is only half that of their US peers, but higher vs. that of India’s Bharti Infratel. Bharti Infratel has a lower lease per tenant as it is not a fully independent tower company – since it is 72% owned by Bharti Airtel, the lease rate is not comparable with that of a fully independent tower-co or a tower-co that has no affiliate relationship with its tenants.
5
2.7
0
1
2
3
4
5
6
TBIG TOWR
Net debt to EBITDA
2.32.2
1.61.7
2.2
0
0.5
1
1.5
2
2.5
AMT Crown Castle TBIG IJ TOWR IJ Bharti Infratel
Average tenancy ratio (X)

Industry Focus
ed-CK / sa- MA, PY
Revenue per tenant (US$ per tenant)
Source: Companies, DBS Vickers
EBITDA margin comparison
Source: Companies, DBS Vickers
Relative valuation table
Ticker Mkt Cap
(USD)
EV/EBITDA (X) PE (X)
Div yield (%)
Revenue EBITDA
2016F 2017F 2016F 2017F FY16-18 CAGR FY16-18
CAGR
Indonesian tower companies TBIG IJ Equity 1,700 13.8 12.5 36.5 29.6 2.4 13.2% 13.1%
TOWR IJ Equity 2,671 11.2 9.3 21.2 17.2 2.6 13.8% 13.9%
SUPR IJ Equity 555 9.9 8.8 15.3 13.3 n.a
American tower companies
AMT US Equity 43,856 18.6 16.9 52.0 47.5 2.1 8.6% 8.7%
CCI US Equity 31,286 18.3 17.4 72.6 92.2 4.2 9.5% 5.3%
India tower company
BHARTI INFRATEL LTD 8,976 10.0 9.1 21.5 20.2 0.9 8.6% 9.7%
Source : DBS Vickers, Bloomberg Finance L.P, as of 3rd February 2017
13 15
9
36 37
‐
5
10
15
20
25
30
35
40
TBIG TOWR Bharti (IN) AMT (US) CC (US)
Revenue per tenants (US$ per tenant)
64.3%68.8%
82.2% 83.2%
43.9%
0%
10%
20%
30%
40%
50%
60%
70%
80%
90%
AMT Crown Castle TBIG IJ TOWR IJ Bharti Infratel
EBITDA margin (%)

Industry Focus
Telecommunication tower
Page 5
What is priced in? Operator's slow tower and sites rollout
in 2015-2016 Indonesian tower-cos’ share price has underperformed the broader Jakarta Composit Index (JCI) index last year given concerns over how the tower-cos will sustain their revenue and EBITDA growth momentum going forward. Generally, as investors view tower-co stocks as 'growth stocks', a slower revenue growth performance can lead to major selloffs. In 2015-2016, tower-cos were facing low revenue growth of 10%-12% with Telkomsel being the only player involved in BTS and site infrastructure growth, as ISAT, EXCL and Hutch 3 embarked on consolidation efforts. TBIG and TOWR’s 1-year share price performance
Source: Companies, DBS Vickers Both TOWR and TBIG are trading at -1SD of their 5-year EV/EBITDA multiples, or c.2012 valuations. We believe this signals that the market has priced in the slower sites and tenants addition prospects in 2017 relative to the 2013-2015 period. On the other hand, everything else for both tower-cos are still pretty much the same, such as their EBITDA margin of 80%. In 2012, the average sites and tenants for tower-cos only reached 7,500-8,000 tower sites and tenants on the back of EBITDA of Rp2tr, which are roughly half the current levels. We believe the current share prices of tower companies provide an attractive entry point. The revenue and EBITDA enjoy a backlog contract of ten years on average that is secured under long-term lease schemes and also provides stable profitability. Particularly for TOWR, we believe that at the current share price levels, the potential downside risk is minimal – please refer to our scenario analysis table.
TOWR’s 5-year forward EV/EBITDA (X)
Source: Companies, DBS Vickers TBIG’s 5-year forward EV/EBITDA (X)
Source: Companies, DBS Vickers
0.7
0.8
0.9
1.0
1.1
1.2
1.3
Feb‐16
Feb‐16
Mar‐16
Mar‐16
Mar‐16
Apr‐16
Apr‐16
May‐16
May‐16
Jun‐16
Jun‐16
Jul‐16
Jul‐16
Aug‐16
Aug‐16
Aug‐16
Sep‐16
Sep‐16
Oct‐16
Oct‐16
Nov‐16
Nov‐16
Dec‐16
Dec‐16
Jan‐17
Jan‐17
TBIG JCI TOWR
Avera
+1 std
+2 std
-1 std
-2 std
7.0
9.0
11.0
13.0
15.0
Jan-
12
Jul-1
2
Jan-
13
Jul-1
3
Jan-
14
Jul-1
4
Jan-
15
Jul-1
5
Jan-
16
Jul-1
6
(x)
A
-29.0
13.0
17.0
21.0
Jan-12 Jul-12 Jan-13 Jul-13 Jan-14 Jul-14 Jan-15 Jul-15 Jan-16 Jul-16
(x)
Underperformance on the absence tower sites addition

Industry Focus
Telecommunication tower
Page 6
Tower and sites addition can catalyse tower cos’ share price – being a key determinant of revenue and EBITDA growth outlook The key catalyst for the tower-cos’ share price is their revenue and EBITDA growth outlook, which is driven by new sites and tenant's addition. Tower-cos’ share price has underperformed last year, even as they posted positive revenue and EBITDA growth on the back of stable and visible revenue and earnings – thanks to long-term lease contracts that come with a high profitability guarantee and cost-pass through schemes. 1Q12 marked the start of the high-growth cycle, with BTS and sites addition reaching 500-1,000 sites per quarter, thus resulting in high double-digit y-o-y revenue and EBITDA growth of 20%-25%. On the other hand, the sites and tenants addition was relatively soft in the past two years (1Q15-3Q16), given the operators’ consolidation phase that led to slow new BTS and tower sites orders for independent tower-cos. Such a trend was followed by the downtrend in tower-cos’ share price despite their steady y-o-y EBITDA growth. Our chart for TBIG below excludes the one- off tower additions from M&As, such as the TBIG-ISAT 2,500 towers M&A in 2Q12 and TOWR-EXCL 2,500 tower M&A in 2Q16. TBIG's share price vs. sites and tenants net addition
Source: Companies, DBS Vickers
TOWR's share price vs. sites and tenants net addition
Source: Companies, DBS Vickers *normalised sites and tenants addition ex. M&A towers M&As are catalysts that can boost the share price, as evidenced by one-time towers addition which can help lift revenue and EBITDA simultaneously. TBIG’s successful ISAT acquisition almost doubled the former’s share price, as the new 2,500 towers addition provided an instant boost for both revenue and EBITDA. Another case in point was when TBIG almost completed the Mitratel tower acquisition, which could have provided a very large footprint for TBIG given its capability to leverage its relationship with Telkomsel – which is the largest and the fastest growing operator in Indonesia.
0
2,000
4,000
6,000
8,000
10,00
12,00
(500)
0
500
1,000
1,500
2,000
1Q12
2Q12
3Q12
4Q12
1Q13
2Q13
3Q13
4Q13
1Q14
2Q14
3Q14
4Q14
1Q15
2Q15
3Q15
4Q15
1Q16
2Q16
3Q16
Tower ‐LHS Tenants ‐ LHS Share price ‐ RHS
0
500
1,00
1,50
2,00
2,50
3,00
3,50
4,00
4,50
5,00
(1,000)
(500)
0
500
1,000
1,500
2,000
1Q12
2Q12
3Q12
4Q12
1Q13
2Q13
3Q13
4Q13
1Q14
2Q14
3Q14
4Q14
1Q15
2Q15
3Q15
4Q15
1Q16
2Q16
3Q16
Tower ‐LHS Tenants ‐ LHS Share price ‐ RHS
High growth era, rising share price
High growth era, rising share price
Industry Focus
Telecommunication tower
Page 7
TBIG and TOWR’s footprint will sustain as smaller
operators fail to grow We believe the smaller competitors may become attractive takeover candidates given their continuous struggle to grow, but they do have lucrative underlying assets – the tower infrastructure and more importantly, long-term lease contracts with various operators. Consolidation among tower-cos is possible, as currently TOWR and TBIG are the only large players in Indonesia and the gap between both players and the lower-tier tower-cos is pretty wide. Indonesia has witnessed the mushrooming of new tower companies, thus fuelling concerns over how long TOWR and TBIG can maintain their dominance in the Indonesian tower business. CENT was set up in 2013, while SUPR has successfully acquired EXCL towers, and they were seen at that time poised to disrupt TBIG and TOWR’s dominance in the industry. We also believe only TOWR and TBIG can absorb the operators’ deployed towers given their track record in competing such transactions and accessibility to financing. One of the strategies to grow in this business is to keep pursuing M&A s via the acquisition of the smaller players or cellular operators’ in-house tower infrastructure. Moreover, the valuation of current transactions has also become richer, given that the larger operators see the value of the towers beyond the tower infrastructure itself. They see the potential to boost the towers’ tenancy. On the other hand, this causes the smaller operators to struggle in growing or attracting the interest of the cellular operators, no thanks to their inability to absorb towers of meaningful size and at attractive valuation. Tower transaction (US$ per tower)
Source: Companies, DBS Vickers *Mitratel-TBIG deal was terminated in 2015
Smaller players are struggling to grow Their attempts to encroach into TBIG and TOWR’s territory seem to be unsuccessful so far, as 1) larger companies has a proven execution track record and they can meet operators’ stringent tower and sites orders on time, and 2) the big players’ access to competitive financing allow them to deliver solid profitability and better ROIC per tower. On paper, the tower business only revolves around building the tower infrastructure such as finding a piece of land, purchasing some steel bars, and then welding them altogether and planting them in the ground. However, the ability to execute is a key competitive advantage of the largest players. Beyond understanding operators’ expansion plans and technology, the tower-cos also need to overcome network expansion challenges, such as finding the right land location, leasing the land and delivering the tower structure punctually. TBIG and TOWR’s tower sites vs. competitors (9M16)
Source: Companies, DBS Vickers
0
50000
100000
150000
200000
250000
ISAT‐TBIG (2,500 towers ‐ 2012)
EXCL ‐ SUPR (3,500 towers ‐ 2014)
Mitratel ‐ TBIG (terminated 2015)
EXCL‐TOWR (2,500 towers‐ 2016)
Tower replacemencost
Numbers of towers
0
2000
4000
6000
8000
10000
12000
14000
16000
TBIG IJ TOWR IJ SUPR IJ META IJ CENT IJ Other
Tower sites ownership
Smaller peers are relatively fragmented vs. the larger tower co

Industry Focus
Telecommunication tower
Page 8
Smaller operators tend to struggle to operate efficiently, as reflected by their lower EBITDA margins – no thanks to their strategy of disrupting the existing rental rates adopted by the larger tower-cos. However, the smaller operators face a number of issues, such as the lack of scale to meet large tower orders from operators and financing difficulties. Lower rental rates vs. the market rate and failure to achieve economies of scale (with tenancy ratios lower than their larger peers) translate into lower EBITDA margins for small players. A lower EBITDA margin means that there will be lower cash inflow to service interest payments and debt facilities.
TBIG and TOWR’s EBITDA margin vs. smaller peers (FY15)
Source: Companies, DBS Vickers
0%
10%
20%
30%
40%
50%
60%
70%
80%
90%
100%
TBIG IJ TOWR IJ SUPR IJ CENT IJ IBST IJ BALI IJ

Industry Focus
Telecommunication tower
Page 9
Is operators’ network investment sufficient to cope with
the rising data usage in Indonesia?
Data usage is trending up – network capex should also
move in the same direction A positive outlook for cellular operator's business and financial performance will bode well for the independent tower-cos, as the former’s network expansion will translate into new towers and sites rollout. Currently, the cellular operators allocate about 50%-60% of their site expansion budget to third-party tower-cos. We believe that Indonesia’s cellular operators are poised to record stable earnings growth of 6%-7% in 2017. Besides enjoying steady subscriber growth, the industry’s average revenue per user (ARPU) is also trending up on the back of stabilising data pricing competition among operators. Data revenue will remain the key growth driver on top of legacy voice and SMS services, and data revenue growth will also drive the uptrend in data traffic growth. As we also do not expect any potential disruption arising from a new entrant into the Indonesian telco space this year, the competitive landscape among the operators will remain benign this year. ISAT has signalled its intention to reduce its data bonus quota during its 3Q16 results announcement, which attests to ISAT's confidence that the competitive landscape will remain benign. Such a benign competitive landscape will lead to a brighter earnings growth outlook, as the telcos’ profitability will not compress due to irrational pricing strategies. Operators’ 2017 y-o-y revenue growth outlook
Source: Companies, DBS Vickers
The increasing data usage (mainly for Java areas) is being driven by higher smart phone penetration and emerging mobile app-based services in Indonesia. Indonesia’s smartphone penetration rate is still relatively low compared to other countries – a sign that the data usage uptrend will sustain for the next several years on the back of brighter smartphone penetration prospects. The higher data usage will convince the operators to continue investing in network infrastructure to maintain their service quality and market share. Data usage among the listed operators grew rapidly in the past two years. In 2016, we witnessed data usage growth of 30%-40% y-o-y in each quarter. We believe such a trend will continue going forward given the steady growth in subscribers, coupled with the ongoing rise in smartphone penetration rate. Currently, Indonesia’s smartphone penetration rate is still low compared to other ASEAN countries. Data usage trend (TB)
Source: Companies, DBS Vickers Indonesia’s smartphone penetration rate is still lower than a lot of countries’ – a sign that data revenue could still trend up amid the rise in smartphone affordability and accessibility. Smartphone adoption in Indonesia will continue to increase on the back of rising smartphone affordability and availability.
6.9%
10.5%
5.0%
0.0%
2.0%
4.0%
6.0%
8.0%
10.0%
12.0%
TLKM ISAT EXCL
0
100,000
200,000
300,000
400,000
500,000
600,000
1Q13 2Q13 3Q13 4Q13 1Q14 2Q14 3Q14 4Q14 1Q15 2Q15 3Q15 4Q15 1Q16 2Q16 3Q16
Telkomsel XL Indosat

Industry Focus
Telecommunication tower
Page 10
Smartphone penetration rate (%)
Source: Companies, DBS Vickers Can tower-cos monetise tenants’ positive growth
outlook? Indonesian tower-cos faced relatively slow revenue growth in 2015-2016, even as the operators maintained their BTS roll-out. The operators’ network consolidation efforts such as the XL-Axis merger and Indosat’s network modernisation mean that they will maximise their spare network capacity before starting to outsource again. The quarterly trends show that the new BTS net add has started to pick up since 1Q16, led by Telkomsel. We believe the trend should continue with the abatement of the 1,800MHz re-farming issue and the increasing data traffic amid 4G LTE rollout. The increasing traffic means that the operators will intensify their network expansion efforts and expand their network coverage, rather than only upgrading their existing network infrastructure.
BTS net add inflexion point in 3Q16
Source: Companies, DBS Vickers Network sharing implication for tower companies We think the network sharing development is positive for the tower-cos, as the operators intend to widen their network coverage to outside Java areas in view of the low cost factor. The move by telcos to expand their network will translate into more demand for tower and BTS, mainly for outside Java areas. The ability to expand at relatively low cost should enable smaller operators like XL and ISAT to venture further into ex. Java territory, whose subscribers offers higher yields vs. those in Java areas. Currently, the outside Java areas are dominated by Telkomsel, thanks to its heavy upfront network infrastructure investment there. The proposed network sharing will focus on active network sharing, including BTS and backhaul network components – a network sharing plan that goes beyond the existing passive sharing scheme for tower infrastructure. According to our checks, the network sharing regulation also accommodates the establishment of joint-venture entities between the cellular operators. Thus, the related capital expenditure and leverage can be 'outsourced' to non-consolidated entities. Moreover, this sharing scheme can maximise the effectiveness of cellular operators’ capital expenditure, mainly for backbone- related network infrastructure. Note that the current tower infrastructure is shared via outsourcing to the independent tower companies.
36.6
55.5
40.1
48.2
31.2
92.3
79.3 80.1
0
10
20
30
40
50
60
70
80
90
100
Indonesia Malaysia Phillipines Thailand Vietnam Singapore Japan United States
Penetration rate
‐
2,000
4,000
6,000
8,000
10,000
12,000
14,000
1Q14 2Q14 3Q14 4Q14 1Q15 2Q15 3Q15 4Q15 1Q16 2Q16 3Q16
ISAT Telkomsel XL

Industry Focus
Telecommunication tower
Page 11
But more time may be needed There is now less buzz on the network sharing front compared to last year. It may take some time before the plan is finalised, as evidenced by the interconnection fee regulation. Our checks with some cellular operators reveal that the new regulation on network sharing may take some time to be rolled out this year, as certain technical and non-technical aspects of the regulation need to be addressed. Lease rate stable on tenant's stellar financial performance
The tower lease rate outlook will remain stable given the current lease rate of Rp10-12m per month – relatively unchanged since three years ago – is a bargain for the telco operators, especially given the tower-cos’ proven track record in fulfilling site construction orders. The chart on revenue per total tower site below also shows that the tower-cos are able to maximise their revenue per tower via maximising their tower sites tenancy. Revenue per tower site (Rpm per site)
Source: Companies, DBS Vickers The operators’ stellar performance in the past two years will also reduce the pressure on lease rates going forward. The operators enjoyed positive revenue growth momentum, with their EBITDA expanding and the positive quarterly trend becoming more obvious.
Operators’ quarterly revenue trend (Rpbn)
Source: Companies, DBS Vickers The operators have successfully expanded their profitability and this did not come at the expense of the tower-cos. The telco operators prefer to maximise their networks’ economies of scale by offering attractive data quotas to attract subscribers and grow revenue. It is worth noting that tower lease expenses account for less than 10% of operators’ COGS. Operators’ EBITDA margin trend
Source: Companies, DBS Vickers
30.0
50.0
70.0
90.0
110.0
1Q12
2Q12
3Q12
4Q12
1Q13
2Q13
3Q13
4Q13
1Q14
2Q14
3Q14
4Q14
1Q15
2Q15
3Q15
4Q15
1Q16
2Q16
3Q16
TBIG TOWR
0
5,000
10,000
15,000
20,000
25,000
30,000
35,000
40,000
1Q13 2Q13 3Q13 4Q13 1Q14 2Q14 3Q14 4Q14 1Q15 2Q15 3Q15 4Q15 1Q16 2Q16 3Q16
Telkomsel XL Indosat
30%
35%
40%
45%
50%
55%
60%
65%
1Q13 2Q13 3Q13 4Q13 1Q14 2Q14 3Q14 4Q14 1Q15 2Q15 3Q15 4Q15 1Q16 2Q16 3Q16
Telkomsel XL Indosat

Industry Focus
Telecommunication tower
Page 12
Key risks
Slower-than-expected cellular operators’ BTS rollout to independent tower companies. A larger-than-expected network infrastructure spare capacity for both ISAT and EXCL means that they need not deploy much of their BTS to the third-party tower companies, thus resulting in a lower-than-expected revenue growth outlook vs. our forecast given the more muted sites and tenants BTS addition. Competition. If we underestimate the competition from the smaller tower companies, TBIG and TOWR’s competitive edge as the sole partners for Indonesia’s largest operators could be eroded. In this case, the operators will deploy their towers to the smaller tower companies. Hence, the operators’ rising network investment would not directly benefit TOWR and TBIG. Rental rate pressure. If the tower-cos fail to renew their lease rates at the current levels, they would be unable to grow their revenues at our expected pace – we are assuming a stable rental rate outlook going forward. Regulatory risk. This could arise if we had somehow misread the network sharing scheme and the implications for the tower companies. If the official network sharing regulation’s scope goes beyond our expectations, it could trigger a longer-than- expected network consolidation among operators. This could impact the tower-cos’ new sites and tenants rollout, which is a key re-rating catalyst for tower-cos’ share price.

Industry Focus
Telecommunication tower
Page 13
Scenario analysis
We have conducted an analysis of bull- and bear-case scenarios for both TOWR and TBIG. Our analysis looks at potential risks in the future, on top of our base-case assumptions and target price implications. Our scenario analysis excludes any M&A opportunities which can skew the performance in any one financial year via one-off tower and tenant additions. Base-case scenario Our base-case scenario is based on a stable industry outlook, on the back of expectations that cellular operators will roll out their BTS more aggressively than 2015-2016, driven by growing data traffic and subscribers. The inflexion point of sites and tenants growth provides the revenue growth catalyst for both TOWR and TBIG. 1) TOWR TOWR’s revenue and EBITDA growth of 13.9% CAGR in FY16-18F is mainly driven by the 13.2% CAGR for sites and tenants over the same period – thus implying a stable tenancy ratio of 1.6x. We assume stable rental rates going forward, given Indonesia’s rental rates are competitive vs. regional rates, and we also see the recent contract renewal rate still tracking the average lease rate in the past three years. This implies that the future backlog will see a flat rental rate. Our stable lease rate and maintenance cost assumptions lead to a stable EBITDA margin outlook of 83%. Our base-case target price is Rp4,900, which implies an FY17 EV/EBITDA of 11.9X or at TOWR's 5-year historical average EV/EBITDA . Our valuation is still at the discount to its regional peers of above 15.0x-16.0x despite its double-digit revenue and EBITDA growth. 2) TBIG TBIG’s revenue and EBITDA growth of 13.2% CAGR in FY16-18F is mainly driven by the 12.9% CAGR sites and tenants over the same period – thus implying a stable tenancy ratio of 1.6x. We assume stable rental rates going forward, given Indonesia’s rental rates are competitive vs. regional rates, and we also see the recent contract renewal rate still tracking the average lease rate in the past three years. This implies that the future backlog will see a flat rental rate. Our stable lease rate and maintenance cost assumptions lead to a stable EBITDA margin outlook of 83%. Our base case target price is Rp5,500, which implies an FY17 EV/EBITDA of 13.0X, or at TBIG's 5-year historical average EV/EBITDA. Our TBIG's target price implied EV/EBITDA multiple is still below to its regional peers at 15.0x-16.0x, back by its
double-digit revenue and EBITDA growth outlook, or at 14% premium to TOWR. Bear-case scenario Our bear-case scenario is based on the view that the consolidation among the operators will take a longer time than expected. This would lead to slower-than-expected tower sites and BTS rollout from the operators to the third-party operators. With the spare network on hand, operators can implement the network sharing scheme without giving any direct benefits to the third-party tower companies. 1) TOWR TOWR’s revenue and EBITDA CAGR can only reach 8% in FY16-18F due to the dimmer sites and tenant's addition outlook as well as disappointing lease rates mainly on new contract renewals; or in this case, we think that TOWR should lower the lease rate to win more orders from operators. This scenario also gives a lower EBITDA margin of 70%. Our bear-case target price is Rp3,000, which implies an FY17 EV/EBITDA of 10.0x or at -1SD of TOWR’s 5-year average EV/EBITDA. We believe TOWR’s share price will not re-rate in our bear-case scenario given the absence of revenue and sites tenants' growth, which is a major re-rating catalyst for this stock. 2) TBIG TBIG’s revenue and EBITDA CAGR can only reach 8.0% in FY16-18F due to the dimmer sites and tenant's addition outlook as well as disappointing lease rates mainly on new contract renewals; or in this case, we think that TOWR should lower the lease rate to win more orders from operators. This scenario also gives a lower EBITDA margin of 70%. Our bear-case target price is Rp2,300, which implies an FY17 EV/EBITDA of 10.0x or at -1SD of TBIG's 5-year average EV/EBITDA. We believe TBIG’s share price will not re-rate in our bear-case scenario given the absence of revenue and sites tenants' growth, which is a major re-rating catalyst for this stock. Bull-case scenario Our bull-case scenario is based on the view that the tower and sites tenants growth will return to the 2012-2015 levels, thus providing a y-o-y revenue growth rate of 20%. We take into account a partial network sharing scheme, where the operators could share their networks beyond just tower sharing, which enables operators other than Telkomsel to expand to ex. Java areas and accelerate their tower sites rollout and tenant

Industry Focus
Telecommunication tower
Page 14
addition. Both TOWR and TBIG are well positioned to absorb the orders given their strong footprint in outside Java areas and easy access to financing. 1) TOWR Our bull-case scenario implies revenue and EBITDA growth of 20% for TOWR, which is growth rate prior to the operators’ consolidation phase in 2015-2016. On the back of operators’ network intensification efforts, TOWR's tenancy ratio could jump back to 1.9x, or the level prior to the XL towers acquisition in 2016. Our bull-case scenario target price is Rp5,800, which implies an FY17 EV/EBITDA of 13.5x, or in line with TBIG's base-case scenario target multiple. We believe TOWR deserves to trade at TBIG's target valuation given its better performance in both revenue and EBITDA growth. 2) TBIG Our bull-case scenario implies a revenue growth rate of 22.6% for TBIG (slightly faster than TOWR’s), given its larger exposure to Telkomsel and Indosat, but with a slightly lower tenancy ratio of 1.8x. Our bull-case scenario EBITDA margin stands at a stable 83%, as we do not expect any rental rate hikes at this point – this rental rate offers a win-win solution for both operators and tower companies. Our bull-case target price for TBIG is Rp7,900, which implies an FY17 EV/EBITDA of 15.0x, or +1SD of its 5-year historical average EV/EBITDA of 13.5x. As the fastest growing tower-co (relative to TOWR), TBIG deserves to be re-rated. On the other hand, its improving EBITDA performance implies that TBIG can gradually normalise its gearing level.

Industry Focus
Telecommunication tower
Page 15
TOWR scenario summary
Bear Base Bull
Terminal growth rate 0.0% 1.0% 1.0%
Revenue & EBITDA growth - CAGR FY16-18F 8.0% 13.9% 20.0%
FY16-18F tower sites growth 0% 13.7% 19.6%
Tenancy ratio (X) 1.30 1.60 1.90
LT EBITDA margin 70.0% 83.0% 83.0%
EBITD (Rpbn) 3,600 4,602 5,000
Target price (Rp) 3,000 4900 5,800
FY17 EV/EBITDA 10.0 11.9 13.5
Source : DBS Vickers
TBIG scenario summary
Bear Base Bull
Terminal growth rate 0.0% 1.0% 1.0%
Revenue & EBITDA growth - CAGR FY16-18F 8.0% 13.1% 22.6%
FY16-18F tower sites growth 0% 12.9% 21.2%
Tenancy ratio (X) 1.30 1.60 1.70
LT EBITDA margin 70.0% 83.0% 83.0%
FY17F EBITDA (Rpbn) 2,762 3,514 4,000
Target price (Rp) 2,300 5,500 7,900
FY17 EV/EBITDA 10.0 13.0 15.0
Source : DBS Vickers

ASIAN INSIGHTS VICKERS SECURITIES ed: CK / sa: MA, PY
HOLD Last Traded Price ( 10 Feb 2017): Rp5,375 (JCI : 5,371.70) Price Target 12-mth: Rp5,500 (2% upside) (Prev Rp6,400) Potential Catalyst: Quarterly earnings performance Where we differ: We believe TBIG's stretched balance sheet could pose risk to its sites and tenants addition outlook Analyst William Simadiputra +62 2130034939 [email protected] Sachin MITTAL +62 66823699 [email protected]
What’s New Maintain HOLD rating with lower TP of Rp5,500
Valuation is still 20% premium to TOWR’s
Our TP drops on lower earnings forecast
Lower sites and tenants addition assumptions
Price Relative
Forecasts and Valuation FY Dec (Rp m) 2015A 2016F 2017F 2018F Revenue 3,421 3,655 4,125 4,688 EBITDA 2,911 3,114 3,514 3,993 Pre-tax Profit 1,089 573 1,219 1,617 Net Profit 1,430 280 814 1,127 Net Pft (Pre Ex.) 1,402 280 814 1,127 Net Pft Gth (Pre-ex) (%) 277.3 (80.0) 190.7 38.4 EPS (Rp) 298 58.4 180 249 EPS Pre Ex. (Rp) 292 58.4 180 249 EPS Gth Pre Ex (%) 277 (80) 208 38 Diluted EPS (Rp) 298 58.4 180 249 Net DPS (Rp) 59.6 11.7 35.9 49.7 BV Per Share (Rp) 319 366 531 730 PE (X) 18.0 92.1 29.9 21.6 PE Pre Ex. (X) 18.4 92.1 29.9 21.6 P/Cash Flow (X) 15.2 44.7 19.7 15.7 EV/EBITDA (X) 15.1 14.4 12.7 11.4 Net Div Yield (%) 1.1 0.2 0.7 0.9 P/Book Value (X) 16.9 14.7 10.1 7.4 Net Debt/Equity (X) 11.3 10.3 7.8 5.8 ROAE (%) 79.3 17.1 39.2 39.5 Earnings Rev (%): (42) (12) (10) Consensus EPS (Rp): 236 291 339 Other Broker Recs: B: 7 S: 4 H: 10
Source of all data on this page: Company, DBS Vickers, DBS Bank, Bloomberg Finance L.P
Current valuation unjustified by mild growth outlook
Maintain HOLD and reduce TP to Rp5,500. Our lower TP reflects the slower earnings growth outlook on the back of TBIG's softer sites and tenants growth outlook. We also assume a lower sites and tenant's addition of 2,000 sites and 3,200 tenants, respectively, for this year – which still reflect a tower site tenancy ratio of 1.6x. This is due to the still slow new tower rollout from TBIG's major tenants, i.e. Indosat and XL with both telcos still in network consolidation mode. Stretched balance sheet could hinder its expansion. Its gross debt annualised EBITDA reached 5.0x in 3Q16, close to its debt covenant of 6.25x. In our view, this could limit TBIG’s ability to clinch one-off M&A transaction opportunities or even a big order from its clients, as TBIG needs to keep an eye on its capital structure to stick to its commitment to reward shareholders via dividends. Valuation is still premium at TOWR despite the share price drop. We think the share price drop has priced in TBIG's softer site and tenant addition going forward. However, TBIG’s valuation is still steeper than TOWR’s, though the premium has narrowed to 10% vs. the 3-year historical average of 20%.
Valuation:
Our target price of Rp5,500 is based on DCF valuation (WACC 9.2%, terminal growth 4%) and implies an FY16F EBITDA of 13.0x. Key Risks to Our View:
TBIG's deleveraging process. If its deleveraging initiatives or its existing sites and tower additions fail to generate meaningful cash flow to repay its debt, TBIG's growth could come in below our and consensus expectations. Rental rate pressure and tenancy risk. A change in the industry’s competitive landscape and shift in bargaining power towards telecommunication operators could pressure rental rates. At A Glance Issued Capital (m shrs) 4,531 Mkt. Cap (Rpbn/US$m) 24,356 / 1,830 Major Shareholders (%) Wahana Anugrah Sejahtera 22.4 Provident Capital Indonesia 22.2 Tower Bersama Infrastructure TB 6.1
Free Float (%) 49.3 3m Avg. Daily Val (US$m) 1.1 ICB Industry : Technology / Technology Hardware & Equipment
DBS Group Research. Equity 13 Feb 2017
Indonesia Company Guide
Tower Bersama Infrastructure Version 3 | Bloomberg: TBIG IJ | Reuters: TBIG.JK Refer to important disclosures at the end of this report

ASIAN INSIGHTS VICKERS SECURITIES Page 2
Company Guide
Tower Bersama Infrastructure
WHAT’S NEW
TBIG needs to trade at lower multiple for a rating upgrade
Maintain HOLD and reduce TP to Rp5,500. Our lower TP reflects the slower earnings growth outlook on the back of TBIG's softer sites and tenants growth outlook. Moreover, TBIG’s valuation is still steeper than TOWR’s, though the premium has narrowed to 10% vs. the 3-year historical average of 20%, even after the recent share price correction. Given both players have a pretty similar growth outlook; we believe that TOWR is a more attractive investment proposition vs. TBIG at this point. We also assume a lower sites and tenant's addition of 2,000 sites and 3,200 tenants, respectively, for this year – which still reflect a tower site tenancy ratio of 1.6x. This is due to the still slow new tower rollout from TBIG's major tenants, i.e. Indosat and XL with both telcos still in network consolidation mode. Our lower earnings forecast reflect the soft sites and tenants addition going forward, at 1,500-2,000 sites and tenants addition on average, vs. TBIG's historical addition level of 2,000-3,000 sites per annum. Our softer operational performance outlook reflect the softer BTS rollout from TBIG’s second- and third-largest tenants XL and Indosat amid network consolidation.
We assume TBIG's rental rate will remain stable at Rp11-12m per month, as TBIG's rental rate is based on the long-term lease scheme of 10 years with the operators. Coupled with stable operational cost like site maintenance, we believe TBIG's profitability outlook will be stable going forward and its EBITDA margin of 80% will sustain as well. Stretched balance sheet could hinder its expansion. Its gross debt annualized EBITDA reached 5.0x in 3Q16, close to its debt covenant of 6.25x. In our view, this could limit TBIG’s ability to clinch one-off M&A transaction opportunities or even a big order from its clients, as TBIG needs to keep an eye on its capital structure to stick to its commitment to reward shareholders via dividends. TBIG’s high gearing ratio also will limit its tower and sites tenant's growth going forward. With its current leverage level, we believe that TBIG is unable to take on a tower addition transaction of 2,500 – as evidenced by TOWR and XL’s tower transaction last year, where TOWR sweetened the deal by paying cash to XL.
Earnings revision summary
2016F 2017F 2018F
Old New Changes Old New Changes Old New Changes
Revenue (US$mn)
3,955 3,655 -8% 4,615 4,125 -11% 5,078 4,688 -8% Gross profit (US$mn)
3,173 2,893 -9% 3,840 3,422 -11% 4,293 3,954 -8%
EBITDA (US$mn)
3,370 3,114 -8% 3,931 3,514 -11% 4,325 3,993 -8%
Net profit (US$mn)
486 280 -42% 930 814 -12% 1,253 1,127 -10%
Sites
14,825 13,000 -12% 16,325 15,000 -8% 17,750 16,900 -5%
Tenants
24,165 20,800 -14% 26,120 24,000 -8% 29,288 27,040 -8%
Tenancy ratio (x)
1.63 1.60 -2% 1.6 1.60 0% 1.7 1.6 -3%
Source : Company, DBS Vickers, DBS Bank

ASIAN INSIGHTS VICKERS SECURITIES Page 3
Company Guide
Tower Bersama Infrastructure
CRITICAL DATA POINTS TO WATCH
Earnings Drivers:
Double-digit EBITDA growth. We forecast EBITDA to grow by a 13.2% CAGR over FY16-18, driven by solid profitability and site expansion. Our assumption only accounts for organic growth (built-to-suit). EBITDA margin will remain above 80%. Stable rental rate and tenancy ratio also means TBIG's EBITDA margin will be sustainable at the c.80% level, the highest among regional peers. Almost all operational costs are passed through to the operators and the tower-co will only bear the tower maintenance costs. Double-digit tower site and tenant growth. TBIG plans to grow its tower sites and tenant base by 13.1% and 14.0% CAGR respectively over FY16F-18F, by leveraging on the tower outsourcing trend. Telkomsel, which accounts for 39% of TBIG’s total revenue, will remain the key tenant growth driver and keep TBIG's tenancy ratio stable at 1.6x despite the double-digit growth in tower sites over the next three years. Stable rental rate outlook. We expect tower-co's monthly rental rate, including TBIG’s, to be stable at Rp12m per tower. We believe the current rental rate is a win-win situation for both tower-cos and operators, and hence, there will not be rental pressure ahead. Long-term lease contracts provide visible earnings and cash flows. Operators are locked in under 10-years lease contracts with fixed terms until expiry. The long-term contract benefit creates visible earnings and cash flows, and the nature of the business also allows tower-cos to leverage up with competitive external financing to gain business scale. Tower acquisition. Given operators' stretched cash flows amid tight competition and the urgency to deleverage balance sheets, they will continue to divest non-core assets, mainly tower assets. This will benefit tower-co as it would boost tower ownership and EBITDA simultaneously, and in turn, drive up the share price. This was what happened after Indosat acquired 2,500 towers back to 2012, and after the announcement of the ongoing Mitratel transaction. The next tower tender will probably come from Indosat (ISAT IJ, BUY).
Tower sites
DAS & shelter only sites
Tower tenants
Tower tenancy ratio
Capex (Rp tn)
Source: Company, DBS Vickers, DBS Bank

ASIAN INSIGHTS VICKERS SECURITIES Page 4
Company Guide
Tower Bersama Infrastructure
Balance Sheet:
Leveraged balance sheet. Given its stable and visible cash flow business model, TBIG is able to leverage its balance sheet to gain business scale. Net debt-to-EBITDA ratio is 6.25x as the debt covenants are based on rolling EBITDA – every time TBIG generates US$1 EBITDA, it is allowed to raise another US$1 from the creditors. Steady capital expenditure outlook. TBIG’s capex will reach around Rp2tr per year in FY16-17, in line with average annual addition of 2,000 towers. We assume each tower infrastructure requires Rp1bn of investment. Share Price Drivers:
Share trading at 12.3x EV/EBITDA. Tower Bersama is trading at double-digit EV/EBITDA multiple, but that is justified by its stable business and cash flows, and strong earnings visibility. TBIG is trading at around 20% premium to TOWR, thanks to its higher stock trading volume liquidity. Key Risks:
Tenancy risk. If tower-co fails to find additional tenants for the newly acquired/built towers, this would result in a drop in tenancy and profitability. Rental rate pressure. Change in industry's competitive landscape and bargaining power with telcos, potentially leading to rental rate pressure. Weak rupiah vs USD. High USD-denominated debt may hit earnings if the Indonesian currency depreciates. Operators' network expansion slowdown. Slower network expansion means slower BTS roll-outs, which would hurt tower-cos' site expansion outlook. Company Background
PT Tower Bersama Infrastructure Tbk provides telecommunication infrastructure services to Indonesian wireless carriers. The company develops and operates telecommunication-supporting infrastructure including towers and in-building systems across Indonesia.
Leverage & Asset Turnover (x)
Capital Expenditure
ROE (%)
Forward PE Band (x)
PB Band (x)
Source: Company, DBS Vickers, DBS Bank

ASIAN INSIGHTS VICKERS SECURITIES Page 5
Company Guide
Tower Bersama Infrastructure
Key Assumptions
FY Dec 2014A 2015A 2016F 2017F 2018F Tower sites 10,825 11,389 13,000 15,000 16,900 DAS & shelter only sites 993 1,040 1,090 1,141 1,196 Tower tenants 18,081 18,796 20,800 24,000 27,040 Tower tenancy ratio 1.70 1.70 1.60 1.60 1.60 Capex (Rp tn) 2.30 2.00 1.60 2.20 2.10
Segmental Breakdown
FY Dec 2014A 2015A 2016F 2017F 2018F Revenues (Rpbn) Tower revenue 3,267 3,399 3,540 4,005 4,563 Shelter-only & DAS 39.9 22.4 115 120 125 Total 3,307 3,421 3,655 4,125 4,688 (Rpbn)
Income Statement (Rpbn)
FY Dec 2014A 2015A 2016F 2017F 2018F Revenue 3,307 3,421 3,655 4,125 4,688 Cost of Goods Sold (510) (449) (762) (702) (734) Gross Profit 2,797 2,972 2,893 3,423 3,954 Other Opng (Exp)/Inc (292) (311) (292) (330) (375) Operating Profit 2,505 2,661 2,601 3,093 3,579 Other Non Opg (Exp)/Inc 0.0 0.0 0.0 0.0 0.0 Associates & JV Inc 0.0 0.0 0.0 0.0 0.0 Net Interest (Exp)/Inc (1,404) (1,600) (2,028) (1,873) (1,962) Exceptional Gain/(Loss) 329 27.8 0.0 0.0 0.0 Pre-tax Profit 1,431 1,089 573 1,219 1,617 Tax (689) 356 (260) (309) (358) Minority Interest (40.8) (15.1) (32.9) (95.5) (132) Preference Dividend 0.0 0.0 0.0 0.0 0.0 Net Profit 701 1,430 280 814 1,127 Net Profit before Except. 372 1,402 280 814 1,127 EBITDA 2,718 2,911 3,114 3,514 3,993 Growth Revenue Gth (%) 22.9 3.5 6.8 12.9 13.6 EBITDA Gth (%) 23.2 7.1 7.0 12.8 13.6 Opg Profit Gth (%) 22.1 6.2 (2.3) 18.9 15.7 Net Profit Gth (Pre-ex) (%) (70.6) 277.3 (80.0) 190.7 38.4 Margins & Ratio Gross Margins (%) 84.6 86.9 79.2 83.0 84.3 Opg Profit Margin (%) 75.8 77.8 71.2 75.0 76.3 Net Profit Margin (%) 21.2 41.8 7.7 19.7 24.0 ROAE (%) 23.1 79.3 17.1 39.2 39.5 ROA (%) 3.5 6.4 1.1 2.9 4.2 ROCE (%) 7.0 13.0 5.8 8.8 11.0 Div Payout Ratio (%) 41.1 20.0 20.0 20.0 20.0 Net Interest Cover (x) 1.8 1.7 1.3 1.7 1.8
Source: Company, DBS Vickers, DBS Bank

ASIAN INSIGHTS VICKERS SECURITIES Page 6
Company Guide
Tower Bersama Infrastructure
Quarterly / Interim Income Statement (Rpbn)
FY Dec 3Q2015 4Q2015 1Q2016 2Q2016 3Q2016 Revenue 869 880 902 917 942 Cost of Goods Sold (131) (108) (102) (102) (106) Gross Profit 739 772 800 815 836 Other Oper. (Exp)/Inc (83.7) (73.6) (73.9) (78.0) (79.8) Operating Profit 655 698 726 737 756 Other Non Opg (Exp)/Inc 147 (19.9) 63.5 29.9 (267) Associates & JV Inc 0.0 0.0 0.0 0.0 0.0 Net Interest (Exp)/Inc (466) (476) (410) (463) (385) Exceptional Gain/(Loss) 0.0 (54.5) (101) 14.7 227 Pre-tax Profit 336 147 279 318 331 Tax (90.7) 454 470 (215) (235) Minority Interest (19.4) 31.7 (2.4) (7.3) 0.70 Net Profit 226 634 747 95.3 96.2 Net profit bef Except. 226 688 847 80.6 (131) EBITDA 735 759 784 795 818 Growth Revenue Gth (%) 2.9 1.3 2.4 1.7 2.8 EBITDA Gth (%) 2.8 3.2 3.3 1.4 2.9 Opg Profit Gth (%) (1.3) 6.6 4.0 1.4 2.6 Net Profit Gth (Pre-ex) (%) (24.9) 204.6 23.2 (90.5) nm Margins Gross Margins (%) 85.0 87.7 88.7 88.9 88.7 Opg Profit Margins (%) 75.4 79.3 80.5 80.4 80.2 Net Profit Margins (%) 26.0 72.0 82.8 10.4 10.2
Balance Sheet (Rpbn)
FY Dec 2014A 2015A 2016F 2017F 2018F Net Fixed Assets 474 534 1,664 3,424 5,119 Invts in Associates & JVs 0.0 0.0 0.0 0.0 0.0 Other LT Assets 17,847 19,660 19,660 19,660 19,660 Cash & ST Invts 902 297 5,604 405 87.7 Inventory 404 307 446 503 572 Debtors 491 693 820 925 1,051 Other Current Assets 1,511 1,309 1,309 1,309 1,309 Total Assets 21,629 22,800 29,501 26,224 27,798 ST Debt 7,311 250 3,131 9,389 9,604 Creditor 178 193 128 145 165 Other Current Liab 1,635 1,472 1,550 1,599 1,648 LT Debt 8,748 18,033 21,583 11,234 11,491 Other LT Liabilities 1,653 1,262 1,262 1,262 1,262 Shareholder’s Equity 2,076 1,530 1,754 2,406 3,307 Minority Interests 28.2 60.8 93.6 189 321 Total Cap. & Liab. 21,629 22,800 29,501 26,224 27,798 Non-Cash Wkg. Capital 594 644 896 993 1,119 Net Cash/(Debt) (15,157) (17,986) (19,110) (20,219) (21,007) Debtors Turn (avg days) 60.4 63.2 75.5 77.2 76.9 Creditors Turn (avg days) 186.1 340.6 236.2 177.7 177.2 Inventory Turn (avg days) 449.3 653.6 554.1 617.5 614.0 Asset Turnover (x) 0.2 0.2 0.1 0.1 0.2 Current Ratio (x) 0.4 1.4 1.7 0.3 0.3 Quick Ratio (x) 0.2 0.5 1.3 0.1 0.1 Net Debt/Equity (X) 7.2 11.3 10.3 7.8 5.8 Net Debt/Equity ex MI (X) 7.3 11.8 10.9 8.4 6.4 Capex to Debt (%) 14.5 11.0 6.7 10.6 10.0 Z-Score (X) 1.2 1.5 1.3 1.1 1.1
Source: Company, DBS Vickers, DBS Bank

ASIAN INSIGHTS VICKERS SECURITIES Page 7
Company Guide
Tower Bersama Infrastructure
Cash Flow Statement (Rpbn)
FY Dec 2014A 2015A 2016F 2017F 2018F Pre-Tax Profit 1,431 1,089 573 1,219 1,617 Dep. & Amort. 212 251 516 422 415 Tax Paid (122) (187) (182) (260) (309) Assoc. & JV Inc/(loss) 0.0 0.0 0.0 0.0 0.0 Chg in Wkg.Cap. (515) (45.1) (330) (146) (175) Other Operating CF 0.0 592 0.0 0.0 0.0 Net Operating CF 1,006 1,701 577 1,235 1,548 Capital Exp.(net) (2,335) (2,003) (1,644) (2,181) (2,110) Other Invts.(net) (1,415) 0.70 0.0 0.0 0.0 Invts in Assoc. & JV 0.0 (1.0) 0.0 0.0 0.0 Div from Assoc & JV 0.0 0.0 0.0 0.0 0.0 Other Investing CF 0.0 0.0 0.0 0.0 0.0 Net Investing CF (3,750) (2,003) (1,644) (2,181) (2,110) Div Paid (288) (286) (56.0) (163) (225) Chg in Gross Debt 3,078 (477) 6,431 (4,090) 471 Capital Issues 0.0 461 0.0 0.0 0.0 Other Financing CF 0.0 0.0 0.0 0.0 0.0 Net Financing CF 2,791 (302) 6,375 (4,253) 246 Currency Adjustments 0.0 0.0 0.0 0.0 0.0 Chg in Cash 46.6 (604) 5,308 (5,199) (317) Opg CFPS (Rp) 317 364 189 305 380 Free CFPS (Rp) (277) (63.0) (223) (209) (124)
Source: Company, DBS Vickers, DBS Bank
Target Price & Ratings History
Source: DBS Vickers, DBS Bank
Analyst: William Simadiputra
Sachin MITTAL
ASIAN INSIGHTS VICKERS SECURITIES
ed: CK / sa:MA, PY
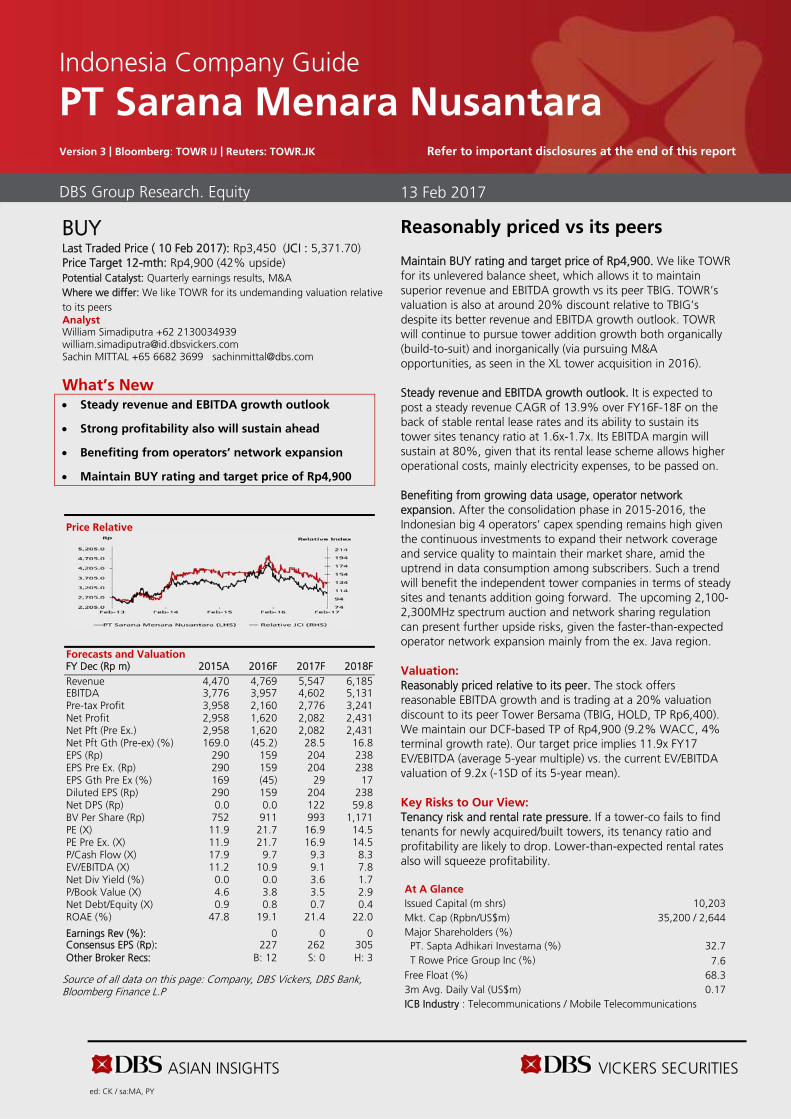
BUY Last Traded Price ( 10 Feb 2017): Rp3,450 (JCI : 5,371.70) Price Target 12-mth: Rp4,900 (42% upside) Potential Catalyst: Quarterly earnings results, M&A Where we differ: We like TOWR for its undemanding valuation relative to its peers Analyst William Simadiputra +62 2130034939 [email protected] Sachin MITTAL +65 6682 3699 [email protected]
What’s New Steady revenue and EBITDA growth outlook
Strong profitability also will sustain ahead
Benefiting from operators’ network expansion
Maintain BUY rating and target price of Rp4,900
Price Relative
Forecasts and Valuation FY Dec (Rp m) 2015A 2016F 2017F 2018F Revenue 4,470 4,769 5,547 6,185 EBITDA 3,776 3,957 4,602 5,131 Pre-tax Profit 3,958 2,160 2,776 3,241 Net Profit 2,958 1,620 2,082 2,431 Net Pft (Pre Ex.) 2,958 1,620 2,082 2,431 Net Pft Gth (Pre-ex) (%) 169.0 (45.2) 28.5 16.8 EPS (Rp) 290 159 204 238 EPS Pre Ex. (Rp) 290 159 204 238 EPS Gth Pre Ex (%) 169 (45) 29 17 Diluted EPS (Rp) 290 159 204 238 Net DPS (Rp) 0.0 0.0 122 59.8 BV Per Share (Rp) 752 911 993 1,171 PE (X) 11.9 21.7 16.9 14.5 PE Pre Ex. (X) 11.9 21.7 16.9 14.5 P/Cash Flow (X) 17.9 9.7 9.3 8.3 EV/EBITDA (X) 11.2 10.9 9.1 7.8 Net Div Yield (%) 0.0 0.0 3.6 1.7 P/Book Value (X) 4.6 3.8 3.5 2.9 Net Debt/Equity (X) 0.9 0.8 0.7 0.4 ROAE (%) 47.8 19.1 21.4 22.0 Earnings Rev (%): 0 0 0 Consensus EPS (Rp): 227 262 305 Other Broker Recs: B: 12 S: 0 H: 3
Source of all data on this page: Company, DBS Vickers, DBS Bank, Bloomberg Finance L.P
Reasonably priced vs its peers
Maintain BUY rating and target price of Rp4,900. We like TOWR for its unlevered balance sheet, which allows it to maintain superior revenue and EBITDA growth vs its peer TBIG. TOWR’s valuation is also at around 20% discount relative to TBIG’s despite its better revenue and EBITDA growth outlook. TOWR will continue to pursue tower addition growth both organically (build-to-suit) and inorganically (via pursuing M&A opportunities, as seen in the XL tower acquisition in 2016). Steady revenue and EBITDA growth outlook. It is expected to post a steady revenue CAGR of 13.9% over FY16F-18F on the back of stable rental lease rates and its ability to sustain its tower sites tenancy ratio at 1.6x-1.7x. Its EBITDA margin will sustain at 80%, given that its rental lease scheme allows higher operational costs, mainly electricity expenses, to be passed on. Benefiting from growing data usage, operator network expansion. After the consolidation phase in 2015-2016, the Indonesian big 4 operators’ capex spending remains high given the continuous investments to expand their network coverage and service quality to maintain their market share, amid the uptrend in data consumption among subscribers. Such a trend will benefit the independent tower companies in terms of steady sites and tenants addition going forward. The upcoming 2,100-2,300MHz spectrum auction and network sharing regulation can present further upside risks, given the faster-than-expected operator network expansion mainly from the ex. Java region.
Valuation:
Reasonably priced relative to its peer. The stock offers reasonable EBITDA growth and is trading at a 20% valuation discount to its peer Tower Bersama (TBIG, HOLD, TP Rp6,400). We maintain our DCF-based TP of Rp4,900 (9.2% WACC, 4% terminal growth rate). Our target price implies 11.9x FY17 EV/EBITDA (average 5-year multiple) vs. the current EV/EBITDA valuation of 9.2x (-1SD of its 5-year mean). Key Risks to Our View:
Tenancy risk and rental rate pressure. If a tower-co fails to find tenants for newly acquired/built towers, its tenancy ratio and profitability are likely to drop. Lower-than-expected rental rates also will squeeze profitability. At A Glance Issued Capital (m shrs) 10,203 Mkt. Cap (Rpbn/US$m) 35,200 / 2,644 Major Shareholders (%) PT. Sapta Adhikari Investama (%) 32.7 T Rowe Price Group Inc (%) 7.6
Free Float (%) 68.3 3m Avg. Daily Val (US$m) 0.17 ICB Industry : Telecommunications / Mobile Telecommunications
DBS Group Research. Equity 13 Feb 2017
Indonesia Company Guide
PT Sarana Menara Nusantara Version 3 | Bloomberg: TOWR IJ | Reuters: TOWR.JK Refer to important disclosures at the end of this report

ASIAN INSIGHTS VICKERS SECURITIES Page 2
Company Guide
PT Sarana Menara Nusantara
CRITICAL DATA POINTS TO WATCH
Earnings Drivers:
Stable earnings growth, driven by organic tower addition. We forecast TOWR's EBITDA to grow by 13.9% CAGR over FY16-19F, on the back of solid site additions, and stable rents and tenancy ratios. For the same reasons, we expect EBITDA margins to remain strong ahead at ~80%. Steady site and tenant growth. We forecast TOWR’s sites to grow by 6.4% CAGR over FY16-18F after the EXCL tower acquisition, thanks to its unlevered balance sheet. This will be driven by the big four telco operators in Indonesia, as all of them will continue to expand revenues and market share amid the competitive telecommunication market in Indonesia. Tenancy ratio will accelerate post XL towers acquisition. We believe TOWR's tenancy ratio will drop to 1.6x in FY16 after the EXCL tower acquisition and remain stable at 1.7x-1.8x going forward on steady tenants addition. Indonesia’s tower companies also still has room to increase the tenancy ratio up to 2.5x and gain better economies of scale. Stable rental outlook, provide a stable EBITDA margin. Indonesia’s monthly rental lease rate will be sustainable at Rp12m per month, as the current rents offer a win-win situation for both the tower-cos and operators. Our channel checks also suggest that overall rental rates have remained stable despite minor changes to contract terms, like passing through electricity costs to the operators. This will have little impact on revenues and profitability. Tower outsourcing trend to continue ahead. Telcos will continue to outsource their requirements by leasing tower infrastructure from third parties instead of building their own, as telcos want to reserve capex to improve/expand network and maintain market share. Non-organic growth opportunity, as thanks to TOWR financial flexibility. Indonesia’s operators’ (ex. Telkom) balance sheets are highly leveraged, which is why they have been divesting non-core assets, mainly tower assets. These divestments provide non-organic growth opportunities for tower-cos, especially TOWR given its high financial flexibility. A higher number of towers will be followed by higher revenues, EBITDA and share price.
Towers
Total tenants
Tenancy ratio
Capex (Rp tn)
EBITDA margin (%)
Source: Company, DBS Vickers, DBS Bank

ASIAN INSIGHTS VICKERS SECURITIES Page 3
Company Guide
PT Sarana Menara Nusantara
Balance Sheet:
Unlevered balance sheet. TOWR has better tower sites and EBITDA growth potential relative to TBIG given its unlevered balance sheet. TOWR has a lower net debt-to-EBITDA of around 2.0x after the EXCL tower acquisition vs. TBIG's 2.7x in 4Q15. This means TOWR is more better positioned for site and tenant growth, whether organically or inorganically this year. Given its strong balance sheet, we also believe TOWR can start to pay dividend this year with appealing yield of 3%-4%, assuming 60% dividend payout ratio. Share Price Drivers:
Share price trading at 9.3x FY17F EV/EBITDA. TOWR is trading close to 10.0x EV/EBITDA multiple but this is justified by its stable business and cash flows. TOWR’s EV/EBITDA multiple is at 20%-30% discount to TBIG's, despite both companies registering good performances. But TOWR has low trading liquidity because of its low free float. EBITDA growth is the key share price driver. It does not matter whether growth is derived organically or through tower acquisitions, the market appreciates its EBITDA growth outlook – which is determined by sites and tenants addition. Key Risks:
Tenancy risk. If a tower-co fails to find additional tenants for newly acquired/built towers, its tenancy and profitability are likely to drop. Rental rate pressure. Tower rental rates could drop if the competition among tower-cos intensifies. The resulting shift in bargaining power towards operators also means that tower-cos will not be able to pass on higher costs, and hence margins will contract. Operators rein in network expansion, weak rupiah vs USD. A slower network expansion would entail a slower BTS rollout, which could derail a tower-co's site expansion plans. Company Background
PT Sarana Menara Nusantara Tbk, through a subsidiary, builds telecommunication towers. The company constructs, operates and rents the towers to mobile telecommunications service providers.
Leverage & Asset Turnover (x)
Capital Expenditure
ROE (%)
Forward PE Band (x)
PB Band (x)
Source: Company, DBS Vickers, DBS Bank

ASIAN INSIGHTS VICKERS SECURITIES Page 4
Company Guide
PT Sarana Menara Nusantara
Key Assumptions
FY Dec 2014A 2015A 2016F 2017F 2018F Towers 11,346 12,237 15,237 16,084 17,272 Total tenants 20,138 21,472 25,572 28,072 30,572 Tenancy ratio 1.80 1.80 1.70 1.70 1.80 Capex (Rp tn) 1.20 4.30 1.40 1.90 1.90 EBITDA margin (%) 83.3 84.5 83.0 83.0 83.0
Income Statement (Rpbn)
FY Dec 2014A 2015A 2016F 2017F 2018F Revenue 4,106 4,470 4,769 5,547 6,185 Cost of Goods Sold (577) (572) (1,609) (1,740) (1,891) Gross Profit 3,530 3,898 3,160 3,807 4,294 Other Opng (Exp)/Inc (1,124) 610 (504) (586) (653) Operating Profit 2,406 4,508 2,657 3,222 3,641 Other Non Opg (Exp)/Inc 0.0 0.0 0.0 0.0 0.0 Associates & JV Inc 0.0 0.0 0.0 0.0 0.0 Net Interest (Exp)/Inc (849) (550) (496) (446) (400) Exceptional Gain/(Loss) 0.0 0.0 0.0 0.0 0.0 Pre-tax Profit 1,557 3,958 2,160 2,776 3,241 Tax (459) (993) (540) (694) (810) Minority Interest 1.20 (6.3) 0.0 0.0 0.0 Preference Dividend 0.0 0.0 0.0 0.0 0.0 Net Profit 1,100 2,958 1,620 2,082 2,431 Net Profit before Except. 1,100 2,958 1,620 2,082 2,431 EBITDA 3,418 3,776 3,957 4,602 5,131 Growth Revenue Gth (%) 28.4 8.9 6.7 16.3 11.5 EBITDA Gth (%) 28.9 10.5 4.8 16.3 11.5 Opg Profit Gth (%) 39.6 87.4 (41.1) 21.3 13.0 Net Profit Gth (Pre-ex) (%) (1.5) 169.0 (45.2) 28.5 16.8 Margins & Ratio Gross Margins (%) 86.0 87.2 66.3 68.6 69.4 Opg Profit Margin (%) 58.6 100.9 55.7 58.1 58.9 Net Profit Margin (%) 26.8 66.2 34.0 37.5 39.3 ROAE (%) 26.3 47.8 19.1 21.4 22.0 ROA (%) 6.7 15.3 6.9 7.9 8.3 ROCE (%) 11.5 19.1 9.3 10.2 10.4 Div Payout Ratio (%) 0.0 0.0 0.0 60.0 25.1 Net Interest Cover (x) 2.8 8.2 5.4 7.2 9.1
Source: Company, DBS Vickers, DBS Bank

ASIAN INSIGHTS VICKERS SECURITIES Page 5
Company Guide
PT Sarana Menara Nusantara
Quarterly / Interim Income Statement (Rpbn)
FY Dec 3Q2015 4Q2015 1Q2016 2Q2016 3Q2016 Revenue 1,133 1,196 1,170 1,253 1,309 Cost of Goods Sold (363) (553) (155) (162) (173) Gross Profit 770 643 1,015 1,091 1,135 Other Oper. (Exp)/Inc (137) 99.6 (123) (93.0) (109) Operating Profit 634 743 892 998 1,026 Other Non Opg (Exp)/Inc 0.0 286 0.0 0.0 0.0 Associates & JV Inc 0.0 0.0 0.0 0.0 0.0 Net Interest (Exp)/Inc (139) (152) (128) (125) (184) Exceptional Gain/(Loss) (471) 2,416 (66.4) 216 99.3 Pre-tax Profit 24.0 3,007 697 1,089 941 Tax (11.0) (816) (178) (281) (343) Minority Interest (1.1) (3.7) (1.5) (1.8) 3.30 Net Profit 11.9 2,187 518 807 601 Net profit bef Except. 483 (229) 584 591 502 EBITDA 952 828 1,001 1,108 1,146 Growth Revenue Gth (%) 5.6 5.6 (2.1) 7.1 4.5 EBITDA Gth (%) 5.4 (13.0) 20.8 10.8 3.4 Opg Profit Gth (%) 54.7 17.3 20.0 11.9 2.8 Net Profit Gth (Pre-ex) (%) 40.0 nm nm 1.1 (15.0) Margins Gross Margins (%) 68.0 53.8 86.7 87.1 86.8 Opg Profit Margins (%) 55.9 62.1 76.2 79.7 78.4 Net Profit Margins (%) 1.0 182.9 44.3 64.4 45.9
Balance Sheet (Rpbn)
FY Dec 2014A 2015A 2016F 2017F 2018F Net Fixed Assets 12,368 14,683 17,657 17,720 18,129 Invts in Associates & JVs 0.0 0.0 0.0 0.0 0.0 Other LT Assets 2,272 3,200 3,148 3,096 3,044 Cash & ST Invts 2,010 2,987 3,347 5,447 8,194 Inventory 0.70 11.1 0.80 0.90 1.00 Debtors 574 471 1,005 1,169 1,304 Other Current Assets 58.2 64.2 64.2 64.2 64.2 Total Assets 17,282 21,417 25,222 27,497 30,735 ST Debt 203 446 446 446 446 Creditor 472 217 684 733 795 Other Current Liab 1,365 1,315 1,793 1,947 2,064 LT Debt 9,151 9,684 10,684 11,684 12,684 Other LT Liabilities 1,376 2,076 2,315 2,554 2,793 Shareholder’s Equity 4,724 7,680 9,300 10,133 11,955 Minority Interests (7.9) (1.6) (1.6) (1.6) (1.6) Total Cap. & Liab. 17,282 21,417 25,222 27,497 30,735 Non-Cash Wkg. Capital (1,204) (985) (1,407) (1,447) (1,490) Net Cash/(Debt) (7,344) (7,144) (7,783) (6,684) (4,937) Debtors Turn (avg days) 55.5 42.7 56.5 71.5 72.9 Creditors Turn (avg days) (400.2) 96.4 531.7 719.5 695.8 Inventory Turn (avg days) (0.5) 1.6 7.0 0.8 0.8 Asset Turnover (x) 0.3 0.2 0.2 0.2 0.2 Current Ratio (x) 1.3 1.8 1.5 2.1 2.9 Quick Ratio (x) 1.3 1.7 1.5 2.1 2.9 Net Debt/Equity (X) 1.6 0.9 0.8 0.7 0.4 Net Debt/Equity ex MI (X) 1.6 0.9 0.8 0.7 0.4 Capex to Debt (%) 22.8 17.4 38.4 11.9 14.5 Z-Score (X) 2.6 2.9 2.3 2.4 2.4
Source: Company, DBS Vickers, DBS Bank

ASIAN INSIGHTS VICKERS SECURITIES Page 6
Company Guide
PT Sarana Menara Nusantara
Cash Flow Statement (Rpbn)
FY Dec 2014A 2015A 2016F 2017F 2018F Pre-Tax Profit 1,557 3,958 2,160 2,776 3,241 Dep. & Amort. 1,013 (732) 1,300 1,380 1,490 Tax Paid (26.4) (335) (61.6) (540) (694) Assoc. & JV Inc/(loss) 0.0 0.0 0.0 0.0 0.0 Chg in Wkg.Cap. 270 (876) (56.3) (115) (73.2) Other Operating CF 1.00 (51.5) 291 291 291 Net Operating CF 2,814 1,962 3,634 3,793 4,255 Capital Exp.(net) (2,135) (1,760) (4,273) (1,444) (1,899) Other Invts.(net) (269) 0.0 0.0 0.0 0.0 Invts in Assoc. & JV 0.0 0.0 0.0 0.0 0.0 Div from Assoc & JV 0.0 0.0 0.0 0.0 0.0 Other Investing CF 0.0 0.0 0.0 0.0 0.0 Net Investing CF (2,404) (1,760) (4,273) (1,444) (1,899) Div Paid 0.0 0.0 0.0 (1,249) (610) Chg in Gross Debt 46.4 777 1,000 1,000 1,000 Capital Issues 0.0 0.0 0.0 0.0 0.0 Other Financing CF 47.7 (1.9) 0.0 0.0 0.0 Net Financing CF 94.1 775 1,000 (249) 390 Currency Adjustments 0.0 0.0 0.0 0.0 0.0 Chg in Cash 504 977 360 2,100 2,747 Opg CFPS (Rp) 249 278 362 383 424 Free CFPS (Rp) 66.6 19.9 (62.7) 230 231
Source: Company, DBS Vickers, DBS Bank
Target Price & Ratings History
Source: DBS Vickers, DBS Bank
Analyst: William Simadiputra
Sachin MITTAL

Industry Focus
Telecommunication tower
Page 16
DBS Vickers recommendations are based an Absolute Total Return* Rating system, defined as follows:
STRONG BUY (>20% total return over the next 3 months, with identifiable share price catalysts within this time frame)
BUY (>15% total return over the next 12 months for small caps, >10% for large caps)
HOLD (-10% to +15% total return over the next 12 months for small caps, -10% to +10% for large caps)
FULLY VALUED (negative total return i.e. > -10% over the next 12 months)
SELL (negative total return of > -20% over the next 3 months, with identifiable catalysts within this time frame)
Share price appreciation + dividends Completed Date: 13 Feb 2017 09:07:45 (WIB) Dissemination Date: 13 Feb 2017 15.46:56 (WIB)
GENERAL DISCLOSURE/DISCLAIMER
This report is prepared by PT DBS Vickers Sekuritas Indonesia. This report is solely intended for the clients of DBS Bank Ltd and DBS Vickers
Securities (Singapore) Pte Ltd, its respective connected and associated corporations and affiliates only and no part of this document may be (i)
copied, photocopied or duplicated in any form or by any means or (ii) redistributed without the prior written consent of PT DBS Vickers Sekuritas
Indonesia.
The research set out in this report is based on information obtained from sources believed to be reliable, but we (which collectively refers to DBS
Bank Ltd., its respective connected and associated corporations, affiliates and their respective directors, officers, employees and agents (collectively,
the “DBS Group”)) do not make any representation or warranty as to its accuracy, completeness or correctness. Opinions expressed are subject to
change without notice. This document is prepared for general circulation. Any recommendation contained in this document does not have regard
to the specific investment objectives, financial situation and the particular needs of any specific addressee. This document is for the information of
addressees only and is not to be taken in substitution for the exercise of judgement by addressees, who should obtain separate independent legal
or financial advice. The DBS Group accepts no liability whatsoever for any direct, indirect and/or consequential loss (including any claims for loss of
profit) arising from any use of and/or reliance upon this document and/or further communication given in relation to this document. This
document is not to be construed as an offer or a solicitation of an offer to buy or sell any securities. The DBS Group, along with its affiliates and/or
persons associated with any of them may from time to time have interests in the securities mentioned in this document. The DBS Group may have
positions in, and may effect transactions in securities mentioned herein and may also perform or seek to perform broking, investment banking and
other banking services for these companies.
Any valuations, opinions, estimates, forecasts, ratings or risk assessments herein constitutes a judgment as of the date of this report, and there can
be no assurance that future results or events will be consistent with any such valuations, opinions, estimates, forecasts, ratings or risk assessments.
The information in this document is subject to change without notice, its accuracy is not guaranteed, it may be incomplete or condensed and it
may not contain all material information concerning the company (or companies) referred to in this report.
This publication has not been reviewed or authorized by any regulatory authority in Singapore, Hong Kong or elsewhere.
The valuations, opinions, estimates, forecasts, ratings or risk assessments described in this report were based upon a number of estimates and
assumptions and are inherently subject to significant uncertainties and contingencies. It can be expected that one or more of the estimates on
which the valuations, opinions, estimates, forecasts, ratings or risk assessments were based will not materialize or will vary significantly from actual
results. Therefore, the inclusion of the valuations, opinions, estimates, forecasts, ratings or risk assessments described herein IS NOT TO BE RELIED
UPON as a representation and/or warranty by the DBS Group (and/or any persons associated with the aforesaid entities), that:
(a) such valuations, opinions, estimates, forecasts, ratings or risk assessments or their underlying assumptions will be achieved, and
(b) there is any assurance that future results or events will be consistent with any such valuations, opinions, estimates, forecasts, ratings or risk
assessments stated therein.
Any assumptions made in this report that refers to commodities, are for the purposes of making forecasts for the company (or companies)
mentioned herein. They are not to be construed as recommendations to trade in the physical commodity or in the futures contract relating to the
commodity referred to in this report. DBS Vickers Securities (USA) Inc ("DBSVUSA")"), a U.S.-registered broker-dealer, does not have its own investment banking or research department, has not participated in any public offering of securities as a manager or co-manager or in any other investment banking transaction in the past twelve months and does not engage in market-making.

Industry Focus
Telecommunication tower
Page 17
ANALYST CERTIFICATION The research analyst(s) primarily responsible for the content of this research report, in part or in whole, certifies that the views about the companies and their securities expressed in this report accurately reflect his/her personal views. The analyst(s) also certifies that no part of his/her compensation was, is, or will be, directly, or indirectly, related to specific recommendations or views expressed in the report. The DBS Group has procedures in place to eliminate, avoid and manage any potential conflicts of interests that may arise in connection with the production of research reports. As of 13 Feb 2017, the analyst(s) and his/her spouse and/or relatives who are financially dependent on the analyst(s), do not hold interests in the securities recommended in this report (“interest” includes direct or indirect ownership of securities). The research analyst(s) responsible for this report operates as part of a separate and independent team to the investment banking function of the DBS Group and procedures are in place to ensure that confidential information held by either the research or investment banking function is handled appropriately.
COMPANY-SPECIFIC / REGULATORY DISCLOSURES
1. PT. DBS Vickers Sekuritas Indonesia ("DBSVI" have a proprietary position in Tower Bersama Infrastructure in this report as of 10 Feb 2017.
Compensation for investment banking services:
2. DBS Bank Ltd, DBSVS, their subsidiaries and/or other affiliates of DBSVUSA have received compensation, within the past 12 months for
investment banking services from Tower Bersama Infrastructure as of 31 Jan 2017.
3. DBS Bank Ltd, DBSVS, their subsidiaries and/or other affiliates of DBSVUSA have managed or co-managed a public offering of securities for
Tower Bersama Infrastructure in the past 12 months, as of 31 Jan 2017.
4. DBSVUSA does not have its own investment banking or research department, nor has it participated in any public offering of securities as a
manager or co-manager or in any other investment banking transaction in the past twelve months. Any US persons wishing to obtain further
information, including any clarification on disclosures in this disclaimer, or to effect a transaction in any security discussed in this document
should contact DBSVUSA exclusively.
Disclosure of previous investment recommendation produced:
5. DBS Bank Ltd, DBS Vickers Securities (Singapore) Pte Ltd (''DBSVS''), their subsidiaries and/or other affiliates may have published other
investment recommendations in respect of the same securities / instruments recommended in this research report during the preceding 12
months. Please contact the primary analyst listed in the first page of this report to view previous investment recommendations published by
DBS Bank Ltd, DBS Vickers Securities (Singapore) Pte Ltd (''DBSVS''), their subsidiaries and/or other affiliates in the preceding 12 months.
RESTRICTIONS ON DISTRIBUTION
General This report is not directed to, or intended for distribution to or use by, any person or entity who is a citizen or resident of or located in any locality, state, country or other jurisdiction where such distribution, publication, availability or use would be contrary to law or regulation.
Australia This report is being distributed in Australia by DBS Bank Ltd. (“DBS”) or DBS Vickers Securities (Singapore) Pte Ltd (“DBSVS”), both of which are exempted from the requirement to hold an Australian Financial Services Licence under the Corporation Act 2001 (“CA”) in respect of financial services provided to the recipients. Both DBS and DBSVS are regulated by the Monetary Authority of Singapore under the laws of Singapore, which differ from Australian laws. Distribution of this report is intended only for “wholesale investors” within the meaning of the CA.
Hong Kong This report is being distributed in Hong Kong by or on behalf of, and is attributable to DBS Vickers (Hong Kong) Limited which is licensed and regulated by the Hong Kong Securities and Futures Commission and/or by DBS Bank (Hong Kong) Limited which is regulated by the Hong Kong Monetary Authority and the Securities and Futures Commission. Where this publication relates to a research report, unless otherwise stated in the research report(s), DBS Bank (Hong Kong) Limited is not the issuer of the research report(s). This publication including any research report(s) is/are distributed on the express understanding that, whilst the information contained within is believed to be reliable, the information has not been independently verified by DBS Bank (Hong Kong) Limited. This report is intended for distribution in Hong Kong only to professional investors (as defined in the Securities and Futures Ordinance (Chapter 571 of the Laws of Hong Kong) and any rules promulgated thereunder.) For any query regarding the materials herein, please contact Paul Yong (CE. No. ASE988) at [email protected].

Industry Focus
Telecommunication tower
Page 18
Indonesia This report is being distributed in Indonesia by PT DBS Vickers Sekuritas Indonesia.
Malaysia This report is distributed in Malaysia by AllianceDBS Research Sdn Bhd ("ADBSR"). Recipients of this report, received from ADBSR are to contact the undersigned at 603-2604 3333 in respect of any matters arising from or in connection with this report. In addition to the General Disclosure/Disclaimer found at the preceding page, recipients of this report are advised that ADBSR (the preparer of this report), its holding company Alliance Investment Bank Berhad, their respective connected and associated corporations, affiliates, their directors, officers, employees, agents and parties related or associated with any of them may have positions in, and may effect transactions in the securities mentioned herein and may also perform or seek to perform broking, investment banking/corporate advisory and other services for the subject companies. They may also have received compensation and/or seek to obtain compensation for broking, investment banking/corporate advisory and other services from the subject companies.
Wong Ming Tek, Executive Director, ADBSR
Singapore This report is distributed in Singapore by DBS Bank Ltd (Company Regn. No. 196800306E) or DBSVS (Company Regn No. 198600294G), both of which are Exempt Financial Advisers as defined in the Financial Advisers Act and regulated by the Monetary Authority of Singapore. DBS Bank Ltd and/or DBSVS, may distribute reports produced by its respective foreign entities, affiliates or other foreign research houses pursuant to an arrangement under Regulation 32C of the Financial Advisers Regulations. Where the report is distributed in Singapore to a person who is not an Accredited Investor, Expert Investor or an Institutional Investor, DBS Bank Ltd accepts legal responsibility for the contents of the report to such persons only to the extent required by law. Singapore recipients should contact DBS Bank Ltd at 6327 2288 for matters arising from, or in connection with the report.
Thailand This report is being distributed in Thailand by DBS Vickers Securities (Thailand) Co Ltd. Research reports distributed are only intended for institutional clients only and no other person may act upon it.
United Kingdom This report is produced by PT DBS Vickers Securities Indonesia which is regulated by Otoritas Jasa Keuangan.
This report is disseminated in the United Kingdom by DBS Vickers Securities (UK) Ltd, ("DBSVUK"). DBSVUK is authorised and regulated by the Financial Conduct Authority in the United Kingdom.
In respect of the United Kingdom, this report is solely intended for the clients of DBSVUK, its respective connected and associated corporations and affiliates only and no part of this document may be (i) copied, photocopied or duplicated in any form or by any means or (ii) redistributed without the prior written consent of DBSVUK. This communication is directed at persons having professional experience in matters relating to investments. Any investment activity following from this communication will only be engaged in with such persons. Persons who do not have professional experience in matters relating to investments should not rely on this communication.
Dubai
This research report is being distributed in The Dubai International Financial Centre (“DIFC”) by DBS Bank Ltd., (DIFC Branch) having its office at PO Box 506538, 3rd Floor, Building 3, East Wing, Gate Precinct, Dubai International Financial Centre (DIFC), Dubai, United Arab Emirates. DBS Bank Ltd., (DIFC Branch) is regulated by The Dubai Financial Services Authority. This research report is intended only for professional clients (as defined in the DFSA rulebook) and no other person may act upon it.
United States This report was prepared by PT DBS Vickers Securities Indonesia. DBSVUSA did not participate in its preparation. The research analyst(s) named on this report are not registered as research analysts with FINRA and are not associated persons of DBSVUSA. The research analyst(s) are not subject to FINRA Rule 2241 restrictions on analyst compensation, communications with a subject company, public appearances and trading securities held by a research analyst. This report is being distributed in the United States by DBSVUSA, which accepts responsibility for its contents. This report may only be distributed to Major U.S. Institutional Investors (as defined in SEC Rule 15a-6) and to such other institutional investors and qualified persons as DBSVUSA may authorize. Any U.S. person receiving this report who wishes to effect transactions in any securities referred to herein should contact DBSVUSA directly and not its affiliate.
Other jurisdictions In any other jurisdictions, except if otherwise restricted by laws or regulations, this report is intended only for qualified, professional, institutional or sophisticated investors as defined in the laws and regulations of such jurisdictions.
DBS Bank Ltd
12 Marina Boulevard, Marina Bay Financial Centre Tower 3 Singapore 018982 Tel. 65-6878 8888
e-mail: [email protected] Company Regn. No. 196800306E