industry sales review april 2017 -...
TRANSCRIPT
1 | P a g e Industry Performance Review Report of PPAC: April, 2017 www.ppac.gov.in
INDUSTRY SALES REVIEW
April 2017
2 | P a g e Industry Performance Review Report of PPAC: April, 2017 www.ppac.gov.in
This report analyses the trend of consumption of petroleum products in the
country during the month of April, 2017. Data on product-wise monthly
consumption of petroleum products for April, 2017 is uploaded on PPAC website
(www.ppac.gov.in).
1.0 CONSUMPTION :
The growth (%) in consumption of petroleum products, category-wise, for the
month of April, 2017 is given in Table-1.
Table-1: Petroleum Products Consumption (Quantity in TMT)
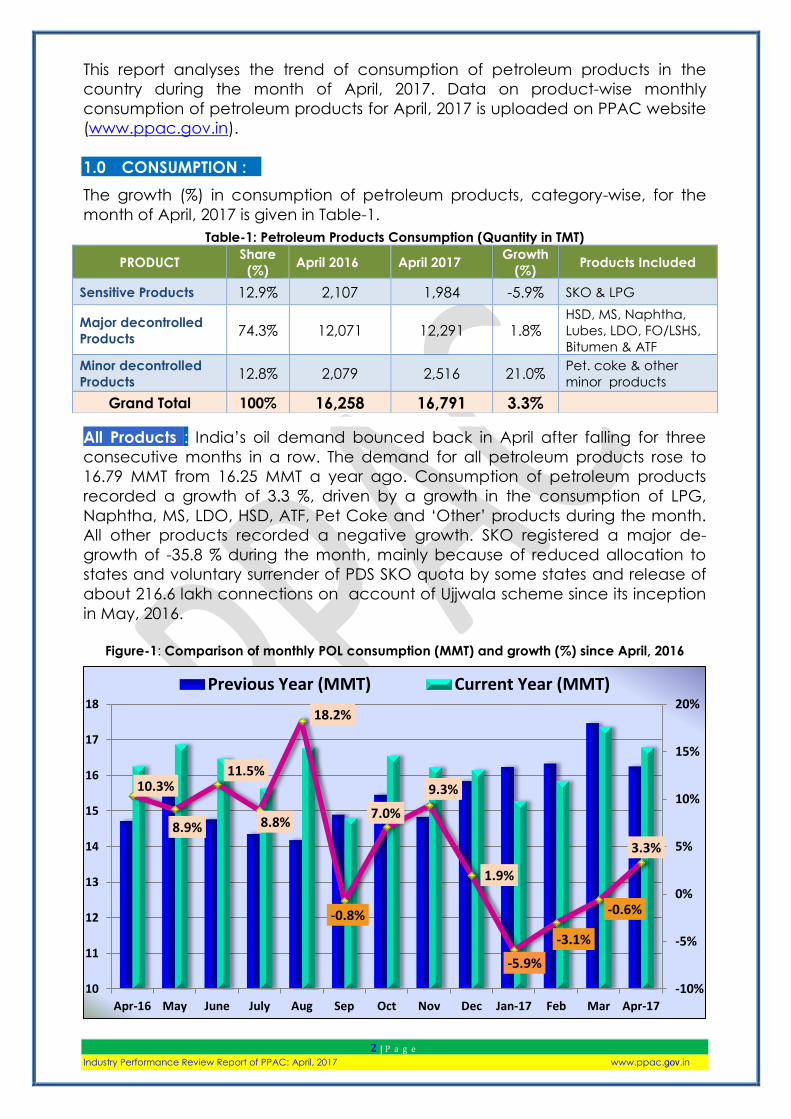
All Products : India’s oil demand bounced back in April after falling for three
consecutive months in a row. The demand for all petroleum products rose to
16.79 MMT from 16.25 MMT a year ago. Consumption of petroleum products
recorded a growth of 3.3 %, driven by a growth in the consumption of LPG,
Naphtha, MS, LDO, HSD, ATF, Pet Coke and ‘Other’ products during the month.
All other products recorded a negative growth. SKO registered a major de-
growth of -35.8 % during the month, mainly because of reduced allocation to
states and voluntary surrender of PDS SKO quota by some states and release of
about 216.6 lakh connections on account of Ujjwala scheme since its inception
in May, 2016.
Figure-1: Comparison of monthly POL consumption (MMT) and growth (%) since April, 2016
10.3%
8.9%
11.5%
8.8%
18.2%
-0.8%
7.0%
9.3%
1.9%
-5.9%
-3.1%
-0.6%
3.3%
-10%
-5%
0%
5%
10%
15%
20%
10
11
12
13
14
15
16
17
18
Apr-16 May June July Aug Sep Oct Nov Dec Jan-17 Feb Mar Apr-17
Previous Year (MMT) Current Year (MMT)
PRODUCT Share
(%) April 2016 April 2017
Growth
(%) Products Included
Sensitive Products 12.9% 2,107 1,984 -5.9% SKO & LPG
Major decontrolled
Products 74.3% 12,071 12,291 1.8%
HSD, MS, Naphtha,
Lubes, LDO, FO/LSHS,
Bitumen & ATF
Minor decontrolled
Products 12.8% 2,079 2,516 21.0%
Pet. coke & other
minor products
Grand Total 100% 16,258 16,791 3.3%
3 | P a g e Industry Performance Review Report of PPAC: April, 2017 www.ppac.gov.in
Indian 'Sales Managers Index' (SMI) released by London-based World
Economics, which produces data and analysis on the global economy, for April
2017, reflects rapid growth in the Indian economy, and remains close to its all-
time high level. Business confidence is very high compared with confidence in
all other countries currently measured by World Economics. The jobs market has
rebounded close to its very high pre-demonetization level and reflects the rapid
growth indicated by the SMI Market and Sales Indexes. The Indian economy
continues to race ahead, although the shock of de-monetization hasn't
completely worn off and remains visible in the continuing rapid rise in prices.
The Nikkei India Services Purchasing Managers' Index, or PMI, fell to 50.2 in April
from March's 51.5 indicating that firms were cautiously pessimistic towards future
performance. Manufacturing conditions improved and Nikkei India
Manufacturing Purchasing Managers’ Index (PMI) matched March’s reading of
52.5 in April.
The indices as mentioned above show business conditions for India are currently
in the expansion territory. Rapid economic growth is leading to greater outputs,
which in turn is increasing the demand of oil for production and transportation.
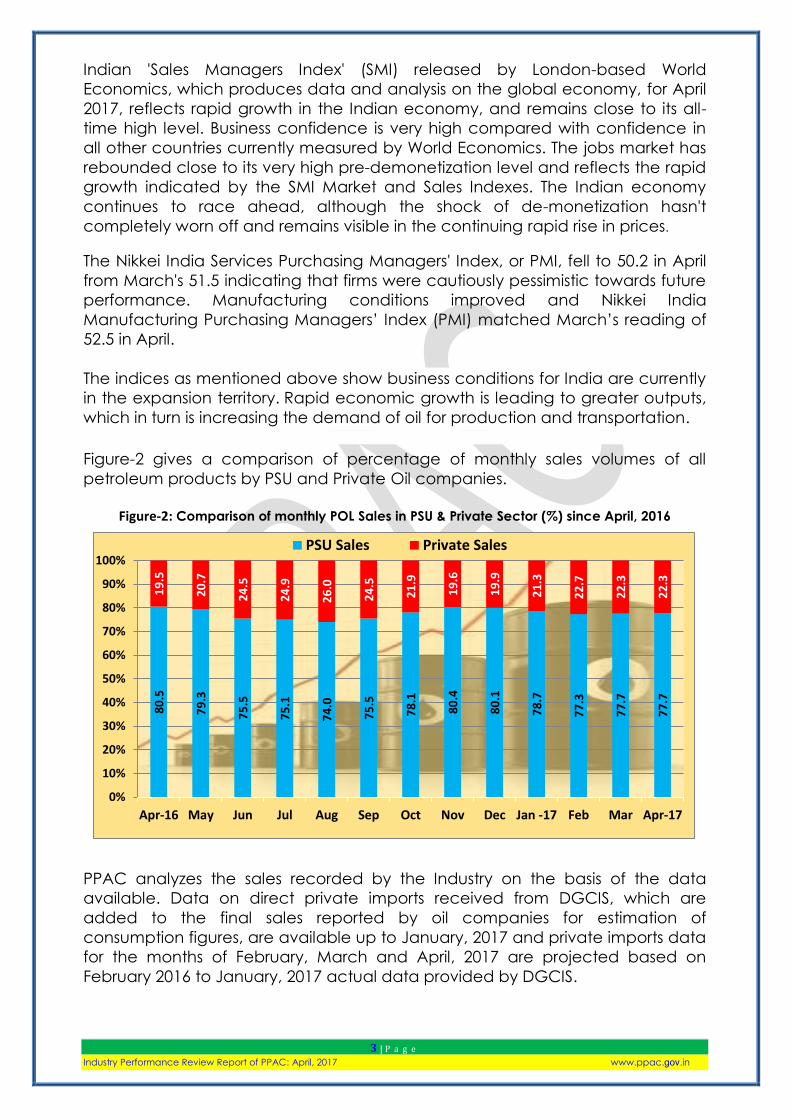
Figure-2 gives a comparison of percentage of monthly sales volumes of all
petroleum products by PSU and Private Oil companies.
Figure-2: Comparison of monthly POL Sales in PSU & Private Sector (%) since April, 2016
PPAC analyzes the sales recorded by the Industry on the basis of the data
available. Data on direct private imports received from DGCIS, which are
added to the final sales reported by oil companies for estimation of
consumption figures, are available up to January, 2017 and private imports data
for the months of February, March and April, 2017 are projected based on
February 2016 to January, 2017 actual data provided by DGCIS.
80
.5
79
.3
75
.5
75
.1
74
.0
75
.5
78
.1
80
.4
80
.1
78
.7
77
.3
77
.7
77
.7
19
.5
20
.7
24
.5
24
.9
26
.0
24
.5
21
.9
19
.6
19
.9
21
.3
22
.7
22
.3
22
.3
0%
10%
20%
30%
40%
50%
60%
70%
80%
90%
100%
Apr-16 May Jun Jul Aug Sep Oct Nov Dec Jan -17 Feb Mar Apr-17
PSU Sales Private Sales
4 | P a g e Industry Performance Review Report of PPAC: April, 2017 www.ppac.gov.in
Detailed product-wise analysis of growth for April, 2017 is given in the
following sections:
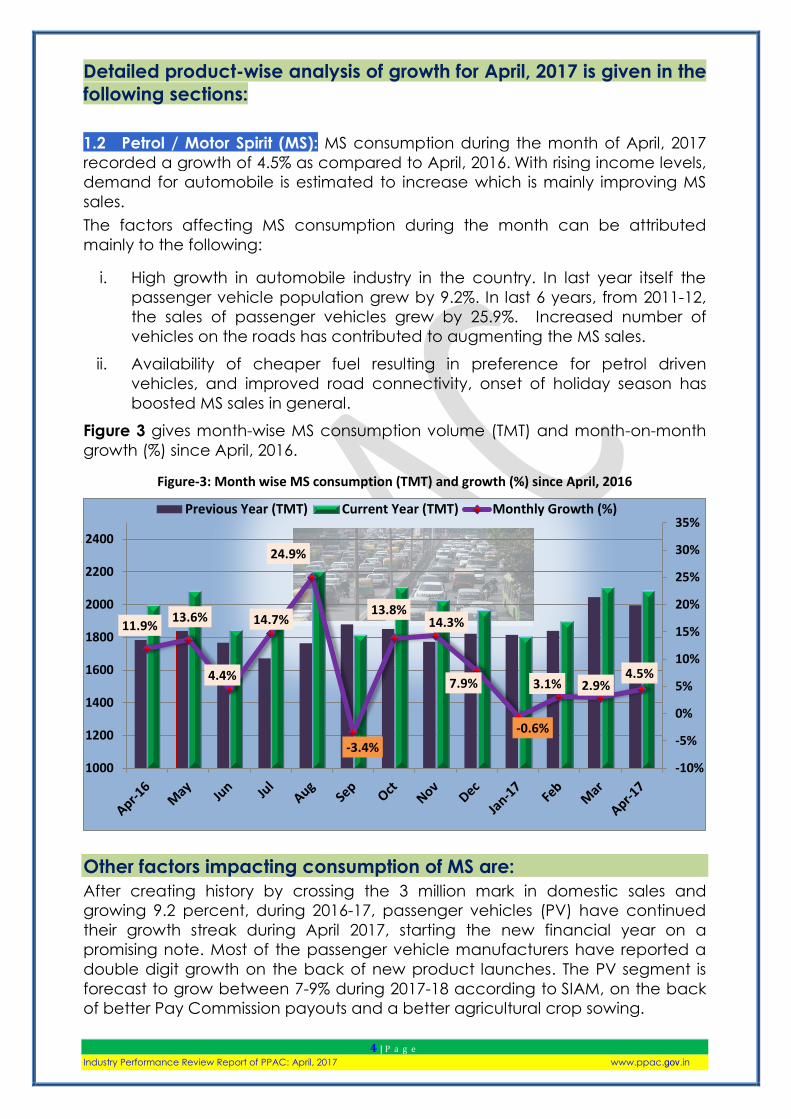
1.2 Petrol / Motor Spirit (MS): MS consumption during the month of April, 2017
recorded a growth of 4.5% as compared to April, 2016. With rising income levels,
demand for automobile is estimated to increase which is mainly improving MS
sales.
The factors affecting MS consumption during the month can be attributed
mainly to the following:
i. High growth in automobile industry in the country. In last year itself the
passenger vehicle population grew by 9.2%. In last 6 years, from 2011-12,
the sales of passenger vehicles grew by 25.9%. Increased number of
vehicles on the roads has contributed to augmenting the MS sales.
ii. Availability of cheaper fuel resulting in preference for petrol driven
vehicles, and improved road connectivity, onset of holiday season has
boosted MS sales in general.
Figure 3 gives month-wise MS consumption volume (TMT) and month-on-month
growth (%) since April, 2016.
Figure-3: Month wise MS consumption (TMT) and growth (%) since April, 2016
Other factors impacting consumption of MS are:
After creating history by crossing the 3 million mark in domestic sales and
growing 9.2 percent, during 2016-17, passenger vehicles (PV) have continued
their growth streak during April 2017, starting the new financial year on a
promising note. Most of the passenger vehicle manufacturers have reported a
double digit growth on the back of new product launches. The PV segment is
forecast to grow between 7-9% during 2017-18 according to SIAM, on the back
of better Pay Commission payouts and a better agricultural crop sowing.
11.9% 13.6%
4.4%
14.7%
24.9%
-3.4%
13.8% 14.3%
7.9%
-0.6%
3.1% 2.9% 4.5%
-10%
-5%
0%
5%
10%
15%
20%
25%
30%
35%
1000
1200
1400
1600
1800
2000
2200
2400
Previous Year (TMT) Current Year (TMT) Monthly Growth (%)
5 | P a g e Industry Performance Review Report of PPAC: April, 2017 www.ppac.gov.in
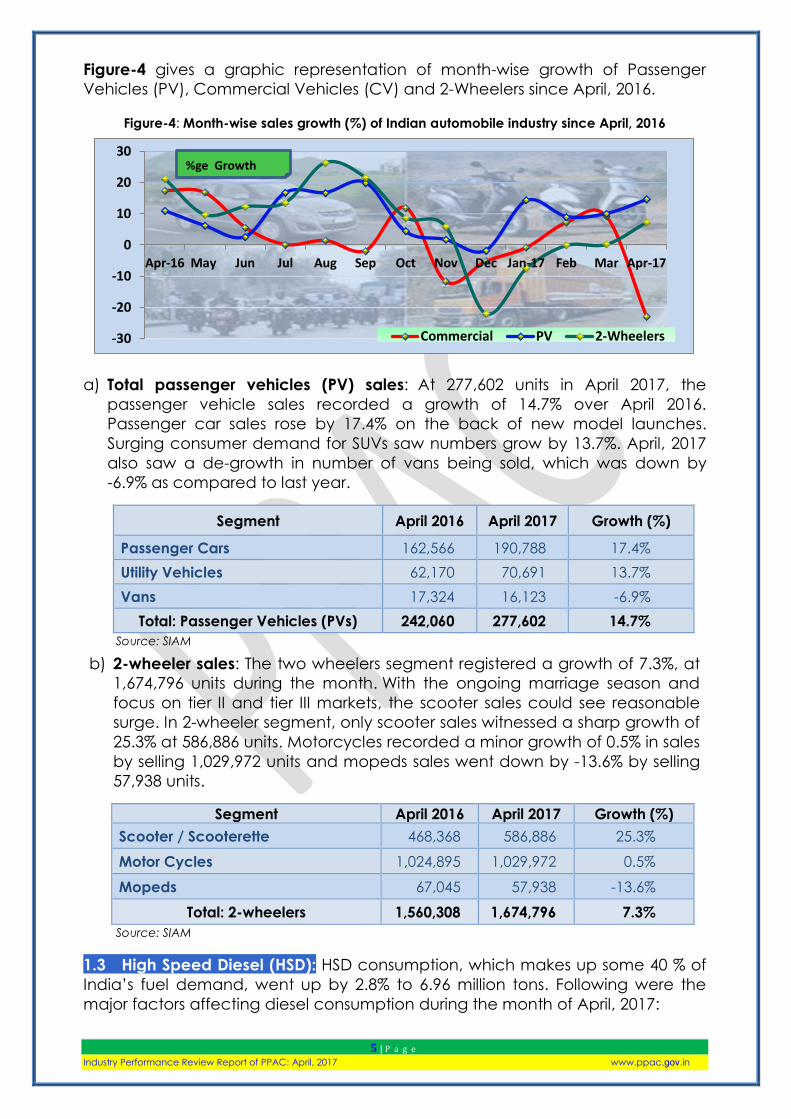
Figure-4 gives a graphic representation of month-wise growth of Passenger
Vehicles (PV), Commercial Vehicles (CV) and 2-Wheelers since April, 2016.
Figure-4: Month-wise sales growth (%) of Indian automobile industry since April, 2016
a) Total passenger vehicles (PV) sales: At 277,602 units in April 2017, the
passenger vehicle sales recorded a growth of 14.7% over April 2016.
Passenger car sales rose by 17.4% on the back of new model launches.
Surging consumer demand for SUVs saw numbers grow by 13.7%. April, 2017
also saw a de-growth in number of vans being sold, which was down by
-6.9% as compared to last year.
Segment April 2016 April 2017 Growth (%)
Passenger Cars 162,566 190,788 17.4%
Utility Vehicles 62,170 70,691 13.7%
Vans 17,324 16,123 -6.9%
Total: Passenger Vehicles (PVs) 242,060 277,602 14.7%
Source: SIAM
b) 2-wheeler sales: The two wheelers segment registered a growth of 7.3%, at
1,674,796 units during the month. With the ongoing marriage season and
focus on tier II and tier III markets, the scooter sales could see reasonable
surge. In 2-wheeler segment, only scooter sales witnessed a sharp growth of
25.3% at 586,886 units. Motorcycles recorded a minor growth of 0.5% in sales
by selling 1,029,972 units and mopeds sales went down by -13.6% by selling
57,938 units.
Segment April 2016 April 2017 Growth (%)
Scooter / Scooterette 468,368 586,886 25.3%
Motor Cycles 1,024,895 1,029,972 0.5%
Mopeds 67,045 57,938 -13.6%
Total: 2-wheelers 1,560,308 1,674,796 7.3%
Source: SIAM
1.3 High Speed Diesel (HSD): HSD consumption, which makes up some 40 % of
India’s fuel demand, went up by 2.8% to 6.96 million tons. Following were the
major factors affecting diesel consumption during the month of April, 2017:
-30
-20
-10
0
10
20
30
Apr-16 May Jun Jul Aug Sep Oct Nov Dec Jan-17 Feb Mar Apr-17
Commercial PV 2-Wheelers
%ge Growth
6 | P a g e Industry Performance Review Report of PPAC: April, 2017 www.ppac.gov.in
Improvement in Medium and Heavy vehicle sales during the last year, improved
road conditions, economic viability of public transport and carrier vehicles due
to cheaper fuel strengthened diesel sales in general
i. No rainfall and drought like conditions across South India affected
agricultural activity.
ii. Reduced mining activity due to closure of illegal sand mining activities
in Tamil Nadu and Karnataka and improved power deficit situation has
resulted in lower usage of diesel.
Figure-5: Month-wise HSD consumption (TMT) and growth (%) since April, 2016
Figure-6 gives comparison of month-wise HSD consumption by Retail and
Consumer business share (%) since April, 2016
Figure-6: Month-wise HSD consumption by Retail and Consumer share (%) since April, 2016
4.4%
8.1%
1.5% 1.8%
13.0%
-11.4%
5.2%
10.5%
1.2%
-7.7%
-3.9%
0.3%
2.8%
-15%
-10%
-5%
0%
5%
10%
15%
0
1000
2000
3000
4000
5000
6000
7000
8000
Previous Year (TMT) Current Year (TMT) Monthly Growth (%)
87
.0
86
.5
86
.1
85
.6
85
.2
83
.3
86
.0
86
.3
85
.3
84
.0
85
.7
85
.4
87
.0
0
10
20
30
40
50
60
70
80
90
100
Apr-16 May Jun Jul Aug Sep Oct Nov Dec Jan-17 Feb Mar Apr-17
HSD Retail HSD Direct
7 | P a g e Industry Performance Review Report of PPAC: April, 2017 www.ppac.gov.in
Other factors affecting diesel consumption are discussed below:
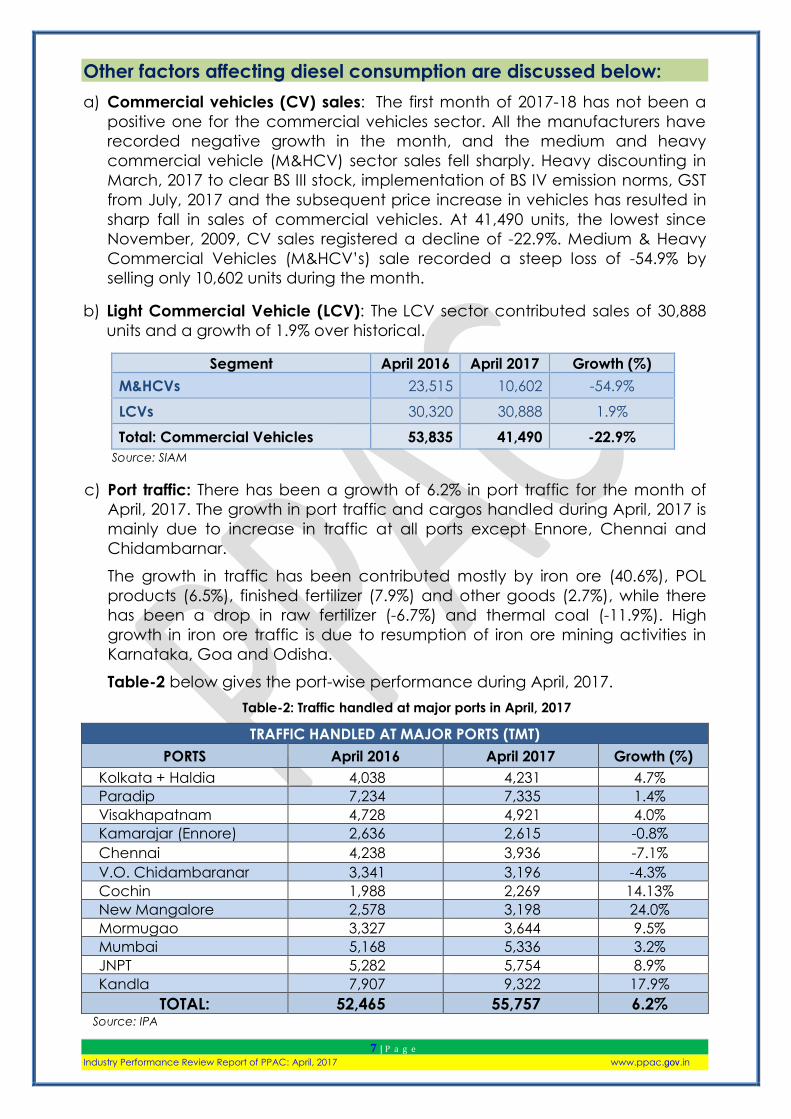
a) Commercial vehicles (CV) sales: The first month of 2017-18 has not been a
positive one for the commercial vehicles sector. All the manufacturers have
recorded negative growth in the month, and the medium and heavy
commercial vehicle (M&HCV) sector sales fell sharply. Heavy discounting in
March, 2017 to clear BS III stock, implementation of BS IV emission norms, GST
from July, 2017 and the subsequent price increase in vehicles has resulted in
sharp fall in sales of commercial vehicles. At 41,490 units, the lowest since
November, 2009, CV sales registered a decline of -22.9%. Medium & Heavy
Commercial Vehicles (M&HCV’s) sale recorded a steep loss of -54.9% by
selling only 10,602 units during the month.
b) Light Commercial Vehicle (LCV): The LCV sector contributed sales of 30,888
units and a growth of 1.9% over historical.
Segment April 2016 April 2017 Growth (%)
M&HCVs 23,515 10,602 -54.9%
LCVs 30,320 30,888 1.9%
Total: Commercial Vehicles 53,835 41,490 -22.9%
Source: SIAM
c) Port traffic: There has been a growth of 6.2% in port traffic for the month of
April, 2017. The growth in port traffic and cargos handled during April, 2017 is
mainly due to increase in traffic at all ports except Ennore, Chennai and
Chidambarnar.
The growth in traffic has been contributed mostly by iron ore (40.6%), POL
products (6.5%), finished fertilizer (7.9%) and other goods (2.7%), while there
has been a drop in raw fertilizer (-6.7%) and thermal coal (-11.9%). High
growth in iron ore traffic is due to resumption of iron ore mining activities in
Karnataka, Goa and Odisha.
Table-2 below gives the port-wise performance during April, 2017.
Table-2: Traffic handled at major ports in April, 2017
TRAFFIC HANDLED AT MAJOR PORTS (TMT)
PORTS April 2016 April 2017 Growth (%)
Kolkata + Haldia 4,038 4,231 4.7%
Paradip 7,234 7,335 1.4%
Visakhapatnam 4,728 4,921 4.0%
Kamarajar (Ennore) 2,636 2,615 -0.8%
Chennai 4,238 3,936 -7.1%
V.O. Chidambaranar 3,341 3,196 -4.3%
Cochin 1,988 2,269 14.13%
New Mangalore 2,578 3,198 24.0%
Mormugao 3,327 3,644 9.5%
Mumbai 5,168 5,336 3.2%
JNPT 5,282 5,754 8.9%
Kandla 7,907 9,322 17.9%
TOTAL: 52,465 55,757 6.2% Source: IPA
8 | P a g e Industry Performance Review Report of PPAC: April, 2017 www.ppac.gov.in
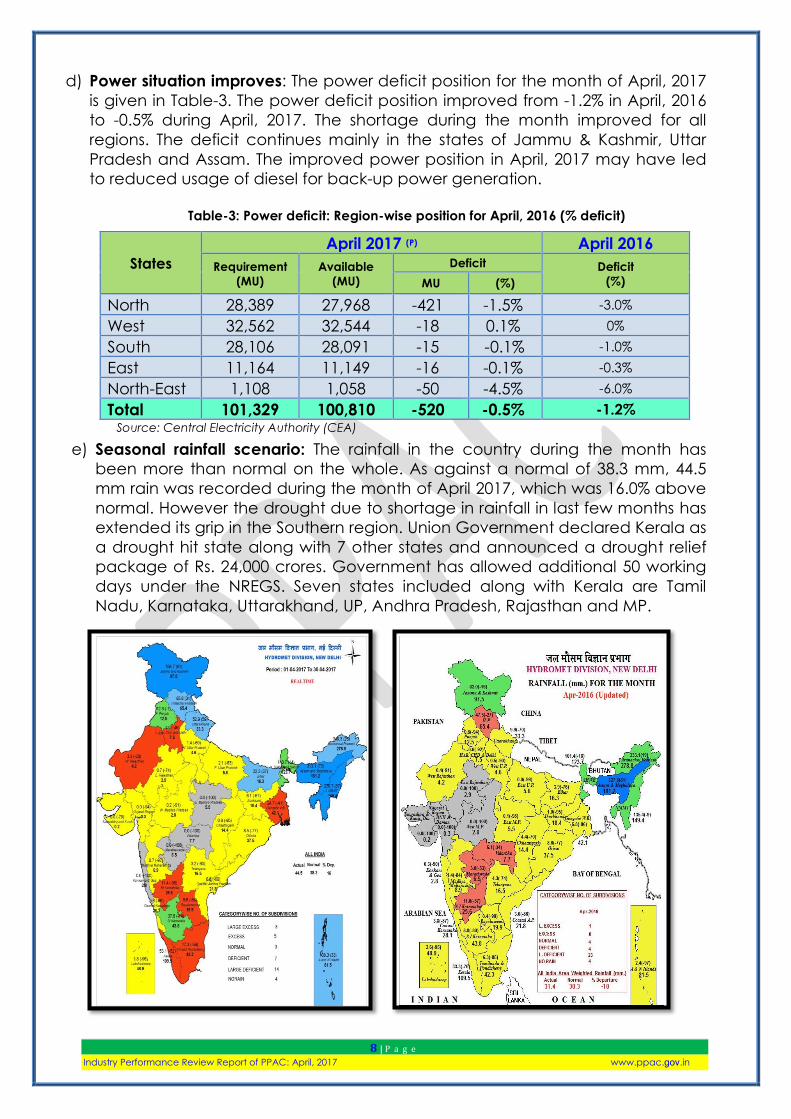
d) Power situation improves: The power deficit position for the month of April, 2017
is given in Table-3. The power deficit position improved from -1.2% in April, 2016
to -0.5% during April, 2017. The shortage during the month improved for all
regions. The deficit continues mainly in the states of Jammu & Kashmir, Uttar
Pradesh and Assam. The improved power position in April, 2017 may have led
to reduced usage of diesel for back-up power generation.
Table-3: Power deficit: Region-wise position for April, 2016 (% deficit)
States
April 2017 (P) April 2016
Requirement
(MU)
Available
(MU)
Deficit Deficit
(%) MU (%)
North 28,389 27,968 -421 -1.5% -3.0%
West 32,562 32,544 -18 0.1% 0%
South 28,106 28,091 -15 -0.1% -1.0%
East 11,164 11,149 -16 -0.1% -0.3%
North-East 1,108 1,058 -50 -4.5% -6.0%
Total 101,329 100,810 -520 -0.5% -1.2% Source: Central Electricity Authority (CEA)
e) Seasonal rainfall scenario: The rainfall in the country during the month has
been more than normal on the whole. As against a normal of 38.3 mm, 44.5
mm rain was recorded during the month of April 2017, which was 16.0% above
normal. However the drought due to shortage in rainfall in last few months has
extended its grip in the Southern region. Union Government declared Kerala as
a drought hit state along with 7 other states and announced a drought relief
package of Rs. 24,000 crores. Government has allowed additional 50 working
days under the NREGS. Seven states included along with Kerala are Tamil
Nadu, Karnataka, Uttarakhand, UP, Andhra Pradesh, Rajasthan and MP.

9 | P a g e Industry Performance Review Report of PPAC: April, 2017 www.ppac.gov.in
1.4 Bitumen: Bitumen consumption recorded a de-growth of -16.0% during the
month of April, 2017. Demonetization of currency in the country since 8th
November 2016, resulted in a slow-down in construction activities due to cash
crunch and restriction on cash withdrawals imposed by the banks. Year-end
budget constraints in many states continued and also resulted in reduced
upliftment of bitumen by the state PWDs.
Figure-6 gives the month wise bitumen consumption and growth since April,
2016.
Figure-6: Month-wise Bitumen consumption (TMT) and growth (%) since April, 2016
1.5 LPG: Total LPG consumption for the last forty four months in a row recorded
a positive growth. In April, 2017, it recorded a growth of 3.9%. However, it was
7.5% in the month of April, 2016. Government has been encouraging the use of
liquefied petroleum gases (LPG) by subsidizing its cost and by launching
programs like Ujjwala to provide LPG connections to lower-income households in
rural areas. LPG consumption which has made up roughly 10% of total
petroleum products consumption, did not decline since the demonetization
announcement.
LPG-Packed Domestic consumption for the last seventeen months in a row
registered a growth of 3.6% during April, 2017. Last year during April, 2016 a
growth of 6.6% was seen. During April 2017, 26.6 lakh new connections were
released out of which 16.3 lakhs were released on account of Ujjwala scheme,
which have contributed to the growth of LPG packed domestic consumption. In
the period May 2016 to April 2017, 216.6 lakh connections were released on
account of Ujjwala. During April 2017, 5.0 lakh DBCs were released. Continuous
growth in LPG Packed Domestic from September 2013 to April 2017 has been
observed, except for minor de-growth of -0.3% in November 2015.
20.4% 15.7%
10.7%
-20.4%
-11.9% -11.3%
-12.1%
22.4%
0.7%
-7.4%
-13.5% -12.2%
-16.0%
-25%
-20%
-15%
-10%
-5%
0%
5%
10%
15%
20%
25%
0
100
200
300
400
500
600
700
800Previous Year (TMT) Current Year (TMT) Monthly Growth (%)
10 | P a g e Industry Performance Review Report of PPAC: April, 2017 www.ppac.gov.in
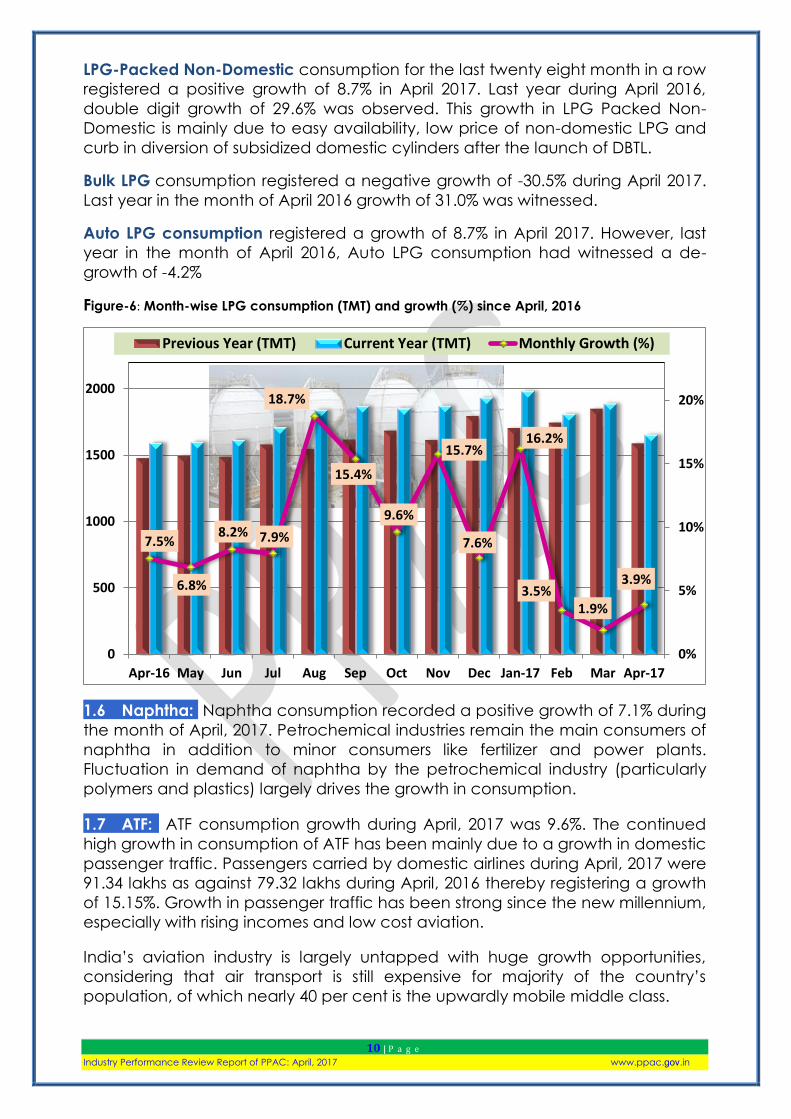
LPG-Packed Non-Domestic consumption for the last twenty eight month in a row
registered a positive growth of 8.7% in April 2017. Last year during April 2016,
double digit growth of 29.6% was observed. This growth in LPG Packed Non-
Domestic is mainly due to easy availability, low price of non-domestic LPG and
curb in diversion of subsidized domestic cylinders after the launch of DBTL.
Bulk LPG consumption registered a negative growth of -30.5% during April 2017.
Last year in the month of April 2016 growth of 31.0% was witnessed.
Auto LPG consumption registered a growth of 8.7% in April 2017. However, last
year in the month of April 2016, Auto LPG consumption had witnessed a de-
growth of -4.2%
Figure-6: Month-wise LPG consumption (TMT) and growth (%) since April, 2016
1.6 Naphtha: Naphtha consumption recorded a positive growth of 7.1% during
the month of April, 2017. Petrochemical industries remain the main consumers of
naphtha in addition to minor consumers like fertilizer and power plants.
Fluctuation in demand of naphtha by the petrochemical industry (particularly
polymers and plastics) largely drives the growth in consumption.
1.7 ATF: ATF consumption growth during April, 2017 was 9.6%. The continued
high growth in consumption of ATF has been mainly due to a growth in domestic
passenger traffic. Passengers carried by domestic airlines during April, 2017 were
91.34 lakhs as against 79.32 lakhs during April, 2016 thereby registering a growth
of 15.15%. Growth in passenger traffic has been strong since the new millennium,
especially with rising incomes and low cost aviation.
India’s aviation industry is largely untapped with huge growth opportunities,
considering that air transport is still expensive for majority of the country’s
population, of which nearly 40 per cent is the upwardly mobile middle class.
7.5%
6.8%
8.2% 7.9%
18.7%
15.4%
9.6%
15.7%
7.6%
16.2%
3.5% 1.9%
3.9%
0%
5%
10%
15%
20%
0
500
1000
1500
2000
Apr-16 May Jun Jul Aug Sep Oct Nov Dec Jan-17 Feb Mar Apr-17
Previous Year (TMT) Current Year (TMT) Monthly Growth (%)

11 | P a g e Industry Performance Review Report of PPAC: April, 2017 www.ppac.gov.in
India is among the five fastest-growing aviation markets globally and with the
right policies and relentless focus on creating infrastructure, quality, cost and
passenger interest, India would be well placed to achieve its vision of becoming
the third-largest aviation market by 2020 and the largest by 2030. Hon’ble PM
inaugurated the first flight from Shimla under “UDAN”( Ude Desh ka Aam Nagrik)
scheme on 27th April ,2017 with a view to cater to the middle class.
In line with the growth in aviation Industry, ATF has also grown at a CAGR of 4.9%
during last 6 years since 2011-12. Since April, 2013, ATF sales have been
continuously growing except a marginal dip in the month of November, 2015.
Figure-7: Month-wise ATF consumption (TMT) and growth (%) since April, 2016
1.8 FO/LSHS: FO and LSHS consumption registered a de-growth of -9.6% during
April, 2017 as compared to April, 2016. The drop is due to decreased
consumption of FO in power, steel and general trade sectors. The consumption
of LSHS has reduced due to shift to natural gas by major customers like fertilizers.
1.9 PETCOKE: Petcoke consumption registered a whooping growth of 25.4%
during April, 2017 as compared to April 2016. The demand for the product has
been rising remarkably and during last five fiscals, it has grown at a CAGR of
30.9%. Tendency for using Petcoke as primary fuel or partially replacing coal with
it is gaining momentum among its end users due to its higher composition of
carbon relative to coal and therefore resultant calorific value. India is the
second largest Pet coke consuming country in Asia after China. This high growth
in the future seems untenable due to the recent embargo on use of petcoke by
the National Green Tribunal without authorization.
1.10 LDO: LDO consumption recorded a growth of 14.9% in the month of April,
2017. LDO month wise demand fluctuates depending on its requirement at
power plants for boiler restart as it trips. LDO is also extensively used in various
types of furnaces and any fluctuation in manufacturing activities leads to
fluctuation in its consumption.
*******
12.7% 14.0%
7.9%
11.8% 10.5%
15.4%
6.7%
9.7%
17.1% 18.8%
10.1% 10.4%
9.6%
0%
5%
10%
15%
20%
25%
150
250
350
450
550
650
Previous Year (TMT) Current Year (TMT) Monthly Growth (%)
12 | P a g e Industry Performance Review Report of PPAC: April, 2017 www.ppac.gov.in
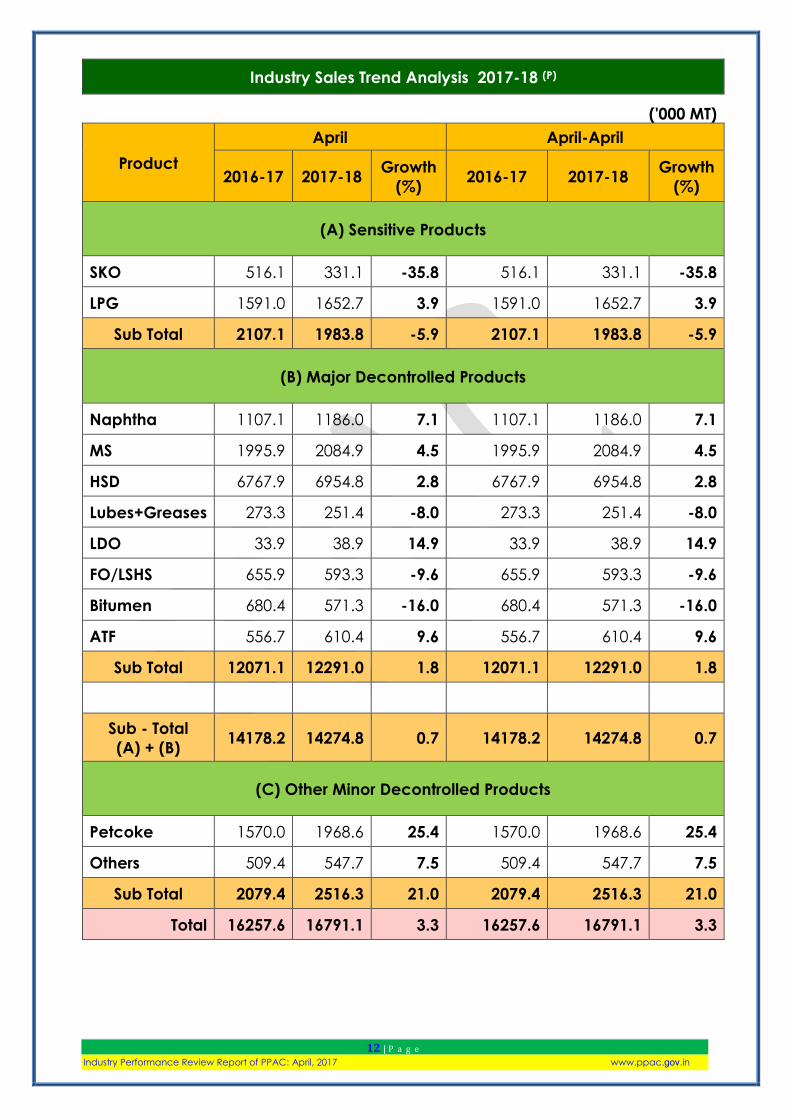
Industry Sales Trend Analysis 2017-18 (P)
('000 MT)
Product
April April-April
2016-17 2017-18 Growth
(%) 2016-17 2017-18
Growth
(%)
(A) Sensitive Products
SKO 516.1 331.1 -35.8 516.1 331.1 -35.8
LPG 1591.0 1652.7 3.9 1591.0 1652.7 3.9
Sub Total 2107.1 1983.8 -5.9 2107.1 1983.8 -5.9
(B) Major Decontrolled Products
Naphtha 1107.1 1186.0 7.1 1107.1 1186.0 7.1
MS 1995.9 2084.9 4.5 1995.9 2084.9 4.5
HSD 6767.9 6954.8 2.8 6767.9 6954.8 2.8
Lubes+Greases 273.3 251.4 -8.0 273.3 251.4 -8.0
LDO 33.9 38.9 14.9 33.9 38.9 14.9
FO/LSHS 655.9 593.3 -9.6 655.9 593.3 -9.6
Bitumen 680.4 571.3 -16.0 680.4 571.3 -16.0
ATF 556.7 610.4 9.6 556.7 610.4 9.6
Sub Total 12071.1 12291.0 1.8 12071.1 12291.0 1.8
Sub - Total
(A) + (B) 14178.2 14274.8 0.7 14178.2 14274.8 0.7
(C) Other Minor Decontrolled Products
Petcoke 1570.0 1968.6 25.4 1570.0 1968.6 25.4
Others 509.4 547.7 7.5 509.4 547.7 7.5
Sub Total 2079.4 2516.3 21.0 2079.4 2516.3 21.0
Total 16257.6 16791.1 3.3 16257.6 16791.1 3.3