industry sales review may 2017 -...
TRANSCRIPT

1 | P a g e Industry Performance Review Report of PPAC: May, 2017 www.ppac.gov.in
INDUSTRY SALES REVIEW
May 2017

2 | P a g e Industry Performance Review Report of PPAC: May, 2017 www.ppac.gov.in
This report analyses the trend of consumption of petroleum products in the
country during the month of May, 2017. Data on product-wise monthly
consumption of petroleum products for May, 2017 is uploaded on PPAC website
(www.ppac.gov.in).
1.0 CONSUMPTION :
The growth (%) in consumption of petroleum products, category-wise, for the
month of May, 2017 is given in Table-1.
Table-1: Petroleum Products Consumption (Quantity in TMT)
All Products : India’s consumption of petroleum products recorded a strong
growth in the month of May, 2017. The demand for all oil products rose to 17.8
MMT from 16.9 MMT a year ago. Bottom line growth in consumption of
petroleum products was recorded at 5.4 % during the month, mostly driven by a
growth in the use of LPG, MS, HSD, ATF and Petcoke. All other products recorded
a negative growth. SKO continued to register reduction in consumption and a
-33.5% drop was recorded during the month. It was mainly because of reduced
allocation to states and voluntary surrender of PDS SKO quota by some states.
On cumulative basis, a growth of 4.3% was recorded in consumption of all
petroleum products for the period April to May, 2017 as compared to April- May,
2016.
Figure-1: Comparison of monthly POL consumption (MMT) and growth (%) since April, 2016
10.3% 8.9%
11.5% 8.8%
18.2%
-0.8%
7.0% 9.3%
1.9%
-5.9% -3.1%
-0.6%
3.3% 5.4%
-10%
-5%
0%
5%
10%
15%
20%
10
12
14
16
18Previous Year (MMT) Current Year (MMT)
PRODUCT Share
(%) May 2016 May 2017
Growth
(%) Products Included
Sensitive Products 12.6% 2,129 2,137 0.4% SKO & LPG
Major decontrolled
Products 73.0% 12,315 13,144 6.7%
HSD, MS, Naphtha,
Lubes, LDO, FO/LSHS,
Bitumen & ATF
Minor decontrolled
Products 14.4% 2,428 2,510 3.4%
Pet. coke & other
minor products
Grand Total 100% 16,872 17,791 5.4%

3 | P a g e Industry Performance Review Report of PPAC: May, 2017 www.ppac.gov.in
Indian 'Sales Manage’rs Index' (SMI) for May 2017, released by London-based
World Economics, which produces data and analysis on the global economy,
reflects rapid growth in the Indian economy, and remains close to its all-time
high level. Business confidence is reflecting very buoyant "animal spirits ", and is
very high indeed compared with confidence in all other countries currently
measured by World Economics. The job market has rebounded close to its very
high pre-demonetization level and reflects the rapid growth indicated by the
SMI Market and Sales Indexes.
The Nikkei India Services Purchasing Managers' Index, or PMI, in India rose to 52.2
in May, 2017 from 50.2 in April, 2017. It was the fourth straight month of growth in
services activity and the strongest since October, 2016, supported by faster rises
in output and new business while employment growth was at near four-year
high. The Nikkei Manufacturing PMI in India fell to 51.6 in May, 2017 from 52.5 in
April, 2017. Fuel consumption is robust and growth is coming mainly from the
transportation sector.
The indices as mentioned above show that business conditions for India are
positive. Rapid economic growth is leading to greater output, which in turn is
increasing the demand of oil for production and transportation.
Figure-2 gives a comparison of percentage of monthly sales volumes of all
petroleum products by PSU and Private Oil companies since April, 2016.
Figure-2: Comparison of monthly POL Sales in PSU & Private Sector (%) since April, 2016
PPAC analyzes the sales recorded by the Industry on the basis of the data
available. Data on direct private imports received from DGCIS, which are
added to the final sales reported by oil companies for estimation of
consumption figures, are available up to March, 2017 and private imports data
for the months of April and May, 2017 are projected based on April, 2016 to
March, 2017 actual data provided by DGCIS.
0%
10%
20%
30%
40%
50%
60%
70%
80%
90%
100%PSU Sales Private Sales

4 | P a g e Industry Performance Review Report of PPAC: May, 2017 www.ppac.gov.in
Detailed product-wise analysis of growth for May, 2017 is given in the
following sections:
1.2 Petrol / Motor Spirit (MS): MS consumption during May, 2017 recorded a
robust growth of 15.3% as compared to May, 2016 and on cumulative basis, a
growth of 10.0% was recorded for the period April to May, 2017 as compared to
April to May 2016. With rising income levels, the demand for petrol driven
automobiles has increased which is the main driver for MS sales.
The factors affecting MS consumption during the month can be attributed
mainly to the following:
i. Continuous high growth in automobile industry in the country resulting in
increased number of vehicles on the roads has resulted in increased MS
consumption.
ii. Improved road connectivity, good weather conditions and school
vacations, pushing travel for tourism, has boosted MS sales in general.
iii. Price increment speculations towards the month end prompted the retail
outlet network to tank up the inventories at retail outlets which resulted in
advance shifting of MS sales from June to May 2017.
Figure 3 gives month-wise MS consumption volume (TMT) and month-on-month
growth (%) since April, 2016.
Figure-3: Month wise MS consumption (TMT) and growth (%) since April, 2016
11.9% 13.6%
4.4%
14.7%
24.9%
-3.4%
13.8% 14.3%
7.9%
-0.6%
3.1% 2.9%
4.5%
15.3%
-10%
-5%
0%
5%
10%
15%
20%
25%
30%
35%
0
500
1000
1500
2000
2500Previous Year (TMT) Current Year (TMT) Monthly Growth (%)

5 | P a g e Industry Performance Review Report of PPAC: May, 2017 www.ppac.gov.in
Other factors impacting consumption of MS are:
Passenger vehicle sales in India had crossed the three million milestone for the
first time in 2016-17. For the second month in the financial year 2017-18, sales of
most of the passenger vehicle manufacturers continued to grow in double
digits. The utility vehicle segment remained the focus of the buyers and was the
star attraction. Moreover, with the GST regime set to tax SUVs at a lower rate
compared to smaller cars, the SUV market is expected to boom.
Figure-4 gives a graphic representation of month-wise growth percentages of
Passenger Vehicles, Commercial Vehicles and 2-Wheelers since April, 2016.
Figure-4: Month-wise sales growth (%) of Indian Automobile Industry since April, 2016
a) Total passenger vehicles (PV) sales: At 251,642 units in May, 2017, the
passenger vehicle sales recorded a growth of 8.6% over May, 2016.
Passenger car sales rose by 4.8%, which was lower than the growth recorded
last month which could be attributed to some consumers delaying
purchases, particularly of SUVs, in view of the expected price reductions as a
result of GST kicking in from July 1, 2017. Surging consumer demand for SUVs
saw numbers grow by 18.8%. Reason for growth has been launch of new
models. May, 2017 also saw a recovery in growth in number of vans being
sold as an increase of 9.5% over May, 2016 sales was recorded.
Segment May 2016 May 2017 Growth (%)
Passenger Cars 158,996 166,630 4.8%
Utility Vehicles 58,793 69,845 18.8%
Vans 13,851 15,167 9.5%
Total: Passenger Vehicles (PVs) 231,640 251,642 8.6%
Source: SIAM
b) 2-wheeler sales: The two wheelers segment registered a growth of 11.9%, at
1,694,325 units during the month. The start of a bountiful monsoon season,
return of consumer sentiment and new models in two-wheeler segment
continued the uptick in 2-wheeler segment. Scooters sales witnessed a sharp
growth of 24.0% at 563,326 units. Motorcycles recorded a growth of 7.7% in
sales by selling 1,060,746 units while mopeds sales went down by -6.8%.
-30
-20
-10
0
10
20
30
Commercial PV 2-Wheelers
%ge Growth

6 | P a g e Industry Performance Review Report of PPAC: May, 2017 www.ppac.gov.in
Segment May 2016 May 2017 Growth (%)
Scooter / Scooterette 454,213 563,326 24.0%
Motor Cycles 984,715 1,060,746 7.7%
Mopeds 75,406 70,253 -6.8%
Total: 2-wheelers 1,514,334 1,694,325 11.9%
Source: SIAM
1.3 High Speed Diesel (HSD): HSD consumption went up by 8.0% to 7.51 million
tons for the month of May, 2017. On cumulative basis, a growth of 5.4% was
recorded for the period April to May 2017 as compared to the same period last
year. Improved economic activity, road conditions and economic viability of
public transport and carrier vehicles due to cheaper fuel resulted in improving
diesel sales.
Following were the major factors affecting diesel sales during the month:
i. Augmentation of STU fleet by State governments, improved road
connectivity, shifting of wedding season to the month of May, good
weather conditions and school vacations pushing travel for tourism has
boosted HSD sales during the month.
ii. Anticipated upward price revision that happened on 1st of June, 2017,
prompted retail outlet network to fill up their storage tanks and resulted
in the shift of sales from June to May.
iii. No rainfall and drought like conditions across southern India affecting
agricultural activity and stoppage of quarry operation in Kerala
adversely affected HSD sales.
Figure-5: Month-wise HSD consumption (TMT) and growth (%) since April, 2016
4.4% 8.1%
1.5%
1.8%
13.0%
-11.4%
5.2%
10.5%
1.2%
-7.7%
-3.9%
0.3%
2.8%
8.0%
-15%
-10%
-5%
0%
5%
10%
15%
0
1000
2000
3000
4000
5000
6000
7000
8000
Previous Year (TMT) Current Year (TMT) Monthly Growth (%)
7 | P a g e Industry Performance Review Report of PPAC: May, 2017 www.ppac.gov.in
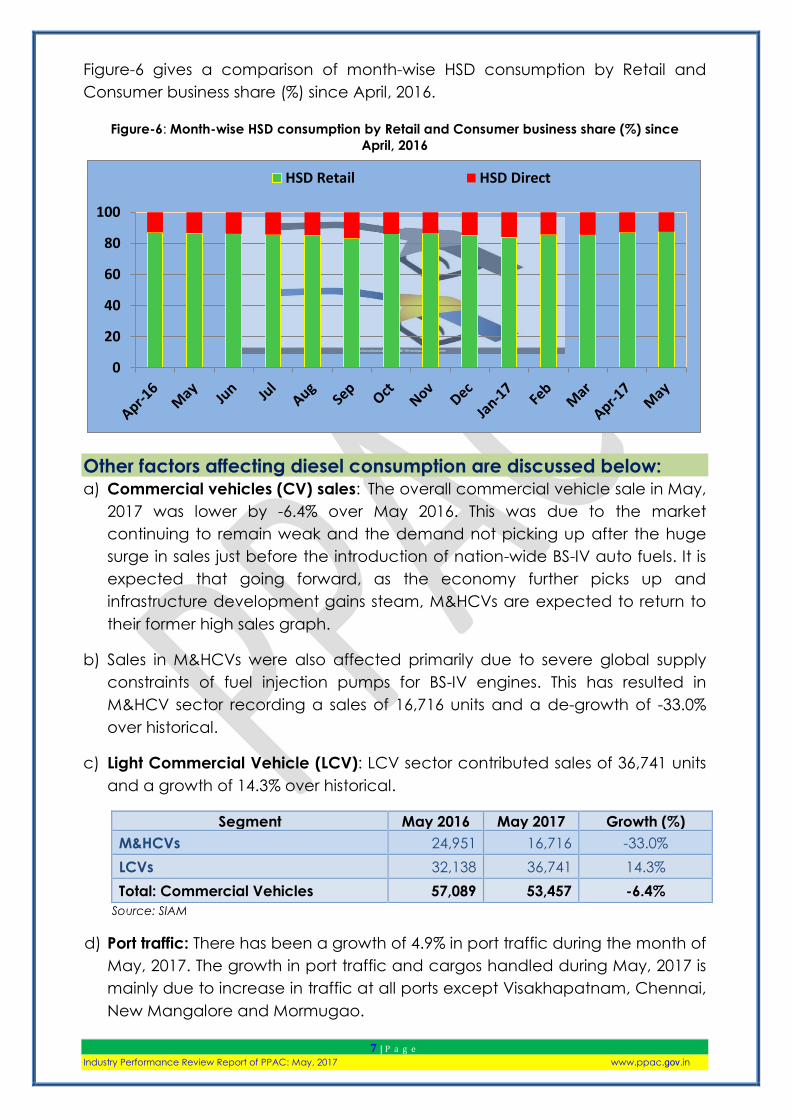
Figure-6 gives a comparison of month-wise HSD consumption by Retail and
Consumer business share (%) since April, 2016.
Figure-6: Month-wise HSD consumption by Retail and Consumer business share (%) since
April, 2016
Other factors affecting diesel consumption are discussed below:
a) Commercial vehicles (CV) sales: The overall commercial vehicle sale in May,
2017 was lower by -6.4% over May 2016. This was due to the market
continuing to remain weak and the demand not picking up after the huge
surge in sales just before the introduction of nation-wide BS-IV auto fuels. It is
expected that going forward, as the economy further picks up and
infrastructure development gains steam, M&HCVs are expected to return to
their former high sales graph.
b) Sales in M&HCVs were also affected primarily due to severe global supply
constraints of fuel injection pumps for BS-IV engines. This has resulted in
M&HCV sector recording a sales of 16,716 units and a de-growth of -33.0%
over historical.
c) Light Commercial Vehicle (LCV): LCV sector contributed sales of 36,741 units
and a growth of 14.3% over historical.
Segment May 2016 May 2017 Growth (%)
M&HCVs 24,951 16,716 -33.0%
LCVs 32,138 36,741 14.3%
Total: Commercial Vehicles 57,089 53,457 -6.4%
Source: SIAM
d) Port traffic: There has been a growth of 4.9% in port traffic during the month of
May, 2017. The growth in port traffic and cargos handled during May, 2017 is
mainly due to increase in traffic at all ports except Visakhapatnam, Chennai,
New Mangalore and Mormugao.
0
20
40
60
80
100
HSD Retail HSD Direct
8 | P a g e Industry Performance Review Report of PPAC: May, 2017 www.ppac.gov.in
There has been a cumulative growth of 5.6% in port traffic during the period
April to May 2017. Growth was registered specifically in iron ore (33.3%),
finished fertilizer(20.1%), raw fertilizer (15.0%), coking coal (12.7%), POL
products (6.0%), other liquids(6.4%), containers(6.4%), TEUs(8.2%)and others
(3.9%), while there has been a drop in thermal coal (-11.9%). High growth in
iron ore traffic is due to resumption of iron ore mining activities in Karnataka,
Goa and Odisha.
Table-2 below gives the port-wise performance during the month of May,
2017.
Table-2: Traffic handled at major ports in May, 2017
TRAFFIC HANDLED AT MAJOR PORTS (TMT)
PORTS May 2016 May 2017 Growth (%)
Kolkata + Haldia 4,115 4,658 13.2%
Paradip 6,792 8,864 30.5%
Visakhapatnam 5,575 5,067 -9.1%
Kamarajar (Ennore) 2,540 2,809 10.6%
Chennai 4,307 4,096 -4.9%
V.O. Chidambaranar 2,803 2,959 5.6%
Cochin 1,957 2,443 24.8%
New Mangalore 3,295 2,974 -9.7%
Mormugao 3,415 3,327 -2.6%
Mumbai 5,398 5,658 4.8%
JNPT 5,459 5,485 0.5%
Kandla 9,532 9,542 0.1%
TOTAL: 55,188 57,882 4.9% Source: IPA
e) Power situation improves: The power deficit position for the month of May, 2017
is given in Table-3. The power deficit position improved from -2.4% in May, 2016
to -0.6% in May, 2017. The shortage during the month improved for all regions.
The deficit continues mainly in the states of Jammu & Kashmir, Uttar Pradesh,
Rajasthan and Assam. The improved power position in May, 2017 may have led
to reduced usage of diesel for back-up power generation.
Table-3: Power deficit: Region-wise position for May, 2016 (% deficit)
States
May 2017 (P) May 2016
Requirement
(MU)
Available
(MU)
Deficit Deficit
(%) MU (%)
North 33,912 33,370 -542 1.6% -4.6%
West 32,615 32,581 -33 0.1% -0.3%
South 26,674 26,658 -16 -0.1% -1.9%
East 11,016 11,006 -9 -0.1% -1.1%
North-East 1,270 1,220 -50 -3.9% -15.6%
Total 105,486 104,835 -651 -0.6% -2.4% Source: Central Electricity Authority (CEA)
9 | P a g e Industry Performance Review Report of PPAC: May, 2017 www.ppac.gov.in
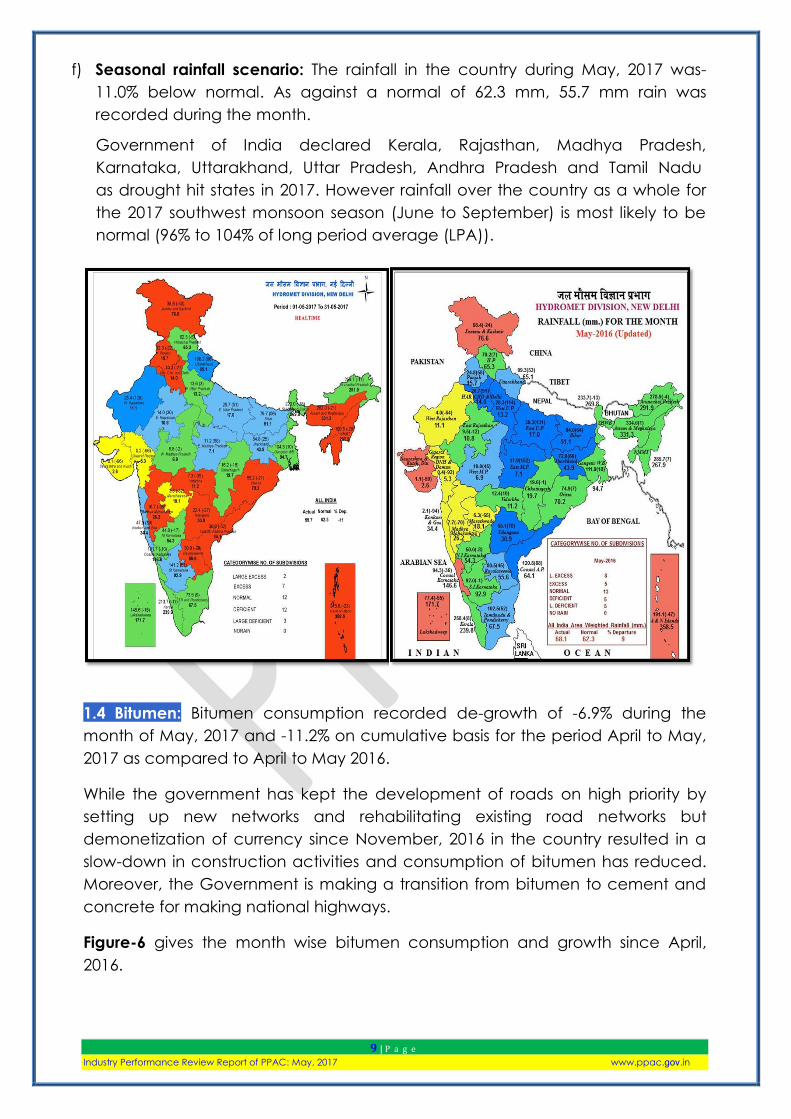
f) Seasonal rainfall scenario: The rainfall in the country during May, 2017 was-
11.0% below normal. As against a normal of 62.3 mm, 55.7 mm rain was
recorded during the month.
Government of India declared Kerala, Rajasthan, Madhya Pradesh,
Karnataka, Uttarakhand, Uttar Pradesh, Andhra Pradesh and Tamil Nadu
as drought hit states in 2017. However rainfall over the country as a whole for
the 2017 southwest monsoon season (June to September) is most likely to be
normal (96% to 104% of long period average (LPA)).
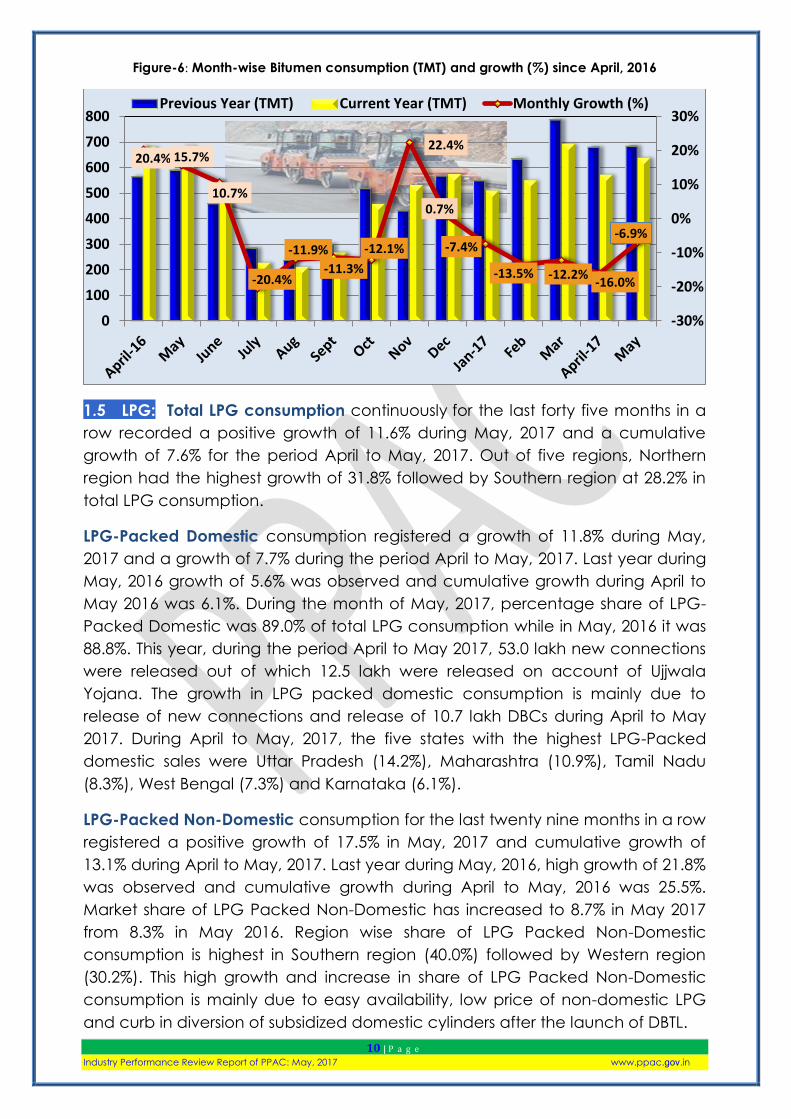
1.4 Bitumen: Bitumen consumption recorded de-growth of -6.9% during the
month of May, 2017 and -11.2% on cumulative basis for the period April to May,
2017 as compared to April to May 2016.
While the government has kept the development of roads on high priority by
setting up new networks and rehabilitating existing road networks but
demonetization of currency since November, 2016 in the country resulted in a
slow-down in construction activities and consumption of bitumen has reduced.
Moreover, the Government is making a transition from bitumen to cement and
concrete for making national highways.
Figure-6 gives the month wise bitumen consumption and growth since April,
2016.
10 | P a g e Industry Performance Review Report of PPAC: May, 2017 www.ppac.gov.in
Figure-6: Month-wise Bitumen consumption (TMT) and growth (%) since April, 2016
1.5 LPG: Total LPG consumption continuously for the last forty five months in a
row recorded a positive growth of 11.6% during May, 2017 and a cumulative
growth of 7.6% for the period April to May, 2017. Out of five regions, Northern
region had the highest growth of 31.8% followed by Southern region at 28.2% in
total LPG consumption.
LPG-Packed Domestic consumption registered a growth of 11.8% during May,
2017 and a growth of 7.7% during the period April to May, 2017. Last year during
May, 2016 growth of 5.6% was observed and cumulative growth during April to
May 2016 was 6.1%. During the month of May, 2017, percentage share of LPG-
Packed Domestic was 89.0% of total LPG consumption while in May, 2016 it was
88.8%. This year, during the period April to May 2017, 53.0 lakh new connections
were released out of which 12.5 lakh were released on account of Ujjwala
Yojana. The growth in LPG packed domestic consumption is mainly due to
release of new connections and release of 10.7 lakh DBCs during April to May
2017. During April to May, 2017, the five states with the highest LPG-Packed
domestic sales were Uttar Pradesh (14.2%), Maharashtra (10.9%), Tamil Nadu
(8.3%), West Bengal (7.3%) and Karnataka (6.1%).
LPG-Packed Non-Domestic consumption for the last twenty nine months in a row
registered a positive growth of 17.5% in May, 2017 and cumulative growth of
13.1% during April to May, 2017. Last year during May, 2016, high growth of 21.8%
was observed and cumulative growth during April to May, 2016 was 25.5%.
Market share of LPG Packed Non-Domestic has increased to 8.7% in May 2017
from 8.3% in May 2016. Region wise share of LPG Packed Non-Domestic
consumption is highest in Southern region (40.0%) followed by Western region
(30.2%). This high growth and increase in share of LPG Packed Non-Domestic
consumption is mainly due to easy availability, low price of non-domestic LPG
and curb in diversion of subsidized domestic cylinders after the launch of DBTL.
20.4% 15.7%
10.7%
-20.4%
-11.9%
-11.3%
-12.1%
22.4%
0.7%
-7.4%
-13.5% -12.2% -16.0%
-6.9%
-30%
-20%
-10%
0%
10%
20%
30%
0
100
200
300
400
500
600
700
800Previous Year (TMT) Current Year (TMT) Monthly Growth (%)

11 | P a g e Industry Performance Review Report of PPAC: May, 2017 www.ppac.gov.in
Bulk LPG consumption registered a negative growth of -20.6% during May, 2017
and a cumulative de-growth of -25.4% during the period April to May, 2017. Last
year in the month of May, 2016, growth of 21.9% and for the cumulative period
April to May, 2016, a growth of 26.2% was witnessed. Percentage share of bulk
LPG consumption has also decreased to 1.4% in May, 2017 as compared to 2.0%
in May, 2016.
Auto LPG consumption registered a growth of 12.5% in May, 2017 and
cumulative growth of 10.7% during April to May, 2017. The sales volume increase
was about 1.7 TMT in May 2017 as against May 2016. However, last year in the
month of May, 2016 a de-growth of -4.4% and cumulative de-growth of -4.3%
during April to May, 2016 was observed. Growth in Auto LPG consumption is
mainly due to it being nearly half the price of petrol. On 1st May, 2017, Auto LPG
price in Delhi was Rs. 34.05, while Petrol price was Rs.68.08, Diesel price was
Rs. 57.43 and CNG price was Rs. 38.15 (3rd May,2017). It is apparent from the
above that Auto LPG price was the cheapest.
Figure-6: Month-wise LPG consumption (TMT) and growth (%) since May, 2016
1.6 Naphtha: consumption recorded a de-growth of -1.2% for the month of
May, 2017 and a growth of 0.7% for the period April to May 2017 as compared
to April to May 2016. Petrochemical industries remain the main consumers of
naphtha in addition to minor consumers like fertilizer and power plants.
Fluctuation in demand of naphtha by the petrochemical industry (particularly
polymers and plastics) largely drives the growth in consumption.
7.5%
6.8% 8.2%
7.9%
18.7%
15.4%
9.6%
15.7%
7.6%
16.2%
3.5% 1.9%
3.9%
11.6%
-5%
0%
5%
10%
15%
20%
0
500
1000
1500
2000
Previous Year (TMT) Current Year (TMT) Monthly Growth (%)

12 | P a g e Industry Performance Review Report of PPAC: May, 2017 www.ppac.gov.in
1.7 ATF: ATF consumption recorded a growth of 10.7% for the month of May,
2017 as compared to May, 2016. On cumulative basis, for the period April to
May 2017, a growth of 10.0% was recorded as compared to the same period
last year.
The continued high growth in consumption of ATF has been mainly due to
growth in domestic passenger traffic. Passengers carried by domestic airlines
during May, 2017 were 101.74 lakhs as against 86.69 lakhs during May, 2016
thereby registering a growth of 17.4%.
India, the third largest domestic air travel market, is estimated to be on a high
growth trajectory. India's domestic air passenger traffic reached 100 million in
2016, behind only that of the US (719 million), China (436 million) and ahead of
Japan (97 million). Through the UDAN scheme, the government is further
facilitating affordable air travel as also to bring small cities and towns to the air
transport network.
Figure-7: Month-wise ATF consumption (TMT) and growth (%) since April, 2016
1.8 FO/LSHS: FO and LSHS consumption registered a de-growth of -1.9% during
May, 2017 as compared to May, 2016 and a de-growth of -5.8% was recorded
for the period April to May 2017 as compared to the same period last year. The
drop is due to decreased consumption of FO in power, steel and general trade
sectors. The consumption of LSHS has reduced due to shift to natural gas by
major customers like the fertilizer industry.
12.7% 14.0%
7.9%
11.8% 10.5%
15.4%
6.7%
9.7%
17.1%
18.8%
10.1% 10.4%
9.6% 10.7%
0%
5%
10%
15%
20%
25%
150
250
350
450
550
650
Previous Year (MMT) Current Year (MMT) Monthly Growth (%)

13 | P a g e Industry Performance Review Report of PPAC: May, 2017 www.ppac.gov.in
1.9 PETCOKE: Petcoke consumption registered a growth of 5.2% in the month
of May, 2017 as compared to May 2016 and on cumulative basis, a growth of
13.8% was registered for the period April to May, 2017. The demand for the
product has been rising remarkably and during the last five fiscals, it has grown
at a CAGR of 30.9%. Tendency for using petcoke as primary fuel or partially
replacing coal with it is gaining momentum among its end users due to its higher
composition of carbon relative to coal and resultant calorific value. India is the
second largest petcoke consuming country in Asia after China. Rising
infrastructure development and growing demand for automotive, steel and
cement consumption is fuelling demand for petcoke.
1.10 LDO: LDO consumption recorded a de-growth of -12.3% for the month of
May, 2017 and a minor growth of 0.9% for the period April to May, 2017 as
compared to the same period last year. LDO month wise demand fluctuates
depending on its requirement at power plants for boiler restart as it trips. LDO is
also extensively used in various types of furnaces and any fluctuation in
manufacturing activities leads to fluctuation in its consumption.
*******

14 | P a g e Industry Performance Review Report of PPAC: May, 2017 www.ppac.gov.in
Industry Consumption Trend Analysis 2017-18 (P)
('000 MT)
Product
May April-May
2016-17 2017-18 Growth
(%) 2016-17 2017-18
Growth
(%)
(A) Sensitive Products
SKO 530.4 352.8 -33.5 1046.5 683.9 -34.6
LPG 1598.9 1784.1 11.6 3189.9 3432.7 7.6
Sub Total 2129.3 2136.9 0.4 4236.4 4116.6 -2.8
(B) Major Decontrolled Products
Naphtha 1083.6 1070.9 -1.2 2190.7 2206.6 0.7
MS 2082.8 2402.4 15.3 4078.7 4487.0 10.0
HSD 6957.6 7513.3 8.0 13725.5 14467.2 5.4
Lubes+Greases 291.2 259.6 -10.8 564.5 501.4 -11.2
LDO 36.0 31.6 -12.3 69.9 70.5 0.9
FO/LSHS 608.5 597.0 -1.9 1264.4 1191.0 -5.8
Bitumen 684.3 636.9 -6.9 1364.8 1211.5 -11.2
ATF 571.1 632.2 10.7 1127.8 1241.1 10.0
Sub Total 12315.1 13143.9 6.7 24386.3 25376.3 4.1
Sub - Total
(A) + (B) 14444.4 15280.8 5.8 28622.7 29492.9 3.0
(C) Minor Decontrolled Products
Pet.Coke 1898.4 1997.6 5.2 3468.4 3946.1 13.8
Others 529.7 512.2 -3.3 1039.1 1104.5 6.3
Sub Total 2428.0 2509.8 3.4 4507.4 5050.6 12.0
Total 16872.4 17790.6 5.4 33130.1 34543.5 4.3