inequalities in learning among brazilian public school...
TRANSCRIPT

SÉRIE
Debates EDNº5 – Abril de 2017
ISSN 2236-2843
Inequalities in learningamong Brazilian public
school students:Prova Brasil
evidence (2007 to 2013)
Education
United NationsEducational, Scientific and
Cultural Organization
BrasiliaOffice

SÉRIE
Debates EDNº5 – Abril de 2017
ISSN 2236-2843
Education
Inequalities in learningamong Brazilian public
school students:Prova Brasil
evidence (2007 to 2013)
United NationsEducational, Scientific and
Cultural Organization
BrasiliaOffice

Published in 2017 by the United Nations Educational, Scientific and Cultural Organization, 7, place de Fontenoy, 75352 Paris 07 SP, France and the UNESCO Office in Brazil.
© UNESCO 2017
BR/2017/PI/H/2 REV.
This publication is available in Open Access under the Attribution-ShareAlike 3.0 IGO (CC-BY-SA 3.0 IGO) license (http://creativecommons.org/licenses/by-sa/3.0/igo/). By using the content of this publication, the users accept to be bound by the terms of use of the UNESCO Open Access Repository (http://www.unesco.org/open-access/terms-use-ccbysa-en).
Original title: Desigualdades de aprendizado entre alunos das escolas públicas brasileiras: evidências da Prova Brasil (2007 a 2013), published by UNESCO and the UNESCO Office in Brazil, Brasilia, 2017
The designations employed and the presentation of material throughout this publication do not imply the expression of any opinion whatsoever on the part of UNESCO concerning the legal status of any country, territory, city or area or of its authorities or concerning the delimitation of its frontiers or boundaries.
The ideas and opinions expressed in this publication are those of the authors and are not necessarily those of UNESCO and do not commit the Organization.
Research Team: Maria Teresa Gonzaga Alves and Flavia Pereira Xavier (coordinators), Laura Engler Barbosa and Bruna de Figueiredo Caldeira (NUPEDE/FE/UFMG)Research Collaboration: José Francisco Soares, retired professor (FE/UFMG)Technical Coordination: Marlova Jovchelovitch Noleto, Representative a.i. of UNESCO in Brazil and Deputy Director for ProgrammeTechnical Review: Maria Rebeca Otero Gomes and Carla Nascimento, Education Sector at UNESCO Office in BrazilDesign, layout and Proofreading: Unit of Communications, Public Information and Publications (UCIP) at UNESCO Office in Brasil

L I S T O F T A B L E S
Table 1 – Number of students per schools and grade by Prova Brasil edition
Table 2 – Proportion of students by learning levels in Reading according to grade and Prova Brasil edition
Table 3 – Proportion of students by learning levels in Mathematics according to grade and Prova Brasil edition
Table 4 – Proportion of students below basic level in Reading according to the Prova Brasil edition by federative unit and grade
Table 5 – Proportion of students below basic level in Mathmatics according to the Prova Brasil edition by federative unit and grade
Table 6 – Proportion of students by learning levels in Reading according to gender by grade and Prova Brasil edition
Table 7 – Proportion of students by learning levels in Mathematics according to gender by grade and Prova Brasil edition
Table 8 – Proportion of students by learning levels in Reading according to race by grade and Prova Brasil edition
Table 9 – Proportion of students by learning levels in Mathematics according to race by grade and Prova Brasil edition
Table 10 – Proportion of students by learning levels in Reading according to educational lag by grade and Prova Brasil edition
Table 11 – Proportion of students by learning levels in Mathematics according to educational lag by grade and Prova Brasil edition
Table 12 – Proportion of students by learning levels in Reading according to SES quartiles by grade and Prova Brasil edition
Table 13 – Proportion of students by learning levels in Mathematics according to SES quartiles by grade and Prova Brasil edition
Table 14 – Proportion of students by learning levels in Reading according to percentiles of the “reading habits” factor by grade and Prova Brasil edition
Table 15 – Proportion of students by learning levels in Mathematics according to percentiles of the “reading habits” factor by grade and Prova Brasil edition
Table 16 – Proportion of students by learning levels in Reading according to percentiles of the “parent involvement” factor by grade and Prova Brasil edition
Table 17 – Proportion of students by learning levels in Mathematics according to percentiles of the “parent involvement” factor by grade and Prova Brasil edition
Table 18 – Average for the “administrative leadership” factor by learning levels in Reading according to grade and Prova Brasil edition
Table 19 – Average for the “administrative leadership” factor by learning levels in Mathematics according to grade and Prova Brasil edition
Table 20 – Average for the “pedagogical leadership” factor by learning levels in Reading according to grade and Prova Brasil edition
Table 21 – Average for the “pedagogical leadership” factor by learning levels in Mathematics according to grade and Prova Brasil edition

Table 22 – Average for the “participative management” factor by learning levels in Reading according to grade and Prova Brasil edition
Table 23 – Average for the “participative management” factor by learning levels in Mathematics according to grade and Prova Brasil edition
Table 24 – Average for the “human resources” factor by learning levels in Reading according to grade and Prova Brasil edition
Table 25 – Average for the “human resources” factor by learning levels in Mathematics according to grade and Prova Brasil edition
Table 26 – Average for the proportion of principals with a teaching license by learning levels in Reading according to grade and Prova Brasil edition
Table 27 – Average for the proportion of principals with a teaching license by learning levels in Mathematics according to grade and Prova Brasil edition
Table 28 – Average for the proportion of principals with postgraduate studies by learning levels in Reading according to grade and Prova Brasil edition
Table 29 – Average for the proportion of principals with postgraduate studies by learning levels in Mathematics according to grade and Prova Brasil edition
Table 30 – Average for the proportion of principals who underwent continuing education by learning levels in Reading according to grade and Prova Brasil edition
Table 31 – Average for the proportion of principals who underwent continuing education by learning levels in Mathematics according to grade and Prova Brasil edition
Table 32 – Average for the “principal’s experience” factor by learning levels in Reading according to grade and Prova Brasil edition
Table 33 – Average for the “principal’s experience “ factor by learning levels in Mathematics according to grade and Prova Brasil edition
Table 34 – Average for the “cohesion of the pedagogical team” factor by learning levels in Reading according to grade and Prova Brasil edition
Table 35 – Average for the “cohesion of the pedagogical team” factor by learning levels in Mathematics according to grade and Prova Brasil edition
Table 36 – Average for the “school operating conditions” factor by learning levels in Reading according to grade and Prova Brasil edition
Table 37 – Average for the “school operating conditions “ factor by learning levels in Mathematics according to grade and Prova Brasil edition
Table 38 – Average for the “intervention for improvements” factor by learning levels in Reading according to grade and Prova Brasil edition
Table 39 – Average for the “intervention for improvements” factor by learning levels in Mathematics according to grade and Prova Brasil edition
Table 40 – Average for the “school violence” factor by learning levels in Reading according to grade and Prova Brasil edition
Table 41 – Average for the “school violence“ factor by learning levels in Mathematics according to grade and Prova Brasil edition
Table 42 – Average for the “educational resources – ICT” factor by learning levels in Reading according to grade and Prova Brasil edition
Table 43 – Average for the “educational resources – ICT” factor by learning levels in Mathematics according to grade and Prova Brasil edition
Table 44 – Average for the “printed educational resources” factor by learning levels in Reading according to grade and Prova Brasil edition
Table 45 – Average for the “printed educational resources” factor by learning levels in Mathematics according to grade and Prova Brasil edition
Table 46 – Average for the “educational resources – Portuguese” factor by learning levels in Reading according to grade and Prova Brasil edition
Table 47 – Average for the “educational resources – Mathematics” factor by learning levels in Mathematics according to grade and Prova Brasil edition
Table 48 – Average for the “school curriculum” factor by learning levels in Reading according to grade and Prova Brasil edition

Table 49 – Average for the “school curriculum” factor by learning levels in Mathematics according to grade and Prova Brasil edition
Table 50 – Average for the “teacher’s experience” factor by learning levels in Reading according to grade and Prova Brasil edition
Table 51 – Average for the “teacher’s experience” factor by learning levels in Mathematics according to grade and Prova Brasil edition
Table 52 – Average for the proportion of teachers with a teaching license by learning levels in Reading according to grade and Prova Brasil edition
Table 53 – Average for the proportion of teachers with a teaching license by learning levels in Mathematics according to grade and Prova Brasil edition
Table 54 – Average for the “facilities” factor by learning levels in Reading according to grade and Prova Brasil edition
Table 55 – Average for the “facilities” factor by learning levels in Mathematics according to grade and Prova Brasil edition
Table 56 – Average for the “library” factor by learning levels in Reading according to grade and Prova Brasil edition
Table 57 – Average for the “library” factor by learning levels in Mathematics according to grade and Prova Brasil edition
Table 58 – Average for the “equipment” factor by learning levels in Reading according to grade and Prova Brasil edition
Table 59 – Average for the “equipment” factor by learning levels in Mathematics according to grade and Prova Brasil edition
Table 60 – Average for the “maintenance of school building” factor by learning levels in Reading according to grade and Prova Brasil edition
Table 61 – Average for the “maintenance of school building” factor by learning levels in Mathematics according to grade and Prova Brasil edition
Table 62 – Distribution of schools by type of trajectory according to the effects 1 and 2 in Reading and Mathematics
Table 63 – Average for effects 1 in Reading by Prova Brasil edition according to federative unit by type of educational offering
Table 64 – Average for effects 2 in Reading by Prova Brasil edition according to federative unit by type of educational offering
Table 65 – Average for effects 1 in Mathematics by Prova Brasil edition according to federative unit by type of educational offering
Table 66 – Average for effects 2 in Mathematics by Prova Brasil edition according to federative unit by type of educational offering
Table 67 – Average for effects 1 and 2 in Reading and Mathematics according to state capitals in the 2013 Prova Brasil edition
Table 68 – Average for effects 1 and 2 in Reading and Mathematics according to municipalities in the 2013 Prova Brasil edition
Table 69 – Linear correlation coefficients and determination coefficients among the school factors and effects 1 and 2 of schools for Reading and Mathematics
Table 70 – Estimated coefficients of multinomial hierarchical regression models

L I S T O F G R A P H S
Graphic 1 – Descriptive measures of the effects 1 and 2 in Reading according to the Prova Brasil editionGraphic 2 – Descriptive measures of the effects 1 and 2 in Mathematics according to the Prova Brasil editionGraphic 3 – Average of effects 1 and 2 in Reading and Mathematics according to the quartiles for administrative leadershipGraphic 4 – Average of effects 1 and 2 in Reading and Mathematics according to the quartiles for pedagogical leadershipGraphic 5 – Average of effects 1 and 2s in Reading and Mathematics according to the quartiles for participatory managementGraphic 6 – Average of effects 1 and 2 in Reading and Mathematics according to the quartiles for human resourcesGraphic 7 – Average of effects 1 and 2 in Reading and Mathematics according to the quartiles for principal’s experience variableGraph 8 – Average of effects 1 and 2 in Reading and Mathematics according to the principal’s experience variableGraphic 9 – Average of effects 1 and 2 in Reading and Mathematics according to the principal’s graduate education variableGraphic 10 – Average of effects 1 and 2 in Reading and Mathematics according to the principal’s continuing education variableGraphic 11 – Average of effects 1 and 2 in Reading and Mathematics according to the quartiles for cohesion of the pedagogical teamGraphic 12 – Average of effects 1 and 2 in Reading and Mathematics according to the quartiles for school operating conditionsGraphic 13 – Average of effects 1 and 2 in Reading and Mathematics according to the quartiles for improvement interventionsGraphic 14 – Average of effects 1 and 2 in Reading and Mathematics according to the quartiles for school violenceGraphic 15 – Average of effects 1 and 2 in Reading and Mathematics according to the quartiles for the use of educational resources – ICTGraphic 16 – Average of effects 1 and 2 in Reading and Mathematics according to the quartiles for the use of printed resourcesGraphic 17 – Average of effects 1 and 2 in Reading and Mathematics according to the quartiles for the use of educational resources – PortugueseGraphic 18 – Average of effects 1 and 2 in Reading and Mathematics according to the quartiles for the use of educational resources – MathematicsGraphic 19 – Average of effects 1 and 2 in Reading and Mathematics according to the quartiles for school curriculumGraphic 20 – Average of effects 1 and 2 in Reading and Mathematics according to the quartiles for teacher trainingGraphic 21 – Average of effects 1 and 2 in Reading and Mathematics according to the quartiles for teacher’s experienceGraphic 22 – Average of effects 1 and 2 in Reading and Mathematics according to the quartiles for facilitiesGraphic 23 – Average of effects 1 and 2 in Reading and Mathematics according to the quartiles for librariesGraphic 24 – Average of effects 1 and 2 in Reading and Mathematics according to the quartiles for equipmentGraphic 25 – Average of effects 1 and 2 in Reading and Mathematics according to the quartiles for school building maintenance

L I S T O F C H A R T S
Chart 1 – Definition of the learning levels according to the scores obtained by students in Reading and Mathematics on the SAEB scale
Chart 2 – Explanatory variables included in the hierarchical multinomial regression models

T A B L E O F C O N T E N T S
I. Introduction ......................................................................................................................................................... 11
II. Analytical approach ................................................................................................................................................ 13
III. The data ................................................................................................................................................................ 18
IV. Learning levels and the associated factors .............................................................................................................. 20
A. Methodology ................................................................................................................................................. 20
B. Distribution of students by learning levels in Brazil and in the federative units ................................................. 21
C. Distribution of students by learning levels according to discriminanting characteristics and student factors ..... 25
C.1 Gender ................................................................................................................................................... 25
C.2 Race ....................................................................................................................................................... 27
C.3 Lag ......................................................................................................................................................... 29
C.4 Socioeconomic status (SES) ..................................................................................................................... 31
C.5 Reading habits ....................................................................................................................................... 33
C.6 Parent involvement ................................................................................................................................. 35
D. Description of school factors according to students’ learning levels ................................................................. 37
D.1 School leadership ................................................................................................................................... 38
D.1.1 Administrative leadership ................................................................................................................... 38
D.1.2 Pedagogical leadership....................................................................................................................... 39
D.1.3 Participative management .................................................................................................................. 40
D.1.4 Human resources ............................................................................................................................... 41
D.1.5 School Principal’s education ............................................................................................................... 42
D.1.6 School Principal’s experience .............................................................................................................. 45
D.2 School environment ............................................................................................................................... 46
D.2.1 Cohesion of the pedagogical team ..................................................................................................... 47
D.2.2 School operating conditions ............................................................................................................... 48
D.2.3 Intervention for improvements ........................................................................................................... 49
D.2.4 School violence .................................................................................................................................. 50
D.3 Teaching and teacher characteristics ....................................................................................................... 51
D.3.1 Educational resources – ICT ................................................................................................................ 52
D.3.2 Printed educational resources............................................................................................................. 53
D.3.3 Educational resources – Portuguese ................................................................................................... 54
D.3.4 Educational resources – Mathematics ................................................................................................. 54
D.3.5 School curriculum .............................................................................................................................. 55
D.3.6 Teacher’s experience .......................................................................................................................... 56
D.3.7 Initial teacher education ..................................................................................................................... 57
D.4 School infrastructure .............................................................................................................................. 58
D.4.1 Facilities ............................................................................................................................................. 58
D.4.2 Library ............................................................................................................................................... 59
D.4.3 Equipments ....................................................................................................................................... 60
D.4.4 Maintenance of school building ......................................................................................................... 61

V. School effects and associated factors ...................................................................................................................... 63
A. Methodology ................................................................................................................................................. 63
B. School effects by Prova Brasil edition .............................................................................................................. 66
C. Trajectories of the school effects: 2007 to 2013 .............................................................................................. 68
D. School effects per Brazilian state and Prova Brasil edition ................................................................................ 69
E. School effects per capital city: 2013 ............................................................................................................... 73
F. School effects per municipality: 2013 ............................................................................................................. 74
G. Description of school effects per school factor ................................................................................................ 75
G.1 School effects according to school leadership factors .............................................................................. 76
G.2 School effects according to school environment factors .......................................................................... 80
G.3 School effects according to the characterization of teaching and teachers factors ................................... 83
G.4 School effects according to school infrastructure factors ......................................................................... 87
H. Linear correlation between the school effects and school factors .................................................................... 90
I. Coefficients of the multinomial hierarchical regression model ......................................................................... 91
VI. Final considerations ................................................................................................................................................ 94
Bibliographic references ............................................................................................................................................... 98
Appendixes ............................................................................................................................................................... 102
Appendix A: Register of items that constitute each student factor and school factors ................................................. 102
Appendix B: Equations for the multinomial hierarchical regression models .................................................................. 112
Appendix C: Average and standard deviation of the effects 1 and 2 in Reading
and Mathematics according to the Prova Brasil editions .......................................................................... 116

I. Introduction1
1. The coordinators would like to thank Researcher Carlos Alexandre Silva (FE/UFMG) for his collaboration on this study.
This work presents the results of a study whose
main objective was to analyze the phenomenon
of intra-school exclusion at Brazilian public
schools. Intra-school exclusion is an empirical
concept that we propose in order to characterize
the situation of a student, who although
enrolled in a school, has still not learned the
Mathematic and Reading competencies for the
level associated with the grade he is in (SOARES
et al., 2012). Contrary to being a merely individual
question, the non-learning of this student can
reflect a social problem, mostly when it is linked,
with greater frequency, to specific groups of
students possessing certain sociodemographic
characteristics, such as area of residence, social
origin, gender, race, for example.
The types of exclusion that refer to the
access children and young people have to an
education, along with dropout, are also central
themes explored by educational studies. Such
research shows that those groups suffering
social disadvantage are more susceptible
to difficulties regarding access and drop
out. During elementary education, school
attendance is almost universal – 98.3% of
children and young people between the
ages of 6 and 14 attended school in 2014 –,
however, attendance by children between the
ages of 4 and 5 (early childhood education)
and young people between the ages of 15 and
17 (upper secondary education/high school) is
still a challenge, as are regional disparities are.
Another challenge is related to dropout. The
largest rates of dropout throughout all of basic
education are concentrated in the first year
of upper sencondary education and are more
prevalent in the North and Northeast regions of
Brazil (TODOS PELA EDUCAÇÃO, 2015). All of
these challenges still need to be overcome.
Although these forms of school exclusion
are central to public policy, we opted to deal
with an equally important phenomenon that
educational research often explores much
less, which we call intra-school exclusion.
The interest in studying this problem came
about from the understanding that intra-
school exclusion constitutes a form of deniying
the right to education, which should be
guaranteed to all students. That is, the right to
basic education should be interpreted not only
as the access and permanence of children and
young people in school, but also as the right of
all the students that enroll in the educational
system to learn the abilities that are necessary
11
SÉRI
E D
ebat
es E
D

2. Guaranteeing the right to education and to learning is stated in the Universal Declaration of Human Rights (NAÇÕES UNIDAS, 1948), in article No. 205 of the Brazilian Constitution (BRASIL, 1988), in the Convention on the Rights of the Child (UNICEF, 1989), in article 53 of the Child and Adolescent Statute (BRASIL, 1990), in the World Declaration on Education for All (UNESCO, 1990), in article 2 of the National Education Guidelines and Framework Law (BRASIL, 1996), in the Dakar Framework (UNESCO, 2000) and, more recently, in Goal 7 of the Brazilian National Education Plan (BRASIL, 2014) and in the Incheon Declaration – Education 2030: Towards inclusive and equitable quality education and lifelong learning for all (UNESCO, 2015).
3. The Center for Studies of Educational Inequalities (NUPEDE/FE/UFMG) elaborated a first study, which was published by UNESCO in 2012.
for a full life as a citizen.2 In order to verify
if this right is being fulfilled, it is important
that the Brazilian society know whether or not
each Brazilian student has reached a certain
learning level, in accordance with the result
expected for the educational phase in which
that student is currently found.
Over the past decades, Brazil has made great
advances in guaranteeing access to school,
mainly in the elementary school age group.
On the other hand, data from educational
evaluations conducted throughout the country
over the past 20 years show that many students
did not reach the learning level that is compatible
with their stage of education. This could cause
serious consequences to the student’s trajectory
and also to the school system.
Finding out who these students are, where
they are and how the schools they attend
function might guide public policies in order
to intervene in this problem. That is main goal
of this study.
This work was initially conceived as a way to
provide continuity to an investigative program
on the phenomenon of intra-school exclusion
conducted in the sphere of the same research
group (SOARES et al., 2012).3 Based on this
reference, this study incorporated more recent data
and original empirical approaches. This publication
is organized into five sections: the first section
presents the analytical approach, which includes
the justification for defining the proficiency levels
that were used to analyze the data. The second
section presents the empirical data used. The
third section discussed the methodology and
the results from the estimation of school factors
and in this those related to the student profiles
associated to learning. In this sphere, we describe
the relationships between learning levels in
Mathematics and Reading and these factors.
The fourth section presents the hierarchical
multinomial regression models adjusted in order to
estimate schools effects. In this same section, we
additionally analyze the relationship between the
school effects and school factors and, also, there
is also an investigation of the impact of student
and family characteristics on a child’s chances of
ending up in a situation of school exclusion or of
obtaining an adequacy of learning. Finally, the last
section brings a group of findings from this study
by way of indicating possibilities for educational
public policies.
We could not finalize this introduction
without expressing our thanks to the UNESCO
Representation in Brazil, for the support offered
to carry out this study. We would especially like
to acknowledge Maria Rebeca Otero Gomes,
Coordinator of the Education Sector at UNESCO,
and Carla Nascimento, Programme Officer of
the Education Sector, our direct contact person,
who, through meticulous readings of the
partial versions of this study, provided us with
innumerable valuable suggestions that enabled
us to improve this publication. Obviously, any
shortcomings that remained in this work is the
responsibility of the authors, who are open to
and interested in receiving critical comments
from anyone reading this study.
12
SÉRI
E D
ebat
es E
D

II. Analytical approach
4. Information about the SAEB can be obtained on the INEP website, at: <http://portal.inep.gov.br/web/saeb/aneb-e-anresc>. Accessed on: Jul. 2015. More details on the Prova Brasil and the ANEB are in section “III. The data”.
The large scale educational evaluations
conducted by the Anísio Teixeira National Institute
for Educational Studies and Research (Instituto Nacional de Estudos e Pesquisas Educacionais Anísio Teixeira – INEP) serve as an instrument
society may use to verify the extent of learning
– which composes the right to education. The
Brazilian National System for the Evaluation of
Basic Education (Sistema de Avaliação da Educação Básica – SAEB), instituted since 1990, gives the
most ample diagnosis of learning in important
stages during the educational trajectory. Currently,
the SAEB is constituted by the Brazilian National
Evaluation of Basic Education (Avaliação Nacional de Educação Básica – ANEB), the Brazilian National
Evaluation of School Performance (Avaliação Nacional de Rendimento Escolar – ANRESC)
– better known as Prova Brasil – the Brazilian
National Assessment of Literacy (Avaliação Nacional da Alfabetização – ANA).4
Despite the available data, the intra-
school exclusion phenomenon is not totally
incorporated into the Brazilian public debate
when dealing with the area of education. In
general, public policies, the press, the schools
themselves and their educational managers have
increasingly emphasized the averages gauged
on tests and in the ranking among teaching
establishments as evidence of the teaching
quality being administered by the schools.
The introduction of the Basic Education
Development Index (Índice de Desenvolvimento da Educação Básica – IDEB) , which summarizes two
measurements (the average of school performance
and the average approval rate for passing) into one
average, reinforced this tendency. If on one hand
the IDEB works as a “thermometer” measuring
the quality of education expressed in a simple
number (SOARES; XAVIER, 2013), then on the
other hand, the index does not point to possible
inequalities subsumed in the indicator’s value.
This takes place because the arithmetic mean
is a statistic that is very sensitive to the presence
of extreme values. Therefore, it is possible for
a school to obtain a reasonable mean on the
IDEB only because some of its students had
especially high scores, fruit of their personal
characteristics and also from access to better
schooling conditions (SOARES; XAVIER, 2013).
This sometimes arises from segregation strategies
within one school in order to guarantee that the
more apt students study in a more select academic
environment (ALVES; SOARES, 2007). Or in other
words, implicitly, it is acceptable that the good
13
SÉRI
E D
ebat
es E
D

5. PISA is an international comparative assessment, applied to students at 15 years of age, a time when it is assumed that the student has finalized the mandatory basic schooling in most countries. Information about this assessment and the performance levels is available at: <http://portal.inep.gov.br/pisa-programa-internacional-de-avaliacao-de-alunos>. Accessed: Sept. 2015.
6. This information is available at the Portal for the Evaluation of the Public Policies Center and Educational Evaluation (CAED) of the Federal University of Juiz de Fora (UFJF). Available at: <http://www.portalavaliacao.caedufjf.net/>. Accessed: Sept. 2015.
performance of one student compensate for the
bad performance of another. The perverse effect
of this is the increase in inequality among students
in addition to greater intra-school exclusion.
Another problem is the how the averages
are interpreted. Through an external evaluation,
such as the SAEB, what would the value of a
good average be? This is not obvious and an
improved average does not always mean that
the schooling is better. For example, considering
two subsequent editions of the Prova Brasil, it is
possible that one school might present better
averages from one edition to the next. However,
this improvement could have happened in an
interval of low values on the proficiency scale. Or,
the increase in averages might have happened
without the students’ performance having
reached the desired level for the schooling stage
they were in.
The solution adopted for this work in order
to describe and analyze the phenomenon of
intra-school exclusion consisted of interpreting
the results of students according to proficiency
levels. These levels classify the values that were
originally in a continuous scale by putting them
into a specific range of values. Additionally,
the proficiency levels may be interpreted in
a normative manner in order to indicate the
abilities and skills the students have, or were
expected to have, for each level.
International literature has a significant
production on the use of proficiency levels or
performance standards in order to analyze learning
among students (ANGOFF, 1971; BEATON; ALLEN,
1992; CIZEK, 2001). This perspective is adopted,
for example, in the Programme for International
Student Assessment (PISA)5 – a comparative
educational evaluation that Brazil participates in –,
that uses six or seven proficiency levels, depending
on the area under evaluation, in order to interpret
the results. On the PISA, values that are below
level 2 are undesirable since they denote a very
low learning level regarding abilities and skills
compatible with basic education.
In Brazil, many of the educational evaluations
that are conducted throughout states and
municipalities adopt performance levels or
standards. For example, the Permanent System
for the Evaluation of Basic Education of Ceará
(Sistema Permanente de Avaliação da Educação Básica do Ceará – SPAECE) publishes results
according to four performance standards: very
critical, critical, intermediate and adequate.
In Minas Gerais, the Basic Education Public
Network Evaluation Program (Programa de Avaliação da Rede Pública de Educação Básica –
PROEB) has three performance standards: low,
intermediate and recommended.6 This way,
evaluators expect student results to be more
easily understood and appropriated by school
managers, teachers and other community
members (FONTANIVE, 2013).
However, in order to analyze the national
results, the Ministry of Education (MEC) does not
have an official recommendation on the desired
performance levels for students participating
in the evaluations that compose the SAEB. The
Prova Brasil and ANEB results, for example, are
published on a continuous scale that varies from 0
to 500. These amounts result from transforming
scores, originally estimated on a standard
deviation scale, for positive whole values. In
order to understand the meaning of these
numbers, a description is provided regarding the
content of Portuguese classes (or Reading) and
Mathematics classes that the students probably
master, according to levels on the proficiency
scale ordered in intervals of 50 points.
14
SÉRI
E D
ebat
es E
D

7. These two groups coincide with the proficiency levels set according to educational concerns by the “All for Education Movement” – a civil society organization –, that adopted student learning expectations for each grade that is evaluated by the SAEB/Prova Brasil. Both the expectations and the goal monitoring of the Movement are available at: <http://www.todospelaeducacao.org.br/>. Accessed: Sept. 2015.
For the 5th grade of elementary level education,
the Reading scale is sectioned into nine levels and
Mathematics into ten levels. For 9th grade, the
Reading scale has eight levels and Mathematics
nine. The number of levels is defined by technical
criteria, based on an analysis of the students’
empirical results. However, even though a clear
accumulative perspective of these levels exists in
terms of the complexity of the expected learning
levels, there is no normative interpretation for
them, as in the PISA.
However, in 2014, the National Education Plan
(Plano Nacional da Educação – PNE), 2014-2024
(BRASIL, 2014), approved, among the Goal 7
strategies – that establish the adequate learning
level for a certain age as the goal to be reached
during that decade – two strategies that clearly
refer to the desired learning level:
7.2.a – Learning level up to 5th grade
of the PNE: Assure that, during the fifth
year of this PNE’s period of application,
at least 70% of the elementary and high
school students have reached an adequate
learning level regarding the rights and
objectives of learning and development
during their grade and 50%, at least,
having reached the desired level.
7.2.b – Learning level up to end of
the PNE: Assure that, during the last year
PNE’s term, all elementary and high school
students have reached an adequate learning
level regarding the rights and objectives
of learning and development during their
grade and 80%, at least, having reached
the desired level (BRASIL, 2014).
The PNE did not define how the “desired
level” should be empirically analyzed, yet the
document indicates, explicitly, that an official
normative interpretation of the SAEB proficiency
scale (the national evaluation) will be done during
this decade.
During this study, the analytical approach
took on the four levels proposed by Soares
(2006; 2009) as a reference in order to describe
students’ learning based on the scores they
obtained on the SAEB proficiency scale. This
proposal originated from the analysis of what the
ideal Brazilian student proficiency distribution on
this scale should be. To this end, a distribution
of PISA proficiencies from a group of countries
was taken as a reference. Then we immediately
verified the distance of each percentile for
the performance of Brazilian students on the
PISA in relation to the respective percentile
of this reference distribution. The translation
that was obtained through this comparison,
in terms of standard deviation, was applied to
the SAEB distribution, thus producing an ideal
performance distribution. It is important to note
that this process does not conclude that the PISA
and SAEB expected learning are the same – since
they obviously are not. It is a defensible way of
identifying the current school lag in terms of the
performance of Brazilian students.
For technical and educational reasons, the 70th
percentile of the ideal distribution was defined as
the cutting point that divides students into two
groups: those that did not reach the adequate
level and those that did.7 However, it was taken
into consideration the fact that adopting only two
levels might generate distortions since the school
might be motivated to focus its efforts together
with the students closest to the adequate level,
excluding those that are distant from it and, also,
it might neglect guiding those who passed the
adequate level on to higher levels of excellence.
15
SÉRI
E D
ebat
es E
D

Therefore, based on this and in an ad hoc way,
it was decided that the ideal situation would be
acceptable where only 5% of students were at
the first level and where the highest level should
contain at least 25% of the students. Through
this process, cutting points for the four levels were
established and designated as: below basic, basic,
adequate and advanced. The intervals on the SAEB
scale that correspond to each level for Reading and
Mathematics are presented on Chart 1, below:
Chart 1 – Definition of learning levels according to scores obtained by students in Reading and Mathematics on the SAEB scale
Learning level 5th Grade Elementary School 9th Grade Elementary School
Reading Mathematics Reading Mathematics
Below basic Up to 150 Up to 175 Up to 200 Up to 225
Basic More than 150-200 More than 175-200 More than 200-275 More than 225-300
Adequate More than 200-250 More than 200-225 More than 275-325 More than 300-350
Advanced More than 250 More than 225 More than 325 More than 350
Source: Soares (2009).
These levels have an educational interpre-
tation, since they indicate educational needs
and interventions that are specific to each
situation. Students at the adequate level
master the content and skills in a way that
is compatible with their stage of schooling
and yet they need to deepen their studies.
While the students at the advanced level
demonstrate a performance above what was
expected and are prepared to face challenges.
On the other hand, students at the basic level
master only part of the average skills and
need tutoring in order to reach the adequate
learning level. Finally, students at the below
basic level master only rudimentary skills and
require tutoring (SOARES, 2009).
This study focuses on those students at the
below basic level: they constitute the main
empirical evidence of intra-school exclusion.
They are students whose have had their right to
education totally denied. Frequently, such a fact is
associated to the socio-demograph characteristics
that constitute barriers that are especially difficult
to cross by underprivileged groups that, for this
reason, need even more schooling to be able to
overcome this disadvantage.
Therefore, this study also aims to increase the
understanding of the intra-school phenomenon
by describing student groups and their families,
as well as their schools.
Regarding the schools, we analyzed the
factors that describe the organizational and
procedural characteristics that might directly
or indirectly influence student performance
(SAMMONS; HILLMAN; MORTIMORE, 1995).
The study of these factors has come into focus
more since the 90s along with the constitution
of a research field in school efficacy (BROOKE;
SOARES, 2008).
In general, the qualitative studies have been
more successful in obtaining information about
effective school characteristics (ABRÚCIO,
2010; GAME, 2002). However, the contextual
surveys that are part of the SAEB have produced
consistent results that make it possible to
distinguish the best and worst school conditions,
since Brazilian schools vary greatly (ALVES;
FRANCO, 2008).
In order to reach this goal, the factors
related to school performance were analyzed in
an empirical manner as latent constructs, that
is, they were not directly observed and these
16
SÉRI
E D
ebat
es E
D

characteristics were noted from the contextual
surveys of the educational evaluations. We
estimated diverse factors that are related to
the school processes linked to the internal
organization of each school, to the school
principal’s role, to the infrastructure, to the
educational project, to the organization
and teaching methods, to the teachers, to
the resources used in class and to the school
environment, inspired in the literature on school
effectiveness (BROOKE; SOARES, 2008). A
description of each of the estimated factors will
be presented in section A, chapter IV.
Worth noting is that, at times, the constructs
that were tested were not able to measure the
latent feature successfully enough because
the items on the surveys were not necessarily
planned to measure them. The measurement
of complex concepts is very difficult and the
choices regarding how to do it depend on the
researchers’ references and on the available
data. Additionally, since the selection of
surveys items grouped into each construct was
determined by a posteriori decision, alternative
forms of grouping could be proposed.
17
SÉRI
E D
ebat
es E
D

III. The data
8. Available at: <http://portal.inep.gov.br/basica-levantamentos-acessar>. Accessed on: Feb. 13, 2015.
This study used the micro data produced by
the SAEB, specifically for the Prova Brasil, from
2007, 2009, 2011 and 2013, and the ANEB,
from 2011 and 2013. That microdata can be
obtained together with the system of accessing
the microdata generated by Inep by download.8
In common, these assessments biannually
apply tests to measure proficiency in
Portuguese language (emphasis on Reading)
and Mathematics proficiencies of students in
the 5th through 9th grades of elementary school.
In addition to these tests, the Prova Brasil and
the ANEB apply contextual surveys to students,
teachers and principals, along with a survey
about the school that is filled in by the person
applying the survey.
Regarding the specificities, on the Prova
Brasil, the test is given to those students that
are enrolled in public schools that have at least
20 students in each grade being assessed. The
proficiencies gathered by the tests are used to
compose the calculation of the school’s IDEB,
the reason for which it is important to guarantee
a minimum number of students.
The ANEB, on the other hand, assesses an
additional sample of students from the 5th-9th
grades of elementary school enrolled in public
schools that are not eligible for the Prova
Brasil (schools with grades having less than 20
students each) and in basic education private
schools. Additionally, the ANEB includes a
sample of students from the 3rd year of high
school.
Microdata from the Prova Brasil of 2011
and 2013 and from the ANEB referring to
the 5th-9th grades of elementary school are
available at the same database. In order to
know if the cases (students or schools) are
part of the Prova Brasil there is an indicating
variable that identifies them.
However, if the intention is to analyze all
the schools or students – that is, those that
are enrolled in public schools that are eligible
or not for the Prova Brasil and those enrolled
in private schools – there is a “weight”
variable that ponders the data according to
the representativity these public schools have
in the population. Therefore, the SAEB (Prova
Brasil and ANEB) produce a diagnosis of
Brazilian students’ learning and of the factors
that influence performance within the different
teaching systems and networks.
Data from the Prova Brasil and the ANEB
were used in order to estimate those factors that
18
SÉRI
E D
ebat
es E
D

9. Schools belonging to the federal network possess at least 0.5% of enrollment in elementary school. Additionally, the socioeconomic level of students at these schools is more similar to the private school student profile than that of other public schools (ALVES; SOARES; XAVIER, 2014).
are associated to school efficiency, as detailed in
section A, chapter IV.
In order to analyze the phenomenon of
intra-school exclusion, only those students
from municipal and state public elementary
schools were selected, since it is in these
schools that this phenomenon should be the
focus of public policies. That way, Prova Brasil
data from 2011-2013 were analyzed and
data from students at federal schools were
excluded because they have a differentiated
profile in comparison to the rest of the public
school students, in addition to constituting a
very small segment.9
Table 1 presents the number of students and
schools included in the analyses.
Table 1 – Number of students per grade and schools by Prova Brasil edition
Prova BrasilEdition
Number of 5th grade students
Number of 9th grade students
Number of schools
2007 2,285,523 1,785,846 48,667
2009 2,529,612 1,957,155 57,861
2011 2,277,336 1,984,309 55,904
2013 2,028,348 1,988,655 55,904
Source: Prepared with Prova Brasil data from 2007 to 2013.
Notes: (1) Students having no proficiency information were excluded from the original databases; (2) one school alone may offer 5th
through 9th grades.
19
SÉRI
E D
ebat
es E
D

IV. Learning levels and the associated factors
10. Since the ANEB is planned to be a representative sample for all schools (public and private, urban and rural), the inclusion of its data makes it possible for, within the process of estimating parameters for the items in each factor, the public and private schools to be placed on the same scale.
A. Methodology
This section will include descriptive analyses
that digest student distribution by learning level
in Reading and Mathematics in Brazil, in the
federative units (states and the Federal District)
and according to the discriminating characteristics
and the factors related to the students.
The associated factors were estimated based
on the contextual surveys from the ANEB10
(2011 and 2013) and the Prova Brasil (2007
to 2013), by employing a model of the item
response theory – IRT (HAMBLETON, 1993).
The IRT includes a series of models whose
main objective is to obtain the measurements
of latent constructs, based on dichotomic and/
or ordinal factors. Specifically, the Samejima
(1969) model was used, suitable for items with
scaled responses (ordinal).
IRT models are mostly used in the educational
area when there is a need to evaluate the quality
of test items and to estimate students’ abilities.
However, such models are not restricted to
this function, being highty employed, also, to
estimate latent features in other areas, as in the
case of this study.
The Samejima model has unidimensionality
as a supposition, meaning the existence of a sole
dominant latent construct in the group of data.
This supposition needs to be tested in order to
validate the constructs before estimating the
factor. This is done by analyzing the eigenvalues
and eigenvectors of the correlation matrix
among the construct’s variables.
Since the variables that were tested are
ordinal, the polychoric correlation matrix is the
most frequently indicated. The supposition of this
statistical technique is that a latent dimension
exists underlying the group of variables. When
all the variables are positively correlated, this is
an initial indication that they can be associated
to a single construct.
After the validation phase, the IRT model is
adjusted into two phases. During the first, the
parameters for each item is estimated, whose
results make it possible to produce a graphic
showing the item’s characteristic curve (ICC) and
a graphic showing the item’s information curve
(IIC), for each item tested. The ICC graphics
suggest a relationship between the probability
of an individual giving a certain answer to
an item and their latent trait (the estimated
20
SÉRI
E D
ebat
es E
D

11. All the descriptive tables were elaborated with help from the SPSS software. The sums of the percentages presented in all the tables with descriptive statistics may result in values 1% above or below 100% due to the rounding done by the SPSS software’s analysis.
factor). The IIC shows at which of the chosen
latent construct scale’s intervals a specific item
provides a greater amount of information for
estimating that scale.
In the second phase, based on the parameters
of the items and of the distribution of the
responses, the factor scores are estimated.
Due to the method employed, the missing
data is treated naturally. This means that only
the items that were answered are taken into
consideration when estimating the chosen
score. This is an important advantage of the IRT
compared to conventional methods and quite
adequate for this study, which contains a great
amount of incomplete data, either because the
item was not included in one of the SAEB/Prova
Brasil editions or because the individuals did not
respond to the item presented.
It is important to point out that the IRT
models were adjusted to the patterns of answers
observed in each group of data referring to
the factors and not to individual answers. The
number of answer patterns is very distinct in the
tested factors. This depends on the number of
items considered and on the greater or lesser
heterogeneity among the responders.
It is worth noting that these constructs
may possibly not be capable of measuring the
latent trait with the required level of success,
because the items on the surveys were not
necessarily planned to measure them. The fact
is that measuring complex concepts is extremely
difficult and choices regarding how to do so
depend on the researchers’ references and
also on the available data. Additionally, since
this project’s team selected the items through
an a posteriori judgment, alternative forms of
grouping could be proposed.
Finally, the associations between the estimated
factors and learning in the next section or with
the school effects presented in Chapter V are
important indicators for public policies, but
they should not be understood as deterministic
mechanisms for producing good results. That is
because, most probably, actions towards changing
a factor at the school would provoke a change in
other factors as well.
Appendix A shows the items that generated
each factor. The statistics related to the
adjustment of these models may be requested
from the authors.
B. Distribution of students by learning levels in Brazil and in the federative units
The distribution of students by learning level
in Brazil and according to federative unit makes
it possible to identify situations of intra-school
exclusion, translated by the below basic learning
level for the skills that were evaluated.
Tables 2 and 3 show this distribution according
to grade and Prova Brasil edition in Reading and
Mathematics, respectively.11
For all editions of the Prova Brasil, for both the
5th and 9th grades, in Reading and Mathematics,
students are concentrated at the basic level.
However, the proportion of students at the
below basic level is always very high. There was a
drop in the total of students at below basic level
when the 2007 and 2013 editions of the Prova
Brasil are compared. This reduction was more
expressive for the 5th grade compared to the 9th
grade, mainly in Mathematics. It is worth noting
that, between 2011 and 2013, the percentage
of students at the below basic level in Reading
stagnated, while this percentage increased in
Mathematics.
According to Soares (2009), in an ideal
distribution of proficiencies, only 5% of
21
SÉRI
E D
ebat
es E
D

12. According to Soares, “the cutting points for the distribution of reference are: 5% at the below basic level; 25% at the basic level; 45% at the proficiency level and 25% at the advanced level” (SOARES, 2009, p. 36).
students at the below basic level would be
acceptable, since they require more attention so
that their futures would not be compromised.12
Therefore, the fact that such a high percentage
of Brazilian students are excluded from the right
to education causes great concern.
Table 2 – Proportion of students by learning levels in Reading according to grade and Prova Brasil edition
Grade Learning LevelProva Brasil Edition Difference
2013-20072007 2009 2011 2013
5th
Below basic 29.9% 26.0% 22.7% 22.7% -7.2%
Basic 44.5% 42.4% 40.2% 35.8% -8.7%
Adequate 21.4% 24.0% 27.0% 27.9% 6.5%
Advanced 4.1% 7.6% 10.0% 13.5% 9.4%
9th
Below basic 27.3% 21.9% 21.3% 23.3% -4.0%
Basic 57.1% 55.6% 55.7% 52.0% -5.1%
Adequate 14.2% 19.8% 20.0% 21.1% 6.9%
Advanced 1.4% 2.7% 3.1% 3.6% 2.2%
Source: Prepared with Prova Brasil data from 2007 to 2013.
Table 3 – Proportion of students by learning levels in Mathematics according to grade and Prova Brasil edition
Grade Learning LevelProva Brasil Edition Difference
2013-20072007 2009 2011 2013
5th
Below basic 38.5% 31.0% 28.3% 28.4% -10.1%
Basic 40.0% 38.8% 38.4% 35.5% -4.5%
Adequate 17.9% 23.2% 24.4% 25.3% 7.4%
Advanced 3.7% 7.0% 8.9% 10.8% 7.1%
9th
Below basic 37.8% 38.8% 33.9% 35.7% -2.1%
Basic 52.9% 50.7% 53.8% 52.5% -0.4%
Adequate 8.4% 9.5% 11.0% 10.6% 2.2%
Advanced 0.9% 1.1% 1.3% 1.3% 0.4%
Source: Prepared with Prova Brasil data from 2007 to 2013.
Tables 4 and 5 show only the proportion of
students at the below basic level in Reading
and Mathematics by federative unit, grade and
Prova Brasil edition. In most Brazilian federative
units, there was a reduction in the percentages
of students at the below basic level during the
period of 2007-2013, especially in the 5th grade.
However, in some states, the phenomenon of
intra-school exclusion continues to be quite
severe, since more than a third of the students
22
SÉRI
E D
ebat
es E
D

enrolled in the respective public networks did
not reach the expected learning rates for the
2013 grade.
On a positive note, the state of Ceará was
consistently efficient in reducing the percentage
of students at the below basic level, although
the percentages remain high, mostly in
Mathematics. On the other hand, Maranhão
state had a small decrease, only in Reading,
in the percentage of 9th grade students at the
below basic level of learning.
It is still worth noting that some states
stagnanted or worsened between 2011 and 2013.
That is the case, for example, in Minas Gerais,
where there was a slight increase in students at
the below basic level for the 5th and 9th grades.
Table 4 – Proportion of students at a below basic level in Reading according to the Prova Brasil edition by federative unit and grade
Federative Unit GradeProva Brasil Edition Difference
2013-20072007 2009 2011 2013
Brazil5th grade 29.9% 26.0% 22.7% 22.7% -7.2%9th grade 27.3% 21.9% 21.3% 23.3% -4.0%
Rondônia5th grade 32.6% 26.6% 22.8% 19.4% -13.2%9th grade 26.9% 20.6% 19.0% 20.6% -6.3%
Acre5th grade 30.3% 23.8% 22.2% 17.3% -13.0%9th grade 28.8% 20.3% 20.9% 18.3% -10.5%
Amazonas5th grade 35.3% 30.0% 27.5% 25.3% -10.0%9th grade 27.0% 20.8% 23.4% 22.8% -4.2%
Roraima5th grade 30.4% 32.5% 29.2% 27.3% -3.1%9th grade 28.3% 24.3% 27.8% 31.4% 3.1%
Pará5th grade 39.8% 34.6% 31.8% 40.2% 0.4%9th grade 29.4% 25.0% 25.4% 27.0% -2.4%
Amapá5th grade 40.6% 34.6% 34.4% 39.5% -1.1%9th grade 31.8% 25.6% 27.5% 30.8% -1.0%
Tocantins5th grade 34.9% 28.5% 22.9% 24.8% -10.1%9th grade 31.4% 22.5% 22.1% 25.7% -5.7%
Maranhão5th grade 44.8% 47.5% 42.2% 46.0% 1.2%9th grade 36.4% 32.0% 33.3% 35.3% -1.1%
Piauí5th grade 38.3% 33.7% 30.3% 35.3% -3.0%9th grade 35.2% 26.8% 25.4% 26.9% -8.3%
Ceará5th grade 43.0% 34.9% 24.9% 24.2% -18.8%9th grade 36.4% 26.5% 24.8% 22.0% -14.4%
Rio Grande do Norte5th grade 52.0% 45.7% 36.9% 36.9% -15.1%9th grade 35.0% 27.6% 28.8% 28.1% -6.9%
Paraíba5th grade 39.6% 34.7% 30.8% 32.8% -6.8%9th grade 35.8% 29.2% 30.7% 32.0% -3.8%
Pernambuco5th grade 43.4% 41.7% 37.7% 34.7% -8.7%9th grade 41.3% 31.9% 31.5% 30.3% -11.0%
Alagoas5th grade 46.6% 51.5% 48.0% 44.1% -2.5%9th grade 41.4% 33.7% 37.8% 36.8% -4.6%
Sergipe5th grade 38.9% 37.7% 35.2% 37.7% -1.2%9th grade 34.7% 27.2% 26.8% 29.4% -5.3%
Bahia5th grade 38.7% 38.5% 33.7% 37.6% -1.1%9th grade 36.1% 31.9% 30.6% 32.1% -4.0%
Minas Gerais5th grade 26.3% 15.5% 13.4% 14.1% -12.2%9th grade 21.6% 15.6% 12.4% 16.2% -5.4%
Espírito Santo5th grade 24.3% 19.3% 18.2% 18.1% -6.2%9th grade 24.4% 17.0% 17.7% 20.9% -3.5%
Rio de Janeiro5th grade 26.0% 20.6% 17.5% 17.5% -8.5%9th grade 26.9% 19.3% 21.4% 25.2% -1.7%
23
SÉRI
E D
ebat
es E
D

Continuation
Federative Unit GradeProva Brasil Edition Difference
2013-20072007 2009 2011 2013
São Paulo5th grade 25.7% 20.5% 18.7% 15.4% -10.3%9th grade 25.8% 21.7% 19.7% 22.4% -3.4%
Paraná5th grade 19.3% 15.3% 14.8% 11.0% -8.3%9th grade 20.7% 15.4% 16.7% 19.1% -1.6%
Santa Catarina5th grade 22.1% 20.1% 12.8% 11.9% -10.2%9th grade 20.8% 14.7% 14.3% 18.9% -1.9%
Rio Grande do Sul5th grade 22.8% 19.0% 15.5% 14.0% -8.8%9th grade 18.5% 13.3% 14.3% 15.9% -2.6%
Mato Grosso do Sul5th grade 23.2% 18.9% 15.1% 15.7% -7.5%9th grade 17.7% 10.8% 13.3% 14.0% -3.7%
Mato Grosso5th grade 28.2% 24.6% 24.0% 23.4% -4.8%9th grade 28.0% 18.9% 22.3% 27.3% -0.7%
Goiás5th grade 30.8% 20.7% 15.9% 14.3% -16.5%9th grade 28.3% 21.4% 19.5% 16.8% -11.5%
Federal District5th grade 14.6% 11.0% 9.9% 9.7% -4.9%9th grade 20.9% 19.1% 18.6% 21.8% 0.9%
Source: Prepared with Prova Brasil data from 2007 to 2013.
Table 5 – Proportion of students at the below basic level in Mathematics according to the Prova Brasil by federative unit and grade
Federative Unit GradeProva Brasil Edition Difference
2013-20072007 2009 2011 2013
Brazil5th grade 38.5% 31.0% 28.3% 28.4% -10.1%9th grade 37.8% 38.8% 33.9% 35.7% -2.1%
Rondônia5th grade 42.8% 32.2% 29.1% 23.2% -19.6%9th grade 37.4% 38.0% 30.6% 32.1% -5.3%
Acre5th grade 44.7% 33.2% 31.3% 25.2% -19.5%9th grade 42.9% 42.8% 37.6% 36.6% -6.3%
Amazonas5th grade 47.9% 38.4% 36.6% 34.1% -13.8%9th grade 44.7% 45.8% 43.5% 43.7% -1.0%
Roraima5th grade 42.1% 41.9% 39.6% 32.6% -9.5%9th grade 42.1% 46.5% 44.7% 46.8% 4.7%
Pará5th grade 52.9% 44.5% 43.8% 51.9% -1.0%9th grade 45.5% 49.7% 44.8% 47.1% 1.6%
Amapá5th grade 54.4% 45.0% 49.2% 51.4% -3.0%9th grade 50.7% 51.7% 49.9% 53.2% 2.5%
Tocantins5th grade 47.2% 36.6% 30.7% 31.2% -16.0%9th grade 45.7% 43.6% 37.1% 38.5% -7.2%
Maranhão5th grade 55.1% 57.0% 55.2% 58.2% 3.1%9th grade 54.4% 58.1% 54.8% 57.2% 2.8%
Piauí5th grade 50.5% 41.7% 39.3% 43.9% -6.6%9th grade 46.3% 47.0% 39.8% 42.4% -3.9%
Ceará5th grade 54.1% 44.3% 32.8% 32.3% -21.8%9th grade 51.2% 50.3% 41.6% 38.5% -12.7%
Rio Grande do Norte5th grade 59.9% 52.2% 46.3% 45.2% -14.7%9th grade 47.3% 48.4% 44.5% 44.0% -3.3%
Paraíba5th grade 49.0% 41.7% 39.8% 40.7% -8.3%9th grade 49.9% 49.9% 46.2% 48.0% -1.9%
24
SÉRI
E D
ebat
es E
D

Continuation
Federative Unit GradeProva Brasil Edition Difference
2013-20072007 2009 2011 2013
Pernambuco5th grade 53.8% 48.5% 45.4% 42.7% -11.1%9th grade 55.5% 53.3% 47.3% 44.7% -10.8%
Alagoas5th grade 56.7% 59.0% 57.5% 53.6% -3.1%9th grade 55.1% 56.1% 55.0% 53.4% -1.7%
Sergipe5th grade 49.7% 45.2% 44.3% 43.9% -5.8%9th grade 46.2% 46.8% 41.2% 43.9% -2.3%
Bahia5th grade 50.6% 46.7% 42.3% 45.4% -5.2%9th grade 49.8% 52.4% 46.6% 47.9% -1.9%
Minas Gerais5th grade 31.8% 16.9% 15.9% 17.2% -14.6%9th grade 28.3% 26.3% 20.1% 23.3% -5.0%
Espírito Santo5th grade 32.9% 23.7% 22.0% 22.1% -10.8%9th grade 32.9% 31.1% 26.1% 28.9% -4.0%
Rio de Janeiro5th grade 35.5% 25.6% 19.7% 21.2% -14.3%9th grade 40.7% 36.2% 31.6% 35.1% -5.6%
São Paulo5th grade 32.6% 22.7% 21.9% 19.0% -13.6%9th grade 35.3% 36.7% 32.0% 32.9% -2.4%
Paraná5th grade 25.5% 16.8% 17.1% 13.6% -11.9%9th grade 26.2% 29.3% 25.8% 28.8% 2.6%
Santa Catarina5th grade 29.4% 24.8% 15.9% 15.2% -14.2%9th grade 27.0% 25.9% 21.6% 28.6% 1.6%
Rio Grande do Sul5th grade 29.9% 22.8% 19.6% 17.3% -12.6%9th grade 27.2% 23.7% 21.1% 24.6% -2.6%
Mato Grosso do Sul5th grade 32.0% 24.3% 19.1% 20.4% -11.6%9th grade 25.8% 26.2% 23.2% 25.7% -0.1%
Mato Grosso5th grade 38.4% 31.7% 31.8% 29.7% -8.7%9th grade 37.8% 37.1% 36.7% 41.9% 4.1%
Goiás5th grade 41.1% 27.3% 21.9% 18.9% -22.2%9th grade 38.8% 41.1% 33.0% 29.5% -9.3%
Federal District5th grade 20.9% 12.5% 12.9% 12.3% -8.6%9th grade 27.7% 30.1% 27.0% 31.8% 4.1%
Source: Prepared with Prova Brasil data from 2007 to 2013.
C. Distribution of students by learning levels according to discriminating characteristics and student factors
In this section, we will analyze the percentage
of students at each learning level according
to their descriptive and family characteristics,
along with their school trajectory.
C.1 Gender
The distribution pattern of students by
learning levels in Reading according to gender
is similar among the different grades and the
Prova Brasil editions, as shown in Table 6: when
compared to boys, girls are less concentrated
at the below basic level. From 2007-2013, girls
advanced more than boys, that is, the reduction
in the proportion of students at the below basic
level in Reading was greater among girls, which
made the learning differences among the groups
slightly greater in 2013 compared to 2007.
Baye and Monseur (2016), based on data
from the Progress in International Reading
Literacy Study (PIRLS) from 2001 to 2011; from
the Trends in International Mathematics and
Science Study (TIMSS) from 1995 to 2007; and
from the PISA from 2000 to 2012, indicate
that, in Reading, the difference between girls
and boy is less in the 95th percentile than in 25
SÉRI
E D
ebat
es E
D

13. The totals of the proportions presented in all of the tables with descriptive statistics may result in values that are 1% above or below 100% due to the rounding done by the SPSS software, which was used in these analyses.
the average, with an advantage for the girls.
In Mathematics and Sciences, the highest
percentile of proficiency distribution, the boys
always perform better than the girls. The
authors’ findings are consistent with the results
found in our study.
Table 6 – Proportion of students by learning levels in Reading according to gender by grade and Prova Brasil edition13
EditionLearning level for Reading
5th grade 9th grade
Masculine Feminine Masculine Feminine
2007
Below basic 34.7% 24.1% 33.3% 21.8%Basic 43.7% 45.6% 54.2% 59.7%Adequate 18.2% 25.4% 11.4% 16.8%Advanced 3.4% 4.9% 1.1% 1.7%Total 100.0% 100.0% 100.0% 100.0%
2009
Below basic 30.7% 20.6% 27.7% 16.7%Basic 42.6% 42.2% 53.9% 57.1%Adequate 20.8% 27.8% 16.3% 22.8%Advanced 5.9% 9.4% 2.1% 3.3%Total 100.0% 100.0% 100.0% 100.0%
2011
Below basic 27.9% 16.8% 27.4% 15.6%Basic 41.2% 39.1% 54.1% 57.2%Adequate 23.3% 31.4% 16.2% 23.4%Advanced 7.6% 12.7% 2.3% 3.8%Total 100.0% 100.0% 100.0% 100.0%
2013
Below basic 27.7% 16.7% 29.3% 17.4%Basic 37.0% 34.4% 51.1% 52.9%Adequate 24.7% 31.8% 16.9% 25.2%Advanced 10.6% 17.0% 2.6% 4.5%Total 100.0% 100.0% 100.0% 100.0%
Source: Prepared with Prova Brasil data from 2007 to 2013.
In Mathematics (Table 7), in the 5th grade, the
proportion of boys at the below basic learning level
continued to be higher than the girls, in all the
Prova Brasil editions; and the difference between
girls and boys increased between 2007 and 2013.
In the 9th grade, the opposite occurred: there is a
much greater concentration of girls at the below
basic level than boys. However, at the same time,
the decrease in the proportion of students at the
below basic level was slightly higher for the girls,
which made the differences between the groups
lower in 2013 compared to 2007.
26
SÉRI
E D
ebat
es E
D

14. The racial classification was introduced in the School Census in 2005, but the terms employed by the IBGE are not easily understood. In Rosalina Soares’ master’s thesis (2006) regarding racial classification at elementary schools, the author observed that, for many students and for some educators too, the “yellow” classification is not associated to Asian origin but to skin tone.
Table 7 – Proportion of students by learning levels in Mathematics according to gender by grade and Prova Brasil edition
EditionLearning level in Mathematics
5th grade 9th grade
Masculine Feminine Masculine Feminine
2007
Below basic 39.3% 37.4% 34.9% 40.4%Basic 38.6% 41.7% 53.7% 52.2%Adequate 17.9% 17.8% 10.3% 6.8%Advanced 4.1% 3.2% 1.2% 0.6%Total 100.0% 100.0% 100.0% 100.0%
2009
Below basic 32.7% 29.0% 34.9% 42.2%Basic 37.2% 40.8% 52.2% 49.3%Adequate 22.6% 23.9% 11.6% 7.6%Advanced 7.5% 6.3% 1.3% 0.8%Total 100.0% 100.0% 100.0% 100.0%
2011
Below basic 29.2% 27.2% 31.8% 35.8%Basic 37.0% 40.1% 54.0% 53.6%Adequate 24.3% 24.6% 12.6% 9.5%Advanced 9.5% 8.2% 1.6% 1.1%Total 100.0% 100.0% 100.0% 100.0%
2013
Below basic 30.8% 25.4% 34.4% 36.9%Basic 33.6% 37.8% 52.5% 52.5%Adequate 24.6% 26.1% 11.6% 9.5%Advanced 11.0% 10.7% 1.5% 1.0%Total 100.0% 100.0% 100.0% 100.0%
Source: Prepared with Prova Brasil data from 2007 to 2013.
C.2 Race
The “race” variable follows the pattern of
demographic studies from the Brazilian Institute
of Geography and Statistics (Instituto Brasileiro de Geografia e Estatística – IBGE). On the contextual
survey, each student should select, among the
five IBGE categories, the self-classification that
applies to them: white, mixed race, black, yellow
and indigenous. In these descriptive analyses,
the proportions will be presented only to those
students that answered the first three categories,
due to the small percentage of students classified
as yellow and indigenous (5% of the cases) and
also inconsistencies in the pattern of answers for
students who classified themselves as yellow.14
According to Table 8, the students that
declared themselves to be black are more
prevalent at the below basic learning level in
Reading when compared to students who
classified themselves as mixed or white. Even
though there was a reduction in the number of
students at below basic level for all groups, the
black students continued to have very elevated
percentages in 2013 (28.1% and 29.1%, in the
5th and 9th grades, respectively).
27
SÉRI
E D
ebat
es E
D

Table 8 – Proportion of students by learning levels in Reading according to race by grade and Prova Brasil edition
EditionLearning levels in Reading
5th grade 9th grade
White Mixed Black White Mixed Black
2007
Below basic 26.2% 27.5% 38.5% 22.7% 28.7% 34.2%Basic 43.0% 46.8% 46.0% 56.5% 58.1% 54.9%Adequate 25.0% 22.0% 13.9% 18.6% 12.2% 10.1%Advanced 5.8% 3.7% 1.7% 2.2% 1.0% 0.8%Total 100.0% 100.0% 100.0% 100.0% 100.0% 100.0%
2009
Below basic 22.4% 23.9% 32.8% 18.1% 22.7% 28.3%Basic 40.2% 43.7% 46.0% 53.0% 57.5% 55.4%Adequate 27.1% 25.0% 17.5% 24.9% 17.7% 14.7%Advanced 10.3% 7.4% 3.7% 4.1% 2.1% 1.6%Total 100.0% 100.0% 100.0% 100.0% 100.0% 100.0%
2011
Below basic 18.7% 21.4% 29.5% 16.5% 21.6% 26.6%Basic 36.4% 41.2% 43.7% 53.0% 57.6% 56.2%Adequate 30.7% 27.7% 21.2% 25.9% 18.2% 15.2%Advanced 14.2% 9.7% 5.6% 4.7% 2.5% 2.0%Total 100.0% 100.0% 100.0% 100.0% 100.0% 100.0%
2013
Below basic 17.8% 19.9% 28.1% 18.5% 23.0% 29.1%Basic 31.7% 36.1% 40.5% 49.3% 53.8% 52.5%Adequate 31.2% 29.8% 23.6% 26.8% 20.0% 16.2%Advanced 19.3% 14.2% 7.8% 5.4% 3.1% 2.2%Total 100.0% 100.0% 100.0% 100.0% 100.0% 100.0%
Source: Prepared with Prova Brasil data from 2007 to 2013.
The distribution pattern for students according
to race among the learning levels in Mathematics
(Table 9) is similar to that for Reading: black
students are more concentrated at the below
basic level, followed by mixed race and white
students. It is worth noting that, in Mathematics,
the proportion of students at this level is great
than the proportion of students at the same level
in Reading. Ninth grade black students who are at
the below basic proficiency level in Mathematics
reach a total more than 40%.
28
SÉRI
E D
ebat
es E
D

Table 9 – Proportion of students by learning levels in Mathematics according to race by grade and Prova Brasil edition
EditionLearning levels in Mathematics
5th grade 9th grade
White Mixed Black White Mixed Black
2007
Below basic 34.0% 36.7% 48.6% 31.1% 40.5% 45.6%Basic 39.4% 42.0% 39.1% 55.4% 52.2% 48.9%Adequate 21.2% 18.1% 10.9% 12.0% 6.7% 5.1%Advanced 5.4% 3.3% 1.3% 1.5% 0.6% 0.4%Total 100.0% 100.0% 100.0% 100.0% 100.0% 100.0%
2009
Below basic 26.5% 28.7% 39.4% 31.7% 41.5% 46.0%Basic 36.9% 40.5% 41.1% 53.1% 50.0% 47.3%Adequate 26.8% 24.1% 16.4% 13.4% 7.7% 6.2%Advanced 9.8% 6.6% 3.1% 1.7% 0.8% 0.5%Total 100.0% 100.0% 100.0% 100.0% 100.0% 100.0%
2011
Below basic 23.0% 27.0% 36.5% 26.5% 35.6% 40.4%Basic 35.3% 39.8% 40.5% 56.0% 53.8% 51.4%Adequate 28.7% 24.8% 18.5% 15.4% 9.5% 7.6%Advanced 13.0% 8.4% 4.4% 2.1% 1.0% 0.7%Total 100.0% 100.0% 100.0% 100.0% 100.0% 100.0%
2013
Below basic 22.4% 24.9% 35.1% 28.6% 36.3% 42.1%Basic 32.3% 36.8% 38.9% 54.4% 53.1% 50.2%Adequate 29.4% 27.0% 20.4% 14.8% 9.6% 7.1%Advanced 15.9% 11.3% 5.7% 2.1% 1.1% 0.6%Total 100.0% 100.0% 100.0% 100.0% 100.0% 100.0%
Source: Prepared with Prova Brasil data from 2007 to 2013.
C.3 Lag
Educational lag is defined as the difference in
years between the student’s age and the expected
age for a student at that point in their trajectory.
Different algorithms were used for the calculations,
all based on the information available from the
contextual surveys. The 5th grade elementary
school students should fill in their age in complete
years at the time of the Prova Brasil along with
the month of their anniversary. Students were
considered to be at the regular age when they
were 11 or younger or when their calculated age
was 11. Those that said they were older than 11
were considered to have an educational lag.
Students in the 9th grade of elementary school
should inform their birth year and month. They
are classified as being regular if they are 14 years
old or less and as lagging if they over that age.
Those students who did not provide that
information, the lag was calculated based on
failing and dropout variables. This information
(dropout and failing) are also used to adjust the
classification of those students who were one
year older than the limit (12 or 15 years old, for
the 5th and 9th grades, respectively), yet whose
birthdays were during the month that the Prova
Brasil was applied. They are considered as
normal if they had never failed a year and had
never dropped out.
Observing Table 10, we see that the student
distribution by learning levels in Reading
according to educational lag is similar among
the different grades and Prova Brasil editions:
students lagging behind by one or more years
are more concentrated at the lower levels
when compared to students having no lag, for
both grades.
29
SÉRI
E D
ebat
es E
D

Table 10 – Proportion of students by learning levels in Reading according to educational lag by grade and Prova Brasil edition
Edition Learning levels in Reading
5th grade 9th grade
No lag1 or more lag years
No lag1 or more lag years
2007
Below basic 22.5% 41.8% 21.1% 39.3%Basic 44.8% 45.1% 58.8% 53.9%Adequate 27.1% 11.8% 18.2% 6.5%Advanced 5.7% 1.3% 2.0% 0.3%Total 100.0% 100.0% 100.0% 100.0%
2009
Below basic 18.7% 36.9% 16.6% 32.0%Basic 41.4% 44.5% 56.5% 56.1%Adequate 29.5% 15.3% 23.5% 11.0%Advanced 10.3% 3.2% 3.4% 0.9%Total 100.0% 100.0% 100.0% 100.0%
2011
Below basic 17.7% 36.4% 16.9% 33.4%Basic 39.0% 44.3% 56.1% 54.6%Adequate 30.9% 16.1% 23.2% 10.8%Advanced 12.4% 3.2% 3.7% 1.2%Total 100.0% 100.0% 100.0% 100.0%
2013
Below basic 16.3% 38.8% 19.2% 35.1%Basic 34.1% 41.6% 52.2% 51.9%Adequate 32.4% 16.1% 24.3% 11.7%Advanced 17.2% 3.5% 4.3% 1.4%Total 100.0% 100.0% 100.0% 100.0%
Source: Prepared with Prova Brasil data from 2007 to 2013.
In Mathematics (Table 11), the same pattern
repeats itself; however, the percentages of
students with a lag at the basic and below
basic levels are very high throughout all the
Prova Brasil editions, in the 5th and 9th grades
of elementary school.
30
SÉRI
E D
ebat
es E
D

Table 11 – Proportion of students by learning levels in Mathematics according to lag by grade and Prova Brasil edition
Edition Learning levels in Mathematics
5th grade 9th grade
No lag1 or more lag years
No lag1 or more lag years
2007
Below basic 31.0% 50.7% 30.6% 52.0%Basic 41.6% 37.9% 57.1% 44.6%Adequate 22.4% 10.1% 11.0% 3.2%Advanced 5.0% 1.3% 1.3% 0.2%Total 100.0% 100.0% 100.0% 100.0%
2009
Below basic 23.2% 42.8% 32.3% 51.9%Basic 38.9% 39.3% 54.4% 43.7%Adequate 28.5% 14.9% 11.9% 4.2%Advanced 9.4% 3.0% 1.5% 0.3%Total 100.0% 100.0% 100.0% 100.0%
2011
Below basic 23.0% 42.6% 28.5% 49.0%Basic 38.0% 40.4% 56.9% 45.2%Adequate 28.1% 14.2% 13.0% 5.3%Advanced 11.0% 2.9% 1.6% 0.4%Total 100.0% 100.0% 100.0% 100.0%
2013
Below basic 21.2% 46.2% 30.8% 50.0%Basic 35.3% 37.3% 55.2% 44.5%Adequate 29.7% 13.8% 12.4% 5.1%Advanced 13.8% 2.7% 1.6% 0.4%Total 100.0% 100.0% 100.0% 100.0%
Source: Prepared with Prova Brasil data from 2007 to 2013.
C.4 Socioeconomic status (SES)
The socioeconomic status (SES) is recognized
as the most important factor in educational
research (COLEMAN et al., 1966; FORQUIN,
1995). However, there is no unanimous definition
in the literature regarding the construct and how
it should be measured empirically (HAUSER;
WARREN, 1997; ERIKSON; GOLDTHORPE,
1992; GANZEBOOM; DE GRAAF; TREIMAN,
1992; NERI, 2012; PASTORE, 1979; PASTORE;
SILVA, 2000).
In this study, the SES was calculated by the
synthesis of items answered by students on
the contextual surveys from the SAEB from
2005 to 2013 and from Brazil’s National High
School Exam (Exame Nacional do Ensino Médio
– ENEM), from 2007 to 2013, which directly
or indirectly informs the schooling which that
student’s parents have and the family income
pattern. The estimation of the factor with all
the grouped data resulted in a comparable
scale along the years. The methodology for
the estimation of the factor is described in
Alves, Soares and Xavier (2014).
The “SES” factor, originally on a continuous
scale, was categorized in quartiles for this
analysis. The first quartile corresponds to those
students whose SES scores have lower values
and the last quartile corresponds to those
students having the highest scores, apart from
the two intermediate categories.
Table 12 shows the distribution pattern for
students by learning level in Reading according
to the SES quartiles and it is similar among
the grades and Prova Brasil editions. There
is a greater concentration of students at the
below basic level in the inferior quartile and the
proportion decreases with improvements in the
socioeconomic condition. 31
SÉRI
E D
ebat
es E
D

In 2007, in 5th grade, 36% of students in
the first SES quartile and 22.3% in the highest
SES quartile (difference of 13.7% between the
groups) were at the below basic level. In 2013,
35.9% in the first SES quartile and 14% of
students in the highest SES quartile (difference
of 21.9% between the groups) were at that
level. We observed that, although there was
a reduction in both groups, the difference
between them increased in 2013.
In the 9th grade, in 2007, 33.7% of students in
the first SES quartile were at the below basic level
in Reading, just as 20.2% of students in the highest
SES quartile, a difference of 13.5% between the
groups. In 2013, 31.7% of students in the first SES
quartile and 19.1% of students in the highest SES
quartile were at that level, a difference of 12.5%.
So, for the 9th grade, contrary to what was observed
in the 5th grade, the difference between the groups
throughout the Prova Brasil editions decreased.
Table 12 – Proportion of students by learning levels in Reading according to SES quartiles by grade and Prova Brasil edition
EditionLearning levels in Reading
5th grade 9th grade
1st quartil
SES (low)
2nd quartil
SES
3rd quartil
SES
4th quartil
SES (high)
1st quartil
SES (low)
2nd quartil
SES
3rd quartil
SES
4th quartil
SES (high)
2007
Below basic 36.0% 29.6% 26.3% 22.3% 33.7% 27.6% 23.9% 20.2%Basic 46.6% 46.3% 43.9% 40.7% 57.1% 58.6% 57.5% 54.9%Adequate 15.4% 20.8% 24.7% 29.4% 8.7% 12.8% 16.9% 22.0%Advanced 2.0% 3.3% 5.0% 7.6% 0.5% 1.0% 1.7% 2.9%Total 100.0% 100.0% 100.0% 100.0% 100.0% 100.0% 100.0% 100.0%
2009
Below basic 35.6% 25.8% 21.1% 17.3% 28.6% 22.2% 19.1% 16.2%Basic 45.0% 44.8% 41.4% 37.3% 57.9% 57.7% 55.3% 51.2%Adequate 16.1% 23.3% 28.1% 31.8% 12.3% 18.0% 22.5% 27.8%Advanced 3.3% 6.1% 9.4% 13.6% 1.1% 2.1% 3.1% 4.8%Total 100.0% 100.0% 100.0% 100.0% 100.0% 100.0% 100.0% 100.0%
2011
Below basic 32.2% 23.9% 18.9% 15.0% 30.2% 22.7% 18.5% 15.5%Basic 44.9% 43.0% 39.0% 34.7% 57.9% 58.3% 56.0% 52.0%Adequate 18.7% 25.5% 30.4% 33.8% 10.9% 16.9% 22.1% 27.4%Advanced 4.3% 7.6% 11.7% 16.5% 1.0% 2.1% 3.4% 5.1%Total 100.0% 100.0% 100.0% 100.0% 100.0% 100.0% 100.0% 100.0%
2013
Below basic 35.9% 25.8% 19.0% 14.0% 31.7% 25.3% 21.3% 19.1%Basic 40.6% 39.6% 35.3% 30.5% 54.9% 54.8% 52.3% 48.8%Adequate 18.3% 25.5% 30.8% 34.0% 12.1% 17.5% 22.6% 26.7%Advanced 5.2% 9.2% 14.9% 21.5% 1.3% 2.4% 3.7% 5.3%Total 100.0% 100.0% 100.0% 100.0% 100.0% 100.0% 100.0% 100.0%
Source: Prepared with Prova Brasil data from 2007 to 2013.
In Mathematics (Table 13), the same
phenomenon is observed: the proportion of
students at the below basic level is greater
among students in the first quartile; the
percentage of students with below basic
proficiency decreased, for both the 5th and 9th
grades; and the differences between the groups
of a lower SES and a greater SES increases in
the 5th grade but diminished in the 9th grade.
32
SÉRI
E D
ebat
es E
D

15. Magda Soares defines literacy as “the result of the action of teaching or learning to read and write: the state or condition acquired by a social group or individual as a consequence of having appropriated writing” (SOARES, 1999, p. 18). It is the insertion of reading and writing into the social practices that distinguishes reading and writing skills from literacy.
Table 13 – Proportion of students by learning levels in Mathematics according to SES quartiles by grade and Prova Brasil edition
EditionLearning levels in Mathematics
5th grade 9th grade
1st quartil
SES (low)
2nd quartil
SES
3rd quartil
SES
4th quartil
SES (high)
1st quartil
SES (low)
2nd quartil
SES
3rd quartil
SES
4th quartil
SES (high)
2007
Below basic 46.6% 38.7% 33.7% 28.1% 47.9% 38.9% 32.5% 26.1%Basic 39.3% 41.5% 40.9% 39.2% 47.3% 53.5% 56.4% 57.1%Adequate 12.3% 16.9% 21.0% 25.6% 4.4% 7.0% 10.0% 14.7%Advanced 1.8% 2.9% 4.4% 7.1% 0.3% 0.6% 1.0% 2.0%Total 100.0% 100.0% 100.0% 100.0% 100.0% 100.0% 100.0% 100.0%
2009
Below basic 43.2% 31.1% 24.6% 19.7% 51.0% 40.6% 34.0% 27.2%Basic 39.3% 41.2% 39.1% 35.4% 44.1% 51.0% 54.0% 54.8%Adequate 14.6% 22.2% 27.8% 31.9% 4.5% 7.7% 10.8% 15.8%Advanced 2.9% 5.5% 8.5% 13.0% 0.4% 0.7% 1.1% 2.2%Total 100.0% 100.0% 100.0% 100.0% 100.0% 100.0% 100.0% 100.0%
2011
Below basic 41.9% 30.3% 23.0% 17.2% 48.0% 36.9% 30.0% 23.8%Basic 39.7% 41.1% 38.8% 34.8% 46.2% 53.8% 56.8% 57.2%Adequate 14.9% 22.2% 28.0% 32.7% 5.3% 8.5% 11.9% 16.6%Advanced 3.6% 6.4% 10.2% 15.3% 0.5% 0.9% 1.3% 2.3%Total 100.0% 100.0% 100.0% 100.0% 100.0% 100.0% 100.0% 100.0%
2013
Below basic 45.4% 32.7% 23.9% 16.8% 49.1% 40.3% 33.4% 27.6%Basic 35.8% 38.5% 36.6% 32.3% 45.6% 51.4% 54.6% 55.1%Adequate 14.7% 21.8% 28.0% 32.9% 4.9% 7.6% 10.9% 15.1%Advanced 4.0% 7.0% 11.5% 18.0% 0.4% 0.7% 1.2% 2.2%Total 100.0% 100.0% 100.0% 100.0% 100.0% 100.0% 100.0% 100.0%
Source: Prepared with Prova Brasil data from 2007 to 2013.
C.5 Reading habits
Studies in the field of the sociology of
education show the importance of reading in a
family’s daily routine in order to prepare students
for the demands of schooling (ALVES et. al.,
2013). In our society, reading is a fundamental
competency that reveals the mastering of a
technology (reading together with writing) and
it constitutes one of the dimensions of literacy.15
The uses of this capacity, expressed by the
different texts genres and by the social possibilities
acquired through this technology, constitute the
other dimension of literacy (SOARES, 1999).
Inspired by this literature, the “reading habits”
factor was estimated through an overview
of items from the student survey about their
reading practices in different genres (books and
comics) and, through observing the student,
the reading habits of their parents. The original
factor was divided in a continuous scale into
two categories in the 50th percentile, the first of
which corresponds to students whose families
have lower scores in the factor and the second
percentile to students whose families have
higher scores.
It was noted in Table 14 that a higher
proportion of students at a below basic level
in Reading were among those whose families’
reading habits lay in the lowest percentile,
except in 2011 for students in 9th grade,
when the proportions are almost identical
33
SÉRI
E D
ebat
es E
D

in the two groups. On the other hand, for
adequate and advanced learning levels,
the ratios are higher in the group with higher
reading habits.
Table 15 displays the distribution of these
proportions for learning levels in Mathematics.
The pattern identified is very similar to the
previous table – that is, there is a slightly
higher proportion of students at below basic
levels when their families’ reading habits are
at lower scores. However, for the 9th grade in
2011 and 2013, the proportions are inverted,
although the observed differences are quite
minor. At basic, adequate and advanced levels,
the results follow the expected pattern, with
a higher proportion of students at these levels
among those with higher scores in the “reading
habits” factor.
Table 14 – Proportion of students by learning levels in Reading according to percentiles of the “reading habits” factor by grade and Prova Brasil edition
EditionLearning levels in Reading
5th grade 9th grade
Reading habits (low)
Reading habits (high)
Reading habits (low)
Reading habits (high)
2007
Below basic 34.9% 26.2% 28.8% 26.1%Basic 44.2% 45.2% 57.1% 57.2%Adequate 17.9% 23.9% 13.0% 15.1%Advanced 3.0% 4.8% 1.2% 1.6%Total 100.0% 100.0% 100.0% 100.0%
2009
Below basic 30.1% 23.6% 22.9% 20.9%Basic 43.0% 42.3% 56.5% 55.1%Adequate 21.2% 25.6% 18.3% 21.0%Advanced 5.7% 8.6% 2.3% 3.0%Total 100.0% 100.0% 100.0% 100.0%
2011
Below basic 25.1% 18.7% 21.1% 21.3%Basic 41.3% 38.9% 56.4% 53.1%Adequate 25.3% 29.9% 19.7% 21.4%Advanced 8.3% 12.6% 2.8% 4.3%Total 100.0% 100.0% 100.0% 100.0%
2013
Below basic 25.1% 18.2% 23.5% 21.9%Basic 37.3% 34.4% 52.9% 49.9%Adequate 26.5% 30.5% 20.4% 23.5%Advanced 11.1% 16.9% 3.2% 4.8%Total 100.0% 100.0% 100.0% 100.0%
Source: Prepared with Prova Brasil data from 2007 to 2013.
34
SÉRI
E D
ebat
es E
D

Table 15 – Proportion of students by learning levels in Mathematics according to percentiles of the “reading habits” factor by grade and Prova Brasil edition
EditionLearning levels in Mathematics
5th grade 9th grade
Reading habits (low)
Reading habits (high)
Reading habits (low)
Reading habits (high)
2007
Below basic 43.5% 34.8% 40.6% 35.9%Basic 38.6% 41.2% 51.3% 54.0%Adequate 15.1% 19.8% 7.4% 9.1%Advanced 2.8% 4.3% 0.7% 1.0%Total 100.0% 100.0% 100.0% 100.0%
2009
Below basic 35.7% 28.2% 41.4% 36.9%Basic 38.7% 39.1% 49.4% 51.6%Adequate 20.2% 24.9% 8.3% 10.3%Advanced 5.4% 7.8% 0.9% 1.2%Total 100.0% 100.0% 100.0% 100.0%
2011
Below basic 30.3% 24.7% 33.1% 36.6%Basic 38.6% 38.4% 54.6% 50.9%Adequate 23.1% 26.6% 11.1% 10.9%Advanced 7.9% 10.3% 1.3% 1.6%Total 100.0% 100.0% 100.0% 100.0%
2013
Below basic 30.7% 23.6% 35.2% 36.3%Basic 36.0% 35.6% 53.0% 51.5%Adequate 24.0% 27.8% 10.6% 10.7%Advanced 9.4% 13.0% 1.2% 1.5%Total 100.0% 100.0% 100.0% 100.0%
Source: Prepared with Prova Brasil data from 2007 to 2013.
C.6 Parent involvement
The “parent involvement factor” is inspired
by the concept of social capital as proposed
by Coleman (2000), which describes the
relationships – among individuals in a family and
in the community – which aid in the intellectual
development of the children. According to this
author, the parents’ human capital presents a
winning potential for their child’s education,
yet this family advantage only happens if
those parents spend time with their children.
Put another way, if the parents’ human capital
is not complemented by the intrinsic social
capital in the family relationships, the parents’
schooling level will be irrelevant for the child’s
school trajectory.
In this study, parent involvement was
estimated by the synthesis of items that were
answered by the students on the contextual
surveys that try to infer about the relationships
among parents and children that revolve around
the school and school activities, even though
they don’t inform about the quality and the
quantity of time that parents spend with their
children. The original factor, in a continuous
scale, was divided into two categories in the
50th percentile, being that the first corresponds
to students whose families have higher scores.
Table 16 shows that, in the 5th grade, in 2007,
the proportion of students at the below basic
level in Reading among those with low scores
for the “parent involvement” factor is 36.8%.
Among the students with higher scores, the
proportion at the below basic level is 25.6%
(a difference of 11.2 percentage points). In
2013, those values were, respectively, 31.6%
and 15.3% (a difference of 16.3 percentage
points). Therefore, even though there was
a reduction in the percentage of students at 35
SÉRI
E D
ebat
es E
D

the below the basic level in both groups, the
differences among students increased.
In the 9th grade, a similar phenomenon
was observed, that is, there was a reduction
in the percentage of students at the below
basic level in both groups and the differences
among the students discriminated by the
parent involvement scores also increased. The
difference, which was 1.3%, in 2007, increased
to 3.4%, in 2013.
Table 16 – Proportion of students by learning levels in Reading according to percentiles of the “parent involvement” factor by grade and Prova Brasil edition
EditionLearning levels in Reading
5th grade 9th grade
Parent involvement (lesser)
Parent involvement (greater)
Parent involvement (lesser)
Parent involvement (greater)
2007
Below basic 36.8% 25.6% 28.1% 26.7%Basic 43.1% 45.6% 56.8% 57.3%Adequate 17.2% 24.1% 13.9% 14.5%Advanced 3.0% 4.8% 1.3% 1.5%Total 100.0% 100.0% 100.0% 100.0%
2009
Below basic 32.0% 22.9% 22.1% 21.6%Basic 42.5% 42.5% 55.5% 55.7%Adequate 19.9% 26.0% 19.9% 19.9%Advanced 5.5% 8.6% 2.6% 2.8%Total 100.0% 100.0% 100.0% 100.0%
2011
Below basic 31.6% 17.2% 22.9% 20.1%Basic 41.4% 39.6% 55.3% 56.0%Adequate 20.7% 30.9% 19.1% 20.6%Advanced 6.3% 12.3% 2.7% 3.3%Total 100.0% 100.0% 100.0% 100.0%
2013
Below basic 31.6% 15.3% 25.2% 21.8%Basic 37.6% 34.8% 51.7% 52.3%Adequate 22.0% 32.7% 20.0% 21.9%Advanced 8.8% 17.2% 3.1% 3.9%Total 100.0% 100.0% 100.0% 100.0%
Source: Prepared with Prova Brasil data from 2007 to 2013.
Table 17 shows that the distribution patterns
for students by learning level in Mathematics
according to the “parent involvement” factor
are similar to what was observed in Reading.
There was a reduction in the percentage of
students at the below basic level for both the
5th and 9th grades among students with a lesser
or greater parent involvement, from 2007 to
2013, but there was also an increase in the
differences of the proportion of students at the
below basic proficiency level discriminated by
the factor’s two groups.
36
SÉRI
E D
ebat
es E
D

Table 17 – Proportion of students by learning levels in Mathematics according to percentiles of the “parent involvement” factor by grade and Prova Brasil edition
EditionLearning levels in Mathematics
5th grade 9th grade
Parent involvement (lesser)
Parent involvement (greater)
Parent involvement (lesser)
Parent involvement (greater)
2007
Below basic 44.6% 34.6% 38.1% 37.5%Basic 37.7% 41.6% 52.6% 53.1%Adequate 14.9% 19.7% 8.5% 8.4%Advanced 2.8% 4.2% 0.9% 0.9%Total 100.0% 100.0% 100.0% 100.0%
2009
Below basic 36.9% 27.9% 38.6% 38.7%Basic 37.8% 39.4% 50.7% 50.7%Adequate 19.8% 24.9% 9.6% 9.4%Advanced 5.5% 7.7% 1.0% 1.1%Total 100.0% 100.0% 100.0% 100.0%
2011
Below basic 37.0% 22.8% 35.1% 32.9%Basic 37.7% 39.0% 53.0% 54.4%Adequate 19.3% 27.6% 10.6% 11.3%Advanced 6.0% 10.6% 1.2% 1.4%Total 100.0% 100.0% 100.0% 100.0%
2013
Below basic 38.0% 20.2% 37.5% 34.2%Basic 34.6% 36.5% 51.4% 53.4%Adequate 20.0% 29.7% 10.0% 11.0%Advanced 7.4% 13.6% 1.2% 1.4%Total 100.0% 100.0% 100.0% 100.0%
Source: Prepared with Prova Brasil data from 2007 to 2013.
D. Description of school factors according to students’ learning levels
In this section, the focus is on school
characteristics and student performance levels.
Various constructed school factors will be
analyzed based on the contextual surveys on
the school, the principal and the teachers, using
literature on school effectiveness (BROOKE;
SOARES, 2008; JENCKS, 2008; LEE, 2008;
SOARES, 2007). The factors aim to capture
differences among teaching establishments
regarding: the school’s inner organization,
the role of the principal, the educational plan,
teaching organization and methods, resources
used in the classroom, the school environment
(type of academic focus, disciplinary
environment and relationship among the
professionals) and the school infrastructure.
According to this literature, there is a positive
association among some school factors and
student performance, which are investigated
in the studies on the characteristics of effective
schools (SAMMONS; HILLMAN; MORTIMORE,
1995). With the results of these studies, there
is also the objective of promoting an extension
of good practices for all the schools, aiming to
achieve greater equity in schooling conditions,
even though it is not possible to establish a
causal relationship based on this study’s findings
(BROOKE; SOARES, 2008).
Therefore, in this section, we present the
averages for the school factors regarding
teaching establishments attended by students
who were separated by performance levels
(below basic, basic and adequate/advanced)
on the 2007 to 2013 evaluations. The two
highest levels were merged due to the low 37
SÉRI
E D
ebat
es E
D

percentage of students at the advanced level
(especially in 9th grade) and also in order to
simplify the presentation.
For the following tables, we calculated the
differences in the score averages for the factors
among students at the below basic level and
at the adequate/advanced level. To facilitate
the interpretation of these tables, the original
scores of the factors, in standard deviation,
were transformed into a scale of 1 to 10 points.
The analytical interest of these descriptive
tables is the comparison of the schooling
conditions for students in a school exclusion
situation, that is, the students at the below
basic level on the SAEB scale, compared to
students in other situations.
In addition to these averages, on each table,
we will present the differences among the school
factor averages for students at the below basic
level (BB) compared to those that are at the
adequate/advanced (AD) level, as well as for those
and the basic level (B) compared to those at the
adequate/advanced (AD) level, in the evaluations
conducted from 2007 to 2013. Therefore, we
intend to analyze if a trend exists regarding the
equalization of schooling conditions, measured
by the school factors from 2007 to 2013, and
considering the performance levels.
The constructed school factors were grouped
into four themes: (1) school leadership; (2)
school environment; (3) teaching and teacher
characteristics; and (4) school infrastructure.
D.1 School leadership
One of the clearest messages found in
the research about school effectiveness is
the importance the role of the principal’s
professional leadership (ABRÚCIO, 2010; ALVES;
FRANCO, 2008; COTTON, 1995; SAMMONS;
HILLMAN; MORTIMORE, 1995; WILLMS, 1992).
The literature highlights the specificity of the
school, which requires a type of leadership
that is simultaneously both administrative and
pedagogical, which translates, for example,
into the capacity to lead the process of creating
and educational plan, to organize the structure
and operation of the school, to manage the
professional team, to act in benefit of a good
school environment, among other factors.
The SAEB contextual surveys include various
items that directly or indirectly measure the
aspects that are related to this topic, as answered
by principals and teachers. The following
factors were tested in this study: administrative
leadership, pedagogical leadership, participative
management, human resources and the
principal’s experience. Additionally, the principal’s
training was also evaluated, within this theme.
D.1.1 Administrative leadership
The “administrative leadership” factor
brings together items that denote the
principal’s capacity to guarantee financial
resources destined for the school’s operation
and maintenance, as well as the capacity to
deal with administrative problems that affect
the school’s routine. This factor highlights
the importance of the principal’s professional
leadership to school effectiveness (ABRÚCIO,
2010; ALVES; FRANCO, 2008; COTTON, 1995;
SAMMONS; HILLMAN; MORTIMORE, 1995,
among others).
As seen in tables 18 and 19, the average
values for the “administrative leadership”
factor show a growing trend between the
editions, mainly for the 9th grade, except for
the 2013 edition. The highest averages are
seen among students with higher learning
levels. In the columns that show the difference
in averages, it can be observed that there is
a growth trend in the values, meaning, from
2007 to 2013, students at the adequate/
advanced level study at schools that showed
greater progress in improving that factor.
38
SÉRI
E D
ebat
es E
D

Table 18 – Average of the “administrative leadership” factor by learning levels in Reading according to grade and Prova Brasil edition
Grade Edition
Learning levels in Reading Differences among levels
Below basic (BB)
Basic (B)Adequate/
advanced (AD)Difference
AD – BBDifference
AD – B
5th grade
2007 7.32 7.41 7.55 0.23 0.142009 7.33 7.45 7.65 0.32 0.202011 7.53 7.67 7.86 0.33 0.192013 7.28 7.45 7.65 0.37 0.20
9th grade
2007 7.34 7.43 7.55 0.21 0.122009 7.44 7.53 7.66 0.22 0.132011 7.61 7.74 7.88 0.27 0.142013 7.34 7.46 7.61 0.27 0.15
Source: Prepared with Prova Brasil data from 2007 to 2013.
Table 19 – Average of the “administrative leadership” factor by learning levels in Mathematics according to grade and Prova Brasil edition
Grade Edition
Learning levels in Mathematics Differences among levels
Below basic (BB)
Basic (B)Adequate/
advanced (AD)Difference
AD – BBDifference
AD – B
5th grade
2007 7.32 7.42 7.58 0.26 0.162009 7.31 7.46 7.69 0.38 0.232011 7.51 7.68 7.91 0.40 0.232013 7.28 7.47 7.68 0.40 0.21
9th grade
2007 7.33 7.46 7.63 0.30 0.172009 7.45 7.57 7.72 0.27 0.152011 7.62 7.77 7.94 0.32 0.172013 7.35 7.50 7.69 0.34 0.19
Source: Prepared with Prova Brasil data from 2007 to 2013.
D.1.2 Pedagogical leadership
The “pedagogical leadership” factor
brings together items about the teachers’
perceptions regarding the pedagogical
principal’s performance. According to the
literature, involvement with the pedagogical
processes by part of the management team
is one of the best indicators of professional
leadership in the educational area (WILLMS,
1992). The idea of pedagogical leadership
suggests an entrepreneurial performance from
the principal in organizing and estimating
the entire team’s participation in reaching
project goals in order to improve the school
(ABRÚCIO, 2010).
According to the information on tables 20
and 21, one can see that the averages for the
“pedagogical leadership” factor are consistently
higher for the adequate/advanced learning
levels in Reading and Mathematics, as are the
differences according to learning levels.
39
SÉRI
E D
ebat
es E
D

Table 20 – Average for the “pedagogical leadership” factor by learning levels in Reading according to grade and Prova Brasil edition
Grade Edition
Learning levels in Reading Differences among levels
Below basic (BB)
Basic (B)Adequate/
advanced (AD)Difference
AD – BBDifference
AD – B
5th grade
2007 6.83 6.91 7.03 0.20 0.122009 6.94 7.05 7.24 0.30 0.192011 7.12 7.23 7.40 0.28 0.172013 6.64 6.85 7.11 0.47 0.26
9th grade
2007 6.80 6.87 6.96 0.16 0.092009 6.94 7.03 7.14 0.20 0.112011 7.10 7.20 7.31 0.21 0.112013 6.70 6.86 7.03 0.33 0.17
Source: Prepared with Prova Brasil data from 2007 to 2013.
Table 21 – Average for the “pedagogical leadership” factor by learning levels in Mathematics according to grade and Prova Brasil edition
Grade Edition
Learning levels in Mathematics Differences among levels
Below basic (BB)
Basic (B)Adequate/
advanced (AD)Difference
AD – BBDifference
AD – B
5th grade
2007 6,84 6,91 7,05 0,21 0,142009 6,93 7,05 7,28 0,35 0,232011 7,10 7,23 7,46 0,36 0,232013 6,65 6,88 7,16 0,51 0,28
9th grade
2007 6,80 6,89 7,04 0,24 0,152009 6,95 7,06 7,21 0,26 0,152011 7,11 7,22 7,39 0,28 0,172013 6,71 6,90 7,14 0,43 0,24
Source: Prepared with Prova Brasil data from 2007 to 2013.
D.1.3 Participative management
The “participative management” factor refers
to the instances and the participative processes
that involve principals, teachers, students and the
community outside of the school. The supposition
is that the more democratic or participative
management is then the more beneficial to
pedagogical work it is and, consequently,
improves the quality of the education offered
(DOURADO, 2007).
The information presented in tables 22 and
23 shows that the greater the learning level,
the greater the score averages for this factor.
The average values are higher for the 9th grade,
both in Reading and in Mathematics, while
the greatest differences among the groups are
observed for the 5th grade, mainly between the
adequate/advanced level and the below basic
level (AD – BB).
40
SÉRI
E D
ebat
es E
D

Table 22 – Average for the “participative management” factor by learning levels in Reading according to grade and Prova Brasil edition
Grade Edition
Learning levels in Reading Differences among levels
Below basic (BB)
Basic (B)Adequate/
advanced (AD)Difference
AD – BBDifference
AD – B
5th grade
2007 8.05 8.19 8.41 0.36 0.222009 7.16 7.38 7.64 0.48 0.262011 7.95 8.14 8.36 0.41 0.222013 6.69 6.96 7.24 0.55 0.28
9th grade
2007 8.54 8.67 8.85 0.31 0.182009 7.79 7.95 8.17 0.38 0.222011 8.47 8.63 8.81 0.34 0.182013 7.16 7.29 7.47 0.31 0.18
Source: Prepared with Prova Brasil data from 2007 to 2013.
Table 23 – Average for the “participative management” factor by learning levels in Mathematics according to grade and Prova Brasil edition
Grade Edition
Learning levels in Mathematics Differences among levels
Below basic (BB)
Basic (B)Adequate/
advanced (AD)Difference
AD – BBDifference
AD – B
5th grade
2007 8.06 8.22 8.42 0.36 0.202009 7.15 7.42 7.65 0.50 0.232011 7.93 8.17 8.38 0.45 0.212013 6.70 7.01 7.26 0.56 0.25
9th grade
2007 8.53 8.71 8.90 0.37 0.192009 7.83 8.02 8.19 0.36 0.172011 8.49 8.69 8.80 0.31 0.112013 7.15 7.35 7.52 0.37 0.17
Source: Prepared with Prova Brasil data from 2007 to 2013.
D.1.4 Human resources
The “human resources” factor includes items
that refer to the teaching staff’s stability, to problems
such as a lack of teachers for some knowledge
area and a lack of personnel for pedagogical
support, along with teacher absenteeism and
turnover rates. They are problems that affect
school functioning and, as a consequence, the
students’ academic performance (GAME, 2002).
The factor’s highest values indicate that the school
has fewer problems of this nature.
The averages for the “human resources”
factor, described in tables 24 and 25, show
little variation among the learning levels, mainly
for Reading, in the 5th grade. In Mathematics,
the adequate/advanced learning level shows
the most elevated averages and the greatest
differences for the rest of the levels, for both
the 5th and 9th grades.
41
SÉRI
E D
ebat
es E
D

Table 24 – Average for the “human resources” factor by learning levels in Reading according to grade and Prova Brasil edition
Grade Edition
Learning levels in Reading Differences among levels
Below basic (BB)
Basic (B)Adequate/
advanced (AD)Difference
AD – BBDifference
AD – B
5th grade
2007 7.48 7.52 7.59 0.11 0.072009 7.07 7.07 7.13 0.06 0.062011 7.32 7.31 7.32 0.00 0.012013 7.23 7.19 7.19 -0.04 0.00
9th grade
2007 6.49 6.52 6.58 0.09 0.062009 6.03 6.05 6.01 -0.02 -0.042011 6.17 6.14 6.08 -0.09 -0.062013 6.29 6.30 6.26 -0.03 -0.04
Source: Prepared with Prova Brasil data from 2007 to 2013.
Table 25 – Average for the “human resources” factor by learning levels in Mathematics according to grade and Prova Brasil edition
Grade Edition
Learning levels in Mathematics Differences among levels
Below basic (BB)
Basic (B)Adequate/
advanced (AD)Difference
AD – BBDifference
AD – B
5th grade
2007 7.50 7.50 7.61 0.11 0.112009 7.06 7.06 7.16 0.10 0.102011 7.31 7.28 7.36 0.05 0.082013 7.22 7.18 7.20 -0.02 0.02
9th grade
2007 6.48 6.52 6.69 0.21 0.172009 6.04 6.02 6.09 0.05 0.072011 6.16 6.09 6.21 0.05 0.122013 6.30 6.27 6.31 0.01 0.04
Source: Prepared with Prova Brasil data from 2007 to 2013.
D.1.5 School Principal’s education
The items referring to the principal’s education
were treated as discriminating variables instead
of synthesized into one factor, because the
variables related to the theme are categories
that could not be reduced to a scale. Therefore,
the principal’s education will be described by the
items: principal’s initial academic education, a
postgraduate studies16 and continuing education.
The item relating to the initial academic
training has three categories: no higher education;
has a higher education but no teaching license;
higher education with a teaching license. The
latter corresponds to the training required for
a basic education professional in teaching or
management.
For purposes of this description, the information
on tables 26 and 27 point out the relationship
among the learning levels for each Prova Brasil
edition and the proportion of principals with a
teaching license. It was noted that, at every learning
level, the proportion of principals with a graduate
degree increased between 2007 and 2013, both in
the results for Reading as well as for Mathematics.
The students with below basic learning levels
systematically study in schools with less qualified
principals, particularly in the 5th grade.
16. In Brazil, the school principal’s education required by law is to have undergraduate pedagogical course or specific degree in Teaching. The Brazililan law does not require a graduate degree for principals.
42
SÉRI
E D
ebat
es E
D

Table 26 – Average for the proportion of principals with a teaching license by learning levels in Reading according to grade and Prova Brasil edition
Grade Edition
Learning levels in Reading Differences among levels
Below basic (BB)
Basic (B)Adequate/
advanced (AD)Difference
AD – BBDifference
AD – B
5th grade
2007 77.21 77.69 78.66 1.45 0.972009 76.13 77.42 78.18 2.05 0.762011 79.15 81.44 83.38 4.23 1.942013 89.01 90.95 92.68 3.67 1.73
9th grade
2007 77.27 77.59 77.57 0.30 -0.022009 74.91 75.34 75.16 0.25 -0.182011 80.79 82.22 82.66 1.87 0.442013 90.10 91.10 91.56 1.46 0.46
Source: Prepared with Prova Brasil data from 2007 to 2013.
Table 27 – Average for the proportion of principals with a teaching license by learning levels in Mathematics according to grade and Prova Brasil edition
Grade Edition
Learning levels in Mathematics Differences among levels
Below basic (BB)
Basic (B)Adequate/
advanced (AD)Difference
AD – BBDifference
AD – B
5th grade
2007 77.22 77.83 78.75 1.53 0.922009 76.20 77.43 78.35 2.15 0.922011 79.20 81.71 83.62 4.42 1.912013 89.10 91.27 92.84 3.74 1.57
9th grade
2007 77.38 77.59 77.46 0.08 -0.132009 75.19 75.20 75.26 0.07 0.062011 81.17 82.46 82.40 1.23 -0.062013 90.28 91.29 91.69 1.41 0.40
Source: Prepared with Prova Brasil data from 2007 to 2013.
The item related to postgraduate courses
done by the principal has five categories: no
postgraduate courses, took refresher courses; took
a specialization course; has a master’s degree;
and has a doctorate. For this descriptive analysis,
the information in tables 28 and 29 show the
relationship between the learning levels by Prova
Brasil edition and the proportion of principals who
have any type postgraduate course listed above.
At all learning levels between 2007 and 2013,
an increase was seen in the proportion of principals
with postgraduate degrees, both for evaluations in
Reading and Mathematics. Students at below basic
learning levels systematically study in schools with
the lowest proportion of principals with some type
of postgraduate training.
It is worth noting, however, that the
difference between the students who
are at the basic level and those who are
at the adequate/advanced level (B-AD) is
negative. This means that students at an
adequate/advanced learning level did not,
on the average, study in schools with more
qualified principals. This aspect is analyzed
more accurately with the results of statistical
models in the next section.
43
SÉRI
E D
ebat
es E
D

Table 28 – Average for the proportion of principals with postgraduate studies by learning levels in Reading according to grade and Prova Brasil edition
Grade Edition
Learning levels in Reading Differences among levels
Below basic (BB)
Basic (B)Adequate/
advanced (AD)Difference
AD – BBDifference
AD – B
5th grade
2007 63.27 72.06 67.21 3.94 -4.852009 65.80 75.84 70.73 4.93 -5.112011 72.84 80.49 76.65 3.81 -3.842013 75.37 83.43 79.81 4.44 -3.62
9th grade
2007 71.54 77.57 74.63 3.09 -2.942009 74.18 80.86 77.56 3.38 -3.302011 79.22 84.23 82.12 2.90 -2.112013 81.45 84.98 83.81 2.36 -1.17
Source: Prepared with Prova Brasil data from 2007 to 2013.
Table 29 – Average for the proportion of principals with postgraduate studies by learning levels in Mathematics according to grade and Prova Brasil edition
Grade Edition
Learning levels in Mathematics Differences among levels
Below basic (BB)
Basic (B)Adequate/
advanced (AD)Difference
AD – BBDifference
AD – B
5th grade
2007 63.59 72.46 68.01 4.42 -4.452009 65.74 76.25 71.26 5.52 -4.992011 72.78 80.81 77.34 4.56 -3.472013 75.63 83.64 80.61 4.98 -3.03
9th grade
2007 71.45 79.16 75.37 3.92 -3.792009 74.98 81.84 78.67 3.69 -3.172011 79.55 84.93 82.85 3.30 -2.082013 81.95 85.44 84.20 2.25 -1.24
Source: Prepared with Prova Brasil data from 2007 to 2013.
The item referring to the principal’s
continuing education has only two categories:
if the principal participated in any continuing
education activity in the last two years or
did not participate. For the purposes of this
description, the information in tables 30 and
31 show the relationship between the learning
levels by Prova Brasil edition and the proportion
of principals who took this type of training.
Due perhaps to the diversity of these kinds
of courses that professionals can take, there
is not a very clear pattern in the data on the
tables regarding the time dimension evaluated
(2007-2013). Nevertheless, in both Reading
and Mathematics, students who are at below
basic levels systematically study in schools
where fewer principals had the opportunity to
undergo some kind of continuing education.
The difference between the students who are
at this level in comparison to students who are
at the adequate/advanced level (AD – BB) is
higher in 2013.
44
SÉRI
E D
ebat
es E
D

Table 30 – Average for the proportion of principals who underwent continuing education by learning levels in Reading according to grade and Prova Brasil edition
Grade Edition
Learning levels in Reading Differences among levels
Below basic (BB)
Basic (B)Adequate/
advanced (AD)Difference
AD – BBDifference
AD – B
5th grade
2007 90.55 91.34 92.45 1.90 1.112009 89.48 90.39 90.98 1.50 0.592011 90.03 90.71 91.34 1.31 0.632013 82.07 84.08 86.22 4.15 2.14
9th grade
2007 90.54 91.19 91.79 1.25 0.602009 89.27 89.96 89.89 0.62 -0.072011 90.39 90.64 90.71 0.32 0.072013 85.04 86.14 87.47 2.43 1.33
Source: Prepared with Prova Brasil data from 2007 to 2013.
Table 31 – Average for the proportion of principals who underwent continuing education by learning levels in Mathematics according to grade and Prova Brasil edition
Grade Edition
Learning levels in Mathematics Differences among levels
Below basic (BB)
Basic (B)Adequate/
advanced (AD)Difference
AD – BBDifference
AD – B
5th grade
2007 90.64 91.53 92.47 1.83 0.942009 89.49 90.45 91.07 1.58 0.622011 89.90 90.82 91.51 1.61 0.692013 82.20 84.49 86.35 4.15 1.86
9th grade
2007 90.59 91.35 91.82 1.23 0.472009 89.55 90.00 89.67 0.12 -0.332011 90.41 90.70 90.71 0.30 0.012013 85.10 86.57 87.96 2.86 1.39
Source: Prepared with Prova Brasil data from 2007 to 2013.
D.1.6 School Principal’s experience
The “principal’s experience” factor brings
together items on the principal’s time working
in education, within the school, as a principal,
and if he or she had experience as a teacher
before becoming principal.
The average for the “principal’s experience”
factor, shown in tables 32 and 33, are low for all
learning levels and years of Prova Brasil edition,
both in Reading and in Mathematics. Yet, the
highest values of these averages are in the
adequate/advanced level, for both the evaluation
in Mathematics and Reading. The differences
between the learning levels are higher for the
5th grade in Reading and for Mathematics in the
9th grade, and boast a slightly increasing trend
among the editions included.
45
SÉRI
E D
ebat
es E
D

Table 32 – Average for the “principal‘s experience” factor by learning levels in Reading according to grade and Prova Brasil edition
Grade Edition
Learning levels in Reading Differences among levels
Below basic (BB)
Basic (B)Adequate/
advanced (AD)Difference
AD – BBDifference
AD – B
5th grade
2007 4.24 4.40 4.64 0.40 0.242009 4.22 4.42 4.70 0.48 0.282011 4.35 4.51 4.78 0.43 0.272013 2.90 3.14 3.42 0.52 0.28
9th grade
2007 4.41 4.53 4.74 0.33 0.212009 4.48 4.63 4.91 0.43 0.282011 4.59 4.74 4.99 0.40 0.252013 3.31 3.43 3.67 0.36 0.24
Source: Prepared with Prova Brasil data from 2007 to 2013.
Table 33 – Average for the “principal’s experience” factor by learning levels in Mathematics according to grade and Prova Brasil edition
Grade Edition
Learning levels in Mathematics Differences among levels
Below basic (BB)
Basic (B)Adequate/
advanced (AD)Difference
AD – BBDifference
AD – B
5th grade
2007 4.27 4.43 4.64 0.37 0.212009 4.21 4.44 4.72 0.51 0.282011 4.33 4.55 4.82 0.49 0.272013 2.91 3.19 3.45 0.54 0.26
9th grade
2007 4.44 4.56 4.75 0.31 0.192009 4.50 4.71 4.99 0.49 0.282011 4.61 4.81 5.02 0.41 0.212013 3.31 3.51 3.73 0.42 0.22
Source: Prepared with Prova Brasil data from 2007 to 2013.
D.2 School environment
School environment is a concept introduced
in educational research from the 1970s to
characterize the type of environment that is
conducive to teaching and learning that was
observed in some schools and that could improve
student performance. Literature on the subject
reports different ways of referring to this issue,
in addition to the term “school environment”,
for example, “working environment”, “learning
environment”, “teaching environment”, among
other terms (BROOKE; SOARES, 2008).
In educational research, the school environment
is a rather intangible idea, but it has been inferred
by information on the subject in the classroom and
at school, the relationships among students and
between thems and their teachers, the teachers’
expectations regarding the student performance,
the school’s academic emphasis, to name a few
possibilities.
The SAEB contextual surveys include several
items that directly or indirectly measure
aspects related to this topic. The following
factors were considered in this study: cohesion
of the edudcational team, school operating
conditions, interventions for improvement and
school violence.
46
SÉRI
E D
ebat
es E
D

D.2.1 Cohesion of the pedagogical team
The “cohesion of the pedagogical team” factor
sums up items regarding working methods and the
relationships among principals and other members
of the educational staff, such as the exchange of
ideas and sharing of educational activities.
According to the information presented in
tables 34 and 35, the average for the “cohesion of
the pedagogical team” factor posted very minor
differences between the learning levels. However,
even so, a tendency can be observed in which
the adequate/advanced level presents a higher
average in all editions analyzed. There is also
growth in the difference between the averages of
the factor between students at the below basic
level and students at the advanced/adequate level
(BB – AD) from 2007 to 2013, both in Reading
and in Mathematics, particularly for the results
from the latter for the 5th grade.
Table 34 – Average for the “cohesion of the pedagogical team” factor by learning levels in Reading according to grade and Prova Brasil edition
Grade Edition
Learning levels in Reading Differences among levels
Below basic (BB)
Basic (B)Adequate/
advanced (AD)Difference
AD – BBDifference
AD – B
5th grade
2007 7.21 7.24 7.32 0.11 0.082009 7.28 7.33 7.47 0.19 0.142011 7.36 7.45 7.57 0.21 0.122013 6.84 6.97 7.13 0.29 0.16
9th grade
2007 7.02 7.07 7.14 0.12 0.072009 7.13 7.16 7.24 0.11 0.082011 7.19 7.26 7.33 0.14 0.072013 6.78 6.87 6.97 0.19 0.10
Source: Prepared with Prova Brasil data from 2007 to 2013.
Table 35 – Average for the “cohesion of the pedagogical team” factor by learning levels in Mathematics according to grade and Prova Brasil edition
Grade Edition
Learning levels in Mathematics Differences among levels
Below basic (BB)
Basic (B)Adequate/
advanced (AD)Difference
AD – BBDifference
AD – B
5th grade
2007 7.22 7.25 7.34 0.12 0.092009 7.27 7.33 7.50 0.23 0.172011 7.35 7.44 7.61 0.26 0.172013 6.84 6.99 7.16 0.32 0.17
9th grade
2007 7.02 7.08 7.19 0.17 0.112009 7.13 7.18 7.28 0.15 0.102011 7.20 7.27 7.38 0.18 0.112013 6.79 6.89 7.03 0.24 0.14
Source: Prepared with Prova Brasil data from 2007 to 2013.
47
SÉRI
E D
ebat
es E
D

D.2.2 School operating conditions
The “school operating conditions” factor
includes items regarding situations that affect the
school routine and involve members of the school
community, such as disruptions of school activities,
high rates of absenteeism on the part of students
and disciplinary problems.
Through the information related to the
“operating condition” factor (presented on
tables 36 and 37), it can be seen that the
higher the learning level, the greater the
averages for this factor. The averages for the
adequate/advanced level stands out from the
others in all Prova Brasil editions and in the
two grades that were analyzed. Compared to
2007, the differences between the levels are
lower in 2013, which indicates an equalization
trend among the schools.
Table 36 – Average for the “school operating conditions” factor by learning levels in Reading according to grade and Prova Brasil edition
Grade Edition
Learning levels in Reading Differences among levels
Below basic (BB)
Basic (B)Adequate/
advanced (AD)Difference
AD – BBDifference
AD – B
5th grade
2007 6.66 6.80 7.04 0.38 0.242009 6.52 6.58 6.76 0.24 0.182011 6.68 6.75 6.95 0.27 0.202013 6.57 6.65 6.85 0.28 0.20
9th grade
2007 6.05 6.16 6.35 0.30 0.192009 5.98 6.03 6.12 0.14 0.092011 5.98 6.04 6.16 0.18 0.122013 6.05 6.13 6.24 0.19 0.11
Source: Prepared with Prova Brasil data from 2007 to 2013.
Table 37 – Average for the “school operating conditions” factor by learning levels in Mathematics according to grade and Prova Brasil edition
Grade Edition
Learning levels in Mathematics Differences among levels
Below basic (BB)
Basic (B)Adequate/
advanced (AD)Difference
AD – BBDifference
AD – B
5th grade
2007 6.68 6.82 7.07 0.39 0.252009 6.51 6.57 6.80 0.29 0.232011 6.66 6.75 7.01 0.35 0.262013 6.56 6.66 6.89 0.33 0.23
9th grade
2007 6.04 6.19 6.47 0.43 0.282009 5.98 6.04 6.23 0.25 0.192011 5.97 6.05 6.31 0.34 0.262013 6.06 6.15 6.34 0.28 0.19
Source: Prepared with Prova Brasil data from 2007 to 2013.
48
SÉRI
E D
ebat
es E
D

D.2.3 Intervention for improvements
The “intervention for improvements” factor
summarizes items on the programs developed in
schools in order to reduce dropout rates, grade
failure and promotion or guarantee the right
to education on the part of the students. The
factor expresses, to a certain extent, the school’s
academic focus and the academic community’s
concern with the student performance.
In the information presented in tables 38
and 39, it was noted that the averages for the
“intervention for improvements” factor are
greater for the adequate/advanced learning level
and also show increasing values between 2007
and 2013. There was, however, a reduction in
the differences between the levels, suggesting
a trend toward the equalization of this factor
between schools.
Table 38 – Average for the “intervention for improvements” factor by learning levels in Reading according to grade and Prova Brasil edition
Grade Edition
Learning levels in Reading Differences among levels
Below basic (BB)
Basic (B)Adequate/
advanced (AD)Difference
AD – BBDifference
AD – B
5th grade
2007 5.83 6.01 6.33 0.50 0.322009 5.75 5.97 6.29 0.54 0.322011 5.84 6.09 6.43 0.59 0.342013 6.04 6.17 6.34 0.30 0.17
9th grade
2007 5.47 5.62 5.87 0.40 0.252009 5.55 5.67 5.87 0.32 0.202011 5.59 5.75 5.98 0.39 0.232013 5.96 6.02 6.12 0.16 0.10
Source: Prepared with Prova Brasil data from 2007 to 2013.
Table 39 – Average for the “intervention for improvements” factor by learning levels in Mathematics according to grade and Prova Brasil edition
Grade Edition
Learning levels in Mathematics Differences among levels
Below basic (BB)
Basic (B)Adequate/
advanced (AD)Difference
AD – BBDifference
AD – B
5th grade
2007 5.85 6.04 6.36 0.51 0.322009 5.74 5.99 6.33 0.59 0.342011 5.82 6.11 6.49 0.67 0.382013 6.05 6.19 6.36 0.31 0.17
9th grade
2007 5.47 5.67 5.95 0.48 0.282009 5.57 5.73 5.92 0.35 0.192011 5.62 5.81 6.02 0.40 0.212013 5.97 6.05 6.16 0.19 0.11
Source: Prepared with Prova Brasil data from 2007 to 2013.
49
SÉRI
E D
ebat
es E
D

D.2.4 School violence
The “school violence” factor had a fairly
complex estimation due to changes in the
contextual surveys from 2013, which was
greatly simplified compared to previous years.
This is not a negative criticism because we
assessed that this was a wise decision because
the previous surveys contained many items on
the subject and this compromised the quality
of the answers.
The final conception of the factor includes
only the items responded to by the principal
with respect to typically violent situations, such
as robbery, theft, attempt on life, physical and
verbal assaults and weapons in the school. The
higher scores of the factor indicate situations
with less violence.
Even so, the items are considered as needing
to be improved, because as they are produced
in dichotomous scales (an occurrence or non-
occurrence of the problem) it is not, according
to experts, the ideal approach (AMADO;
FREIRE, 2002).
Because of these difficulties, the analyses
related to this factor should be done with
caution. The reduction in the averages observed
in 2013 may be due to the idiosyncrasies of the
data (fewer items compared to previous years).
That is, it can not be assumed that there was a
worsening in the conditions of schools without
more specific analyses.
Despite these exceptions, the results
presented in tables 40 and 41 confirm the
positive association between the factor and
the school effects when comparing the first
and last quartiles, except for some of the
results for Reading. However, the differences
are minor and the trends are not very clear,
particularly in relation to the 9th grade.
Table 40 – Average for the “school violence” factor by learning levels in Reading according to grade and Prova Brasil edition
Grade Edition
Learning levels in Reading Differences among levels
Below basic (BB)
Basic (B)Adequate/
advanced (AD)Difference
AD – BBDifference
AD – B
5th grade
2007 8.05 8.08 8.16 0.11 0.082009 7.71 7.70 7.75 0.04 0.052011 8.35 8.33 8.37 0.02 0.042013 6.01 6.03 6.07 0.06 0.04
9th grade
2007 7.64 7.63 7.64 -0.00 0.012009 7.28 7.26 7.22 -0.06 -0.042011 7.91 7.87 7.86 -0.05 -0.012013 5.92 5.93 5.95 0.03 0.02
Source: Prepared with Prova Brasil data from 2007 to 2013.
50
SÉRI
E D
ebat
es E
D

Table 41 – Average for the “school violence” factor by learning levels in Mathematics according to grade and Prova Brasil edition
Grade Edition
Learning levels in Mathematics Differences among levels
Below basic (BB)
Basic (B)Adequate/
advanced (AD)Difference
AD – BBDifference
AD – B
5th grade
2007 8.06 8.08 8.17 0.11 0.092009 7.71 7.69 7.76 0.05 0.072011 8.34 8.32 8.39 0.05 0.072013 6.01 6.03 6.08 0.07 0.05
9th grade
2007 7.64 7.62 7.68 0.04 0.062009 7.29 7.23 7.25 -0.04 0.022011 7.89 7.85 7.92 0.03 0.072013 5.91 5.93 5.98 0.07 0.05
Source: Prepared with Prova Brasil data from 2007 to 2013.
D.3 Teaching and teacher characteristics
There is a consensus in educational literature
that the teacher is the key player in generating
good student performance (BRESSOUX, 2003;
GAUTHIER et al., 2014). The effect of the teacher
manifests itself through their characteristics of
status (education, experience, career and working
conditions) and, above all, by the way they teach and
manage the classroom. This can be seen through
the curriculum practiced in the schools, the teaching
methods adopted by the teacher, the existence
of an evaluation structure and the monitoring of
students’ performance, as well as through the
teacher’s relationship with their students (CARNOY;
GOVE; MARSHALL, 2009; GAUTHIER et al., 2014;
LEVINE, 1996; MORTIMORE; SAMMONS; STOLL,
2008; REYNOLDS, 1996).
When educational assessments began to
spread in the 1990s in Brazil, Mello (1994)
suggested some factors related to teaching and
teachers that would be important for school
effectiveness. The author argues that, in order
to explain the impact of schools on student per-
formance, the focus should turn to what takes
place in the classroom, especially regarding the
planning, structure and curricular organization
of the school, as well the mastering of the
content achieved by the teacher (education,
experience, continuing education, monitoring
and supervision), the organization strategy of the
classroom and teaching methods.
However, the educational surveys with
cross-sectional design, like the evaluations that
make up the Saeb, are limited for gauging the
effect of teachers (FRANCO, 2001). Despite
this reservation, it is interesting to analyze the
association between characteristics of teaching
and teachers and student performance, since
they vary widely among Brazilian schools.
Saeb’s contextual surveys include items that
directly or indirectly measure aspects related to
teaching and teacher characteristics. In this study,
the following factors were considered: educational
resources (information and communication
technologies – ICT), printed educational resources,
educational resources for Portuguese, educational
resources for Mathematics, curriculum planning
and compliance, the education and experience of
the teacher.
It should also be pointed out that some items
related to the system of student evaluation
included in the contextual surveys could be
considered in this theme. However, the decision
was made to treat them in the “intervention for
improvements” construct, previously related to
the school environment. 51
SÉRI
E D
ebat
es E
D

D.3.1 Educational resources – ICT
The “use of educational resources – ICT”
factor consists of items from the survey
responded to by the teacher regarding the use
of computers, the Internet and other audiovisual
resources available at the school that are used
for educational purposes.
The information displayed on tables 42 and 43
point out that, from 2007 to 2013, the average
for the “educational resources – ICT” factor grew
at all learning levels in Reading and Mathematics,
and that there is a linear relationship between
the factor and learning levels: students at
lower learning levels are in schools where the
use of ICT is also less frequent. However, the
distances between the average factor among the
adequate/advanced level and the below basic
level (AD – BB) decreased throughout the Prova
Brasil editions or all grades, both in Reading as
well as in Mathematics. Nevertheless, it is seen
that the distance values of the average factors
between learning levels is greater in the 5th grade
than it is in the 9th grade.
Table 42 – Average for the “educational resources – ICT” factor by learning levels in Reading according to grade and Prova Brasil edition
Grade Edition
Learning levels in Reading Differences among levels
Below basic (BB)
Basic (B)Adequate/
advanced (AD)Difference
AD – BBDifference
AD – B
5th grade
2007 5.06 5.43 6.02 0.96 0.592009 5.68 6.17 6.73 1.05 0.562011 6.17 6.56 7.00 0.83 0.442013 7.56 7.93 8.26 0.70 0.33
9th grade
2007 5.72 5.98 6.32 0.60 0.342009 6.52 6.81 7.10 0.58 0.292011 6.69 6.93 7.10 0.41 0.172013 8.06 8.22 8.36 0.30 0.14
Source: Prepared with Prova Brasil data from 2007 to 2013.
Table 43 – Average for the “educational resources – ICT” factor by learning levels in Mathematics according to grade and Prova Brasil edition
Grade Edition
Learning levels in Mathematics Differences among levels
Below basic (BB)
Basic (B)Adequate/
advanced (AD)Difference
AD – BBDifference
AD – B
5th grade
2007 5.07 5.51 6.11 1.04 0.602009 5.65 6.21 6.81 1.16 0.602011 6.16 6.61 7.07 0.91 0.462013 7.57 7.98 8.29 0.72 0.31
9th grade
2007 5.69 6.06 6.51 0.82 0.452009 6.57 6.92 7.21 0.64 0.292011 6.71 6.99 7.17 0.46 0.182013 8.08 8.27 8.43 0.35 0.16
Source: Prepared with Prova Brasil data from 2007 to 2013.
52
SÉRI
E D
ebat
es E
D

D.3.2 Printed educational resources
The “use of printed educational resources”
factor refers to the use of newspapers,
magazines, comic books, textbooks and other
printed material for educational purposes.
Based on the information presented in tables
44 and 45, it was noted that the relationship
between this factor and learning levels is linear,
that is, students in lower learning levels are at
schools where the use of printed resources is
also less frequent. Between 2007 and 2013,
there was improvement in the average factor at
all levels, except in the 5th grade, in the 2013
evaluation, but with very little variation and
around very high values.
Regarding the differences between the
averages of the factor according to the levels,
the conditions are more level in 2013 compared
to previous years.
Table 44 – Average for the “printed educational resources” factor by learning levels in Reading according to grade and Prova Brasil edition
Grade Edition
Learning levels in Reading Differences among levels
Below basic (BB)
Basic (B)Adequate/
advanced (AD)Difference
AD – BBDifference
AD – B
5th grade
2007 8.95 9.02 9.14 0.19 0.122009 8.64 8.87 9.18 0.54 0.312011 8.83 8.99 9.19 0.36 0.202013 9.02 9.10 9.17 0.15 0.07
9th grade
2007 8.70 8.79 8.89 0.19 0.102009 8.26 8.41 8.61 0.35 0.202011 8.23 8.37 8.51 0.28 0.142013 8.83 8.88 8.94 0.11 0.06
Source: Prepared with Prova Brasil data from 2007 to 2013.
Table 45 – Average for the “printed educational resources” factor by learning levels in Mathematics according to grade and Prova Brasil edition
Grade Edition
Learning levels in Mathematics Differences among levels
Below basic (BB)
Basic (B)Adequate/
advanced (AD)Difference
AD – BBDifference
AD – B
5th grade
2007 8.95 9.04 9.15 0.20 0.112009 8.63 8.89 9.22 0.59 0.332011 8.82 9.00 9.23 0.41 0.232013 9.02 9.11 9.18 0.16 0.07
9th grade
2007 8.70 8.81 8.95 0.25 0.142009 8.28 8.48 8.69 0.41 0.212011 8.25 8.41 8.57 0.32 0.162013 8.83 8.90 8.97 0.14 0.07
Source: Prepared with Prova Brasil data from 2007 to 2013.
53
SÉRI
E D
ebat
es E
D

D.3.3 Educational resources – Portuguese
The “use of teaching resources for Portuguese”
factor summarizes specific items responded to
by teachers in this subject about their teaching
practices with support from magazines,
newspapers, textbooks, teaching of grammar
rules, languages etc. The items are measured
according to the usage frequency during the year,
which means that teachers can make use of all of
them, with different emphases.
Table 46 shows that the averages of the factor
are higher at the adequate/advanced learning
level in Reading, except in the 9th grade in 2007
and 2009. Considering the difference factor
average between the adequate/advanced level
and the below basic level (AD – BB), it can be
seen that the differences are low and do not
exhibit a clear trend.
The use of teaching resources specific to
Mathematics will be analyzed below.
Table 46 – Average for the “educational resources – Portuguese” factor by learning levels in Reading according to grade and Prova Brasil edition
Grade Edition
Learning levels in Reading Differences among levels
Below basic (BB)
Basic (B)Adequate/
advanced (AD)Difference
AD – BBDifference
AD – B
5th grade
2007 7.24 7.26 7.30 0.06 0.042009 7.12 7.18 7.29 0.17 0.112011 7.62 7.67 7.74 0.12 0.072013 8.45 8.51 8.56 0.11 0.05
9th grade
2007 6.75 6.75 6.75 0.00 0.002009 5.85 5.84 5.80 -0.05 -0.042011 7.02 7.03 7.04 0.02 0.012013 7.77 7.81 7.82 0.05 0.01
Source: Prepared with Prova Brasil data from 2007 to 2013.
D.3.4 Educational resources – Mathematics
The “use of educational resources for
Mathematics” factor summarizes the teaching
practices of teachers in this subject, like exercises for
memorization, automation, challenges, changes in
procedures related to daily life, etc. The items are
measured according to how often they are used
during the year, which means that teachers can
make use of all of them with different frequencies.
According to Table 47, it can be noted that
the averages of the factor are higher at the
adequate/advanced learning level, regardless of
the grade and the Prova Brasil edition. It should
also be pointed out that the averages increased
at all learning levels between 2007 and 2013.
54
SÉRI
E D
ebat
es E
D

Table 47 – Average for the “educational resources – Mathematics” factor for learning levels in Mathematics according to grade and Prova Brasil edition
Grade Edition
Learning levels in Mathematics Differences among levels
Below basic (BB)
Basic (B)Adequate/
advanced (AD)Difference
AD – BBDifference
AD – B
5th grade
2007 7.80 7.84 7.89 0.09 0.052009 7.68 7.76 7.86 0.18 0.102011 8.19 8.26 8.34 0.15 0.082013 8.80 8.84 8.88 0.08 0.04
9th grade
2007 7.34 7.37 7.41 0.07 0.042009 6.74 6.76 6.75 0.01 -0.012011 7.65 7.68 7.70 0.05 0.022013 8.24 8.26 8.27 0.03 0.01
Source: Prepared with Prova Brasil data from 2007 to 2013.
D.3.5 School curriculum
The “school curriculum” factor refers to
fullfillment and planning of the curriculum during
the academic year, as well as the adequacy of
this curriculum according to the teacher’s vision.
Therefore, it is an indirect approach to the subject,
given that it is not possible to measure the
curriculum content practiced in schools or school
systems solely with the items from the survey.
The information exhibited in tables 48 and
49 shows that students who are at the lowest
learning levels are in schools where the average
“curriculum” factor is smaller. The differences
between the average factors among the
adequate/advanced level and the below basic
level (AD – BB) presented a pattern of growth
during the Prova Brazil editions, both in Reading
and in Mathematics.
Table 48 – Average for the “school curriculum” factor by learning levels in Reading according to grade and Prova Brasil edition
Grade Edition
Learning levels in Reading Differences among levels
Below basic (BB)
Basic (B)Adequate/
advanced (AD)Difference
AD – BBDifference
AD – B
5th grade
2007 7.95 8.15 8.43 0.48 0.282009 7.83 8.09 8.42 0.59 0.332011 8.16 8.41 8.72 0.56 0.312013 7.94 8.27 8.67 0.73 0.40
9th grade
2007 7.98 8.14 8.35 0.37 0.212009 7.88 8.04 8.24 0.36 0.202011 8.15 8.31 8.51 0.36 0.202013 7.96 8.14 8.38 0.42 0.24
Source: Prepared with Prova Brasil data from 2007 to 2013.
55
SÉRI
E D
ebat
es E
D

Table 49 – Average for the “school curriculum” factor by learning levels in Mathematics according to grade and Prova Brasil edition
Grade Edition
Learning levels in Mathematics Differences among levels
Below basic (BB)
Basic (B)Adequate/
advanced (AD)Difference
AD – BBDifference
AD – B
5th grade
2007 7.97 8.18 8.47 0.50 0.292009 7.82 8.11 8.47 0.65 0.362011 8.14 8.44 8.78 0.64 0.342013 7.94 8.33 8.72 0.78 0.39
9th grade
2007 7.99 8.18 8.44 0.45 0.262009 7.90 8.10 8.37 0.47 0.272011 8.16 8.36 8.60 0.44 0.252013 7.96 8.21 8.53 0.57 0.32
Source: Prepared with Prova Brasil data from 2007 to 2013.
D.3.6 Teacher’s experience
The “teacher’s experience” factor sums up
the time of experience in the profession, how
many years the teacher has worked at the
school, and how much experience a teacher has
teaching class for that grade.
By analyzing the information on tables 50
and 51, a reduction can be seen in the value
of the score in 2013 compared to 2007, which
can be interpreted as a renovation in teaching
staff. Students that find themselves at a below
basic level study with less experienced teachers
compared to students who find themselves at
adequate/advanced (AD – BB) levels, according
to the average value of the scores in Reading
and Mathematics.
Table 50 – Average for the “teacher’s experience” factor by learning levels in Reading according to grade and Prova Brasil edition
Grade Edition
Learning levels in Reading Differences among levels
Below basic (BB)
Basic (B)Adequate/
advanced (AD)Difference
AD – BBDifference
AD – B
5th grade
2007 6.13 6.24 6.41 0.28 0.172009 5.93 6.11 6.33 0.40 0.222011 6.47 6.59 6.75 0.28 0.162013 5.86 6.00 6.15 0.29 0.15
9th grade
2007 6.08 6.19 6.33 0.25 0.142009 5.86 5.99 6.14 0.28 0.152011 6.38 6.48 6.62 0.24 0.142013 5.76 5.85 5.95 0.19 0.10
Source: Prepared with Prova Brasil data from 2007 to 2013.
56
SÉRI
E D
ebat
es E
D

Tabela 51 – Average for the “teacher’s experience” factor by learning levels in Mathematics according to grade and Prova Brasil edition
Grade Edition
Learning levels in Mathematics Differences among levels
Below basic (BB)
Basic (B)Adequate/
advanced (AD)Difference
AD – BBDifference
AD – B
5th grade
2007 6.14 6.26 6.43 0.29 0.172009 5.92 6.13 6.36 0.44 0.232011 6.46 6.60 6.79 0.33 0.192013 5.86 6.02 6.18 0.32 0.16
9th grade
2007 6.09 6.21 6.39 0.30 0.182009 5.89 6.03 6.23 0.34 0.202011 6.39 6.51 6.69 0.30 0.182013 5.77 5.87 6.00 0.23 0.13
Source: Prepared with Prova Brasil data from 2007 to 2013.
D.3.7 Initial teacher education
The teacher’s initial education was described
by the proportion, per school, of teachers
whose education included a teaching license,
which is the appropriate training level to
adminster elementary school classes.
According to the information from tables 52
and 53, at all learning levels, the proportion of
teachers with a teaching license grew between
2007 and 2013, except for a drop in 2009. This
decrease, however, could be due to some problem
in collecting information (eg, more questionnaires
went unanswered). Students at a below basic
learning level in Reading and Mathematics
systematically study in schools with the lowest
proportion of adequately educated teachers – a
teaching license – especially in the 5th grade.
Table 52 – Average for the proportion of teachers with a teaching license by learning levels in Reading according to grade and Prova Brasil edition
Grade Edition
Learning levels in Reading Differences among levels
Below basic (BB)
Basic (B)Adequate/
advanced (AD)Difference
AD – BBDifference
AD – B
5th grade
2007 59.31 60.60 62.87 3.56 2.272009 50.88 53.01 55.03 4.15 2.022011 73.06 75.94 79.01 5.95 3.072013 76.56 80.49 84.00 7.44 3.51
9th grade
2007 76.73 78.33 80.12 3.39 1.792009 50.36 51.41 51.49 1.13 0.082011 84.30 86.23 87.80 3.50 1.572013 85.54 86.44 87.82 2.28 1.38
Source: Prepared with Prova Brasil data from 2007 to 2013.
57
SÉRI
E D
ebat
es E
D

Table 53 – Average for the proportion of teachers with a teaching license by learning levels in Mathematics according to grade and Prova Brasil edition
Grade Edition
Learning levels in Mathematics Differences among levels
Below basic (BB)
Basic (B)Adequate/
advanced (AD)Difference
AD – BBDifference
AD – B
5th grade
2007 59.45 61.01 62.80 3.35 1.792009 50.87 53.26 55.17 4.30 1.912011 73.09 76.41 79.27 6.18 2.862013 76.64 81.15 84.43 7.79 3.28
9th grade
2007 76.73 78.82 80.35 3.62 1.532009 50.65 51.54 51.59 0.94 0.052011 84.60 86.77 87.99 3.39 1.222013 85.33 86.98 88.51 3.18 1.53
Source: Prepared with Prova Brasil data from 2007 to 2013.
D.4 School infrastructure
School infrastruture does not merit much
attention in international literature, perhaps
because schools in developed countries offer
good facilities and are more homogeneous. In
Brazil however, infrastructure, equipment and
school resources are important aspects and are
associated with school performance (ANDRADE;
LAROS, 2007; SOARES; ALVES, 2013, among
others). This explains why there are few Brazilian
schools in ideal condition, as only 0.6% of
them have facilities that are considered to be
advanced (SOARES NETO et al., 2013).
Thus, whatever the universe studied in Brazil,
it is important to take into account items such
as the physical facilities and their maintenance
conditions; the existence of didactic and para-
didactic materials; and the usage conditions
and operation of libraries, laboratories,
classrooms, administrative offices and other
school facilities. Contextual questionnaires
from SAEB allow for an investigation into some
of these aspects, namely: the facilities, library,
equipment and maintenance of the school
building – factors explored within this study.
Unlike a School Census, which measures
the existence of items related to school
infrastructure, the contextual surveys emphasize
the usage conditions and the condition of
facilities and equipment at the schools.
D.4.1 Facilities
The “facilities” factor refers to the existence
and the usage conditions of certain physical
spaces in the school: sport court, laboratories,
the auditorium, art room and music room.
Based on the information presented in tables
54 and 55, it was noted that the average factor
is low among all levels; they are even lower
at below basic learning levels. In other words,
students who find themselves at this level study
in schools whose physical facilities offer less
diversified spaces compared to students who
are at basic and adequate/advanced levels.
58
SÉRI
E D
ebat
es E
D

Table 54 – Average for the “facilities” factor by learning levels in Reading according to grade and Prova Brasil edition
Grade Edition
Learning levels in Reading Differences among levels
Below basic (BB)
Basic (B)Adequate/
advanced (AD)Difference
AD – BBDifference
AD – B
5th grade
2007 2.25 2.41 2.59 0.34 0.182009 2.58 2.83 3.09 0.51 0.262011 3.19 3.44 3.73 0.54 0.292013 2.02 2.17 2.37 0.35 0.20
9th grade
2007 2.32 2.46 2.64 0.32 0.182009 2.68 2.83 3.03 0.35 0.202011 3.41 3.56 3.77 0.36 0.212013 2.18 2.23 2.39 0.21 0.16
Source: Prepared with Prova Brasil data from 2007 to 2013.
Table 55 – Average for the “facilities” factor by learning levels in Mathematics according to grade and Prova Brasil edition
Grade Edition
Learning levels in Mathematics Differences among levels
Below basic (BB)
Basic (B)Adequate/
advanced (AD)Difference
AD – BBDifference
AD – B
5th grade
2007 2.26 2.44 2.61 0.35 0.172009 2.57 2.85 3.12 0.55 0.272011 3.16 3.48 3.78 0.62 0.302013 2.01 2.19 2.40 0.39 0.21
9th grade
2007 2.32 2.50 2.67 0.35 0.172009 2.68 2.91 3.09 0.41 0.182011 3.40 3.63 3.78 0.38 0.152013 2.15 2.28 2.46 0.31 0.18
Source: Prepared with Prova Brasil data from 2007 to 2013.
D.4.2 Library
The “library” factor gathers details about the
existence of a library, the amount of users, the
existence of responsible personnel, educational
uses, types of users and the state of the collection.
According to the distribution of averages
indicated in tables 56 and 57, students who
are at the lowest learning levels are in schools
where the school library and the diversity of its
collection are more precarious, as well as having
a lower frequency of usage and a less diverse
profile of its users.
Considering the difference average for the
factor of the adequate/advanced level and
below basic (AD – BB), it was noted that the
differences between the levels in both the
5th and in the 9th grade in Reading and in
Mathematics decreased throughout each
edition of the Prova Brasil.
59
SÉRI
E D
ebat
es E
D

Table 56 – Average for the “library” factor by learning levels in Reading according to grade and Prova Brasil edition
Grade Edition
Learning levels in Reading Differences among levels
Below basic (BB)
Basic (B)Adequate/
advanced (AD)Difference
AD – BBDifference
AD – B
5th grade
2007 6.07 6.28 6.64 0.57 0.362009 6.28 6.46 6.74 0.46 0.282011 6.34 6.46 6.62 0.28 0.162013 6.39 6.49 6.62 0.23 0.13
9th grade
2007 6.33 6.48 6.72 0.39 0.242009 6.63 6.73 6.94 0.31 0.212011 6.64 6.75 6.84 0.20 0.092013 6.69 6.77 6.87 0.18 0.10
Source: Prepared with Prova Brasil data from 2007 to 2013.
Table 57 – Average for the “library” factor by learning levels in Mathematics according to grade and Prova Brasil edition
Grade Edition
Learning levels in Mathematics Differences among levels
Below basic (BB)
Basic (B)Adequate/
advanced (AD)Difference
AD – BBDifference
AD – B
5th grade
2007 6.08 6.34 6.68 0.60 0.342009 6.26 6.48 6.77 0.51 0.292011 6.33 6.48 6.64 0.31 0.162013 6.39 6.51 6.64 0.25 0.13
9th grade
2007 6.33 6.53 6.81 0.48 0.282009 6.64 6.79 6.99 0.35 0.202011 6.65 6.78 6.90 0.25 0.122013 6.69 6.80 6.92 0.23 0.12
Source: Prepared with Prova Brasil data from 2007 to 2013.
D.4.3 Equipments
The “equipments” factor gathers information
about the existence of school computers,
Internet access, audiovisual equipment, printers
and telephones, either for educational or
administrative purposes.
According to the averages described in tables
58 and 59, students who are at the below basic
learning are in schools where the existence or
maintenance conditions and use of equipments
are more precarious. The differences between
the averages according to the performance
groups have fluctuated, and there are not very
clear patterns between Prova Brasil editions.
However, it was noted that the distance of
values for the average of the factor between
learning levels is greater in the 5th grade than
that in the 9th grade.
60
SÉRI
E D
ebat
es E
D

Table 58 – Average for the “equipments” by learning levels factor in Reading according to grade and Prova Brasil edition
Grade Edition
Learning levels in Reading Differences among levels
Below basic (BB)
Basic (B)Adequate/
advanced (AD)Difference
AD – BBDifference
AD – B
5th grade
2007 5.65 5.91 6.31 0.66 0.402009 5.97 6.34 6.77 0.80 0.432011 6.67 7.06 7.51 0.84 0.452013 6.48 6.92 7.34 0.86 0.42
9th grade
2007 6.20 6.37 6.60 0.40 0.232009 6.67 6.86 7.12 0.45 0.262011 7.12 7.37 7.63 0.51 0.262013 7.05 7.20 7.42 0.37 0.22
Source: Prepared with Prova Brasil data from 2007 to 2013.
Table 59 – Average for the “equipments” by learning levels factor in Mathematics according to grade and Prova Brasil edition
Grade Edition
Learning levels in Mathematics Differences among levels
Below basic (BB)
Basic (B)Adequate/
advanced (AD)Difference
AD – BBDifference
AD – B
5th grade
2007 5.66 5.97 6.36 0.70 0.392009 5.95 6.38 6.82 0.87 0.442011 6.65 7.12 7.58 0.93 0.462013 6.50 6.99 7.39 0.89 0.40
9th grade
2007 6.19 6.43 6.69 0.50 0.262009 6.70 6.95 7.17 0.47 0.222011 7.15 7.45 7.70 0.55 0.252013 7.06 7.27 7.48 0.42 0.21
Source: Prepared with Prova Brasil data from 2007 to 2013.
D.4.4 Maintenance of school building
The “maintenance of school building” factor
includes items related to the maintenance
conditions of walls, roofs, classrooms, bathrooms,
lighting, along with the existence of depredations
and other aspects.
The patterns observed in the information in
tables 60 and 61 are higher averages of the
“maintenance of school building” factor at the
adequate/advanced learning level, regardless
of the grade and the Prova Brasil edition.
The distances of the averages of the factor
between the adequate/advanced and below
basic (AD – BB) levels increase throughout the
Prova Brasil editions up to 2011. In 2013, the
differences decreased slightly, except in the
5th grade.
61
SÉRI
E D
ebat
es E
D

Table 60 – Average for the “maintenance of school building” factor by learning levels for Reading according to grade and Prova Brasil edition
Grade Edition
Learning levels in Reading Differences among levels
Below basic (BB)
Basic (B)Adequate/
advanced (AD)Difference
AD – BBDifference
AD – B
5th grade
2007 7.41 7.55 7.77 0.36 0.222009 7.24 7.43 7.69 0.45 0.262011 7.34 7.54 7.82 0.48 0.282013 7.13 7.36 7.64 0.51 0.28
9th grade
2007 7.21 7.31 7.46 0.25 0.152009 7.18 7.28 7.45 0.27 0.172011 7.33 7.47 7.66 0.33 0.192013 7.34 7.43 7.59 0.25 0.16
Source: Prepared with Prova Brasil data from 2007 to 2013.
Table 61 – Average for the “maintenance of school building” factor by learning levels for Mathematics according to school and Prova Brasil edition
Grade Edition
Learning levels in Mathematics Differences among levels
Below basic (BB)
Basic (B)Adequate/
advanced (AD)Difference
AD – BBDifference
AD – B
5th grade
2007 7.42 7.58 7.80 0.38 0.222009 7.23 7.45 7.72 0.49 0.272011 7.32 7.57 7.87 0.55 0.302013 7.14 7.40 7.67 0.53 0.27
9th grade
2007 7.21 7.33 7.53 0.32 0.202009 7.19 7.33 7.51 0.32 0.182011 7.35 7.52 7.70 0.35 0.182013 7.34 7.48 7.64 0.30 0.16
Source: Prepared with Prova Brasil data from 2007 to 2013.
62
SÉRI
E D
ebat
es E
D

V. School effects and associated factors
In this section, the results of two sets of
adjusted hierarchical multinomial regression
models will be presented: basic and extended
models. The basic models were designed
to calculate the schools effects in Reading
and Mathematics and thereby to describe
such effects in terms of school factors. The
extended model, aside from the variables of
the basic model, include the school grade and
the Prova Brasil edition as control variables
and, thereby, allow for a better interpretation
of the coefficients of the student variables.
Explanations of these models are presented in
the next section; the description of the school
effects, resulting from the adjustment to the
basic models, will be analyzed in sections A to
H, and the results of the extended models will
be discussed in section I.
A. Methodology
Four hierarchical multinomial regression
models were adjusted: a basic model and
an extended model for Reading as well as
Mathematics. The models were estimated via
HLM 7.01 (RAUDENBUSH et al., 2011, p. 325).
The variable responses of both models are the
learning levels in Reading and Mathematics,
categorized into three levels: (1) below basic,
(2) basic and (3) adequate. The last level is the
result of the sum of adequate and advanced
levels and will only be referred to as an
adequate level.
The combination of adequate and advanced
levels is justified because the percentage of
students at the advanced level is quite low.
As a result, it is assumed that there is no
conceptual difference in performances that
are at an adequate and advanced level, even
if the differences might have an impact in
selection situations, for example.
Equations of the models can be found
in Appendix B. The purpose of the basic
models lies in the estimation of the school
effects, while the extended models are used
to interpret the coefficients of the factors
associated with students.
As students are naturally grouped into schools,
the hierarchical or multilevel models emerge
as a natural analytical option (RAUDENBUSH;
BRYK, 2002; GOLDSTEIN, 2003). In this study,
the analysis units for level 1, indexed by (i), are
the students and the units of level 2, indexed by
(j), are the schools.
The linear regression models, most commonly
applied to educational data, produce a sole
school effect in relation to the average of
observed proficiencies. One issue repeatedly 63
SÉRI
E D
ebat
es E
D

17. Item Response Theory.
raised in relation to this approach is that the
school effect can be high; but the distribution
of proficiencies observed may be in a range of
very low values. This means that, although a
certain school might have positive effects, their
results may not make a difference for ensuring
an education that enables their students to
successfully continue with their studies.
The originality of this approach lies in
analyzing the proficiencies situated on a scale
that has a normative interpretation. In this
case, the effect of a certain school is restricted
to a range of predefined proficiency. Thus,
it is possible to separate the school effects
depending on the distribution of student
results in relation to the values considered to
be desirable or not.
In the empirical implementation of
multinomial models, a residual term is
calculated for each regression equation,
according to the k-1 classes of the response
variable. In our case, the outcome variable
has three classes: below basic, basic and
adequate. Taking the basic level as a reference
category, two equations were estimated. The
first equation calculates the chances of a
student being at a below basic level (being
in an condition of exclusion) compared to the
chances of being at a basic level; the second
calculates chances of a student to be at an
adequate level compared to the chances of
being at a basic level. In each of these, there is
a residual term. In Appendix B, the u0j(1) and
u0j(2) residual terms in the level 2 equations
can be observed.
The residual terms are considered to be
the school effects in exclusionary situations
or of an adequacy of learning. The school
effects are understood to be the parcel of
the students’ academic performance that
can be attributed to the school practices,
excluding the students’ personal and family
characteristics, as well as the characteristics
of the school environment that are outside of
the school’s control.
Therefore, for estimating these effects,
the basic models control the student
performance by gender, color, educational
lag, socioeconomic status, reading habits
and parent involvement – variables that are
beyond the school’s immediate control. It
also includes, as a selectivity bias control, an
indicator variable for those students who did
not declare their gender.
The student’s SES (socioeconomic status)
included in the models was centered on the
great average, given that it is the student’s
level in a socioeconomic hierarchy that counts
toward explaining their performance and not
their relative position in the school in which
they study.
Educational lag measures the difference
between the student’s age and the expected age
for the grade he was in when taking the test.
The “reading habits” and “parental
involvement” factors were already estimated
using the IRT17 with items from the survey
answered by the student. The conceptualization
of these factors is detailed in section A, Chapter
IV. Both factors were included in the centralized
models by the great average.
In addition to these variables, the models
included only the school’s SES as a control variable
at level 2, the value obtained by averaging the
SES of students by school.
The models were used to estimate the effect
of each school in each of the four Prova Brasil
editions (2007, 2009, 2011 and 2013). This
objective required the creation of a school
identifier to distinguish the four editions
of the test. This new code is the product of
combining the school’s original code on the
64
SÉRI
E D
ebat
es E
D

INEP18 (8 digit code) and the Prova Brasil
edition (which corresponds to the year the
test was applied, with 4 digits). As a result
of this procedure 218,252 new school codes
were obtained (pseudo-schools), among which
16,271,405 students were distributed. We call
the unit a psuedo-school when it has a role in
the statistical model used.
Since the school effects in different editions
were jointly estimated, the values obtained
are comparable, so it is possible to verify the
trajectory of these effects throughout the four
Prova Brasil editions.
The results of adjusting these models allowed for
the identification of schools that, throughout the
four Prova Brasil editions, have had practices that
improve student learning, regardless of the social
and demographic characteristics of their students.
These results correspond to the school effects.
The class of the estimated basic models –
hierarchical multinomial – calculates two effects
for each school: the u0j(1) and u0j(2) residuals for
the school. The negative residuals of the term
u0j(1) corresponds to effect 1, which translates
to the ability of a certain school to diminish
the chances of their students being at a below
basic level. In other words, this effect expresses
the ability of a certain school to decrease the
likelihood of their students remaining in an
exclusionary learning situation.
In turn, we called the positive residual of the
term u0j(2) effect 2, which estimates the chances
of a student being at the appropriate level in
relation to being at a basic level. This effect
should be interpreted as the school’s ability
to ensure that their students are prepared to
continue their studies, have a regular school life
that guarantees them a productive adulthood
and exercise of citizenship. That is, this effect
indicates the school’s ability to guarantee a
basic right to education.
In operational terms, the estimate of the
model in the HLM7 software offers the possibility
to save the residual terms, u0j(1) and u0j(2), for
each school. Originally, the residuals for the
first equation of the models (which estimates
the chances of a student being at a below basic
level) indicate that positive values correspond
to schools that increase the likelihood of the
exclusion of their students and negative values
are associated with schools that diminish these
chances. The residuals of the second equation
(which estimates the chances of a student being
at an adequate level, compared to being at a
basic level) indicate, in turn, that the positive
values correspond to schools that increase the
chances of adequacy of its students, while
negative values decrease those chances.
As the most favorable situations measured by
effects 1 and 2 have opposite signs, in order to
make the most intuitive interpretation, we put
both effects in the same direction. In this way,
the school effects of type 1 were multiplied
by -1, so that in this way, the positive values
always indicate more desirable situations.
In what follows, the schools with negative or
equal to zero effects indicate that the internal
practices, prevalent in a set of such schools, do
not contribute to their students’ learning, while
those that have positive effects are schools that
take their students beyond what it is expected
by their socio-cultural characteristics.
As mentioned before, the estimated basic
models include characteristics of students and
the average SES of schools, since these variables
are beyond the schools’ immediate control.
The average of effects 1 and 2 resulting from
these models were correlated to the school
factors and then immediately distributed by
the quartiles of the school factors.
It was assumed that the most appropriate
approach for interpreting the results would be
18. In the selection made for the statistical analyzes, there are 68,183 school identification codes. Many schools are present in more than one edition of Prova Brasil. 65
SÉRI
E D
ebat
es E
D

this one and not the inclusion of school factors
as independent variables in the regression
models for two reasons. Firstly, because many
factors have a high correlation with each
other, which is why the adjustment of the
equation would not be correct. Secondly, if all
school factors were inserted into the equation
at the same time, the coefficients would be
very close to 1 (see SOARES et al., 2012),
which would provide poor information about
the contribution of each of them, aside from
making the equations a bit sparse.
With the analysis procedure adopted, it was
possible to see which factors are most associated
with the ability of schools to diminish the
chances of exclusion and increase the chances
of adequacy of learning for their students.
Aside from the basic models, which sought
to estimate the school effects in Reading
and Mathematics, the extended models
were adjusted in order to achieve the most
appropriate interpretation of the coefficients
for the student variables. For this purpose,
the same variables of the basic model as well
as the grade and Prova Brasil edition were
included as control variables.
Chart 2 shows the variables included in
both types of models.
Chart 2 – Explanatory variables included in the hierarchical multinomial regression models
Level Variable Type Description Centralization (*)
Level 1
Gender Binary 1 = female and 0 = male Natural metric
Gender missing Binary 1 = no response and 0 = response Natural metric
Mixed race Binary 1 = mixed and 0 = white Natural metric
Black Binary 1 = Black and 0 = white Natural metric
Other race Binary 1 = other race and 0 = white Natural metric
Educational lag Binary 1 = gap of 1 or more years and 0 = no gap Natural metric
Student’s socioeconomic status
Continuous Range of -3.05 to +2.83 standard deviationsCentralized in the great average
Parental involvement Continuous Range of -0.15 to +0.15 standard deviationsCentralized in the great average
Reading habits Continuous Range of -1.25 to +1.25 standard deviationsCentralized in the great average
2009 (**) Binary 1 = 2009 and 0 = 2007 Natural metric
2011 (**) Binary 1 = 2011 and 0 = 2007 Natural metric
2013 (**) Binary 1 = 2013 and 0 = 2007 Natural metric
Grade (**) Binary 1 = 5th grade and 0 = 9th grade Natural metric
Level 2Socioeconomic level of the school
ContinuousAverage socioeconomic level of the student by the school. Range of -2.82 to +2.27 standard deviations
Centralized in the great average
Notes: *See Raudenbush and Bryk (2002) on the centralization at both levels.**Variables not included in the estimation of school effects (basic model), are only set as a control in the extended models.
66
SÉRI
E D
ebat
es E
D

-1.5
-1-0
.50
0.5
1
2007 2009 2011 2013
Effect 1 Effect 2
In the statistical models presented below,
16,271,405 students remained who had
information for all the analyzed variables.
B. School effects by Prova Brasil edition
The estimated multinomial hierarchical
regression models (basic models), as mentioned
in the data and procedures section, allowed
for a calculation of two types of school effects:
effect 1, which expresses the school’s ability
to decrease the chances of their students
being in a position of educational exclusion
(at the below basic level); and effect 2, which
is school’s ability to increase the chances of
their students being in a position of having an
adequacy of learning (at the adequate level).
Since the school effects were estimated based
on the four Prova Brasil editions, their values can
be compared. This occurs because the average
of the residuals will always be an empirical
average, in other words, it varies according to
the set of analyzed data.
Graphics 1 and 2 demonstrate the evolution of
these effects throughout the testing editions for
Reading and Mathematics, respectively. The table
that led to the graphics with the averages and
standard deviations for each effect by Reading
and Mathematics competence according to the
edition of the test edition is found in Appendix C.
Graphic 1 – Descriptive measures of effects 1 and 2 in Reading according to the Prova Brasil edition
Source: Prepared with Prova Brasil data from 2007 to 2013.
67
SÉRI
E D
ebat
es E
D

Graphic 2 – Descriptive measures of effects 1 and 2 in Mathematics according to the Prova Brasil edition
Source: Prepared with Prova Brasil data from 2007 to 2013.
The trend of the effects 1 and 2, both in Reading
as well as Mathematics, is dropping as of 2011.
From 2007 to 2009, the two effects increased;
decreased in 2011; and in 2013, decreased even
further. This means that, when the control is done
for the socioeconomic and demographic differences
of students, then the schools, over time, reduced
their ability to remove students from exclusion and
to keep students at the adequate level.
The proportion of students with a proficiency
considered to be adequate increased over the
years surveyed for the 5th grade of elementary
school and stagnated as of 2009 for the 9th grade
(TODOS PELA EDUCAÇÃO, 2015). What these
results show is that, despite the weak evolution
of the proficiencies, the school effects have been
decreasing, indicating that this change may
have occurred due to the improvement of living
conditions and household income.
C. Trajectories of the school effects: 2007 to 2013
A complementary way of analyzing the
evolution of the school effects – resulting from
the basic model – is by observing the trajectories
of these effects. In the four editions of Prova
Brasil, a sum total of 68,161 schools were
analyzed. The indications of the effects for each
school, in each edition of the test, was counted
and the trajectories of these signals were
classified into eight types, as shown in Table 62.
Table 62 – Distribution of schools by type of trajectory according to effects 1 and 2 in Reading and Mathematics
TrajectoryReading Mathematics
Effect 1 Effect 2 Effect 1 Effect 2
Consistently positive 15.5 17.0 15.6 16.4
Positive in the last three editions 6.0 5.6 6.2 5.7
Positive in the last two editions 6.7 6.0 6.6 5.9
Negative in the last two editions 7.4 7.0 7.0 6.7
Negative in the last three editions 6.6 7.3 6.8 7.6
Consistently negative 10.7 12.5 12.6 14.0
No pattern 29.1 26.6 27.3 25.7
No observation in 2013 18.0 18.0 18.0 18.0
Total 100.0 100.0 100.0 100.0
Source: Prepared with Prova Brasil data from 2007 to 2013.
-2-1
01
22007 2009 2011 2013
Effect 1 Effect 2
68
SÉRI
E D
ebat
es E
D

Schools that have a “consistently positive”
trajectory are those whose effects are positive
throughout the four Prova Brasil editions. At
the other extreme, there are schools whose
effects were negative throughout the four
editions. The trajectory of these schools was
called “consistently negative”.
Schools that had negative effects in 2007 or
did not participate in the test that year, but did
have positive effects in 2009, 2011 and 2013,
were classified as a “positive in the last three
editions” trajectory. Schools that had positive
effects in 2007 or did not participate in the test
that year, but had negative effects in the last
three editions of the race were classified as a
“negative in the last three editions” trajectory.
Schools that had negative effects or
did not participate in the test in 2007 and
2009, but posted positive effects in 2011
and 2013 were classified as a “positive in
the last two editions” trajectory. While the
schools that had positive effects or did not
participate in the test in 2007 and 2009, but
produced negative effects in 2011 and 2013,
were classified as a “negative in the last two
editions” trajectory.
In the “no pattern” category are schools
for which the indications of the effects do
not possess any uniformity - for example, it is
negative in 2007, positive in 2009, negative in
2011 and positive in 2013.
Finally, schools that did not participate in
the last edition of the test were classified as
“no observation in 2013”. Since the interest
was on the trajectory over the period, it would
not make sense to create a special trajectory to
address these cases.
According to the information from Table
62, in Reading, 15.5% of the schools’ totals
presented consistently positive effects of type 1
and 17% presented consistently positive effects
of type 2. In Mathematics, 15.6% and 16.4%
of schools posted, respectively, consistently
positive effects of type 1 and type 2.
Schools with positive trajectories are
of special interest because they show the
progressive ability of taking their students out
of exclusion and keeping them in an adequacy
of learning situation. Based on this information,
it is possible to choose schools within the same
municipality, from the same school system,
whose qualitative comparison would produce
explanations for the different trajectories. This
will be the goal of other studies.
D. School effects per Brazilian state and Prova Brasil edition
Tables 63 and 64 provide information about
the distribution of the average for effects
1 and 2 (estimated by the basic models) in
Reading according to Brazilian federative units
by the Prova Brasil editions and the type of
educational offerings. The positive effects are
highlighted in the tables.
According to Table 63, four states have
positive effects of type 1 in Reading throughout
the Prova Brasil editions, regardless of the
type of educational offerings. They are: Minas
Gerais, Espírito Santo, Mato Grosso do Sul and
Rio Grande do Sul. However, there is a declining
trend seen for these effects throughout the
editions of the test, with the exception of schools
that only offer the initial years of elementary
school in Espírito Santo.
As can be seen in Table 64, Minas Gerais,
Espírito Santo and São Paulo have positive
effects of type 2 in Reading for every edition of
the test for all types of educational offerings.
However, the effects of schools from these
states do not maintain growth throughout the
analyzed period, except for schools that offer
only the initial years of elementary school in
Espírito Santo.
It should be noted that the schools that
offer initial years or both phases of elementary 69
SÉRI
E D
ebat
es E
D

school in Rondônia, Acre, Amazonas and Ceará
improved throughout the editions of the test,
with effects 1 and 2 showing positive averages
in 2013. Schools that only offer later years of
elementary school from Ceará also produced
a regular improvement of the effects over the
period that was analyzed.
The educational results from the state of
Ceará have been the focus of some studies
(PADILHA et al. 2012;. PADILHA et al. 2013).
Padilha and others (2013) analyzed the
evolution of the Ideb among municipalities
and state regions and concluded that,
between 2007 and 2011, the Ideb increased
in all municipalities with a gain of equity for
the 5th grade of elementary school. Improved
equity for 9th grade already took place in the
municipalities classified as regional or central-
regional capitals.
Table 63 – Averages for effects 1 in Reading by Prova Brasil edition according to federative unit by type of educational offering
FU
Schools that only offer initial years of ES
Schools that only offer later years of ES
Schools that offer initial and later years of ES
2007 2009 2011 2013 2007 2009 2011 2013 2007 2009 2011 2013
Rondônia -0.08 -0.07 0.00 0.16 -0.03 0.07 0.04 -0.04 -0.08 0.02 0.07 0.14
Acre 0.04 0.07 0.07 0.27 -0.12 0.03 -0.08 0.08 -0.21 0.01 0.05 0.18
Amazonas -0.12 -0.11 -0.10 0.09 0.07 0.09 -0.13 -0.05 -0.15 -0.09 -0.16 0.01
Roraima -0.04 -0.21 -0.18 -0.09 -0.17 -0.19 -0.37 -0.42 -0.10 -0.28 -0.32 -0.33
Pará -0.15 -0.19 -0.16 -0.25 -0.09 -0.08 -0.14 -0.14 -0.14 -0.18 -0.16 -0.22
Amapá -0.32 -0.33 -0.34 -0.42 -0.35 -0.25 -0.38 -0.45 -0.31 -0.33 -0.32 -0.47
Tocantins -0.12 -0.05 0.07 0.07 -0.14 0.04 -0.05 -0.16 -0.12 0.00 0.03 -0.02
Maranhão -0.26 -0.44 -0.37 -0.45 -0.18 -0.21 -0.30 -0.34 -0.25 -0.39 -0.36 -0.41
Piauí -0.06 -0.10 -0.07 -0.17 -0.09 -0.05 -0.06 -0.09 -0.15 -0.13 -0.06 -0.16
Ceará -0.19 -0.10 0.16 0.29 -0.14 -0.01 -0.02 0.14 -0.23 -0.10 0.09 0.27
Rio Grande do Norte -0.44 -0.47 -0.31 -0.29 -0.16 -0.12 -0.17 -0.12 -0.41 -0.35 -0.31 -0.28
Paraíba -0.17 -0.19 -0.15 -0.11 -0.20 -0.16 -0.26 -0.24 -0.17 -0.16 -0.16 -0.11
Pernambuco -0.26 -0.34 -0.29 -0.19 -0.33 -0.21 -0.25 -0.17 -0.34 -0.33 -0.32 -0.23
Alagoas -0.32 -0.57 -0.51 -0.36 -0.31 -0.24 -0.39 -0.32 -0.35 -0.49 -0.55 -0.42
Sergipe -0.16 -0.26 -0.25 -0.28 -0.09 -0.11 -0.07 -0.16 -0.22 -0.24 -0.22 -0.27
Bahia -0.11 -0.24 -0.17 -0.25 -0.18 -0.20 -0.23 -0.27 -0.20 -0.29 -0.26 -0.26
Minas Gerais 0.47 0.36 0.39 0.32 0.25 0.32 0.36 0.26 0.27 0.28 0.35 0.24
Espírito Santo 0.15 0.16 0.14 0.20 0.04 0.31 0.02 0.03 0.11 0.23 0.14 0.09
Rio de Janeiro 0.12 0.15 0.20 0.19 -0.13 0.04 -0.14 -0.19 0.01 0.06 0.06 0.01
São Paulo 0.13 0.11 0.10 0.19 -0.07 0.32 -0.04 -0.12 -0.11 0.02 -0.07 0.01
Paraná 0.28 0.23 0.20 0.36 0.08 0.18 0.06 -0.02 0.21 0.25 0.17 0.17
Santa Catarina 0.03 -0.02 0.22 0.29 0.00 0.11 0.04 -0.09 0.03 0.06 0.20 0.11
Rio Grande do Sul 0.04 0.00 0.12 0.14 0.13 0.17 0.07 0.04 0.13 0.16 0.18 0.19
Mato Grosso do Sul 0.09 0.08 0.16 0.16 0.10 0.23 0.18 0.18 0.20 0.25 0.27 0.26
Mato Grosso 0.08 -0.04 -0.07 -0.03 -0.15 0.02 -0.13 -0.27 0.02 0.02 -0.07 -0.15
Goiás 0.05 0.13 0.26 0.32 -0.04 0.00 0.06 0.21 -0.02 0.11 0.12 0.23
Federal District 0.55 0.47 0.45 0.44 0.11 -0.02 -0.03 -0.16 0.31 0.13 0.20 0.18
Note: FU = federative unit ES = elementary schoolSource: Prepared with Prova Brasil data from 2007 to 2013.
70
SÉRI
E D
ebat
es E
D

Table 64 – Average for effects 2 in Reading by Prova Brasil edition according to federative unit by type of educational offering
FUSchools that only offer
initial years of ESSchools that only offer later
years of ESSchools that offer initial
and later years of ES
2007 2009 2011 2013 2007 2009 2011 2013 2007 2009 2011 2013
Rondônia -0.16 -0.18 -0.06 0.10 -0.11 0.02 -0.05 -0.14 -0.19 -0.13 -0.05 0.03
Acre -0.05 0.02 0.02 0.26 -0.24 -0.04 -0.18 -0.05 -0.31 -0.11 -0.10 0.07
Amazonas -0.28 -0.19 -0.17 0.03 -0.05 0.06 -0.26 -0.19 -0.29 -0.18 -0.29 -0.14
Roraima -0.14 -0.33 -0.24 -0.16 -0.32 -0.29 -0.44 -0.52 -0.24 -0.42 -0.39 -0.36
Pará -0.31 -0.36 -0.31 -0.41 -0.23 -0.20 -0.25 -0.31 -0.35 -0.39 -0.41 -0.46
Amapá -0.43 -0.50 -0.52 -0.60 -0.42 -0.37 -0.50 -0.58 -0.46 -0.52 -0.55 -0.66
Tocantins -0.21 -0.14 0.00 0.02 -0.16 0.02 -0.13 -0.20 -0.18 -0.06 -0.02 -0.07
Maranhão -0.33 -0.51 -0.47 -0.55 -0.24 -0.27 -0.39 -0.47 -0.33 -0.48 -0.49 -0.57
Piauí -0.15 -0.18 -0.16 -0.28 -0.13 -0.09 -0.17 -0.21 -0.25 -0.27 -0.21 -0.31
Ceará -0.23 -0.12 0.18 0.36 -0.16 -0.03 -0.07 0.09 -0.29 -0.15 0.07 0.27
Rio Grande do Norte -0.48 -0.50 -0.36 -0.36 -0.19 -0.16 -0.26 -0.21 -0.47 -0.42 -0.40 -0.39
Paraíba -0.24 -0.30 -0.25 -0.20 -0.25 -0.22 -0.33 -0.33 -0.27 -0.27 -0.27 -0.25
Pernambuco -0.33 -0.42 -0.37 -0.25 -0.35 -0.21 -0.33 -0.26 -0.40 -0.42 -0.41 -0.32
Alagoas -0.42 -0.65 -0.57 -0.43 -0.38 -0.34 -0.50 -0.46 -0.51 -0.60 -0.65 -0.56
Sergipe -0.26 -0.41 -0.40 -0.41 -0.12 -0.16 -0.18 -0.28 -0.36 -0.42 -0.44 -0.50
Bahia -0.20 -0.36 -0.28 -0.36 -0.19 -0.24 -0.31 -0.37 -0.29 -0.43 -0.41 -0.42
Minas Gerais 0.57 0.50 0.55 0.49 0.31 0.43 0.41 0.34 0.35 0.44 0.45 0.39
Espírito Santo 0.14 0.15 0.18 0.26 0.03 0.36 0.07 0.07 0.10 0.23 0.17 0.16
Rio de Janeiro 0.12 0.16 0.24 0.20 -0.06 0.12 -0.03 -0.06 0.03 0.09 0.11 0.06
São Paulo 0.29 0.26 0.25 0.33 0.09 0.56 0.10 0.01 0.10 0.23 0.12 0.17
Paraná 0.26 0.20 0.22 0.42 0.02 0.16 0.04 -0.04 0.27 0.32 0.23 0.15
Santa Catarina 0.00 -0.05 0.27 0.36 -0.06 0.08 -0.01 -0.13 0.01 0.01 0.23 0.15
Rio Grande do Sul 0.02 -0.04 0.11 0.14 0.08 0.15 0.06 -0.02 0.10 0.12 0.17 0.18
Mato Grosso do Sul -0.04 -0.04 0.14 0.11 0.07 0.17 0.14 0.12 0.06 0.12 0.21 0.13
Mato Grosso 0.02 -0.08 -0.10 -0.04 -0.18 -0.01 -0.18 -0.30 -0.03 -0.02 -0.08 -0.14
Goiás 0.01 0.10 0.27 0.34 -0.07 -0.02 0.04 0.20 -0.04 0.10 0.15 0.23
Federal District 0.63 0.54 0.52 0.47 0.27 0.21 0.09 -0.02 0.30 0.17 0.30 0.13
Note: FU = federative unit ES = elementary schoolSource: Prepared with Prova Brasil data from 2007 to 2013.
According to the information in Table 65, it
can be seen that Minas Gerais, Espírito Santo,
Paraná and Mato Grosso do Sul have positive
effects of type 1 in Mathematics in every
edition of the test for all types of educational
offerings. In the same manner observed for the
effects in Reading, the effects of the schools
from these federative units do not maintain a
regular increase over the analyzed period.
For the effects of type 2 in Mathematics
(Table 66), Minas Gerais and Espírito Santo
presented positive averages in the four editions
of Prova Brasil, however, none of these states
maintained an upward trend.
Notably, schools that only offer the initial
years or both phases of elementary school in
Rondônia, Acre and Ceará, even though they
have had negative effects of type 1 and type 2
71
SÉRI
E D
ebat
es E
D

in Mathematics at the beginning of the analyzed
period, improved throughout the editions of
the test, posting positive average effects in
2013. Schools that only offer the later years
of elementary school in Ceará also produced a
regular improvement of the effects over time,
a pattern already highlighted in relation to
Reading at the same education level.
Table 65 – Average for effects 1 in Mathematics by Prova Brasil edition according to federative unit by type of educational offering
FUSchools that only offer
initial years of ESSchools that only offer later
years of ESSchools that offer initial
and later years of ES
2007 2009 2011 2013 2007 2009 2011 2013 2007 2009 2011 2013
Rondônia -0.17 -0.01 -0.02 0.21 0.06 -0.03 0.11 -0.03 -0.07 0.03 0.12 0.24
Acre -0.19 0.00 -0.02 0.17 -0.08 -0.19 -0.17 -0.11 -0.25 -0.15 -0.02 0.05
Amazonas -0.26 -0.09 -0.14 0.02 -0.04 -0.23 -0.30 -0.29 -0.31 -0.26 -0.32 -0.19
Roraima -0.20 -0.25 -0.30 -0.05 -0.14 -0.38 -0.43 -0.42 -0.17 -0.41 -0.45 -0.38
Pará -0.29 -0.18 -0.25 -0.35 -0.11 -0.33 -0.23 -0.29 -0.21 -0.27 -0.27 -0.33
Amapá -0.50 -0.37 -0.52 -0.58 -0.50 -0.59 -0.65 -0.66 -0.46 -0.52 -0.60 -0.68
Tocantins -0.21 -0.04 0.02 0.07 -0.12 -0.14 -0.04 -0.12 -0.17 -0.09 -0.01 -0.01
Maranhão -0.25 -0.40 -0.46 -0.53 -0.21 -0.39 -0.41 -0.45 -0.26 -0.46 -0.47 -0.54
Piauí -0.13 -0.07 -0.09 -0.18 0.11 -0.08 0.03 -0.08 -0.09 -0.11 -0.04 -0.14
Ceará -0.25 -0.10 0.15 0.26 -0.07 -0.18 -0.03 0.11 -0.21 -0.17 0.08 0.23
Rio Grande do Norte -0.43 -0.40 -0.35 -0.30 -0.04 -0.22 -0.16 -0.15 -0.34 -0.37 -0.33 -0.28
Paraíba -0.16 -0.12 -0.18 -0.12 -0.09 -0.21 -0.24 -0.23 -0.12 -0.17 -0.16 -0.10
Pernambuco -0.29 -0.27 -0.30 -0.19 -0.23 -0.31 -0.24 -0.14 -0.30 -0.31 -0.26 -0.19
Alagoas -0.33 -0.49 -0.51 -0.37 -0.18 -0.35 -0.38 -0.31 -0.30 -0.48 -0.54 -0.39
Sergipe -0.18 -0.18 -0.26 -0.21 0.07 -0.13 -0.01 -0.11 -0.15 -0.21 -0.20 -0.19
Bahia -0.18 -0.19 -0.18 -0.24 -0.08 -0.27 -0.21 -0.25 -0.18 -0.28 -0.23 -0.24
Minas Gerais 0.49 0.50 0.47 0.36 0.48 0.36 0.48 0.40 0.38 0.35 0.41 0.32
Espírito Santo 0.08 0.20 0.18 0.20 0.21 0.29 0.16 0.17 0.14 0.24 0.22 0.18
Rio de Janeiro 0.00 0.16 0.26 0.21 -0.17 -0.12 -0.10 -0.13 -0.07 -0.01 0.11 0.04
São Paulo 0.04 0.20 0.14 0.19 0.01 0.27 -0.12 -0.11 -0.10 0.04 -0.11 0.02
Paraná 0.23 0.35 0.26 0.39 0.30 0.07 0.09 0.01 0.27 0.18 0.18 0.14
Santa Catarina -0.04 0.03 0.24 0.27 0.23 0.13 0.15 -0.07 0.04 0.03 0.21 0.08
Rio Grande do Sul -0.02 0.04 0.10 0.16 0.28 0.25 0.22 0.10 0.10 0.16 0.20 0.20
Mato Grosso do Sul 0.00 0.08 0.16 0.16 0.28 0.07 0.21 0.12 0.19 0.17 0.25 0.20
Mato Grosso -0.05 -0.04 -0.14 -0.05 -0.04 -0.14 -0.16 -0.33 0.02 -0.06 -0.15 -0.19
Goiás -0.05 0.12 0.21 0.31 0.08 -0.18 0.01 0.17 0.00 0.00 0.07 0.20
Federal District 0.41 0.55 0.42 0.45 0.32 0.01 0.02 -0.12 0.29 0.16 0.27 0.13
Source: Prepared with Prova Brasil data from 2007 to 2013.
72
SÉRI
E D
ebat
es E
D

19. The 5th grade schools of São Paulo city, which could not be identified, were not included in this analysis, as requested by the São Paulo Municipal Education Department and approved under the terms of INEP’s regulation 414, of July 29, 2013.
Table 66 – Average for effects 2 in Mathematics by Prova Brasil edition according to federative unit by type of educational offering
FUSchools that only offer
initial years of ESSchools that only offer later
years of ESSchools that offer initial
and later years of ES
2007 2009 2011 2013 2007 2009 2011 2013 2007 2009 2011 2013
Rondônia -0.27 -0.19 -0.13 0.16 0.04 -0.08 0.07 -0.14 -0.21 -0.11 0.00 0.14
Acre -0.32 -0.14 -0.11 0.16 -0.21 -0.27 -0.22 -0.25 -0.44 -0.29 -0.16 -0.05
Amazonas -0.40 -0.21 -0.24 -0.05 -0.05 -0.20 -0.29 -0.32 -0.42 -0.32 -0.39 -0.29
Roraima -0.35 -0.42 -0.42 -0.08 -0.24 -0.47 -0.50 -0.57 -0.32 -0.56 -0.57 -0.42
Pará -0.46 -0.41 -0.47 -0.52 -0.27 -0.43 -0.34 -0.47 -0.42 -0.52 -0.54 -0.55
Amapá -0.65 -0.60 -0.78 -0.78 -0.61 -0.69 -0.77 -0.85 -0.68 -0.73 -0.86 -0.92
Tocantins -0.32 -0.15 -0.03 0.01 -0.16 -0.18 -0.05 -0.19 -0.28 -0.19 -0.06 -0.04
Maranhão -0.33 -0.54 -0.62 -0.67 -0.27 -0.44 -0.47 -0.55 -0.38 -0.57 -0.61 -0.70
Piauí -0.24 -0.21 -0.26 -0.32 0.10 -0.11 0.01 -0.18 -0.22 -0.26 -0.23 -0.34
Ceará -0.34 -0.18 0.12 0.29 -0.13 -0.19 -0.02 0.09 -0.34 -0.27 0.07 0.25
Rio Grande do Norte -0.52 -0.52 -0.49 -0.42 -0.05 -0.27 -0.21 -0.25 -0.47 -0.50 -0.48 -0.42
Paraíba -0.24 -0.27 -0.31 -0.22 -0.16 -0.29 -0.32 -0.36 -0.26 -0.31 -0.32 -0.26
Pernambuco -0.40 -0.39 -0.43 -0.26 -0.28 -0.35 -0.29 -0.25 -0.42 -0.42 -0.40 -0.25
Alagoas -0.47 -0.64 -0.64 -0.43 -0.29 -0.43 -0.46 -0.46 -0.50 -0.66 -0.67 -0.53
Sergipe -0.31 -0.36 -0.44 -0.37 0.01 -0.18 -0.05 -0.23 -0.35 -0.43 -0.44 -0.42
Bahia -0.30 -0.37 -0.35 -0.38 -0.14 -0.34 -0.29 -0.40 -0.33 -0.45 -0.41 -0.42
Minas Gerais 0.63 0.74 0.70 0.59 0.63 0.50 0.61 0.49 0.48 0.56 0.56 0.49
Espírito Santo 0.08 0.20 0.19 0.26 0.24 0.37 0.20 0.19 0.12 0.24 0.26 0.22
Rio de Janeiro 0.01 0.16 0.30 0.20 -0.15 -0.10 -0.04 -0.12 -0.06 -0.03 0.12 0.02
São Paulo 0.24 0.45 0.35 0.42 0.12 0.50 -0.05 -0.06 0.07 0.27 0.09 0.23
Paraná 0.29 0.41 0.37 0.53 0.30 0.06 0.06 -0.03 0.39 0.31 0.25 0.16
Santa Catarina -0.06 0.03 0.35 0.40 0.23 0.12 0.16 -0.12 0.05 0.03 0.28 0.19
Rio Grande do Sul -0.06 -0.01 0.10 0.19 0.32 0.27 0.25 0.05 0.08 0.12 0.18 0.21
Mato Grosso do Sul -0.11 -0.08 0.13 0.09 0.28 0.06 0.23 0.03 0.05 0.01 0.21 0.09
Mato Grosso -0.09 -0.11 -0.19 -0.04 -0.03 -0.15 -0.20 -0.39 -0.04 -0.10 -0.17 -0.16
Goiás -0.11 0.07 0.21 0.33 0.02 -0.21 -0.01 0.19 -0.07 0.00 0.07 0.21
Federal District 0.51 0.64 0.50 0.44 0.45 0.15 0.14 -0.09 0.26 0.25 0.34 0.15
Source: Prepared with Prova Brasil data from 2007 to 2013.
E. School effects per capital city: 2013
For a deeper analysis of the effects according
to the regional differences, we selected state
capitals and only the effects from 2013 in
Reading and Mathematics. The information in
Table 67 shows the distribution of the averages
for effects 1 and 2 (we estimated for the
basic models) in Reading and Mathematics by
capitals.19 The positive averages are highlighted
in the table.
Rio Branco, Palmas, Teresina, Fortaleza and
Rio de Janeiro stand out by having positive effects
1 and 2 in both Reading and in Mathematics.
73
SÉRI
E D
ebat
es E
D

Table 67- Averages for effects 1 and 2 in Reading and Mathematics according to state capitals in the 2013 edition of Prova Brasil
FU CapitalN. of
schoolsReading Mathematics
Effect 1 Effect 2 Effect 1 Effect 2
RO Porto Velho 127 -0.12 -0.21 -0.17 -0.28
AC Rio Branco 111 0.29 0.27 0.12 0.12
AM Manaus 467 0.18 0.10 -0.05 -0.14
RR Boa Vista 85 -0.20 -0.21 -0.21 -0.22
PA Belém 253 -0.16 -0.23 -0.34 -0.49
AP Macapá 128 -0.44 -0.51 -0.62 -0.76
TO Palmas 55 0.23 0.25 0.25 0.33
MA São Luís 176 -0.15 -0.20 -0.38 -0.44
PI Teresina 209 0.23 0.22 0.21 0.21
CE Fortaleza 367 0.31 0.29 0.18 0.11
RN Natal 161 -0.13 -0.13 -0.19 -0.24
PB João Pessoa 160 0.03 -0.04 -0.02 -0.11
PE Recife 326 -0.18 -0.16 -0.20 -0.25
AL Maceió 172 -0.09 -0.12 -0.16 -0.23
SE Aracaju 110 -0.09 -0.14 -0.02 -0.13
BA Salvador 475 -0.15 -0.16 -0.17 -0.27
MG Belo Horizonte 370 -0.03 0.07 0.04 0.13
ES Vitória 57 -0.10 -0.06 -0.07 -0.13
RJ Rio de Janeiro 903 0.12 0.15 0.15 0.15
SP São Paulo (*) 1545 -0.31 -0.22 -0.34 -0.33
PR Curitiba 325 -0.10 -0.14 -0.06 -0.09
SC Florianópolis 59 -0.40 -0.29 -0.39 -0.32
RS Porto Alegre 245 -0.14 -0.21 -0.15 -0.28
MS Campo Grande 154 0.14 0.02 0.08 -0.08
MT Cuiabá 107 -0.31 -0.31 -0.40 -0.41
GO Goiânia 239 0.12 0.14 -0.01 0.02
DF Brasília 455 0.09 0.04 0.11 0.01
Source: Prepared with Prova Brasil data from 2007 to 2013.
Note:(*) Excludes schools from the municipal school system.
F. School effects per municipality: 2013
In Table 68, the averages for effects 1 and 2
are presented - resulting from the basic model –
in Reading and Mathematics for 2013 according
to some municipalities. These were ordered
through the overall average of effects 1 and 2
at the same time. The averages are shown in the
last two columns.
For display on the table, the 25 municipalities
with the highest averages were selected. The goal
is not to make a ranking of the municipalities,
but to understand which characteristics of the
municipalities that have schools with a greater
ability to reduce the chances of students finding
themselves in an exclusionary situation, as well
as to increase their chances of being at an
adequacy of learning level.
The vast majority of municipalities are from
Minas Gerais or Ceará. Additionally, they have
a lower number of schools, a fact that makes
the management less complex. However,
74
SÉRI
E D
ebat
es E
D

20. The complete descriptive statistics (average and standard deviation) may be requested from the authors.
fleeing this pattern is Sobral (CE), with 44
schools and Brejo Santo (CE), with 19 schools.
Sobral has attracted the interest of researchers
because of the positive educational results in a
region that typically has lower social indicators.
For example, Padilha and others (2013) point
out that, from 2007 to 2011, the city was in
the bottom quintile of Ideb distribution for
the 5th grade of the municipalities in the state
of Ceará.
Table 68 – Averages for effects 1 and 2 in Reading and Mathematics according to municipalities in the 2013 edition of Prova Brasil
FU MunicipalityN. of
schoolsEffect 1 (Read.)
Effect 2 (Math.)
Effect 1 (Read.)
Effect 2 (Math.)
Average effects 1
Average effects 2
MG Araponga 2 1.50 1.67 1.61 2.13 1.56 1.90
PI Cocal dos Alves 3 1.31 1.39 1.66 2.08 1.49 1.73
MG Santa Rosa da Serra 1 1.33 1.61 1.60 2.14 1.46 1.87
PE Tupanatinga 7 1.35 1.57 1.53 2.05 1.44 1.81
CE Sobral 44 1.42 1.65 1.42 2.06 1.42 1.86
MG Berilo 4 1.23 1.27 1.57 2.20 1.40 1.74
MG Pedro Teixeira 1 1.16 1.15 1.51 1.97 1.34 1.56
CE Groaíras 4 1.37 1.36 1.24 1.66 1.30 1.51
MG Aricanduva 2 1.24 1.37 1.33 1.65 1.28 1.51
CE Brejo Santo 19 1.15 1.29 1.39 1.94 1.27 1.62
CE Porteiras 8 1.11 1.14 1.31 1.82 1.21 1.48
MG Frei Lagonegro 1 0.97 1.29 1.40 1.39 1.18 1.34
CE Martinópole 6 1.03 1.12 1.29 1.80 1.16 1.46
CE Senador Sá 4 1.10 1.15 1.21 1.63 1.15 1.39
MG São Brás do Suaçuí 1 1.10 1.03 1.20 1.27 1.15 1.15
CE Reriutaba 8 1.13 1.15 1.13 1.68 1.13 1.41
MG Silveirânia 2 1.12 1.24 1.13 1.47 1.12 1.35
CE Cariré 8 1.03 1.25 1.19 1.70 1.11 1.48
CE Carnaubal 9 1.01 1.19 1.20 1.75 1.11 1.47
MG Olímpio Noronha 1 0.95 0.91 1.24 1.23 1.10 1.07
MG Luisburgo 2 0.96 0.98 1.22 1.39 1.09 1.19
PE Jupi 4 1.06 1.15 1.12 1.57 1.09 1.36
CE Pires Ferreira 8 1.05 1.10 1.13 1.54 1.09 1.32
MG Alagoa 1 0.76 0.62 1.41 1.64 1.09 1.13
CE Penaforte 5 0.85 1.02 1.32 1.81 1.08 1.41
Source: Prepared with Prova Brasil data from 2007 to 2013.
G. Description of school effects per school factor
This section will describe the relationship of
the school effects (calculated by the basic models)
with factors associated with students and schools
that were given in the previous stages of this
study. The following strategy was adopted for this
analysis: the scores of each factor, originally in a
continuous scale, were converted into quartiles.
Next, descriptive statistics were produced of effects
1 and 2 according to these quartiles.20 The average
of effects 1 and 2 by quartiles for each of the
factors will be presented using graphics. In order to
simplify such, the factors were grouped according
to themes.
75
SÉRI
E D
ebat
es E
D

0.180
0.120
0.060
0.000
-0.060
-0.180
-0.120
Q1 Q2
Reading Mathematics
Q3 Q4 Q1 Q2 Q3 Q4
Effect 1 Effect 2
0.180
0.120
0.060
0.000
-0.060
-0.180
-0.120
Q1 Q2
Reading Mathematics
Q3 Q4 Q1 Q2 Q3 Q4
Effect 1 Effect 2
G.1 School effects according to school leadership factors
Graphics 3 to 10 show the relationship between
effects 1 and 2 and the factors and variables that
relate to the size of school leadership. Generally
speaking, the results corroborate published findings
but exhibit some exceptions.
The school effects relationship with the
“administrative leadership” (Graphic 3), “ped-
agogical leadership” (Graphic 4), “participatory
management” (Graphic 5) and “human
resources” (Graphic 6) factors is clearly positive,
with a growth trend for the averages of the effects
1 and 2, both in Reading and Mathematics, as
the scores of the factors improve.
Graphic 3 – Average of effects 1 and 2 in Reading and Mathematics according to the quartiles for administrative leadership
Source: Prepared with Prova Brasil data from 2007 to 2013.
Graphic 4 – Average of effects 1 and 2 in Reading and Mathematics according to quartiles for pedagogical leadership
Source: Prepared with Prova Brasil data from 2007 to 2013.
76
SÉRI
E D
ebat
es E
D

0.180
0.120
0.060
0.000
-0.060
-0.180
-0.120
Q1 Q2
Reading Mathematics
Q3 Q4 Q1 Q2 Q3 Q4
Effect 1 Effect 2
0.180
0.120
0.060
0.000
-0.060
-0.180
-0.120
Q1 Q2
Reading Mathematics
Q3 Q4 Q1 Q2 Q3 Q4
Effect 1 Effect 2
Graphic 5 – Average of effects 1 and 2 in Reading and Mathematics according to quartiles for participatory management
Source: Prepared with Prova Brasil data from 2007 to 2013.
Graphic 6 – Average of the effects 1 and 2 in Reading and Mathematics according to quartiles for human resources
Source: Prepared with Prova Brasil data from 2007 to 2013.
This implies that in schools where administrative
and pedagogical leadership issues are better
resolved, the management is more democratic
and there are fewer problems regarding human
resources, students have lower chances of
exclusion (effect 1) and more likely to become
adequate (effect 2). These findings are particularly
notable for Mathematics, especially in effect 2.
In the “principal’s experience” factor, Graphic
7 shows that the cases of little experience (first
quartile) and a lot of experience (last quarter) are
in opposite directions. In other words, students
are less likely to be excluded (effect 1, positive)
in schools where the schools principals are more
experienced (quartile 4), and are more likely
to have an adequate performance (effect 2, 77
SÉRI
E D
ebat
es E
D

0.180
0.120
0.060
0.000
-0.060
-0.180
-0.120
Q1 Q2
Reading Mathematics
Q3 Q4 Q1 Q2 Q3 Q4
Effect 1 Effect 2
0.180
0.120
0.060
0.000
-0.060
-0.180
-0.120
Nouniversity
degree
Universitydegree but
not teachinglicense
Receivedteachinglicense
Nouniversity
degree
Universitydegree but
not teachinglicense
Receivedteachinglicense
Effect 1 Effect 2
positive). In schools where the principals are less
experienced (quartile 1), the situation is reversed.
However, the intermediate distributions of this
factor are not very clear.
Graphic 7 – Average of effects 1 and 2 in Reading and Mathematics according to quartiles for principal’s experience variable
Source: Prepared with Prova Brasil data from 2007 to 2013.
Graphic 8, which refers to the principal’s
initial schooling, shows the relationship of the
effects with three categories of school principal
qualifications: did not receive a university
degree; received a university degree but not a
teaching license; and received a teaching license.
The last category is the required education
for a professional working with teaching or
management in basic education.
Graphic 8 – Average of effects 1 and 2 in Reading and Mathematics according to the principal’s education variable
Source: Prepared with Prova Brasil data from 2007 to 2013.
78
SÉRI
E D
ebat
es E
D
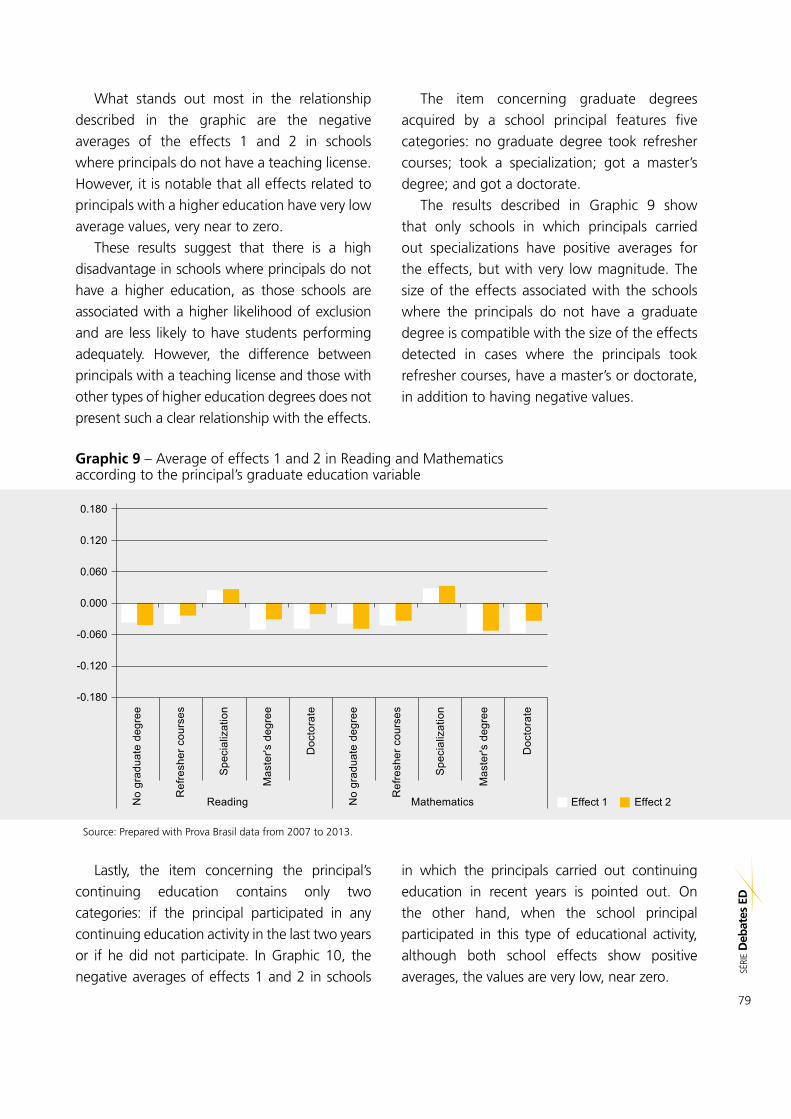
0.180
0.120
0.060
0.000
-0.060
-0.180
-0.120
No
grad
uate
deg
ree
Ref
resh
er c
ours
es
Spe
cial
izat
ion
Mas
ter's
deg
ree
Doc
tora
te
No
grad
uate
deg
ree
Ref
resh
er c
ours
es
Spe
cial
izat
ion
Mas
ter's
deg
ree
Doc
tora
te
Reading Mathematics Effect 1 Effect 2
What stands out most in the relationship
described in the graphic are the negative
averages of the effects 1 and 2 in schools
where principals do not have a teaching license.
However, it is notable that all effects related to
principals with a higher education have very low
average values, very near to zero.
These results suggest that there is a high
disadvantage in schools where principals do not
have a higher education, as those schools are
associated with a higher likelihood of exclusion
and are less likely to have students performing
adequately. However, the difference between
principals with a teaching license and those with
other types of higher education degrees does not
present such a clear relationship with the effects.
The item concerning graduate degrees
acquired by a school principal features five
categories: no graduate degree took refresher
courses; took a specialization; got a master’s
degree; and got a doctorate.
The results described in Graphic 9 show
that only schools in which principals carried
out specializations have positive averages for
the effects, but with very low magnitude. The
size of the effects associated with the schools
where the principals do not have a graduate
degree is compatible with the size of the effects
detected in cases where the principals took
refresher courses, have a master’s or doctorate,
in addition to having negative values.
Graphic 9 – Average of effects 1 and 2 in Reading and Mathematics according to the principal’s graduate education variable
Source: Prepared with Prova Brasil data from 2007 to 2013.
Lastly, the item concerning the principal’s
continuing education contains only two
categories: if the principal participated in any
continuing education activity in the last two years
or if he did not participate. In Graphic 10, the
negative averages of effects 1 and 2 in schools
in which the principals carried out continuing
education in recent years is pointed out. On
the other hand, when the school principal
participated in this type of educational activity,
although both school effects show positive
averages, the values are very low, near zero.
79
SÉRI
E D
ebat
es E
D

0.180
0.120
0.060
0.000
-0.060
-0.180
-0.120
No
Reading Mathematics
Yes No Yes
Effect 1 Effect 2
Graphic 10 – Average of effects 1 and 2 in Reading and Mathematics according to the principal’s continuing education variable
Source: Prepared with Prova Brasil data from 2007 to 2013.
The results of this section do not imply that
investment in the training of school principals is
not effective. The modalities verified in this study
for the training of principals may have occurred
prior to the exercise of function. They may have
also been focused on their performance as
educators. In this way, the relationship between
principal training and student performance may
not be as evident. Furthermore, the training can
have indirect effects that were not detected in
this study.
G.2 School effects according to school environment factors
Graphics 11 to 14 present the distribution
of effects 1 and 2 in Reading and Mathematics
by quartiles of school environment factors. The
results indicated a linear association between
the school effects and the “cohesion of the
pedagogical team” (Graphic 11), “school
operating conditions” (Graphic 12) and
“intervention for improvements” (Graphic 13)
factors. The average of effects 1 and 2, both in
Reading and Mathematics, grow as the scores
of the factors increase.
80
SÉRI
E D
ebat
es E
D

0.180
0.120
0.060
0.000
-0.060
-0.180
-0.120
Q1 Q2
Reading Mathematics
Q3 Q4 Q1 Q2 Q3 Q4
Effect 1 Effect 2
0.180
0.120
0.060
0.000
-0.060
-0.180
-0.120
Q1 Q2
Reading Mathematics
Q3 Q4 Q1 Q2 Q3 Q4
Effect 1 Effect 2
Graphic 11 – Average of effects 1 and 2 in Reading and Mathematics according to the quartiles for cohesion of the pedagogical team
Source: Prepared with Prova Brasil data from 2007 to 2013.
Graphic 12 – Average of effects 1 and 2 in Reading and Mathematics according to the quartiles for school operating conditions
Source: Prepared with Prova Brasil data from 2007 to 2013.
81
SÉRI
E D
ebat
es E
D

0.180
0.120
0.060
0.000
-0.060
-0.180
-0.120
Q1 Q2
Reading Mathematics
Q3 Q4 Q1 Q2 Q3 Q4
Effect 1 Effect 2
Graphic 13 – Average of effects 1 and 2 in Reading and Mathematics according to the quartiles for improvement interventions
Source: Prepared with Prova Brasil data from 2007 to 2013.
This can be interpreted as evidence that in
schools where there is: 1) better cooperation
among the teaching staff, an exchange of ideas
and mutual trust among students; 2) good
operating conditions, without interruptions,
absences and disciplinary problems from
students; and 3) concern for the performance
and promotion of students, there is a lower
chance that students might find themselves in
an exclusionary situation and are more likely to
be at an adequate level.
As for the “school violence” factor, despite
the shortcomings over the complexity for
estimating this factor discussed in section D.2.4
from Chapter IV, the results, when comparing
the first and last quartiles, confirm a positive
association between the factor and school
effects. However, some unexpected results in
Reading deserve to be noted.
In Graphic 14, effect 1 has a linear behavior for
reading because, as the condition for the ‘school
violence’ factor improves, they increase the
likelihood that students will not find themselves
in an exclusionary situation (effect 1). However,
effect 2 does not follow the same pattern. In
the first quartile, effect 2 features a positive
indication, even if the magnitude were very
small. This is an unexpected result and counter-
intuitive, because it suggests that a school in
the worst situation of a “violence at school”
factor does not affect whether a student is at
an adequate level. In the intermediate quartiles,
the effect 2 becomes negative and runs counter
to effect 1. From the information available, it is
not possible to explain these results, apart from
the data limitations, as already noted. The two
effects for Reading were consistent in results in
the expected direction, only in the last quartile.
In other words, students who study in schools
with fewer problems of violence are less likely
to be excluded and are more likely to have an
adequate performance.
82
SÉRI
E D
ebat
es E
D

0.180
0.120
0.060
0.000
-0.060
-0.180
-0.120
Q1 Q2
Reading Mathematics
Q3 Q4 Q1 Q2 Q3 Q4
Effect 1 Effect 2
Graphic 14 – Average of effects 1 and 2 in Reading and Mathematics according to the quartiles for school violence
Source: Prepared with Prova Brasil data from 2007 to 2013.
In Mathematics, the linear relationship between
the violence at school factor and the school effects
is clearer for both effects and are particularly
distinguished in the highest quartile.
G.3 School effects according to the characterization of teaching and teachers factors
Graphics 15 to 21 show the distribution of
effects 1 and 2 in Reading and Mathematics
by quartiles for the factors related to the
characterization of teaching and teachers.
The presented results indicated a linear
association between the school effects and
the “use of teaching resources – ICT” (Graphic
15), “use of teaching resources – Portuguese”
(Graphic 17), “use of teaching resources –
Mathematics” (Graphic 18) and “teacher
experience” (Graphic 21) factors.
The averages for effects 1 and 2, both in
Reading and in Mathematics, grow as the
scores of the factors increase. In other words,
in schools where there is: 1) the use of ICT; 2)
greater employment of diversified teaching
resources by teachers of Portuguese and Math;
and 3) more experienced teachers, students are
less likely to be excluded and more likely to be
at an adequate level.
The results recorded in Graphic 16 show
that in schools using a small amount of printed
resources (first quartile) or those who use
a lot (last quarter), the 1 and 2 effects are in
the expected direction because they feature
respective positive and negative averages. That
is, in schools that use more printed resources
(quartile 4), students are less likely to be excluded
(effect 1, positive) and are more likely to have
an adequate performance (effect 2, positive).
In schools where these features are absent
from the educational practices (quartile 1), the
situation is reversed: there are greater chances
of exclusion and less likelihood of students
being at an adequate performance level.
83
SÉRI
E D
ebat
es E
D

0.180
0.120
0.060
0.000
-0.060
-0.180
-0.120
Q1 Q2
Reading Mathematics
Q3 Q4 Q1 Q2 Q3 Q4
Effect 1 Effect 2
0.180
0.120
0.060
0.000
-0.060
-0.180
-0.120
Q1 Q2
Reading Mathematics
Q3 Q4 Q1 Q2 Q3 Q4
Effect 1 Effect 2
Graphic 15 – Average of effects 1 and 2 in Reading and Mathematics according to the quartiles for the use of teaching resources – ICT
Source: Prepared with Prova Brasil data from 2007 to 2013.
Graphic 16 – Average of effects 1 and 2 in Reading and Mathematics according to the quartiles for the use of printed resources
Source: Prepared with Prova Brasil data from 2007 to 2013.
However, the intermediary distributions
for the “use of printed resources” factor are
not very clear. In Reading within the second
quartile, it is seen that the average effects,
although having very low values, are in
opposite directions: students are more likely
to be in an exclusionary situation and, at
the same time, are more likely to have an
adequate performance. In Mathematics, the
average of effects 1 and 2 are only positive in
quartile 4. In other words, the use of printed
resources is associated only with situations
that favor the student – a lesser chance of
exclusion and greater chance of an adequate
performance – when school uses ample
varieties of printed resources.
84
SÉRI
E D
ebat
es E
D

0.180
0.120
0.060
0.000
-0.060
-0.180
-0.120
Q1
Reading
Q2 Q3 Q4
Effect 1 Effect 2
0.180
0.120
0.060
0.000
-0.060
-0.180
-0.120
Q1
Mathematics
Q2 Q3 Q4
Effect 1 Effect 2
Graphic 17 – Average of effects 1 and 2 in Reading and Mathematics according to the quartiles for the use of educational resources – Portuguese
Source: Prepared with Prova Brasil data from 2007 to 2013.
Graphic 18 – Average of effects 1 and 2 in Reading and Mathematics according to the quartiles for the use of teaching resources – Mathematics
Source: Prepared with Prova Brasil data from 2007 to 2013.
Through the information from Graphic
19, we can see that the average effects are
consistently positive only in the highest
quartile of the “school curriculum” factor.
Namely, in schools where the curriculum
is considered satisfactory and is effectively
met, students are less likely to be excluded
(effect 1, positive) and more likely to have an
adequate performance (effect 2, positive). In
schools where this does not occur or occurs
only partially (quartiles 1-3), the situation is
reversed: there are more chances for exclusion
and a lesser likelihood of students being at an
adequate performance level.
85
SÉRI
E D
ebat
es E
D

0.180
0.120
0.060
0.000
-0.060
-0.180
-0.120
Q1 Q2
Reading Mathematics
Q3 Q4 Q1 Q2 Q3 Q4
Effect 1 Effect 2
0.180
0.120
0.060
0.000
-0.060
-0.180
-0.120
Q1 Q2
Reading Mathematics
Q3 Q4 Q1 Q2 Q3 Q4
Effect 1 Effect 2
Graphic 19 – Average of effects 1 and 2 in Reading and Mathematics according to the quartiles for school curriculum
Source: Prepared with Prova Brasil data from 2007 to 2013.
It should be mentioned that, both in Reading
and in Mathematics, the positive scores from
the curriculum are more associated with the
higher averages of effect 2, which increases
the chances of students being at an adequate
level, rather than remaining at a basic level.
The results shown in Graphic 20 reinforce
the importance of a school containing
properly trained teachers. Generally, only
when almost all teachers possess a teaching
license, effects 1 and 2 have positive averages,
indicating that students are less likely to be
excluded and more likely to have adequate
performance in these schools.
Graphic 20 – Average of effects 1 and 2 in Reading and Mathematics according to the quartiles for teacher training
Source: Prepared with Prova Brasil data from 2007 to 2013.
86
SÉRI
E D
ebat
es E
D

0.180
0.120
0.060
0.000
-0.060
-0.180
-0.120
Q1 Q2
Reading Mathematics
Q3 Q4 Q1 Q2 Q3 Q4
Effect 1 Effect 2
However, in the second quartile, although
having very low values, the observed
averages are positive; except for effect 2
in Mathematics. However, if we determine
the negative values of the first and third
quartiles, the clearest message is really about
the importance of the teachers having an
appropriate teaching license.
Graphic 21 – Average of effects 1 and 2 in Reading and Mathematics according to the quartiles for teacher experience
Source: Prepared with Prova Brasil data from 2007 to 2013.
G.4 School effects according to school infrastructure factors
Graphics 22 to 25 show the distribution of
effects 1 and 2 in Reading and Mathematics
by quartiles for the factors related to the
infrastructure of schools.
The presented results indicate a linear
association between the school effects and the
“facilities” (Graphic 22), “library” (Graphic 23),
“equipment” (Graphic 24) and “maintenance
of the school building” (Graphic 25) factors.
Only in the “library” factor, in quartile 2 for
Reading, do effects 1 and 2 have an inverted
direction, but this does not affect the overall
interpretation of the association of higher
scores for the “school library” to the positive
averages for effects 1, referring to the reduction
of exclusion, and effects 2, related to increased
chances for suitable results.
These results reinforce the need for a school to
have proper educational spaces; the importance
of audiovisual resources, information technology
and telecommunications within schools; and
the importance of these features operating in
well-maintained locations so that students have
conditions for adequate learning and, thus, a
lesser probability for exclusion.
87
SÉRI
E D
ebat
es E
D

0.180
0.120
0.060
0.000
-0.060
-0.180
-0.120
Q1 Q2
Reading Mathematics
Q3 Q4 Q1 Q2 Q3 Q4
Effect 1 Effect 2
0.180
0.120
0.060
0.000
-0.060
-0.180
-0.120
Q1 Q2
Reading Mathematics
Q3 Q4 Q1 Q2 Q3 Q4
Effect 1 Effect 2
Graphic 22 – Average of effects 1 and 2 in Reading and Mathematics according to the quartiles for facilities
Source: Prepared with Prova Brasil data from 2007 to 2013.
Graphic 23 – Average of effects 1 and 2 in Reading and Mathematics according to the quartiles for libraries
Source: Prepared with Prova Brasil data from 2007 to 2013.
88
SÉRI
E D
ebat
es E
D

0.180
0.120
0.060
0.000
-0.060
-0.180
-0.120
Q1 Q2
Reading Mathematics
Q3 Q4 Q1 Q2 Q3 Q4
Effect 1 Effect 2
0.180
0.120
0.060
0.000
-0.060
-0.180
-0.120
Q1 Q2
Reading Mathematics
Q3 Q4 Q1 Q2 Q3 Q4
Effect 1 Effect 2
Graphic 24 – Average of effects 1 and 2 in Reading and Mathematics according to the quartiles for equipment
Source: Prepared with Prova Brasil data from 2007 to 2013.
Graphic 25 – Average of effects 1 and 2 in Reading and Mathematics according to the quartiles for school building maintenance
Source: Prepared with Prova Brasil data from 2007 to 2013.
89
SÉRI
E D
ebat
es E
D

H. Linear correlation between the school effects and school factors
Based on the information provided in
Table 69, the linear correlation coefficients (r)
can be seen, where they indicate there is a
positive relationship between school factors
and the effects of schools calculated by basic
models. The positive coefficients indicate that
all the factors and effects run in the same
direction, in other words, the high scores
of the analyzed factor correspond to higher
values for the effects of schools or vice versa.
In the same table, the determination
coefficients (r2) express how much each of the
factors can explain the variation in the effects
of schools. Coefficients higher than 0.5 are
highlighted, corresponding to an explanatory
power of 5%.
It is important to note that the relationships
that have been analyzed already take the
socioeconomic context of schools into account, as
well as the characteristics of the students’ origins.
Thus, it is possible to identify the contribution of
each factor when analyzing the coefficients in
order to produce the effects of schools.
It should also be pointed out that, given the
complexity of the school contexts, there is no
single factor that has a very high explanatory
power, that is, there is no single “silver bullet”
capable of producing the expected effects.
Therefore, evidence must be interpreted
parsimoniously. They allow for a more careful
assessment of practices and situations that
enable schools to improve their ability to
produce desirable effects of promoting non-
exclusion and learning adequacy, but this does
not mean that relations are deterministic.
Note that the ’intervention for improve-
ments’ factor explains about a 5% variation in
the type 1 effects for Reading; about 7% in the
type 2 effects for Reading and around a 6%
variation in the type 2 effects for Mathematics.
The “use of teaching resources – ICT” factor
explains approximately 6% of the variation in
the type 2 effects for both Reading as well as
Mathematics.
The “curriculum in school” factor explains
approximately 6% of the variation in the type 1
effects for Reading and Math, and around 7%
in the type 2 effects.
Lastly, the “equipment” factor accounted for
almost 7% of the variation in the type 1 effects
and almost 10% of the variation in the type 2
effects for Reading. This factor also explains
about a 6% of the variation in the type 1 effects
and 8% of the variation in the type 2 effects for
Mathematics.
90
SÉRI
E D
ebat
es E
D

Table 69 – Linear correlation coefficients and determination coefficients among the school factors and effects 1 and 2 of schools for Reading and Mathematics
School factorsCorrelation coefficients (r) Determination coefficients (r2)
Effect 1 (Read.)
Effect 2 (Read.)
Effect 1 (Math.)
Effect 2 (Math.)
Effect 1 (Read.)
Effect 2 (Read.)
Effect 1 (Math.)
Effect 2 (Math.)
Administrative leadership 0.147 0.164 0.155 0.169 0.022 0.027 0.024 0.029
Pedagogical leadership 0.135 0.144 0.146 0.156 0.018 0.021 0.021 0.024
Participative management 0.038 0.044 0.036 0.040 0.001 0.002 0.001 0.002
Human resources 0.049 0.019 0.070 0.053 0.002 0.000 0.005 0.003
Experience of the principal 0.097 0.130 0.087 0.112 0.009 0.017 0.007 0.012
Team cohesion 0.093 0.104 0.100 0.112 0.009 0.011 0.010 0.012
Operating conditions 0.111 0.111 0.128 0.134 0.012 0.012 0.016 0.018
Intervention for improvements 0.223 0.272 0.211 0.253 0.050 0.074 0.044 0.064
Violence 0.015 0.007 0.028 0.026 0.000 0.000 0.001 0.001
Educational resources – ICT 0.219 0.247 0.218 0.240 0.048 0.061 0.047 0.058
Printed educational resources 0.134 0.154 0.135 0.151 0.018 0.024 0.018 0.023
Educational resources – Portuguese
0.044 0.044 0.051 0.054 0.002 0.002 0.003 0.003
Educational resources – Mathematics
0.068 0.066 0.075 0.080 0.005 0.004 0.006 0.006
Curriculum 0.236 0.259 0.242 0.262 0.056 0.067 0.059 0.069
% of adequately trained teachers
0.082 0.102 0.087 0.099 0.007 0.010 0.008 0.010
Teacher experience 0.092 0.104 0.091 0.103 0.008 0.011 0.008 0.011
Facilities 0.104 0.134 0.110 0.130 0.011 0.018 0.012 0.017
Library 0.164 0.205 0.165 0.195 0.027 0.042 0.027 0.038
Equipment 0.258 0.309 0.247 0.285 0.067 0.096 0.061 0.081
Building maintenance 0.171 0.209 0.169 0.199 0.029 0.044 0.029 0.040
Source: Prepared with Prova Brasil data from 2007 to 2013.Note: All the correlation coefficients are statistically significant at 0.01, except the coefficients that are equal to zero.
I. Coefficients of the multinomial hierarchical regression model
To interpret the coefficients for the
multinomial hierarchical regression models,
the extended models for Reading and Math
were adjusted, along with the variables for
the basic model, including the academic
grade and the Prova Brasil edition as control
variables. These models allow for a more
adequate interpretation of the coefficients for
the student variables, because they control the
effects of the differences in the educational
stages and the development of proficiency
throughout editions of the test.
Table 70 shows the coefficients and the
probability ratios of the estimated multinomial
hierarchical regression (extended models) for
learning levels in Reading and Math.
The coefficients of the variables can be
interpreted as the additive effect of the increase in
one variable X unit in question within the probability
of being in category 1 (below basic) or category 2
(adequate) than in the reference category (basic).
The probability ratios are also presented in Table
70 because they are more interpretable. They
are obtained through Exp. (coefficient), which
is interpreted as the multiplicative effect of the
increase of one unit in X over the chances of an
individual being in category 1 or category 2 than
in the reference category (basic). 91
SÉRI
E D
ebat
es E
D

Table 70 – Estimated coefficients of multinomial hierarchical regression models
Fixed effectsReading Mathematics
CoefficientProbability
ratioCoefficient
Probability ratio
For Category 1: below basicIntercept. γ00(1) -0.751 0.47 -0.505 0.60Socioeconomic level of the school. γ01(1) -0.653 0.52 -0.747 0.47Gender. γ10(1) -0.469 0.63 0.088 1.09Missing values for gender. γ20(1) 0.361 1.43 0.624 1.87Mixed race. γ30(1) -0.043 0.96 -0.016 0.98Black. γ40(1) 0.185 1.20 0.228 1.26Others. γ50(1) 0.145 1.16 0.156 1.17Educational lag. γ60(1) 0.072 1.07 0.076 1.08Socioeconomic level of the student. γ70(1) -0.057 0.94 -0.139 0.87Parental involvement. γ80(1) -2.297 0.10 -1.861 0.16Reading habits. γ90(1) -0.041 0.96 -0.039 0.962009. γ100(1) -0.159 0.85 -0.111 0.892011. γ101(1) -0.112 0.89 -0.106 0.902013. γ102(1) 0.076 1.08 0.069 1.07Grade. γ103(1) 0.301 1.35 0.052 1.05
For category 2: adequate/ advanced
Intercept. γ00(2) -1.499 0.22 -1.851 0.16Socioeconomic level of the school. γ01(2) 0.841 2.32 0.836 2.31Gender. γ10(2) 0.371 1.45 -0.221 0.80Missing values for gender. γ20(2) -0.407 0.67 -0.617 0.54Mixed race. γ30(2) -0.144 0.87 -0.137 0.87Black. γ40(2) -0.432 0.65 -0.491 0.61Others. γ50(2) -0.294 0.75 -0.280 0.76Educational lag. γ60(2) -0.056 0.95 -0.093 0.91Socioeconomic level of the student. γ70(2) 0.223 1.25 0.222 1.25Parental involvement. γ80(2) 1.531 4.62 1.422 4.14Reading habits. γ90(2) 0.144 1.15 0.093 1.102009. γ100(2) 0.293 1.34 0.279 1.322011. γ101(2) 0.295 1.34 0.233 1.262013. γ102(2) 0.376 1.46 0.217 1.24Grade. γ100(2) 0.804 2.23 1.403 4.07
Source: Prepared with Prova Brasil data from 2007 to 2013.Note: All coefficients have a p-value of less than 0.001.
Note that the increase of the average
school SES decreases the chances of exclusion
and increase the chances of adaptation in
both Reading and Mathematics, regardless
of the other variables included in the model.
This factor represents a measure of the social
composition in the student body that strongly
affects school performance. The result indicates
that the schools reproduce the social inequality
within the country in their own contexts. In
turn, they become heavily segregated. It should
be pointed out that neither federal public
schools nor private schools are included in the
population of schools in this study. Otherwise,
most likely, we would find a greater effect on
the SES.
The pattern observed for the effects of
student SES is similar. The higher the SES, the
lower the chances for exclusion and the greater
the adequacy. Families with more consumer
92
SÉRI
E D
ebat
es E
D

goods items - which are an expression of income
– and higher education offer more educational
opportunities to their children.
Girls have a lower probability to be at a
level below basic than boys do, and they are
more likely to be at the adequate level in
Reading. This pattern is reversed when we
analyze Mathematical competence. This result is
consistent with literature that deals with gender
differences in educational success (SOARES et al.,
2012; ANDRADE; FRANCO; CARVALHO, 2003).
Differences in academic performance
between white students, black and mixed-race
(with the latter two groups considered by a good
portion of the literature as a single category
called ‘black’) have been fairly consistent
findings in Brazilian research (SOARES; ALVES,
2003; PAIXÃO; ROSSETO; CARVANO, 2011).
Soares and Alves (2003) point to evidence that
the school performance gap between color/
race groups is lesser among students with a
lower SES.
Results of this research indicate that mixed-
race students have shown lower chances of
exclusion and lower chances of adequacy,
both in Reading and in Mathematics, when
compared to white students. Black students
have a greater chance of exclusion and are
less likely of adequacy, in both subjects, when
compared to white students.
One possible interpretation of these results may
be related to the difficulty of racial self-classification
(ROCHA; ROSEMBERG, 2007; OSÓRIO, 2003).
Another possibility, not in conflict with the first, is
the fluidity in the racial classification observed in
some research (PEIXOTO, BRAGA, 2006), paying
attention to the reliability, variability and the validity
of the variable in race/ color as a demarcator of
differences (MUNIZ, 2010). This result could be
explored in further studies, especially with respect
to the differences in the classification between
groups of students at a lower or higher SES.
The students lagging behind have disadvantages
compared to students without this delay: the first
have a higher probability of being at level below
basic and are less likely to be at an adequate level
than at a basic level.
It is also possible to note that elevated parent
involvement decreases the chances of exclusion,
both in Reading and in Mathematics, and
increases the chances of students being at an
adequate level.
The greater the reading habits, the less likely
for a student to also be at a below basic level
and the greater their chances are of being at the
adequate level.
93
SÉRI
E D
ebat
es E
D

VI. Final considerations
The main objective of this research was to
study the phenomenon of intra-school exclusion
in Brazilian public schools, based on an analysis
of data produced by Prova Brasil from 2007
to 2013. The scope of the study involved the
production of factors associated with students
and schools that were related to learning, as
well as the calculation of the effects schools
had on reducing the chances of intra-school
exclusion.
In order to propose factors associated with
learning, previous work done by (BROOKE;
SOARES, 2008; SOARES et al., 2012) and the
contextual surveys of wide-scale assessments
of basic education performed by INEP were
taken as a reference. The proposed factors
were organized into two groups: student
factors and school factors. The latter was
divided into four themes: “school leadership”,
“school environment”, “teaching and teacher
characteristics” and “infrastructure”. A set of
school factors and discriminate variables are
grouped into each of these themes.
The construction of these factors was
extremely challenging due to the idiosyncrasy
of the data since the surveys of the assessments
were not designed to answer this study’s
questions, nor made directly compatible.
However, if the process had been done
independently, i.e. without aligning databases,
the scale of the scores from the estimated
factors would not be directly comparable. This
is one of the unique aspects of this work.
For an estimate of the school effects,
hierarchical multinomial regression models were
employed in an original way, resulting in two
types of effects: effect 1, which is the school’s
ability to diminish the chances of their students
being in a situation of exclusion (below basic
level); and effect 2, which is the school’s ability
to increase the chances of their students getting
to an adequate situation (adequate/advanced
level). Regression models were implemented for
the control of the student’s SES, sex, race/ color
and the appropriate age-grade of the student,
as well as the school’s average SES.
Without this control, the analysis could
produce overestimated effects of schools
due to the high correlation between school
performance and the characteristics of the
student body.
The analytical approach for analyzing the
proficiency of students, organized into three
categories, is a unique aspect of this study. The
results, summarized below, have proven to be
fruitful in order to understand the phenomenon
of school exclusion and for proposing
educational policies. The overall results are:
94
SÉRI
E D
ebat
es E
D

(1) The descriptive analysis showed that
students at a below basic level learning,
composing the intra-school exclusion group,
possess sociodemographic characteristics
that are at a disadvantage when dealing
with educational outcomes. This group also
systematically studies in schools in which
the efficiency factors analyzed in this study
had lower values. In other words, they are
schools in which operating conditions are
more complex.
(2) With respect to the effects of the schools,
the tendency declined from 2009. The
significance of this is that, over time, the
schools suffered a reduction in their ability
to get their students out of exclusion and
keep them at a level of adequacy.
(3) The trajectories of these effects were
analyzed by school in the period from
2007 to 2013 in a continuum of trends
that were more positive than negative.
The schools that have a consistently
positive trend are those with the ability to
take their students out of exclusion and
keep them in a suitable learning situation
every year. There are between 15% and
17% of total schools with this trajectory,
depending on the evaluated competence
and the type of effect. These values are
not very significant given that, on the
other hand, there are between 10%
and 14% of school with a consistently
negative trajectory.
(4) The effects of the schools were also
analyzed according to federative units by
the type of education offered (if the school
only offers the initial years of elementary
school, the final years of elementary school
or both stages), over time. The average of
the effects of schools that only offer the
initial years are generally valued higher
when compared with other types.
(5) Some states stand out for showing progress
in the average of the effects over time,
both in Reading and Mathematics. The
state of Ceará is first place is such progress.
The state schools, regardless of the type of
education they offered, showed growth in
the size of the effects. Schools from Acre
and Rondônia that only offer the initial
years or both stages of elementary school
also deserve to be noted.
(6) Among the state capitals, schools in the
municipalities of Rio Branco, Palmas,
Teresina, Fortaleza and Rio de Janeiro stand
apart because they present positive effects
1 and 2 in Reading and Mathematics in all
editions of the Prova Brasil.
(7) In 2013, the municipalities with the highest
averages of effects 1 and 2 in Reading
and Mathematics were generally small
municipalities in Minas Gerais and Ceará,
where there are less than 10 schools.
Exceptions are Brejo Santo, with 19 schools,
and Sobral, with 44 schools, both in Ceará.
(8) The relationship between the school
effects and factors of school leadership
associated with learning showed that at
schools where matters of administrative
and pedagogical leadership were more
developed, the management was more
democratic, there were fewer human
resource problems, the principal had a
higher education, students had a lesser
chance of exclusion (effect 1) and a
higher chance for adequacy (effect 2)
in schools where administrative and
pedagogical leadership issues were
more developed.
(9) Regarding the factors of school
environment, the analysis indicated
that in schools where there is more
collaboration between the educational
team, good working conditions and 95
SÉRI
E D
ebat
es E
D

a concern for the performance and
promotion of students, then students
are less likely to be in exclusion and more
likely to be at an adequate level.
(10) The relationship between the school
effects and the factors used to characterize
the teaching and teachers highlights that
where there is a use of ICT and diversified
teaching resources by teachers, more
experienced teachers with a degree in the
area they teach, and where the school’s
curriculum is considered suitable and is
completed effectively, then students have
a lesser chance of exclusion and are more
likely to be at the adequate level.
(11) The analyzed ratio between the effects
of schools and infrastructure factors
demonstrated the need for schools
to have adequate educational spaces;
audiovisual, information technology
and telecommunications resources; and
for these features to operate in well-
maintained locations so that students
have appropriate learning conditions and
are less likely to be excluded.
(12) To synthesize the contribution of each
one of the factors to produce the effects
of schools, the correlation coefficients
and the coefficients of determination
were calculated among the effects and
each factor. The relationships analyzed
were all positive and already took the
socioeconomic context of schools into
account, as well as the characteristics
related to the origin of the students. The
coefficients of determination express how
much each of the factors can explain
the variation in the effects of schools.
Some important elements in the order of
their coefficient size include equipment,
intervention for improvements, curriculum
and the use of educational resources – ICT.
(13) The coefficients of the estimated
hierarchical multinomial regression models
for Reading and Mathematics pointed
to results that were consistent with the
educational literature and indicated the
groups least likely to have intra-school
exclusion. In Reading, those groups having
a lower probability for exclusion are girls,
mixed race students, students that do
not have a school lagging, students with
a higher socioeconomic status, reading
habits and the involvement of parents.
In Mathematics, the same probabilities
were observed with the exception of the
advantage of boys over girls.
The combination of these results should be
read parsimoniously and not deterministically
since the design of this study is limited, as
is the data used to arrive at the conclusions
regarding relations of causality. Given the
complexity of school contexts, there is no single
factor associated with learning that can be
taken as a “silver bullet” capable of producing
all expected results. Nonetheless, some results
are consistent with other educational studies
and may clearly provide information to support
educational policies.
We can assume that some school factors are
associated with the outcomes that are of interest
for this study. That is, reducing the likelihood
of intra-school exclusion and increasing the
chances for adequate learning. Since this
relationship was analyzed based on the results
obtained in controlled and very exacting models
(including control of the student’s and the
school’s characteristics), the results are more
consistent in the trends indicated than if there
had been no such control.
The findings from this study indicate trends
that reinforce the pertinence of some of the
strategies from the National Education Plan
(PNE) – a document that has been strongly
96
SÉRI
E D
ebat
es E
D

guiding the current debate in the educational
field – to improve the educational quality
within the country. For example, the following
can be indicated: the National Common Core
Curriculum (the “curriculum in school” factor),
democratic management (factors associated
with school leadership), educational funding
(factors associated with infrastructure and
resources), combating violence (the “school
violence” factor), educational technologies
(the “educational resources – ICT” factor),
combating inequalities and monitoring access
and permanence (the “intervention for
improvements” factor), among others.
97
SÉRI
E D
ebat
es E
D

B I B L I O G R A P H I C R E F E R E N C E S
ABRÚCIO, F. L. Estudos e pesquisas educacionais: estudos realizados em 2007, 2008, 2009. In: FUNDAÇÃO VICTOR CIVITA. Estudos e pesquisas educacionais, v.1: estudos realizados em 2007, 2008, 2009. São Paulo: Fundação Vitor Civita, 2010. p. 241-274.
ALVES, M. T. G.; FRANCO, C. A pesquisa em eficácia escolar no Brasil: evidências sobre o efeito das escolas e fatores associados à eficácia escolar. In: BROOKE, N.; SOARES, J. F. (Org.).Pesquisa em eficácia escolar: origem e trajetórias. Belo Horizonte: Editora UFMG, 2008. p. 482-500.
ALVES, M. T. G.; SOARES, J. F. Efeito-escola e estratificação escolar: o impacto da composição de turmas por nível de habilidade dos alunos. Educação em Revista, n. 45, p. 25-59, 2007.
ALVES, M. T. G.; SOARES, J. F.; XAVIER, F. S. Índice socioeconômico das escolas de educação básica brasileiras. Ensaio: Avaliação e Políticas Públicas em Educação, v. 22, n. 84. p. 671-703, 2014.
ALVES, M. T. G. et al. Fatores familiares e desempenho escolar: uma abordagem multidimensional. Dados, v. 56, n. 3, p. 571-603, set. 2013
AMADO, J. S.; FREIRE, I. P. Indisciplina e violência na escola: compreender para prevenir. Porto: Edições Asa, 2002.
ANDRADE, J. M.; LAROS, J. A. Fatores associados ao desempenho escolar: estudo multinível com dados do Saeb/2001. Psicologia: Teoria e Pesquisa, v.23, n.1, p.33-42, 2007.
ANDRADE, M.; FRANCO, C.; CARVALHO, J. P. Gênero e desempenho em matemática ao final do ensino médio: quais as relações? Estudos em Avaliação Educacional, São Paulo, n. 27, p.77-96, 2003.
ANGOFF, W. H. Scales, norms, andequivalent scores. In: THORNDIKE, R. L. (Ed.), Educational measurement. Washington, DC: American Council on Education, 1971. p. 508-600.
BAYE, A; MONSEUR, C. Gender differences in variability and extreme scores in an international context. Large-scale Assessment in Education, v. 4, n. 1, p. 1-16, 2016. Available at: <http://largescaleassessmentsineducation.springeropen.com/articles/10.1186/s40536-015-0015-x>. Acessed in: 31 jan. 2016.
BEATON, A.; ALLEN, N. Interpreting scales through scale anchoring. Journal of Educational and Behavioral Statistics, v. 17, n. 2, p. 191-204, 1992.
BRASIL. Constituição (1988). Constituição da República Federativa do Brasil. Brasília, DF: Senado Federal: Centro Gráfico, 1988.
BRASIL. Lei nº 8.069, de 13 de julho de 1990. Dispõe sobre o Estatuto da Criança e do Adolescente e dá outras providências. Diário Oficial da União, Brasília, 14 jul. 199. Art. 53. Available at: <http://www.planalto.gov.br/ccivil_03/leis/L8069.htm>.
BRASIL. Lei nº 9.394, de 20 de dezembro de 1996. Estabelece as diretrizes e bases da educação nacional. Diário Oficial da União, Brasília, 21 Dez. 1996. Available at: <http://www.planalto.gov.br/ccivil_03/leis/L9394.htm>.
BRASIL. Lei nº 13.005, de 25 de junho de 2014 que aprova o Plano Nacional de Educação e dá outras providências. Diário Oficial da União, Brasília, 26 Jun. 2014. Available at: <http://www.planalto.gov.br/CCIVIL_03/_Ato2011-2014/2014/Lei/L13005.htm>.
BRESSOUX, P. As pesquisas sobre o efeito-escola e o efeito-professor. Educação em Revista, v. 38, p.17-88, dez 2003.
BROOKE, N.; SOARES, J. F. (Ed.). Pesquisa em eficácia escolar: origem e trajetórias. Belo Horizonte: Editora UFMG, 2008.
98
SÉRI
E D
ebat
es E
D

CARNOY, M.; GOVE, A. K.; MARSHALL, J. H. A vantagem acadêmica de Cuba: por que seus alunos vão melhor na escola. São Paulo: Ediouro, 2009.
CIZEK, G. J. Setting performance standards: concepts, methods, and perspectives. Mahwah, NJ: Lawrence Erlbaum Associates, 2001.
COLEMAN, J. S. Social capital in the creation of human capital. In: LESSER, E. L. (Ed.). Knowledge and social capital. Woburn: Butterworth-Heinemann, 2000.
COLEMAN, J. S. et al. Equality of educational opportunity. Washington, DC: Department of Health, Education and Welfare, 1966.
COTTON, K. Effective schooling practices: a research synthesis. Portland: NWREL, 1995. (School improvement research series).
DOURADO, L. F. Políticas e gestão da educação básica no Brasil: limites e perspectivas. Educ. Soc., v. 28, n. 100, especial, p. 921-946, 2007.
ERICKSON, R.; GOLDTHORPE, J. H. The CASMIN Project and the American Dream. European Sociological Review, v. 8, p. 283-306, 1992.
FONTANIVE, N. S. A divulgação dos resultados das avaliações dos sistemas escolares: limitações e perspectivas. Ensaio: Aval. Pol. Públ. Educ., v. 21, n. 78, p. 83-100, 2013.
FORQUIN, J.-C. A Sociologia das desigualdades de acesso à educação: principais orientações, principais resultados desde 1965. In: FORQUIN, J. C. (Ed.). Sociologia da educação: dez anos de pesquisas. Petrópolis: Vozes, 1995. p.19-78.
FRANCO, C. O Saeb: potencialidades, problemas e desafios. Revista Brasileira de Educação, n.17, p.127-133, mai./ago. 2001.
GAME. Escola eficaz: um estudo de caso em três escolas da rede pública do estado de Minas Gerais;relatório de pesquisa. Belo Horizonte: Grupo de Avaliação e Medidas Educacionais, 2002.
GANZEBOOM, H. B. G.; DE GRAAF, P.; TREIMAN, D. A standard internationalsocio-economic index ofoccupational status. Social Science Research, v. 21, p.1-56. 1992.
GAUTHIER, C.et al.Ensino explícito e desempenho dos alunos: a gestão dos aprendizados. Petrópolis: Vozes, 2014.
GOLDSTEIN, H. Multilevel statistical models. 3.ed. London (UK): Edward Arnold, 2003.
HAMBLETON, R. K. Principles and selected applications of Item Response Theory. In: LINN, R. L. (Ed.). Educational measurement. 3. ed. Washington, DC: American Council on Education and the National Council on Measurement in Education, 1993. p.147-200.
HAUSER, R. M.; WARREN, J. R. Socioeconomic index of occupational status: a review, update, and critique. In: RAFTERY, A. (Ed.). Sociological methodology. Cambridge: Blackwell, 1997. p. 177-298.
JENCKS, C. Desigualdade no aproveitamentoeducacional. In: BROOKE, N.; SOARES, J. F. (Ed.). Pesquisa em eficácia escolar: origem e trajetórias. Belo Horizonte: Editora UFMG, 2008. p. 50-66.
LEE, V. E. Utilização e modelos hierárquicos lineares para estudar contextos sociais: o caso dos efeitos da escola. In: BROOKE, N.; SOARES, J. F. (Ed.). Pesquisa em eficácia escolar: origem e trajetórias. Belo Horizonte: Editora UFMG, 2008. p. 273-298.
LEVINE, D. U. School effectiveness. Londres: Cassell, 1996.
MELLO, G. N. Escolas eficazes: um tema revisitado. In: XAVIER, A. C.; SOBRINHO, J. A.; MARRA, F. (Ed.). Gestão escolar: desafios e tendências. Brasilia: Ipea, 1994. p. 329-369.
MORTIMORE, P. et al. A importância da escola: a necessidade de se considerar as características do alunado. In: BROOKE, N.; SOARES, J. F. (Ed.). Pesquisa em eficácia escolar: origem e trajetórias. Belo Horizonte: Editora UFMG, 2008. p.187-215.
99
SÉRI
E D
ebat
es E
D

MUNIZ, J. O. Sobre o uso da variável raça-cor em estudos quantitativos. Revista de Sociologia e Política, Curitiba, v. 18, n. 36, p. 277-291, jun. 2010.
NAÇÕES UNIDAS. Declaração Universal dos Direitos Humanos. Nova York, 1948. Available at: <http://unesdoc.unesco.org/images/0013/001394/139423por.pdf>.
NERI, M. A nova classe média: o lado brilhante da base da pirâmide, Rio de Janeiro: FGV: Centro de Políticas Sociais, Editora Saraiva, 2012.
NOGUEIRA, M. A. A relação família-escola na contemporaneidade: fenômeno social/interrogações sociológicas. Análise Social, v. 60, p. 563-578, 2005.
OSÓRIO, R. G. O sistema classificatório de “cor ou raça” do IBGE. Brasília: Instituto de Pesquisa Econômica Aplicada, 2003. (Texto para discussão, 996).
PADILHA, F. V. Q. et al. Os municípios e a qualidade das escolas na segunda etapa do ensino fundamental: as regularidades e as exceções do desempenho no Ideb. Estudos em Avaliação Educacional, São Paulo, n. 51, p. 58-81, Jan./Abr. 2012.
PADILHA, F. V. Q. et al. Qualidade e equidade no ensino fundamental público do Ceará. Cadernos Cenpec, São Paulo, v. 3, n.1, p. 81-110, jun. 2013.
PAIXÃO, M.; ROSSETTO, I.; CARVANO, L. M. Desigualdades de cor ou raça no sistema de ensino brasileiro. In: DEL POPOLO et al (Coord.). Pueblos indígenas y afrodescendientes en América Latina: dinámicas poblacionales diversas y desafíos comunes. Rio de Janeiro: ALAP Editor, 2011. (Serie Investigaciones, 12). p. 177-202.
PASTORE, J. Desigualdade e mobilidade social no Brasil. São Paulo: Editora da Universidade de São Paulo, 1979.
PASTORE, J.; SILVA, N. do V. Mobilidade social no Brasil. São Paulo: Markron. 2000.
PEIXOTO, M. C. L.; BRAGA, M. M. Censo socioeconômico e étnico dos estudantes de graduação da UFMG. Belo Horizonte: UFMG, 2006.
RAUDENBUSH, S. W.; BRYK, A. S. Hierarchical linear models: applications and data analysis methods. 2. ed. Newbury Park, California: Sage Publications, Inc, 2002.
RAUDENBUSH, S. W. et al. HLM 7: hierarchical linear and nonlinear modeling. Lincolnwood, IL: Scientific Software International, Inc, 2011.
REYNOLDS, D. School effectiveness and school improvement: an upddated review of the British literature. In: REYNOLDS, D. (Ed.). School effectiveness. Londres: Cassell, 1996.
ROCHA, E. J.; ROSEMBERG, F. Autodeclaração de cor e/ou raça entre escolares paulistanos(as). Cadernos de Pesquisa, São Paulo, v. 37, n. 132, p. 759-799, 2007.
SAMEJIMA, F. Estimation of latentability using a response pattern of graded responses. Iowa: Psychometric Society, 1969. (Psychometric monograph, 17).
SAMMONS, P.; HILLMAN, J.; MORTIMORE, P. Key characteristics of effective schools: a review of school effectiveness research. London: International School Effectiveness & Improvement Center; Institute of Education. University of London, Apr. 1995. p. 35.
SOARES, J. F.; ALVES, M. T. G. Contextualização dos resultados das escolas de ensino fundamental. Revista Retratos da Escola, Brasília, v. 7, n. 12, p. 145-158, 2013. Available at: <http//www.esforce.org.br>.
SOARES, J. F.; ALVES, M. T. G. Desigualdades raciais no sistema brasileiro de educação básica. Educação e Pesquisa, v. 29, n. 1, p. 147-165, 2003.
SOARES, J. F. et al. Exclusão intraescolar nas escolas públicas brasileiras: um estudo com dados da Prova Brasil 2005, 2007 e 2009. Brasília: UNESCO, 2012. (Série debates Ed).
SOARES, J. F. Índice de desenvolvimento da educação de São Paulo: IDESP. São Paulo em Perspectiva, v. 23, n. 1, 29-41, 2009.
100
SÉRI
E D
ebat
es E
D

SOARES, J. F. Measuring cognitive achievement gaps and inequalities. International Journal of Educational Research, v. 45, n. 3, p. 176-187, 2006.
SOARES, J. F. Melhoria do desempenho cognitivo dos alunos do ensino fundamental. Cadernos de Pesquisa, v. 37, p.135-160. 2007.
SOARES, J. F. XAVIER, F. P. Pressupostos educacionais e estatísticos do IDEB. Educação e Sociedade, v. 34, n. 124, p. 903-924, 2013.
SOARES NETO, J. J. et al. Uma escala para medir a infraestrutura escolar. Estudos em Avaliação Educacional, São Paulo, v. 24, n. 54, p. 78-99, 2013.
SOARES, M. B. Letramento: um tema em três gêneros. Autêntica: Belo Horizonte. 1999.
SOARES, R. M. Classificação racial e desempenho escolar. 2006. Dissertação (Mestrado) – Universidade Federal de Minas Gerais, Belo Horizonte.
TODOS PELA EDUCAÇÃO. De olho nas metas 2013-14. São Paulo: Ed. Moderna, 2015.
UNESCO. Declaração de Incheon: Educação 2030: rumo a uma educação de qualidade inclusiva e equitativa e à educação ao longo da vida para todos. Paris, 2015. Available at: <http://unesdoc.unesco.org/images/0023/002331/233137POR.pdf>.
UNESCO. Declaração Mundial sobre Educação para Todos: satisfação das necessidades básicas de aprendizagem, Jomtien. Paris, 1990. Available at: <http://unesdoc.unesco.org/images/0008/000862/086291por.pdf>.
UNESCO. Educação para todos: o compromisso de Dakar. Paris, 2000. Available at: <http://unesdoc.unesco.org/images/0012/001275/127509porb.pdf>.
UNICEF. Convenção sobre os Direitos da Criança. Nova York, 20 Nov. 1989. Available at: <http://www.unicef.org/brazil/pt/resources_10120.htm>.
Willms, J. D. Monitoring school performance: a guide for educators. Washington, DC; London: The Falmer Press, 1992.
101
SÉRI
E D
ebat
es E
D

A P P E N D I X E S
Appendix A: Register of items that constitute each student factor and school factors
The following tables summarize the final
items that remained in the factors after the
statistical analyses were done to validate the
constructs. Each of the tables contain: the
variable name assigned to the database by
the authors; the item’s label (question from
the questionnaire); an indication of which of
the questionnaires the item was drawn from
(student, school, principal or teacher); and the
presence of the item in SAEB editions from
2007 to 2013. Recalling that, after making an
estimate of the factors, the database used in
the analyses presented in this study refers only
to cases of students and public schools from
Prova Brasil.
Chart A1 – Variables of the socioeconomic status (SES) factor of students
Variable Label Questionnaire 2007 2009 2011 2013
AlfamaeDoes your mother or female guardian know how to read and write?
Student X X X X
AlfapaiDoes your father or male guardian know how to read and write?
Student X X X X
Aspirador Do you have a vacuum cleaner at your house? Student X - - -Automovel Do you have a car at home? Student X X X XBanheiro Do you have a bathroom in your house? Student X X X XComputador Do you have a computer at your house? Student X X X XEmpregada Do you have a housekeeper? Student X X X X
EscolamaeUp to what grade did your mother or female guardian study?
Student X X X X
EscolapaiUp to what grade did your father or male guardian study?
Student X X X X
FreezerDoes your home have a freezer separate from the refrigerator?
Student X X X X
G_duplexDoes your home have a freezer that is part of the refrigerator?
Student X X X X
Geladeira Does your home have a refrigerator? Student X X X XMaquina Does your home have a washing machine? Student X X X XRadio Does your home have a radio? Student X X X XTv Does your home have a television? Student X X X XVideo_dvd Does your home have a VCR or DVD player? Student X X X X
Note: For the estimation of this factor, data from ENEM 2011, 2012 and 2013 was used.
102
SÉRI
E D
ebat
es E
D

Chart A2 – Variables of the reading habits factor
Variable Label Questionnaire 2007 2009 2011 2013
mae_LêDo you ever see your mother or female guardian reading?
Student X X X X
pai_LêDo you ever see your father or male guardian reading?
Student X X X X
le_livros Do you generally read books? Student - - X Xle_livrosinf Do you generally read magazines? Student - - X -le_gibis Do you read comic books? Student - - X X
Chart A3 – Variables of the parent involvement factor
Variable Label Questionnaire 2007 2009 2011 2013
incenEst Do your parents or guardians encourage you to study? Student X X X X
incentDeverDo your parents or guardians encourage you to do your homework and/or school work?
Student X X X X
incentLerDo your parents or guardians encourage you to read?
Student X X X X
incentFreqDo your parents or guardians encourage you to go to school and/or to not miss any classes?
Student X X X X
conversamDo your parents or guardians speak to you about what happened in school?
Student X X X X
Chart A4 – Variables of the administrative leadership factor
Variable Label Questionnaire 2007 2009 2011 2013
insrecfin Is there a shortage of funding at the school? Principal X X X X
insadmIs there a shortage of administrative staff at the school?
Principal X X X X
insrecped Are there a lack of educational resources at the school? Principal X X X X
insrecfin2Has there been a case of a shortage of funding this year at the school?
Teacher X X X -
insadm2Has there been a case of a shortage in administrative staff this year at the school?
Teacher X X X -
insrecped2Has there been a case of a lack of educational resources this year at the school?
Teacher X X X -
Chart A5 – Variables of the pedagogical leadership factor
Variable Label Questionnaire 2007 2009 2011 2013
dirrespIndicate your level of agreement/disagreement with the following statement: I feel respected by the principal
Teacher X X X X
profresp [...]: I respect the principal Teacher - X - -
dirmotiv[...]: the principal encourages me and motivates me to work
Teacher X X X X
confdir[...]: I have full confidence in the principal as a professional
Teacher X X X X
dircompr[...]: the principal manages to get teachers who are committed to the school
Teacher - X - -
dirinova [...]: the principal encourages innovative activities Teacher X X X X
diraprend[...]: the principal gives special attention to issues related to students’ learning
Teacher X X X X 103
SÉRI
E D
ebat
es E
D

Chart A6 – Variables of the participative management factor
Variable Label Questionnaire 2007 2009 2011 2013
provimento You took charge of this school through: Principal X X X X
conselho_escolaHow many times has this school’s school board met this year?
Principal X X X X
prof_conselho Is the school board made up of teachers? Principal X X X -aluno_conselho Is the school board made up of students? Principal X X X -func_conselho Is the school board made up of school employees? Principal X X X -pais_conselho Is the school board made up of parents? Principal X X X -conselho_classe How often did the class councils of this school meet? Principal X X X X
desenv_pppWith respect to the existence of the educational policy project at the school
Principal X X X X
Chart A7 – Variables of the human resources factor
Variable Label Questionnaire 2007 2009 2011 2013
VinculoprofWhat is the percentage of teachers having a stable tie with this school?
Principal X X X X
InsprofHas there been a lack of teachers for some subjects or grades at the school?
Principal X X X X
FaltaprofHas there been a high rate of absenteeism among teachers at the school?
Principal X X X X
Rotativ Has there been a turnover in staff at the school? Principal X X X X
Insprof2Has there been a lack of teachers for some subjects and grades?
Teacher X X X -
insapped Has there been a lack of educational support staff? Teacher X X X -
faltaprof2Has there been a high rate of absenteeism among teachers?
Teacher X X X -
Chart A8 – Discriminant variables on the school principal’s education (not a factor)
Variable Label Questionnaire 2007 2009 2011 2013
escol_dirMark the best option that describes your highest level of education up to graduation
Principal X X X X
titulacao_dirIndicate the type of post-graduate courses from higher degress that you have
Principal X X X X
formcont_dirHave you participated in any continuing education activities over the last two years?
Principal X X X X
104
SÉRI
E D
ebat
es E
D

Chart A9 – Variables of the school principal’s experience factor
Variable Label Questionnaire 2007 2009 2011 2013
ExperProf_13 How long had you worked as a teacher before becoming a principal?
Principal - - - X
ExperEduc How many years have you worked in education? Principal X X X X
Senioridade How many years have you been a principal of this school?
Principal X X X X
ExperFuncao How many years have you performed school direction functions?
Principal X X X X
Chart A10 – Variables of the cohesion of the educational team factor
Variable Label Questionnaire 2007 2009 2011 2013
part_decis I participate in decisions related to my job Teacher X X X X
equip_ideiaThe teaching staff takes my ideas into consideration
Teacher X X X X
respideia_07_11I take ideas by other colleagues into consideration
Teacher X X X -
Proftrocaid_07_11The teaching that the school offers students is greatly influenced by an exchange of ideas between teachers
Teacher X X X -
Colaboram_07_11The principal, teachers and other members of the school staff collaborate for the school to operate well
Teacher X X X -
Chart A11 – Variables of the school operating conditions factor
Variable Label Questionnaire 2007 2009 2011 2013
interrupativHas there been a disruption of school activities at the school?
Principal X X X X
FaltaalunHas there been a high rate of student absenteeism at the school?
Principal X X X X
probdiscipHave there been disciplinary problems caused by students at the school?
Principal X X X X
faltaalun2Has there been a high rate of student absenteeism by at the school?
Teacher X X X -
probdiscip2Have there been disciplinary problems caused by students at the school?
Teacher X X X -
Chart A12 – Variables of the intervention condition for improvements factor
Variable Label Questionnaire 2007 2009 2011 2013
reducao_abandonoIs there some program for reducing dropout rates in this school?
Principal X X X X
reducao_reprovacaoIs there some program for reducing failure rates in this school?
Principal X X X X
aprendizagemDoes this school regularly develop a program of support or tutoring of for student learning (monitoring, tutoring etc.)?
Principal X X X X
discussao_professoresHow often do you discuss activities for improving teaching and student learning with teachers?
Principal - - - X
Profintcont_07_11Agreement by teachers with “teachers try to coordinate the subject content between the different grades.”
Teacher X X X -
105
SÉRI
E D
ebat
es E
D

Table A13 – Variables of the school violence factor
Variable Label Questionnaire 2007 2009 2011 2013
V1comarmfogThis year, the following events were or were not part of the daily life of this school: members of the school community carrying firearms.
Principal X X X X
V2comarmbran
This year, the following events were or were not part of the daily life of this school: members of the school community carrying weapons (knife, pocket knife, stiletto, etc.).
Principal X X X X
V3gangextThis year, the following events were or were not part of the daily life of this school: gang activity on the outer premises of the school.
Principal X X X
V4gangintThis year, the following events were or were not part of the daily life of this school: gang activity within the school.
Principal X X X -
V5agvprof_alunThis year, was there verbal aggression towards teachers. Who was the aggressor? Student
Principal X X X -
V6agvprof_profThis year, was there verbal aggression towards teachers. Who was the aggressor? Teacher
Principal X X X -
V7agvprof_funcThis year, was there verbal aggression towards teachers. Who was the aggressor? School employee
Principal X X X -
V7_1agrfprof_alunThis year, was there physical violence towards teachers. Who was the aggressor? Student
Principal X X X -
V8agrfprof_profThis year, was there physical violence towards teachers. Who was the aggressor? Teacher
Principal X X X -
V9agrfprof_funcThis year, was there physical violence towards teachers. Who was the aggressor? School employee
Principal X X X -
V10agvalun_alunThis year, was there verbal aggression towards students. Who was the aggressor? Student
Principal X X X -
V12agvalun_profThis year, was there verbal aggression towards students. Who was the aggressor? Teacher
Principal X X X -
V13agvalun_funcThis year, was there verbal aggression towards students. Who was the aggressor? School employee
Principal X X X -
V14agfalun_alunThis year, was there physical aggression towards students. Who was the aggressor? Student
Principal X X X -
V15agfalun_profThis year, was there physical aggression towards students. Who was the aggressor? Teacher
Principal X X X -
V16agfalun_funcThis year, was there physical aggression towards students. Who was the aggressor? School employee
Principal X X X -
V17agvfunc_alunThis year, was there verbal aggression towards school employees. Who was the aggressor? Student
Principal X X X -
V18agvfunc_profThis year, was there verbal aggression towards school employees. Who was the aggressor? Teacher
Principal X X X -
V19agvfunc_funcThis year, was there verbal aggression towards school employees. Who was the aggressor? School
Principal X X X -
V20agffunc_alunThis year, was there physical aggression towards school employees. Who was the aggressor? Student
Principal X X X -
V21agffunc_profThis year, was there verbal aggression towards school employees. Who was the aggressor? Teacher
Principal X X X -
V22agffunc_funcThis year, was there verbal aggression towards school employees. Who was the aggressor? School
Principal X X X -
V23Atentprof_extThis year, was there an attempt on the life of teachers or employees within the school (caused by an external agent)?
Principal X X X -
V24Atentprof_intThis year, was there an attempt on the life of teachers or employees within the school (caused by an internal agent)?
Principal X X X -
106
SÉRI
E D
ebat
es E
D

Continue
Variable Label Questionnaire 2007 2009 2011 2013
V25Atentalun_extThis year, was there an attempt on the life of students within the school (caused by an external agent)?
Principal X X X -
V26Atentalun_intThis year, was there an attempt on the life of teachers or employees within the school (caused by an internal agent)?
Principal X X X -
V27Furtoprof_extThis year, was there: a robbery of teachers or employees within the school (caused by an external agent)?
Principal X X X -
V28Furtoprof_intThis year, was there: a robbery of teachers or employees within the school (caused by an internal agent)?
Principal X X X -
V29Furtoalun_extThis year, was there: a robbery of students within the school (caused by an external agent)?
Principal X X X -
V30Furtoalun_intThis year, was there: a theft against students within the school (caused by an internal agent)?
Principal X X X -
V31Rouboprof_extThis year, was there: a robbery (with use of violence) against teachers and employees within the school (caused by an external agent)?
Principal X X X -
V32Rouboprof_intThis year, was there: a robbery (with use of violence) against teachers and employees within the school (caused by an internal agent)?
Principal X X X -
V33Rouboalun_extThis year, was there: a robbery (with use of violence) against students within the school (caused by an external agent)?
Principal X X X -
V34Rouboalun_intThis year, was there: a robbery (with use of violence) against students within the school (caused by an internal agent)?
Principal X X X -
V35Furtoequi_extThis year, was there: a theft of equipment and teaching or educational materials from the school (caused by an external agent)?
Principal X X X -
V36Furtoequi_intThis year, was there: a theft of equipment and teaching or educational materials from the school (caused by an internal agent)?
Principal X X X -
V37Roubomateriais_ext
This year, was there: a robbery (with the use of violence) of equipment and teaching or educational materials from the school (caused by an external agent)?
Principal X X X -
V38Roubomateriais_int
This year, was there: a robbery (with the use of violence) of equipment and teaching or educational materials from the school (caused by an internal agent)?
Principal X X X -
Chart A14 – Variables of the use of teaching resources factor - ICT
Variable Label Questionnaire 2007 2009 2011 2013
Utcomp Do you use a computer in this school? Teacher X X X Utintern Do you use the internet in this class? Teacher X X X XUtdvd Do you use DVDs in this school? Teacher X X X XUtretro Do you use an overhead projector in this school? Teacher X X - Utxerox Do you use a xerox machine in this school? Teacher X X - X
UtprojslideDo you use a slide projector for educational purposes?
Professor - X - X
107
SÉRI
E D
ebat
es E
D

Chart A15 – Variables of the printed resources factor
Variable Label Questionnaire 2007 2009 2011 2013
UtjornIndicate whether you do or do not use in this school: newspapers and news magazines
Teacher X X X X
Utlivrocons [...]: teachers’ reference books Teacher - - X XUtlivroleit [...]: literature books in general Teacher X - X XUtlivrodid [...]: text books Teacher X X X -Uthq [...]: comic books Teacher X X X -
Chart A16 – Variables of the educational resources factor – Portuguese
Variable Label Questionnaire 2007 2009 2011 2013
ConjornThe activities involving (Portuguese language) that you do with students has allowed them: to talk about articles from newspapers and magazines
Teacher X X X X
Projtem[...]: to read, discuss with colleagues and write papers related to the development of a thematic project
Teacher X X X -
Conlit [...]: to talk about short stories, essays, poems and novels Teacher X X X XCopiar [...]: to copy text from the textbook or blackboard Teacher X X X
Exgram[...]: to do grammar exercises related to newspapers and magazines
Teacher X X X X
autgram [...]: to automate the use of grammatical rules Teacher X X - -
Gramlit[...]: to use short stories, essays, poems and novels to exercise aspects of grammar
Teacher X X X X
Fixconc[...]: to establish the names of grammatical and linguistic concepts
Teacher X X X X
Chart A17 – Variables of the educational resources factor - Mathematics
Variable Label Questionnaire 2007 2009 2011 2013
autoprocThe activities involving (Mathematics) that you do with students has allowed them: to do exercises to automate procedures
Teacher X X X X
promcomp[...]: to deal with problems that require distinct and more complex reasoning than most of the usual examples
Teacher X X X -
gravreg[...]: to memorize the rules for obtaining the right answers for calculations and problems
Teacher X X X -
intnum[...]: to interpret numerical results to get a suitable response to the problem
Teacher X X X -
difmod[...]: to try different ways to solve a problem or perform a calculation
Teacher X X X X
velo[...]: to improve the precision and speed of carrying out calculations
Teacher X X - -
difac [...]: to try different actions to solve problems Teacher X X X X
camsolo[...]: to talk about solutions, discussing the ways used to find them
Teacher X X X -
jornmat[...]: to deal with themes that appear in newspapers and/or magazines, discussing the relationship of themes with Mathematics
Teacher X X X X
Sitfam[...]: to deal with situations that are familiar and that present interesting themes to students
Teacher X X X -
108
SÉRI
E D
ebat
es E
D

Chart A18 – Variables of the school curriculum factor
Variable Label Questionnaire 2007 2009 2011 2013
inadeq_curric
Give your position considering the situation of students from the grades evaluated: they are related to the curriculum contents, which are inadequate to students’ needs.
Teacher X X X X
descumpri_curric[...]: are related to non-compliance of the curriculum content (2007 to 2011)/ in the students’ trajectory (2013).
Teacher X X X X
desenvolv_curricHow much of the planned content did you develop with the students from the evaluated groups this year?
Teacher X X X X
Chart A19 – Variables of the teacher’s experience factor
Variable Label Questionnaire 2007 2009 2011 2013
ExperFunçaoProfHow many years have you worked as a teacher?
Teacher X X X X
SenioridadeProfHow many years have you worked at this school?
Teacher X X X X
ExperSerieHow long have you given classes for students of the grade/ class level you now teach?
Teacher X X X X
Chart A20 – Discriminant variable of teacher’s initial training (not a factor)
Variable Label Questionnaire 2007 2009 2011 2013
escol_prof Maximum level of education up to graduation Teacher X X X X
Chart A21 – Variables of the facilities factor
Variable Label Questionnaire 2007 2009 2011 2013
quadras Is there a gymnasium? School X X X Xlab Is there a lab? School X X X Xauditorio Is there an auditorium? School X X X Xsala_music Is there a music room? School X X X Xsala_art Is there an art room? School X X X X
109
SÉRI
E D
ebat
es E
D

Chart A22 – Variables of the library factor
Variable Label Questionnaire 2007 2009 2011 2013
FreqbiblioWhat percentage of students use the library throughout the month?
School X X X X
Respbib Is there a person in charge of the library? School X X X X
ProfbibDo teachers do work in the library, making use of the materials available?
School X X X X
aluno_livro Do students take books home with them? School X X X Xprof_livro Do teachers take books home with them? School X X X X
comu_livroDo members of the community take books home with them?
School X X X X
Livest Maintenance conditions of study books School X X X XLivlit Maintenance conditions of literature books School X X X X
RevistasMaintenance conditions of general information magazines
School X X X X
Jornais Maintenance conditions of newspapers School X X X XRevqua Maintenance conditions of comic books School X X X X
Chart A23 – Variables of the equipment factor
Variable Label Questionnaire 2007 2009 2011 2013
pcaluno Are there computers for student to use? School X X X Xpcnetaluno Is there internet access for student to use? School X X X Xpcprof Are there computers for teachers to use? School X X X Xpcnetprof Is there internet access for teachers to use? School X X X X
PcadmAre there computers for the exclusive use of the administration?
School X X X X
dvdeduc Are there video tapes or DVDs (educational)? School X X X Xdvdlazer Are there videotapes or DVDs (leisure)? School X X X XXerox Is there a xerox machine? School X X X Ximpressora Is there a printer? School X X X Xretroprojetor Is there an overhead projector? School X X X XProjetor Is there a slide projector? School X X X XDvd Are there a VCR or DVD player? School X X X XTv Is there a television? School X X X Xantena Is there a satellite dish? School X X X Xlinhatelefonica Is there a telephone line? School X X X Xsom Is there a stereo system? School X X X X
110
SÉRI
E D
ebat
es E
D

Chart A24 – Variables of the school building maintenance factor
Variable Label Questionnaire 2007 2009 2011 2013
Telhado State of the maintenance of the roof School X X X -parede State of the maintenance of the walls School X X X -piso State of the maintenance of the floors School X X X -entrada State of the maintenance of the building entrance School X X X -patio State of the maintenance of the courtyard School X X X -corredor State of the maintenance of the coredors School X X X -Sala State of the maintenance of the classrooms School X X X -portas State of the maintenance of the doors School X X X -janelas State of the maintenance of the windows School X X X -banheiros State of the maintenance of the bathrooms School X X X -Cozinha State of the maintenance of the kitchen School X X X -insthidra State of the maintenance of the hydraulic systems School X X X -insteletrica State of the maintenance of the electrical systems School X X X -depban Bathroom depletion School X X - -depint Depletion of the school’s internal facilities School X X - -Depext Plundering of the school’s external facilities School X X - -iluminada_07_11 Is there lighting in the classrooms? (no; Yes) School X X - -arejada_07_11 Are the classrooms well ventilated? (no; yes) School X X X -
iluminada_13Is there lighting in the classrooms? (No, less than half, more than half; all)
School - - - X
arejada_13Are the classrooms well ventilated? (No, less than half, more than half; all)
School - - - X
sinaldepr_07_11 Does the school show any signs of depradation? (yes; no)
School X X X -
sinaldepr_13Does the school show any signs of depradation? (yes, many; yes, a bit; no)
School - - - X
pichint There is graffiti on the enclosures or walls of the school’s internal facilities
School X X - -
pichext There is graffiti on the enclosures or walls of the school’s external facilities
School X X - -
111
SÉRI
E D
ebat
es E
D

Appendix B: Equations for the multinomial hierarchical regression models
Equation for the basic model 1 – Reading
Level 1
Prob[NLEITURA(1) = 1|βj] = ϕ1ij Prob[NLEITURA(2) = 1|βj] = ϕ2ij Prob[NLEITURA(3) = 1|βj] = ϕ3ij = 1 – ϕ1ij – ϕ2ij log[ϕ1ij/ϕ3ij] = β0j(1) + β1j(1)*(SEXOij) + β2j(1)*(AUSENTES_SEXOij) + β3j(1)*(PARDOij) + β4j(1)*(PRETOij) + β5j(1)*(OUTROSij) + β6j(1)*(ATRASOij) + β7j(1)*(NSEij) + β8j(1)*(ENVOLVIMENTO PAISij) + β9j(1)*(HÁBITOS LEITURAij) log[ϕ2ij/ϕ3ij] = β0j(2) + β1j(2)*(SEXOij) + β2j(2)*(AUSENTES_SEXOij) + β3j(2)*(PARDOij) + β4j(2)*(PRETOij) + β5j(2)*(OUTROSij) + β6j(2)*(ATRASOij) + β7j(2)*(NSEij)) + β8j(2)*(ENVOLVIMENTO PAISij) + β9j(2)*(HÁBITOS LEITURAij)
Level 2
β0(1) = γ00(1) + γ01(1)*(MNSEj) + u0j(1) β1(1) = γ10(1) β2(1) = γ20(1) β3(1) = γ30(1) β4(1) = γ40(1) β5(1) = γ50(1) β6(1) = γ60(1) β7(1) = γ70(1) β7(1) = γ80(1) β7(1) = γ90(1)
β0(2) = γ00(2) + γ01(2)*(MNSEj) + u0j(2) β1(2) = γ10(2) β2(2) = γ20(2) β3(2) = γ30(2) β4(2) = γ40(2) β5(2) = γ50(2) β6(2) = γ60(2) β7(2) = γ70(2) β8(2) = γ80(2) β9(2) = γ90(2)
SES, PARENT INVOLVEMENT, READING HABITS and MNSE were centralized around the great average.
112
SÉRI
E D
ebat
es E
D

Equation for the basic model 2 – Mathematics
Level 1
Prob[NMATEMÁTICA (1) = 1|βj] = ϕ1ij Prob[NMATEMÁTICA (2) = 1|βj] = ϕ2ij Prob[NMATEMÁTICA (3) = 1|βj] = ϕ3ij = 1 – ϕ1ij – ϕ2ij log[ϕ1ij/ϕ3ij] = β0j(1) + β1j(1)*(SEXOij) + β2j(1)*(AUSENTES_SEXOij) + β3j(1)*(PARDOij) + β4j(1)*(PRETOij) + β5j(1)*(OUTROSij) + β6j(1)*(ATRASOij) + β7j(1)*(NSEij) + β8j(1)*(ENVOLVIMENTO PAISij) + β9j(1)*(HÁBITOS LEITURAij) log[ϕ2ij/ϕ3ij] = β0j(2) + β1j(2)*(SEXOij) + β2j(2)*(AUSENTES_SEXOij) + β3j(2)*(PARDOij) + β4j(2)*(PRETOij) + β5j(2)*(OUTROSij) + β6j(2)*(ATRASOij) + β7j(2)*(NSEij)) + β8j(2)*(ENVOLVIMENTO PAISij) + β9j(2)*(HÁBITOS LEITURAij)
Level 2
β0(1) = γ00(1) + γ01(1)*(MNSEj) + u0j(1) β1(1) = γ10(1) β2(1) = γ20(1) β3(1) = γ30(1) β4(1) = γ40(1) β5(1) = γ50(1) β6(1) = γ60(1) β7(1) = γ70(1) β7(1) = γ80(1) β7(1) = γ90(1)
β0(2) = γ00(2) + γ01(2)*(MNSEj) + u0j(2) β1(2) = γ10(2) β2(2) = γ20(2) β3(2) = γ30(2) β4(2) = γ40(2) β5(2) = γ50(2) β6(2) = γ60(2) β7(2) = γ70(2) β8(2) = γ80(2) β9(2) = γ90(2)
SES, PARENT INVOLVEMENT, READING HABITS and MNSE were centralized around the great average.
113
SÉRI
E D
ebat
es E
D

Equation for the extended model 1 – Reading
Level 1
Prob[NLEITURA(1) = 1|βj] = ϕ1ij Prob[NLEITURA(2) = 1|βj] = ϕ2ij Prob[NLEITURA(3) = 1|βj] = ϕ3ij = 1 – ϕ1ij – ϕ2ij log[ϕ1ij/ϕ3ij] = β0j(1) + β1j(1)*(SEXOij) + β2j(1)*(AUSENTES_SEXOij) + β3j(1)*(PARDOij) + β4j(1)*(PRETOij) + β5j(1)*(OUTROSij) + β6j(1)*(ATRASOij) + β7j(1)*(NSEij) + β8j(1)*(ENVOLVIMENTO PAISij) + β9j(1)*(HÁBITOS LEITURAij) + β10j(1)*(2009ij) + β11j(1)*(2011ij) + β12j(1)*(2013ij) + β13j(1)*(SERIEij) log[ϕ2ij/ϕ3ij] = β0j(2) + β1j(2)*(SEXOij) + β2j(2)*(AUSENTES_SEXOij) + β3j(2)*(PARDOij) + β4j(2)*(PRETOij) + β5j(2)*(OUTROSij) + β6j(2)*(ATRASOij) + β7j(2)*(NSEij)) + β8j(2)*(ENVOLVIMENTO PAISij) + β9j(2)*(HÁBITOS LEITURAij) + β10j(2)*(2009ij) + β11j(2)*(2011ij) + β12j(2)*(2013ij) + β13j(2)*(SERIEij)
Level 2
β0(1) = γ00(1) + γ01(1)*(MNSEj) + u0j(1) β1(1) = γ10(1) β2(1) = γ20(1) β3(1) = γ30(1) β4(1) = γ40(1) β5(1) = γ50(1) β6(1) = γ60(1) β7(1) = γ70(1) β8(1) = γ80(1) β9(1) = γ90(1) β10(1) = γ100(1) β11(1) = γ110(1) β12(1) = γ120(1) β13(1) = γ130(1)
β0(2) = γ00(2) + γ01(2)*(MNSEj) + u0j(2) β1(2) = γ10(2) β2(2) = γ20(2) β3(2) = γ30(2) β4(2) = γ40(2) β5(2) = γ50(2) β6(2) = γ60(2) β7(2) = γ70(2) β8(2) = γ80(2) β9(2) = γ90(2) β10(2) = γ100(2) β11(2) = γ110(2) β12(2) = γ120(2) β12(2) = γ130(2)
SES, PARENT INVOLVEMENT, READING HABITS and MNSE were centralized around the great average.
114
SÉRI
E D
ebat
es E
D

Equation for the extended model 2 – Mathematics
Level 1
Prob[NMATEMÁTICA (1) = 1|βj] = ϕ1ij Prob[NMATEMÁTICA (2) = 1|βj] = ϕ2ij Prob[NMATEMÁTICA (3) = 1|βj] = ϕ3ij = 1 – ϕ1ij – ϕ2ij log[ϕ1ij/ϕ3ij] = β0j(1) + β1j(1)*(SEXOij) + β2j(1)*(AUSENTES_SEXOij) + β3j(1)*(PARDOij) + β4j(1)*(PRETOij) + β5j(1)*(OUTROSij) + β6j(1)*(ATRASOij) + β7j(1)*(NSEij) + β8j(1)*(ENVOLVIMENTO PAISij) + β9j(1)*(HÁBITOS LEITURAij) + β10j(1)*(2009ij) + β11j(1)*(2011ij) + β12j(1)*(2013ij) + β13j(1)*(SERIEij) log[ϕ2ij/ϕ3ij] = β0j(2) + β1j(2)*(SEXOij) + β2j(2)*(AUSENTES_SEXOij) + β3j(2)*(PARDOij) + β4j(2)*(PRETOij) + β5j(2)*(OUTROSij) + β6j(2)*(ATRASOij) + β7j(2)*(NSEij)) + β8j(2)*(ENVOLVIMENTO PAISij) + β9j(2)*(HÁBITOS LEITURAij) + β10j(2)*(2009ij) + β11j(2)*(2011ij) + β12j(2)*(2013ij) + β13j(2)*(SERIEij)
Level 2
β0(1) = γ00(1) + γ01(1)*(MNSEj) + u0j(1) β1(1) = γ10(1) β2(1) = γ20(1) β3(1) = γ30(1) β4(1) = γ40(1) β5(1) = γ50(1) β6(1) = γ60(1) β7(1) = γ70(1) β8(1) = γ80(1) β9(1) = γ90(1) β10(1) = γ100(1) β11(1) = γ110(1) β12(1) = γ120(1) β13(1) = γ130(1)
β0(2) = γ00(2) + γ01(2)*(MNSEj) + u0j(2) β1(2) = γ10(2) β2(2) = γ20(2) β3(2) = γ30(2) β4(2) = γ40(2) β5(2) = γ50(2) β6(2) = γ60(2) β7(2) = γ70(2) β8(2) = γ80(2) β9(2) = γ90(2) β10(2) = γ100(2) β11(2) = γ110(2) β12(2) = γ120(2) β13(2) = γ130(2)
SES, PARENT INVOLVEMENT, READING HABITS and MNSE were centralized around the great average.
115
SÉRI
E D
ebat
es E
D

Appendix C: Average and standard deviation of effects 1 and 2 in Reading and Mathematics according to the Prova Brasil editions
Table C1 – Average and standard deviation of effects 1 and 2 in Reading and Mathematics according to the Prova Brasil editions
Prova Brasil Edition
Reading Mathematics
Effect 1 Effect 2 Effect 1 Effect 2
Average Standard deviation Average Standard
deviation Average Standard deviation Average Standard
deviation
2007 -0.087 0.394 -0.145 0.378 -0.060 0.435 -0.110 0.512
2009 0.079 0.421 0.060 0.419 0.061 0.461 0.073 0.551
2011 0.043 0.414 0.039 0.415 0.049 0.471 0.047 0.562
2013 -0.048 0.450 0.025 0.444 -0.060 0.478 -0.027 0.556
Source: Prepared with Prova Brasil data from 2007 to 2013.
116
SÉRI
E D
ebat
es E
D

www.unesco.org/brasilia SAUS Quadra 5 - Bloco H - Lote 6Ed. CNPq/IBICT/UNESCO - 9º andar70070-912 - Brasília - DF - BrasilTel.: + 55 (61) 2106 3500
United NationsEducational, Scientific and
Cultural Organization
BrasiliaOffice